Embed Size (px)
Citation preview

Regional Economic Prospects in EBRD Countries of Operations: May 20111
EBRD Office of the Chief Economist
Overview
Improving growth prospects amidst rising inflation and Eurozone debt concerns
Following a stronger than expected outturn for 2010, growth in the EBRD region is expected to be somewhat higher than anticipated in January, averaging 4.6 percent in 2011 before slowing marginally to 4.4 percent in 2012. However, better growth prospects are associated with stronger inflationary pressures as high global commodity prices combine with a recovery in domestic demand and in some cases sharply rising real incomes. Market concerns also persist over sovereign debt sustainability in parts of the Euro zone’s periphery. With the recovery in economic activity spreading, the large differences in growth performance across the region observed during 2009 and 2010 are continuing to narrow. Despite this convergence in growth rates, however, countries remain in vastly different stages of the recovery, with Central Asia, Eastern Europe and Turkey recovering to or above pre-crisis output levels while Central and South Eastern Europe are still below pre-crisis output levels (Chart 1). While the recovery was initially driven by net exports, it has by now – with few exceptions, such as Bulgaria, Croatia, Hungary – become predominantly domestic demand-driven. Initially, this reflected mainly the inventory cycle, but during the second half of 2010 investment and more recently consumption increasingly added growth momentum in many countries. The recoveries in Turkey and Poland are among the most advanced, with growth now chiefly driven by private consumption. Based on high-frequency indicators, growth in the first half of 2011 is likely to be somewhat stronger than previously projected in most countries.
Labour markets have bottomed out in many countries, first in some of the countries hit earliest by the financial crisis (Turkey, Russia, Kazakhstan, Ukraine) and later in the countries where the recovery has lagged (Baltics, Hungary, and some SEE countries). In a few countries, however, including Poland and
1 This document is provided as a companion to the EBRD’s growth forecasts for its countries of operations, which are released four times a year. For more comprehensive coverage of economic policies and structural changes, the reader is referred to the EBRD’s Transition Report 2010 as well as country strategies and updates and statistical series on economic and structural reform variables, which are all available on the EBRD’s website (www.ebrd.com).
1

Slovakia, unemployment rates remain elevated although employment is expanding.
Credit growth is increasingly recovering across the region; in February it was in or near the double digits in Albania, Poland, Russia, Serbia, Turkey, and all EEC countries except Ukraine. In contrast, in the Baltics, Hungary, Slovenia, and Romania where recoveries have so far been hesitant or have lagged, credit growth continues to be negative or weak, albeit often with an improving trend.
While Turkey and Poland experienced large capital inflows since the second half of 2009, non-FDI capital inflows (reflecting predominantly debt flows) returned to most other countries in the region only in late 2010 (Charts 2a, 2b). At the same time, the slowdown in inflows to emerging markets in Asia and Latin America since late 2010 has been less pronounced in the EBRD region and is unlikely to have dampened growth significantly.
Growth has been accompanied by increasing inflationary pressures across the region (Chart 3). By March 2011, year-on-year inflation had reached double-digits in Armenia, Belarus, Georgia, Serbia, and Tajikistan and was just under 10 percent in the commodity producers Russia, Azerbaijan, and Kazakhstan. In most other countries in the region, inflation has increased since end-2010 as high global commodity and food prices fed into domestic inflation. Core inflation has also picked up, except in countries where growth was weak in late 2010 (for example, Romania, Croatia and Hungary), or where exchange rates have stabilised after large depreciations in early 2010 (Moldova). Outlook and risks While growth is likely to remain reasonably strong at 4.6 percent in 2011 and slow only marginally to 4.4 percent in 2012, important downside risks remain. Commodity exporters in Central Asia and the Caucasus are expected to benefit from continued high oil and metals prices, with spillovers into regional trading partners’ growth. A slight upward revision in expected core Eurozone growth as well as the beginning of a self-sustaining recovery in domestic demand will support growth in many Central European and Baltic countries as well as in Turkey. The growth momentum from these factors will be tempered by monetary tightening through (un)orthodox measures if high inflation rates persist and by the crisis’ legacy of high unemployment rates despite some improvements in labour markets (Chart 4). Planned fiscal austerity measures will dampen growth in many countries, especially in south-eastern Europe, where in addition financial systems remain vulnerable to strains in Greek sovereign debt markets. Risks to the outlook remain tilted to the downside. Countries in the region face two different types of risks, depending on their underlying vulnerabilities:
Financial turmoil presents a significant contagion risk to countries with financial systems that are integrated into global financial markets and whose corporates depend heavily on external finance. The need for IMF/EU balance of payments support for Portugal and increasing market concerns about Greek sovereign debt
2

restructuring continue to highlight the fragility of Eurozone sovereign debt markets and banks exposed to them. Several of these have subsidiaries and/or exposures to Emerging Europe. If turmoil in sovereign debt markets – and closely linked financial institutions – disrupts financial markets more broadly the recovery in central and south-eastern Europe would stall.
Rising commodity prices challenge policy makers in countries with modest per
capita incomes, especially in Eastern Europe, Russia, and Central Asia. As high commodity prices pass through into high and rising inflation, they may provoke political pressures to introduce fiscal measures offsetting the impact of inflation on households. Pressures from nominal wage growth – in double digits in Russia, and other CIS countries – may feed into core inflation and weaken competitiveness with key trading partners in and close to the EU.
Given the region’s deep integration in trade networks and commodity markets, it also remains exposed to a broad-based downturn in the global economy which could, e.g., stem from monetary tightening in the Eurozone and the US. In response to rising inflation in the Eurozone, the ECB began raising the policy rate in April. While rate increases in the US are not yet widely expected, winding down the second round of quantitative easing by early summer will imply a monetary tightening. This could reduce emerging market liquidity generally. This in itself is unlikely to significantly dent growth in the region given the relatively small and late capital inflows into most countries, but, combined with fiscal tightening in advanced economies, it can slow growth in other major emerging markets, including China. Through trade and FDI networks and spillovers into commodity prices this would reduce growth in the EBRD region.
3

Chart 1a. Real GDP (Index 2008=100)
Chart 1b. Real GDP Growth 1/ (%)
90
100
110
2008 2009 2010
SEE CEBRussia TurkeyEEC CAM
-10-8-6-4-202468
10
Sep
09
Dec
09
Mar
10
Jun
10
Sep
10
Dec
10
Mar
11
Jun
11
Sep
11
Dec
11
90th percentile50th percentileBaseline
Chart 2a. Total Net Capital Flows (per cent of GDP)
Chart 2b. Non-FDI Net Capital Flows (per cent of GDP)
-1
-0.5
0
0.5
1
1.5
2
2.5
Q42008
Q12009
Q22009
Q32009
Q42009
Q12010
Q22010
Q32010
Q42010
Latin AmericaEmerging AsiaEBRD regionPoland and Turkey
-1.5
-1.0
-0.5
0.0
0.5
1.0
1.5
2.0
Q42008
Q12009
Q22009
Q32009
Q42009
Q12010
Q22010
Q32010
Q42010
Latin AmericaEmerging AsiaPoland and TurkeyRest of EBRD region
Source: CEIC database, Eurostat, IFS, Central Bank of Russia, and other national authorities.
Chart 3. Inflation (year-on-year, per cent)
Chart 4. Unemployment rates (average, per cent)
02468
101214
Dec
-08
Feb-
09Ap
r-09
Jun-
09A
ug-0
9O
ct-0
9D
ec-0
9Fe
b-10
Apr-
10Ju
n-10
Aug
-10
Oct
-10
Dec
-10
Feb-
11
% SEE incl. Croatia and TurkeyCEB excl. Czech RepublicEECRCA
Slovenia, Slovakia, Poland, Albania, Moldova, Armenia
56789
1011121314
Dec-07
Jun-08
Dec-08
Jun-09
Dec-09
Jun-10
Dec-10
Baltics, Hungary, Romania, Bulgaria, Croatia
Turkey, Russia, Ukraine, Kazakhstan
1/ Year-on-year growth in aggregate real GDP (2000 prices and exchange rates) of the new EU member states, Croatia, Armenia, Moldova, Georgia, Ukraine, Azerbaijan, Kazakhstan, and Russia. The fanchart is based on a Bayesian Vector Autoregression Model that is described in more detail in the Regional Economic Prospects May 2010. The baseline scenario assumes Eurozone real GDP growth of 1.6 per cent in 2011 and 1.8 per cent in 2012, a broadly constant VIX, a modest increase in Euribor and Libor, and an oil price or about $75-80 per barrel. The downside scenario assumes turmoil in financial markets similar to that prevailing during the sovereign debt crisis in the Eurozone in late Spring 2010, a resulting slowdown in Eurozone credit growth, another round of Eurozone fiscal tightening and therefore broadly flat real GDP in the Eurozone in 2011. Under the upside scenario, financial markets remain calm and the recovery abroad proceeds faster than projected.
4
Central Europe and the Baltic States (CEB)
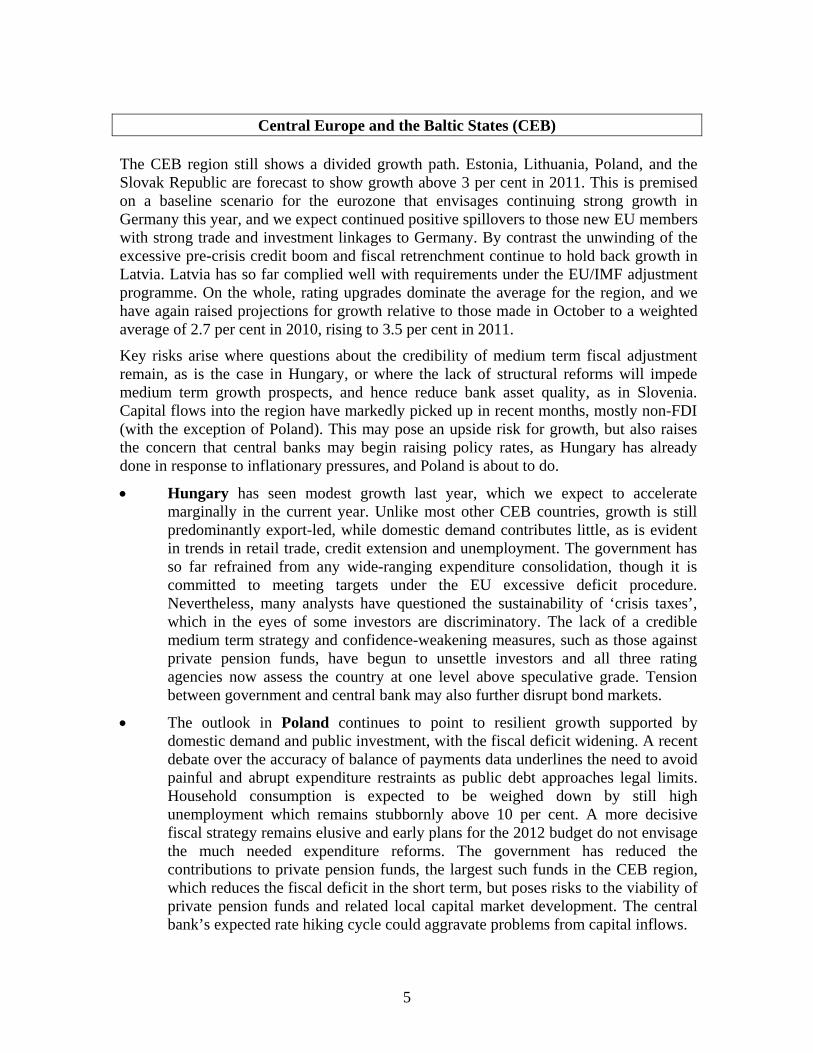
The CEB region still shows a divided growth path. Estonia, Lithuania, Poland, and the Slovak Republic are forecast to show growth above 3 per cent in 2011. This is premised on a baseline scenario for the eurozone that envisages continuing strong growth in Germany this year, and we expect continued positive spillovers to those new EU members with strong trade and investment linkages to Germany. By contrast the unwinding of the excessive pre-crisis credit boom and fiscal retrenchment continue to hold back growth in Latvia. Latvia has so far complied well with requirements under the EU/IMF adjustment programme. On the whole, rating upgrades dominate the average for the region, and we have again raised projections for growth relative to those made in October to a weighted average of 2.7 per cent in 2010, rising to 3.5 per cent in 2011.
Key risks arise where questions about the credibility of medium term fiscal adjustment remain, as is the case in Hungary, or where the lack of structural reforms will impede medium term growth prospects, and hence reduce bank asset quality, as in Slovenia. Capital flows into the region have markedly picked up in recent months, mostly non-FDI (with the exception of Poland). This may pose an upside risk for growth, but also raises the concern that central banks may begin raising policy rates, as Hungary has already done in response to inflationary pressures, and Poland is about to do.
• Hungary has seen modest growth last year, which we expect to accelerate marginally in the current year. Unlike most other CEB countries, growth is still predominantly export-led, while domestic demand contributes little, as is evident in trends in retail trade, credit extension and unemployment. The government has so far refrained from any wide-ranging expenditure consolidation, though it is committed to meeting targets under the EU excessive deficit procedure. Nevertheless, many analysts have questioned the sustainability of ‘crisis taxes’, which in the eyes of some investors are discriminatory. The lack of a credible medium term strategy and confidence-weakening measures, such as those against private pension funds, have begun to unsettle investors and all three rating agencies now assess the country at one level above speculative grade. Tension between government and central bank may also further disrupt bond markets.
• The outlook in Poland continues to point to resilient growth supported by domestic demand and public investment, with the fiscal deficit widening. A recent debate over the accuracy of balance of payments data underlines the need to avoid painful and abrupt expenditure restraints as public debt approaches legal limits. Household consumption is expected to be weighed down by still high unemployment which remains stubbornly above 10 per cent. A more decisive fiscal strategy remains elusive and early plans for the 2012 budget do not envisage the much needed expenditure reforms. The government has reduced the contributions to private pension funds, the largest such funds in the CEB region, which reduces the fiscal deficit in the short term, but poses risks to the viability of private pension funds and related local capital market development. The central bank’s expected rate hiking cycle could aggravate problems from capital inflows.
5

• The Slovak Republic is expected to continue benefiting from an export-led recovery with growth at about 4 per cent this year, and slightly more next year. The substantial fiscal consolidation package should arrest public debt accumulation, though the political resolve to implement reforms remains uncertain.
• All three Baltic economies will exceed our 2011 growth projections made in January, benefiting from the improved environment in the EU, as was again evident in much better than expected Q1 growth figures for Estonia and Lithuania. Foreign exchange risks are much diminished as Estonia adopted the euro in January 2011 and Latvia continues to perform well under the EU/IMF programme, supported by EBRD investment in the financial sector, and targets euro adoption in 2014. Lithuania has increasingly met financing needs in external capital markets, and will face a continued need to consolidate its public finances.
• Elsewhere in the region, vulnerabilities remain. Croatia’s economy remains stagnant, with GDP falling again last year, and the large level of private debt, mostly in unhedged foreign currency, is still a risk. However, the country could receive a major confidence boost this year if it can finalise EU accession negotiations. Slovenia experienced only modest growth in 2010. Given the poorly capitalised banking sector, and the lack of governance reform in the corporate sector, this is unlikely to change. Funding problems in the banking sector, and growing problems with loan quality remain the key problems as the government capacity to back stop the economy is increasingly constrained.
6
South-Eastern Europe (SEE) and Turkey
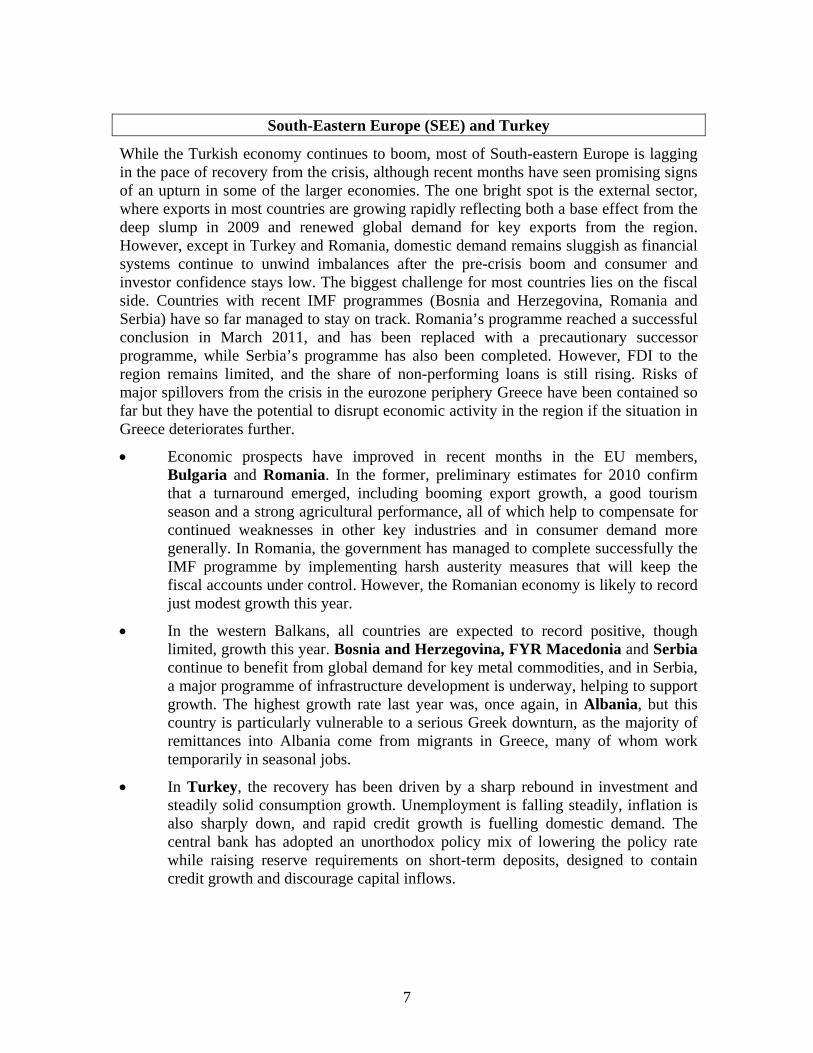
While the Turkish economy continues to boom, most of South-eastern Europe is lagging in the pace of recovery from the crisis, although recent months have seen promising signs of an upturn in some of the larger economies. The one bright spot is the external sector, where exports in most countries are growing rapidly reflecting both a base effect from the deep slump in 2009 and renewed global demand for key exports from the region. However, except in Turkey and Romania, domestic demand remains sluggish as financial systems continue to unwind imbalances after the pre-crisis boom and consumer and investor confidence stays low. The biggest challenge for most countries lies on the fiscal side. Countries with recent IMF programmes (Bosnia and Herzegovina, Romania and Serbia) have so far managed to stay on track. Romania’s programme reached a successful conclusion in March 2011, and has been replaced with a precautionary successor programme, while Serbia’s programme has also been completed. However, FDI to the region remains limited, and the share of non-performing loans is still rising. Risks of major spillovers from the crisis in the eurozone periphery Greece have been contained so far but they have the potential to disrupt economic activity in the region if the situation in Greece deteriorates further.
• Economic prospects have improved in recent months in the EU members, Bulgaria and Romania. In the former, preliminary estimates for 2010 confirm that a turnaround emerged, including booming export growth, a good tourism season and a strong agricultural performance, all of which help to compensate for continued weaknesses in other key industries and in consumer demand more generally. In Romania, the government has managed to complete successfully the IMF programme by implementing harsh austerity measures that will keep the fiscal accounts under control. However, the Romanian economy is likely to record just modest growth this year.
• In the western Balkans, all countries are expected to record positive, though limited, growth this year. Bosnia and Herzegovina, FYR Macedonia and Serbia continue to benefit from global demand for key metal commodities, and in Serbia, a major programme of infrastructure development is underway, helping to support growth. The highest growth rate last year was, once again, in Albania, but this country is particularly vulnerable to a serious Greek downturn, as the majority of remittances into Albania come from migrants in Greece, many of whom work temporarily in seasonal jobs.
• In Turkey, the recovery has been driven by a sharp rebound in investment and steadily solid consumption growth. Unemployment is falling steadily, inflation is also sharply down, and rapid credit growth is fuelling domestic demand. The central bank has adopted an unorthodox policy mix of lowering the policy rate while raising reserve requirements on short-term deposits, designed to contain credit growth and discourage capital inflows.
7
Eastern Europe and the Caucasus (EEC)
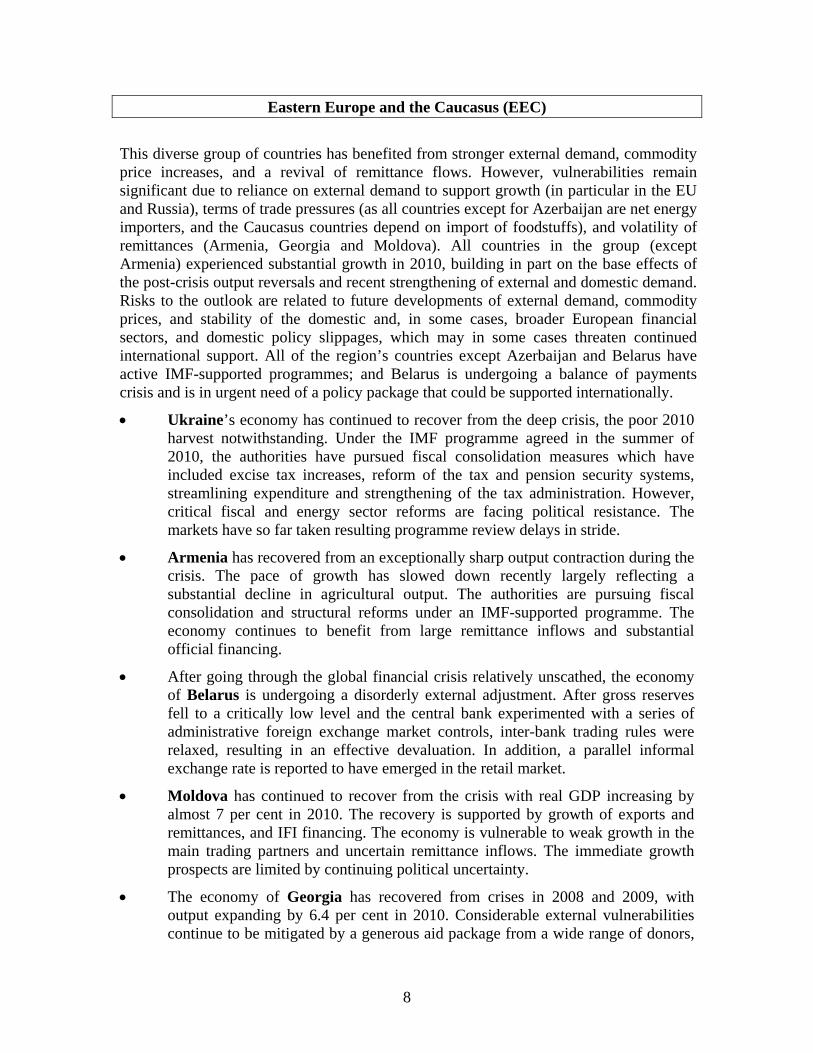
This diverse group of countries has benefited from stronger external demand, commodity price increases, and a revival of remittance flows. However, vulnerabilities remain significant due to reliance on external demand to support growth (in particular in the EU and Russia), terms of trade pressures (as all countries except for Azerbaijan are net energy importers, and the Caucasus countries depend on import of foodstuffs), and volatility of remittances (Armenia, Georgia and Moldova). All countries in the group (except Armenia) experienced substantial growth in 2010, building in part on the base effects of the post-crisis output reversals and recent strengthening of external and domestic demand. Risks to the outlook are related to future developments of external demand, commodity prices, and stability of the domestic and, in some cases, broader European financial sectors, and domestic policy slippages, which may in some cases threaten continued international support. All of the region’s countries except Azerbaijan and Belarus have active IMF-supported programmes; and Belarus is undergoing a balance of payments crisis and is in urgent need of a policy package that could be supported internationally.
• Ukraine’s economy has continued to recover from the deep crisis, the poor 2010 harvest notwithstanding. Under the IMF programme agreed in the summer of 2010, the authorities have pursued fiscal consolidation measures which have included excise tax increases, reform of the tax and pension security systems, streamlining expenditure and strengthening of the tax administration. However, critical fiscal and energy sector reforms are facing political resistance. The markets have so far taken resulting programme review delays in stride.
• Armenia has recovered from an exceptionally sharp output contraction during the crisis. The pace of growth has slowed down recently largely reflecting a substantial decline in agricultural output. The authorities are pursuing fiscal consolidation and structural reforms under an IMF-supported programme. The economy continues to benefit from large remittance inflows and substantial official financing.
• After going through the global financial crisis relatively unscathed, the economy of Belarus is undergoing a disorderly external adjustment. After gross reserves fell to a critically low level and the central bank experimented with a series of administrative foreign exchange market controls, inter-bank trading rules were relaxed, resulting in an effective devaluation. In addition, a parallel informal exchange rate is reported to have emerged in the retail market.
• Moldova has continued to recover from the crisis with real GDP increasing by almost 7 per cent in 2010. The recovery is supported by growth of exports and remittances, and IFI financing. The economy is vulnerable to weak growth in the main trading partners and uncertain remittance inflows. The immediate growth prospects are limited by continuing political uncertainty.
• The economy of Georgia has recovered from crises in 2008 and 2009, with output expanding by 6.4 per cent in 2010. Considerable external vulnerabilities continue to be mitigated by a generous aid package from a wide range of donors,
8

which has partly compensated for the decline of foreign direct investment. While the fraction of non-performing loans has decreased in recent months, the banking sector remains vulnerable. The authorities are pursuing further structural reforms to maintain the country’s business friendly image and strengthen investor confidence.
• Economic growth in Azerbaijan has slowed down as oil and gas production stabilised. The diversification of the economy remains important as risks associated with high oil dependence became apparent during the crisis, when oil prices declined. FDI inflows into the non-oil sector remain low. Immediate macroeconomic risks are mitigated by a very strong fiscal position.
9

Russia and Central Asia
Both the Russian and the Kazakh economies have been on a recovery path since the end of 2009, on the back of higher oil prices, large-scale fiscal stimulus packages and banking-system support. Private sector credit growth has resumed in Russia, while credit growth in Kazakhstan still remains stagnant due to the high level of nonperforming loans (NPLs) that remain to be written off or restructured. The outlook for growth in Russia and Kazakhstan is good, but remains highly dependent on oil and other commodity price developments, as well as on global sentiment affecting capital flows to emerging markets. Turkmenistan has also continued to grow strongly, driven by a recovery in gas exports and large foreign investments in the country’s hydrocarbon sector.
The economies of the Kyrgyz Republic, Tajikistan, and Uzbekistan remain dependent on remittances inflows and shock-prone sectors such as gold mining, agriculture, and hydroelectric power. In 2010, they benefited from the pick-up in remittances and rising commodity prices, although political instability led to a temporary drop in output in the Kyrgyz Republic.
As in most other EBRD countries, inflation in this region has increased rather rapidly, and is likely to increase further. The main determinants are higher international food and fuel prices, as well as large government spending packages driven by higher commodity export revenues or by political pressures.
• In Russia, the growth momentum picked up again after slowing in the 3rd quarter of 2010 when the economy was adversely affected by the heat wave, drought and forest fires. As a result, growth is likely to accelerate from 4 per cent in 2010 to 4.6 per cent in 2011 and 4.7 per cent in 2012. With real incomes increasing again and deleveraging largely completed, asset quality in the banking sector has stopped deteriorating and credit growth has gradually resumed. The medium-term budget would postpone depletion of the fiscal reserve fund until at least 2013, and higher oil prices will facilitate fiscal consolidation. But the eventual depletion of oil stabilisation funds remains a concern, in particular in light of the recently restated commitment to above-inflation indexation of social spending. This could make the economy and the currency more volatile in response to swings in commodity prices. Inflation accelerated to 10 per cent, and the Central Bank responded by raising its policy rate by 0.25 percentage points twice to 8.25 per cent in May.
• Economic growth in Kazakhstan picked up strongly from 1.2 per cent in 2009 to 7 per cent in 2010, driven by increasing oil production, associated services sector growth, and fiscal and monetary stimulus. However, credit to the economy is still not growing, in part because non-performing loans have not yet been resolved and remain stuck at around 25 per cent of total loans. Despite formally abolishing the exchange rate corridor in late February 2011, the NBK has intervened heavily to keep the exchange rate stable. While inflation remained within the NBK’s target range of 6-8 per cent in 2010 (reaching 7.8% y-o-y in December), it has increased to around 8.5 per cent in April 2011, and is expected to average 9.3 per cent during 2011. This is mostly driven by growing international food and energy
10

prices, as elsewhere in the region, but is also affected by fiscal and monetary stimulus. GDP growth is expected to remain strong this year and could reach 7 per cent again in 2011. While medium-term growth prospects are good, sustainable long-term growth requires diversification away from oil, less state interference, a more friendly business environment, and improvements in energy efficiency and renewable energy.
• The Kyrgyz Republic experienced a large drop in GDP (more than 10 per cent on a seasonally adjusted basis) during the second quarter of 2010 as a result of the political turmoil in April and subsequent ethnic violence in the South in June 2010. However, the economy started recovering in the second half of the year, driven by improved stability, higher gold prices and fiscal stimulus. This limited the overall GDP decline in 2010 to 1.4 per cent. Inflation has accelerated since the middle of 2010, driven by increasing food and fuel prices, and exceeded 20 per cent in April 2011. GDP growth is expected to pick up to 6.3 per cent in 2011, driven mostly by external factors, including stronger international demand, higher commodity prices, increased gold production, and growing remittances. Annual inflation is expected to remain high at around 20 per cent on average, but this is mostly due to higher global energy and food prices, the impact of which should wear off over time.
• In Tajikistan, economic growth is estimated at 6.5 per cent in 2010, and could increase slightly to 6.7 per cent in 2011, driven by aluminium production and rapidly growing remittances inflows supporting local demand. The economy remains sensitive to external shocks and economic growth in Russia.
• Turkmenistan experienced a buoyant economic expansion with GDP growth of 9.2 per cent in 2010, and economic growth in 2011 is expected to be around 10 per cent. This is mainly driven by ongoing large public construction projects and increased gas exports to China and Iran. Medium-term growth prospects are good, but the economy remains highly dependent on oil and gas.
• Seemingly unaffected by the crisis, Uzbekistan’s economy grew officially by 8.1 percent in 2009 and by 8.5 per cent in 2010. High growth is expected to continue, reflecting favourable external conditions (higher cotton prices and demand for Uzbek exports) and expansionary fiscal policies.
• Mongolia has continued to recover from the recession and a banking crisis in 2009, with GDP growth estimated at 6.1 per cent in 2010. Growth is expected to accelerate further to 9 per cent in 2011 and 12 per cent in 2012, reflecting record-high copper prices and substantial mining-related FDI inflows, which reached 26 per cent of GDP in 2010 and are expected to continue for a number of years. Procyclical fiscal policy has also been contributing to the boom.
11

Tables
Real GDP Growth (%)
2009 2010 2011 2012 2010Change Jan-
May 2011Change Jan-
May
Czech Republic 2 4 4 33 2 27 2 3Central Europe and the Baltic statesCroatia -6.0 -1.2 1.4 2.0 -1.3 0.1 2.0 -0.7Estonia -13.9 3.1 6.1 3.8 2.4 0.7 3.6 2.4Hungary -6.7 1.2 2.7 2.8 1.3 -0.1 2.0 0.7Latvia -18.0 -0.3 2.9 4.0 -0.1 -0.2 2.7 0.2Lithuania -14.7 1.3 6.5 3.5 0.7 0.6 2.5 4.0Poland 1.7 3.8 3.8 3.5 3.6 0.2 3.9 0.0Slovak Republic -4.8 4.0 3.7 4.1 4.0 0.1 3.7 0.0Slovenia -8.1 1.2 2.0 2.0 1.0 0.2 1.7 0.3Average 1,2 -2.9 2.7 3.5 3.3 2.5 0.2 3.2 0.3Average 1,2 -1.9 1.5 3.3South-eastern Europe Albania 3.9 3.9 3.0 3.3 3.8 0.2 2.6 0.4Bosnia and Herzegovina -2.8 0.9 2.0 2.5 0.8 0.1 2.2 -0.2Bulgaria -5.5 0.2 3.1 3.6 0.4 -0.2 2.6 0.5FYR Macedonia -0.9 0.7 2.5 3.1 0.8 -0.1 3.2 -0.8Montenegro -5.7 1.1 2.5 3.0 0.2 0.9 3.1 -0.6Romania -7.1 -1.3 1.8 3.8 -1.9 0.6 1.1 0.7Serbia -3.1 1.8 2.9 4.1 2.0 -0.2 3.0 -0.1Average 1 -5.4 -0.2 2.2 3.7 -0.4 0.2 1.9 0.3
Eastern Europe and the CaucasusArmenia -14.2 2.1 4.5 4.0 4.0 -1.9 4.5 0.1Azerbaijan 9.3 5.0 3.0 3.0 5.0 0.0 3.5 -0.5Belarus 0.2 7.6 3.0 3.5 7.6 0.0 4.0 -1.0Georgia -3.8 6.4 5.5 4.5 5.5 0.8 5.0 0.6Moldova -6.0 6.9 5.0 4.5 6.5 0.4 4.5 0.5Ukraine -14.8 4.2 4.5 4.5 4.5 -0.3 4.0 0.6Average 1 -6.3 5.1 4.0 4.0 5.3 -0.2 4.0 0.0
Turkey -4.8 8.9 6.0 4.5 8.0 1.0 5.0 1.1
Russia -7.8 4.0 4.6 4.7 4.0 0.0 4.6 0.0
Central AsiaKazakhstan 1.2 7.0 7.0 7.3 7.0 0.0 5.5 1.5Kyrgyz Republic 3.0 -1.4 6.3 6.0 -1.4 0.0 5.0 1.3Mongolia -1.6 6.1 9.0 12.0 6.1 0.0 9.0 0.0Tajikistan 3.4 6.5 6.7 5.0 6.5 0.0 6.7 0.1Turkmenistan 6.1 9.2 10.0 10.0 9.2 0.0 10.0 0.0Uzbekistan 8.1 8.5 8.5 8.0 8.5 0.0 8.5 0.0Average 1 2.9 7.3 7.6 7.7 7.2 0.1 6.6 1.0
All transition countriesAverage 1 -5.2 4.6 4.6 4.4 4.2 0.4 4.2 0.4
2 Weighted averages do not include the Czech Republic, for which EBRD no longer produces a forecast. With the Czech Republic included (using IMF May 2011 projections), the Central European and Baltic average would be -3.1 per cent in 2009, 2.6 per cent in 2010 and 3.1 per cent in 2011.
1 Weighted averages. The weights used for the growth rates are WEO estimates of nominal dollar-GDP lagged by one year. Weighted averages for January 2011 forecasts shown above might vary from weighted averages used at the time due to revisions in nominal GDP.
Current forecast
(In per cent; EBRD forecasts as of May 13, 2011)
EBRD Forecast in January 2011
Summary
12

Table 1. Transition Region: Vulnerability Indicators 1/
Bank dep.
Loans/ dep.
Country risk
Unem-ployment
03-May-11
Corp. HH Total (end 2010)
Private (end 2010)
Short term (remaining maturity)
GDP Short term debt
month of prosp. Imports
State-owned banks
Foreign owned banks
% of GDP Private sector, in %
(CDS spread, bps)
NPL in % June 2009
NPL in % Dec 2009
NPL in % latest % (latest avail.)
Central Europe and BalticsCroatia 51.3 30.6 37.8 72.8 40.0 99.3 85.2 32.2 12.9 21.3 66.1 … 111.5 4.1 91.0 60.3 117.4 252.3 ... ... ... 10.7Estonia 0.1 0.1 0.0 1.6 6.6 117.6 111.5 56.9 2.6 13.4 23.5 2.0 148.6 0.0 98.3 4.0 151.9 … 6.0 6.6 6.5 10.2Hungary 35.8 15.5 20.3 61.3 80.4 143.9 124.5 38.6 47.9 37.1 96.1 4.9 116.7 3.9 81.3 42.1 138.2 245.1 4.4 5.7 8.4 12.1Latvia 82.5 42.0 40.4 91.7 39.9 165.2 132.2 76.3 7.6 31.6 41.4 6.3 165.7 17.1 69.3 36.0 247.1 203.7 12.0 16.4 19.3 14.5Lithuania 44.4 23.3 21.1 74.3 38.7 85.7 56.0 39.0 7.2 19.7 50.4 2.8 92.0 0.0 91.5 39.6 150.6 … 11.3 19.3 19.2 17.1Poland 15.9 3.5 12.4 33.0 55.7 66.8 66.8 19.0 91.7 19.6 102.9 4.7 74.4 22.1 72.3 43.8 111.3 140.7 6.4 7.9 8.8 13.2Slovak Republic 9.3 8.9 0.4 0.7 42.0 14.7 9.8 46.2 0.7 0.9 1.9 0.1 84.1 0.9 91.6 … … 80.8 3.8 5.0 5.8 13.2Slovenia 4.6 1.1 3.5 5.5 37.2 133.7 65.7 25.3 0.9 2.0 7.8 0.3 145.9 16.7 29.5 52.5 159.5 … ... 2.2 6.9 12.3
South-Eastern EuropeAlbania 25.8 19.0 6.8 67.8 59.7 41.6 13.2 7.6 2.7 22.9 301.5 4.5 77.5 0.0 92.4 63.9 60.2 … 4.5 5.6 7.3 13.5Bosnia and Herzegovina … … … 72.3 36.9 54.6 30.4 9.0 3.4 20.3 224.1 3.6 86.7 0.8 94.5 33.8 158.9 … ... ... ... 43.1Bulgaria 43.9 34.3 9.6 61.0 18.0 102.3 94.4 38.8 16.7 35.0 90.1 5.8 103.7 2.4 84.0 … … 205.6 6.2 10.7 18.1 9.8FYR Macedonia 26.0 17.5 8.4 57.8 24.8 56.5 40.1 26.3 1.9 21.3 81.0 3.2 65.6 1.4 93.3 47.9 94.7 … ... ... ... 31.7Montenegro … … … … 44.1 100.2 … … 0.6 14.8 … 2.6 101.5 0.0 87.1 48.9 140.9 … 7.2 13.5 17.3 12.3Romania 25.3 12.6 12.7 63.3 35.2 74.2 51.2 23.2 45.6 28.2 121.6 7.2 61.3 7.9 84.3 33.6 118.4 230.3 8.3 11.9 16.4 7.3Serbia 34.5 22.5 11.9 71.4 44.0 81.6 58.0 17.8 13.4 34.6 193.8 7.0 65.3 16.0 75.3 … … … 12.1 10.8 ... 19.2
Eastern Europe and the Caucasus
Armenia 14.3 11.0 3.3 57.1 39.4 35.5 16.6 1.1 1.9 19.8 1884.2 4.9 42.7 0.0 63.6 15.2 170.6 … 10.2 4.8 ... 6.7Azerbaijan 7.5 … … 35.8 10.8 7.2 … … 6.9 12.7 … 5.0 33.8 43.4 9.3 11.9 … … 3.8 3.6 5.4 …Belarus 8.9 7.9 0.9 21.0 22.4 51.5 30.3 24.7 4.1 7.4 30.1 1.0 51.6 77.9 20.6 23.9 178.4 … 2.8 4.7 3.8 0.7Georgia 20.2 … … 74.3 39.1 61.2 27.5 13.9 2.3 20.0 144.4 3.7 46.1 0.0 89.1 28.4 106.8 … 18.8 17.8 12.5 …Moldova 14.3 13.1 1.2 42.8 29.8 67.4 44.6 32.4 1.8 30.5 94.3 4.0 66.1 12.8 41.0 30.6 97.1 … 10.5 16.4 17.4 7.5Ukraine 30.9 17.6 13.2 47.1 … 83.9 61.2 32.3 34.1 25.0 77.4 4.8 96.2 17.0 50.8 37.2 177.8 424.0 9.6 14.6 16.3 8.4
Turkey 13.5 … … 28.1 41.7 40.7 27.6 16.4 83.9 11.3 68.9 4.3 87.5 32.2 15.8 33.2 77.8 147.4 4.8 5.2 3.5 11.9
Russia 9.2 8.4 0.8 21.9 … 32.3 29.1 8.2 456.2 31.1 381.4 13.0 75.9 39.2 18.3 34.8 121.2 129.1 4.9 6.2 5.9 7.6
Central Asia …Kazakhstan 15.6 11.9 3.7 42.1 11.4 76.4 75.2 9.8 25.7 18.6 188.6 5.5 69.0 0.6 17.2 20.6 180.9 138.8 30.8 36.5 32.6 5.5Kyrgyz Republic 6.9 … … 55.8 63.0 68.3 11.1 7.2 1.6 34.9 484.0 3.8 29.3 9.9 72.0 16.0 77.4 … 8.7 8.2 ... …Mongolia … … … … … 40.8 5.8 … 1.6 25.6 … 3.2 66.0 3.2 41.9 … 77.0 … 11.6 17.4 ... 9.4Tajikistan 7.0 … … 30.9 36.7 53.6 19.1 0.6 0.5 9.1 1593.7 1.6 23.9 … … 13.6 186.9 … 47.5 46.9 42.3 2.2Turkmenistan … … … 20.1 7.4 7.4 0.0 0.3 … … … … 85.0 96.3 1.2 … … … ... ... ... …Uzbekistan … … … 31.3 10.0 14.7 5.3 1.2 11.2 28.8 2329.3 9.8 … … … … … … ... ... ... …
1/ National sources based on CEIC and IFS, unless stated otherwise.
2/ WEO May 2011
3/ End of 2008 for Belarus, Kyrgyz Republic, Serbia, Turkmenistan
* Euro adoption
Nonperforming loans
% FX credit in total lending
Share in total assets:
billions US$ (latest)
in percent of
Gross reserves /2
latestExternalGovernment
(end 2010)
(% GDP)
Total assets as share of
GDP
Domestic FX loans (latest) Public and External Debt 2/ Banking system
(% of GDP) (end of 2009)/3
Total pvt sector
of which
13

Table 1Transition Region: Annual indicators and projections
14

Table 2. Transition Region: Annual indicators and projections 1/ ca2
Forecast 2/ 3/ Forecast 3/ 3/ 3/ 3/ Forecast 3/ 3/ Forecast 3/
2009 2010 2011 2012 2009 2010 2011 2012 2010 2011 2010 2011 2010 2010 2010 2011 2010 2011
Central Europe and BalticsCroatia -6.0 -1.2 1.4 2.0 -4,6 -0,6 1.7 1.9 1.0 2.5 -5.3 -6.3 -3.2 107.1 -1.9 -3.6 2.7 3.7Estonia -13.9 3.1 6.1 3.8 -8.8 6.7 3.8 4.4 3.0 3.9 0.2 -1.0 0.4 14.4 3.6 3.3 6.2 4.1Hungary -6.7 1.2 2.7 2.8 -4.3 1.9 2.9 3.1 4.9 4.2 -4.1 3.9 0.0 180.0 1.6 1.5 -0.4 0.4Latvia -18.0 -0.3 2.9 4.0 -16.8 3.6 2.6 3.9 -1.1 3.5 -7.9 -5.3 -6.5 110.3 3.6 2.6 1.4 0.8Lithuania -14.7 1.3 6.5 3.5 -14.5 4.8 5.5 3.7 1.3 3.2 -7.6 -6.0 -5.9 112.6 1.8 -0.9 1.4 1.4Poland 1.7 3.8 3.8 3.5 3.5 4.0 3.2 3.3 2.7 3.9 -7.9 -5.7 -5.3 144.8 -3.3 -3.9 1.1 1.9Slovak Republic -4.8 4.0 3.7 4.1 -3.6 3.5 1.0 1.0 0.9 3.5 -8.2 -5.2 -6.7 133.7 -3.4 -2.8 1.8 2.4Slovenia -8.1 1.2 2.0 2.0 -5.7 2.1 0.4 0.3 1.8 2.0 -5.2 -4.8 -3.9 90.6 -1.2 -2.0 1.4 0.9
South-Eastern EuropeAlbania 3.9 3.9 3.0 3.3 -0.6 5.4 4.9 3.5 3.5 4.7 -3.7 -4.6 -0.3 231.0 -10.1 -11.2 6.8 5.5Bosnia and Herzegovina -2.8 0.9 2.0 2.5 … … … … 2.1 4.8 -4.3 -3.4 -3.6 81.8 -6.0 -6.0 1.2 1.2Bulgaria -5.5 0.2 3.1 3.6 -7.6 3.1 3.0 3.3 3.0 4.6 -3.6 -2.6 -2.9 54.9 -0.8 -1.5 3.4 4.0FYR Macedonia -0.9 0.7 2.5 3.1 1.1 2.3 0.6 4.2 1.6 4.3 -2.5 -2.5 -1.7 81.9 -2.8 -4.2 3.2 3.6Montenegro -5.7 1.1 2.5 3.0 … … … … 0.5 3.3 -3.8 -3.4 -2.8 104.5 -25.6 -24.5 17.9 15.4Romania -7.1 -1.3 1.8 3.8 -6.5 -0.6 3.1 3.3 6.1 6.3 -6.5 -4.4 -5.1 107.3 -4.2 -5.0 2.0 2.9Serbia -3.1 1.8 2.9 4.1 -1.7 1.7 4.4 3.9 5.9 10.7 -3.5 -3.3 -2.4 109.4 -7.1 -7.4 2.9 5.5
Eastern Europe and the CaucasusArmenia -14.2 2.1 4.5 4.0 -7.8 2.4 5.7 4.5 8.1 7.6 -4.9 -3.9 -4.0 190.8 -13.7 -12.4 8.1 8.1Azerbaijan 9.3 5.0 3.0 3.0 12.3 3.1 6.0 -1.9 5.7 9.1 13.6 16.9 13.7 24.4 27.7 28.4 0.1 0.0Belarus 0.2 7.6 3.0 3.5 1.7 10.3 -1.3 5.7 7.7 14.7 -1.8 -1.7 -1.2 53.5 -15.5 -15.7 2.3 3.0Georgia -3.8 6.4 5.5 4.5 0.0 6.0 4.5 4.5 7.1 11.4 -4.8 -2.3 -3.8 138.5 -9.8 -13.0 4.3 5.2Moldova -6.0 6.9 5.0 4.5 -6.5 9.0 2.0 7.7 7.5 6.6 -2.5 -1.9 -1.7 77.7 -10.9 -11.1 2.9 3.6Ukraine -14.8 4.2 4.5 4.5 -6.7 3.3 4.4 6.0 9.4 7.8 -5.8 -2.8 -4.1 ... -1.9 -3.6 4.2 3.9
Turkey -4.8 8.9 6.0 4.5 5.9 5.9 1.4 6.6 8.6 6.8 -2.6 -1.7 1.8 129.3 -6.5 -8.0 1.0 1.8
Russia -7.8 4.0 4.6 4.7 -2.9 5.0 3.3 5.0 6.9 9.6 -3.6 -1.6 -3.0 27.9 4.9 5.6 -0.2 0.6
Central AsiaKazakhstan 1.2 7.0 7.0 7.3 10.3 5.8 6.6 6.5 7.1 9.3 1.5 1.8 2.0 44.6 2.5 5.8 5.6 1.7Kyrgyz Republic 3.0 -1.4 6.3 6.0 5.2 0.1 2.1 7.0 8.0 19.9 -6.1 -8.4 -5.2 198.8 -7.4 -6.7 3.8 3.0Mongolia -1.6 6.1 9.0 12.0 3.8 5.7 8.9 13.6 10.1 11.0 1.2 -2.7 1.9 ... -15.2 -13.3 6.9 9.6Tajikistan 3.4 6.5 6.7 5.0 4.7 7.1 4.5 5.2 6.4 14.0 -3.0 -5.4 -2.5 158.3 2.2 -4.1 0.9 1.6Turkmenistan 6.1 9.2 10.0 10.0 … … … … 4.8 5.7 2.1 1.0 ... 40.5 -11.4 -4.7 14.0 9.6Uzbekistan 8.1 8.5 8.5 8.0 8.3 9.6 9.5 6.3 9.4 11.0 6.1 7.0 6.2 24.7 6.7 10.0 4.2 3.2
1/ EBRD data and projections unless otherwise stated2/ As of May 13, 2011.
3/ WEO May 2011
GG Debt/reven
ues
Net FDI
(% of GDP)
Current AccountInflation (average) Primary fiscal balance to
GDP
Fiscal Balance
(Gen. gov; % of GDP)
Forecast 2/
GDP Growth (average)
(year over year percent change)
GDP Growth (end year)
(Q4 over Q4 percent change)
Forecast 2/
(% of GDP)(year over year percent
change)
15
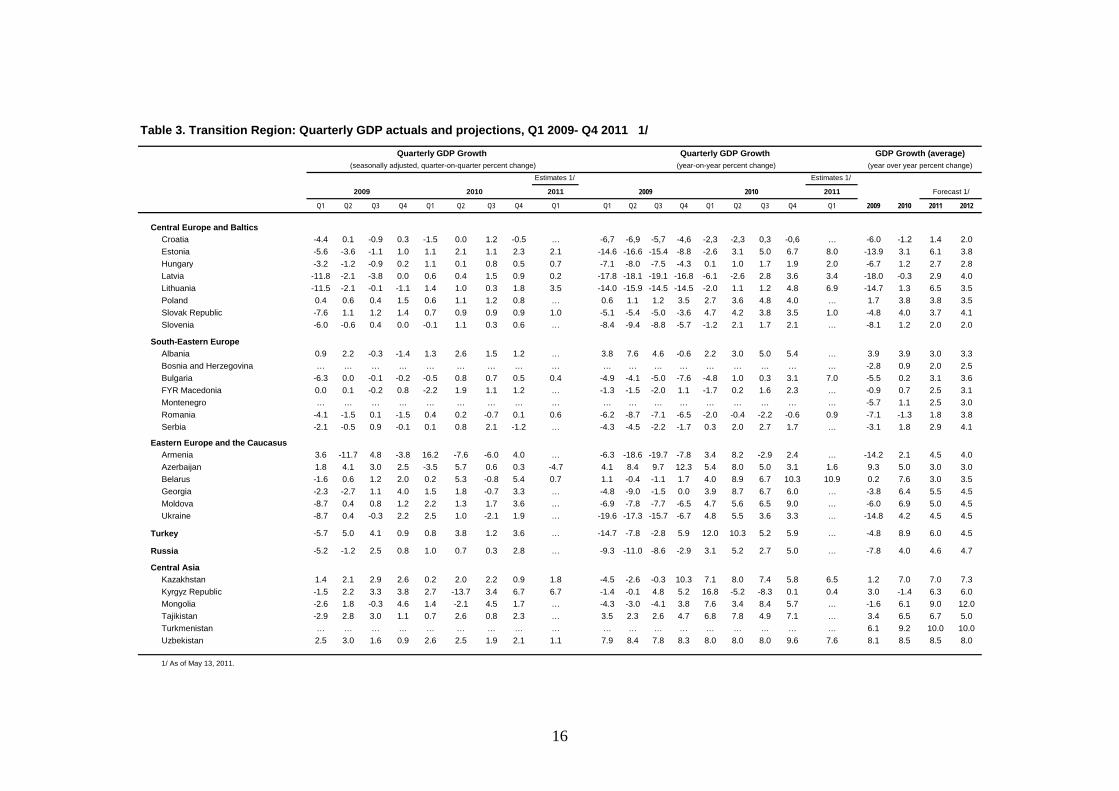
Table 3. Transition Region: Quarterly GDP actuals and projections, Q1 2009- Q4 2011 1/
Q1 Q2 Q3 Q4 Q1 Q2 Q3 Q4 Q1 Q1 Q2 Q3 Q4 Q1 Q2 Q3 Q4 Q1 2009 2010 2011 2012
Central Europe and BalticsCroatia -4.4 0.1 -0.9 0.3 -1.5 0.0 1.2 -0.5 … -6,7 -6,9 -5,7 -4,6 -2,3 -2,3 0,3 -0,6 … -6.0 -1.2 1.4 2.0Estonia -5.6 -3.6 -1.1 1.0 1.1 2.1 1.1 2.3 2.1 -14.6 -16.6 -15.4 -8.8 -2.6 3.1 5.0 6.7 8.0 -13.9 3.1 6.1 3.8Hungary -3.2 -1.2 -0.9 0.2 1.1 0.1 0.8 0.5 0.7 -7.1 -8.0 -7.5 -4.3 0.1 1.0 1.7 1.9 2.0 -6.7 1.2 2.7 2.8Latvia -11.8 -2.1 -3.8 0.0 0.6 0.4 1.5 0.9 0.2 -17.8 -18.1 -19.1 -16.8 -6.1 -2.6 2.8 3.6 3.4 -18.0 -0.3 2.9 4.0Lithuania -11.5 -2.1 -0.1 -1.1 1.4 1.0 0.3 1.8 3.5 -14.0 -15.9 -14.5 -14.5 -2.0 1.1 1.2 4.8 6.9 -14.7 1.3 6.5 3.5Poland 0.4 0.6 0.4 1.5 0.6 1.1 1.2 0.8 … 0.6 1.1 1.2 3.5 2.7 3.6 4.8 4.0 … 1.7 3.8 3.8 3.5Slovak Republic -7.6 1.1 1.2 1.4 0.7 0.9 0.9 0.9 1.0 -5.1 -5.4 -5.0 -3.6 4.7 4.2 3.8 3.5 1.0 -4.8 4.0 3.7 4.1Slovenia -6.0 -0.6 0.4 0.0 -0.1 1.1 0.3 0.6 … -8.4 -9.4 -8.8 -5.7 -1.2 2.1 1.7 2.1 … -8.1 1.2 2.0 2.0
South-Eastern EuropeAlbania 0.9 2.2 -0.3 -1.4 1.3 2.6 1.5 1.2 … 3.8 7.6 4.6 -0.6 2.2 3.0 5.0 5.4 … 3.9 3.9 3.0 3.3Bosnia and Herzegovina … … … … … … … … … … … … … … … … … … -2.8 0.9 2.0 2.5Bulgaria -6.3 0.0 -0.1 -0.2 -0.5 0.8 0.7 0.5 0.4 -4.9 -4.1 -5.0 -7.6 -4.8 1.0 0.3 3.1 7.0 -5.5 0.2 3.1 3.6FYR Macedonia 0.0 0.1 -0.2 0.8 -2.2 1.9 1.1 1.2 … -1.3 -1.5 -2.0 1.1 -1.7 0.2 1.6 2.3 … -0.9 0.7 2.5 3.1Montenegro … … … … … … … … … … … … … … … … … … -5.7 1.1 2.5 3.0Romania -4.1 -1.5 0.1 -1.5 0.4 0.2 -0.7 0.1 0.6 -6.2 -8.7 -7.1 -6.5 -2.0 -0.4 -2.2 -0.6 0.9 -7.1 -1.3 1.8 3.8Serbia -2.1 -0.5 0.9 -0.1 0.1 0.8 2.1 -1.2 … -4.3 -4.5 -2.2 -1.7 0.3 2.0 2.7 1.7 … -3.1 1.8 2.9 4.1
Eastern Europe and the CaucasusArmenia 3.6 -11.7 4.8 -3.8 16.2 -7.6 -6.0 4.0 … -6.3 -18.6 -19.7 -7.8 3.4 8.2 -2.9 2.4 … -14.2 2.1 4.5 4.0Azerbaijan 1.8 4.1 3.0 2.5 -3.5 5.7 0.6 0.3 -4.7 4.1 8.4 9.7 12.3 5.4 8.0 5.0 3.1 1.6 9.3 5.0 3.0 3.0Belarus -1.6 0.6 1.2 2.0 0.2 5.3 -0.8 5.4 0.7 1.1 -0.4 -1.1 1.7 4.0 8.9 6.7 10.3 10.9 0.2 7.6 3.0 3.5Georgia -2.3 -2.7 1.1 4.0 1.5 1.8 -0.7 3.3 … -4.8 -9.0 -1.5 0.0 3.9 8.7 6.7 6.0 … -3.8 6.4 5.5 4.5Moldova -8.7 0.4 0.8 1.2 2.2 1.3 1.7 3.6 … -6.9 -7.8 -7.7 -6.5 4.7 5.6 6.5 9.0 … -6.0 6.9 5.0 4.5Ukraine -8.7 0.4 -0.3 2.2 2.5 1.0 -2.1 1.9 … -19.6 -17.3 -15.7 -6.7 4.8 5.5 3.6 3.3 … -14.8 4.2 4.5 4.5
Turkey -5.7 5.0 4.1 0.9 0.8 3.8 1.2 3.6 … -14.7 -7.8 -2.8 5.9 12.0 10.3 5.2 5.9 … -4.8 8.9 6.0 4.5
Russia -5.2 -1.2 2.5 0.8 1.0 0.7 0.3 2.8 … -9.3 -11.0 -8.6 -2.9 3.1 5.2 2.7 5.0 … -7.8 4.0 4.6 4.7
Central AsiaKazakhstan 1.4 2.1 2.9 2.6 0.2 2.0 2.2 0.9 1.8 -4.5 -2.6 -0.3 10.3 7.1 8.0 7.4 5.8 6.5 1.2 7.0 7.0 7.3Kyrgyz Republic -1.5 2.2 3.3 3.8 2.7 -13.7 3.4 6.7 6.7 -1.4 -0.1 4.8 5.2 16.8 -5.2 -8.3 0.1 0.4 3.0 -1.4 6.3 6.0Mongolia -2.6 1.8 -0.3 4.6 1.4 -2.1 4.5 1.7 … -4.3 -3.0 -4.1 3.8 7.6 3.4 8.4 5.7 … -1.6 6.1 9.0 12.0Tajikistan -2.9 2.8 3.0 1.1 0.7 2.6 0.8 2.3 … 3.5 2.3 2.6 4.7 6.8 7.8 4.9 7.1 … 3.4 6.5 6.7 5.0Turkmenistan … … … … … … … … … … … … … … … … … … 6.1 9.2 10.0 10.0Uzbekistan 2.5 3.0 1.6 0.9 2.6 2.5 1.9 2.1 1.1 7.9 8.4 7.8 8.3 8.0 8.0 8.0 9.6 7.6 8.1 8.5 8.5 8.0
1/ As of May 13, 2011.
Quarterly GDP Growth (seasonally adjusted, quarter-on-quarter percent change)
GDP Growth (average)Quarterly GDP Growth (year-on-year percent change) (year over year percent change)
2009 201020092010
Estimates 1/
2011
Estimates 1/
Forecast 1/2011
16
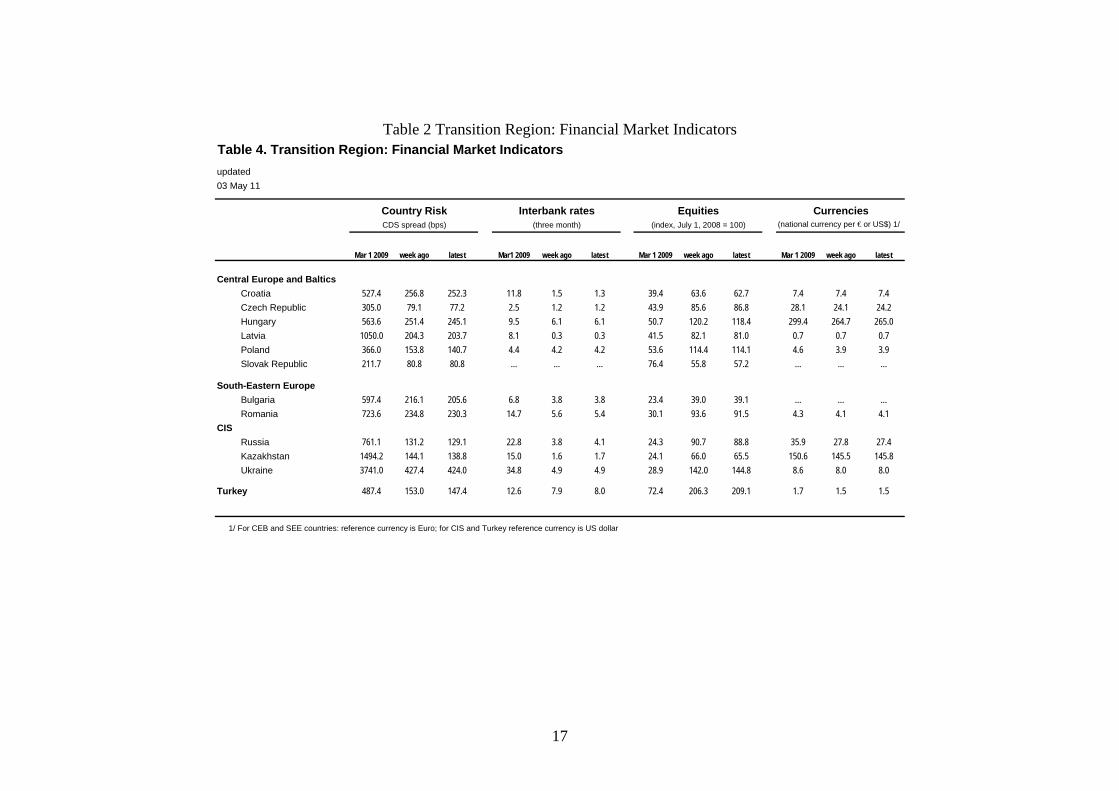
Table 2 Transition Region: Financial Market Indicators
updated03 May 11
Mar 1 2009 week ago latest Mar1 2009 week ago latest Mar 1 2009 week ago latest Mar 1 2009 week ago latest
Central Europe and BalticsCroatia 527.4 256.8 252.3 11.8 1.5 1.3 39.4 63.6 62.7 7.4 7.4 7.4Czech Republic 305.0 79.1 77.2 2.5 1.2 1.2 43.9 85.6 86.8 28.1 24.1 24.2Hungary 563.6 251.4 245.1 9.5 6.1 6.1 50.7 120.2 118.4 299.4 264.7 265.0Latvia 1050.0 204.3 203.7 8.1 0.3 0.3 41.5 82.1 81.0 0.7 0.7 0.7Poland 366.0 153.8 140.7 4.4 4.2 4.2 53.6 114.4 114.1 4.6 3.9 3.9Slovak Republic 211.7 80.8 80.8 ... ... ... 76.4 55.8 57.2 ... ... ...
South-Eastern EuropeBulgaria 597.4 216.1 205.6 6.8 3.8 3.8 23.4 39.0 39.1 ... ... ...Romania 723.6 234.8 230.3 14.7 5.6 5.4 30.1 93.6 91.5 4.3 4.1 4.1
CISRussia 761.1 131.2 129.1 22.8 3.8 4.1 24.3 90.7 88.8 35.9 27.8 27.4Kazakhstan 1494.2 144.1 138.8 15.0 1.6 1.7 24.1 66.0 65.5 150.6 145.5 145.8Ukraine 3741.0 427.4 424.0 34.8 4.9 4.9 28.9 142.0 144.8 8.6 8.0 8.0
Turkey 487.4 153.0 147.4 12.6 7.9 8.0 72.4 206.3 209.1 1.7 1.5 1.5
1/ For CEB and SEE countries: reference currency is Euro; for CIS and Turkey reference currency is US dollar
Country RiskCDS spread (bps)
Interbank rates(three month)
Table 4. Transition Region: Financial Market Indicators
Equities(index, July 1, 2008 = 100)
Currencies(national currency per € or US$) 1/
17

Figures Figure 1: External environment
Figure 1. External environment
Export volumes, y-o-y, % Current account (annualized), % of GDP
-45-40-35-30-25-20-15-10
-505
10152025
Bulgaria
Croati
aCze
ch
Estonia
HungaryLatv
ia
Lithuan
ia
Moldova
Poland
Romania
Russia
Slovakia
Slovenia
Turkey
Ukraine
Q3 2008 Q4 2008 Q1 2009 Q2 2009Q3 2009 Q4 2009 Q1 2010 Q2 2010Q3 2010 Q4 2010
-35-30-25-20-15-10-505
101520
Albania BiH
Bulgaria
Czech
Rep
ublic
Estonia
Hungary
Kazak
hstan
Latvia
Lithuan
ia
Maced
onia
Poland
Romania
Russia
Serbia
Slovakia
Slovenia
Turkey
Ukraine
Q3 2008 Q4 2008 Q1 2009 Q2 2009 Q3 2009Q4 2009 Q1 2010 Q2 2010 Q3 2010 Q 4 2010
Source: National authorities via CEIC data service. Source: National authorities via CEIC data service.
Net lending from BIS-reporting banks, exch. rate adjusted, US$ bn FDI gross inflows, y-o-y, %
-6.29%
-2.73%
-7.61%
-15.69%
0.04%
-9.57%
-15.04%
1.3%2.4%
-1.6%
7.0% 6.6%
9.5%
4.7%
-20%
-15%
-10%
-5%
0%
5%
10%
15%
20%
AdvancedEurope
EmergingEurope 1/
Ukraine Russia CA andCaucasus
Latin America Emerging Asia2/
Dec-2007 Mar-2008 Jun-2008 Sep-2008 Dec-2008 Mar-2009Jun-2009 Sep-2009 Dec-2009 Mar-2010 Jun-2010 Sep-10
1/ Emerging Europe excludes Russia and Ukraine. 2/ Emerging Asia excludes China, Central Asia and Caucasus.
-200
-100
0
100
200
300
400
500
600
700
800
Bulgaria
Czech
Estonia
Kazak
hstan
Lithua
nia
Poland
Romania
Russia
Serbia
Turkey
Ukrain
e
Q3 2008 Q4 2008 Q1 2009Q2 2009 Q3 2009 Q4 2009Q1 2010 Q2 2010 Q3 2010Q4 2010
Source: BIS via CEIC data service.
Source: National authorities via CEIC data service.
Real effective exchange rate, July 2008=100 Reserves, end of period, % of GDP
65
75
85
95
105
115
125
Jul-0
8
Sep-08
Nov-08
Jan-09
Mar-09
May-09
Jul-0
9
Sep-09
Nov-09
Jan-10
Mar-10
May-10
Jul-1
0
Sep-10
Nov-10
Georgia Slovak RepublicUkraine BulgariaArmenia Macedonia, FYRCroatia
Source: IMF International Financial Statistics.
0%
5%
10%
15%
20%
25%
30%
35%
40%
45%
Armen
ia
Azerb
aijan
Belaru
s
Bulgaria
Croati
a
Czech
Rep
.
Estonia
Georg
ia
Hungary
Kazak
hstan
Kyrgyz
Rep
.
Latvia
Lithuan
ia
Moldova
Monteneg
ro
Poland
Romania
Russia
Turkey
Ukraine
Q3 2008 End 2009 Most recent
*Most recent is January or February 2011 Source: IMF International Financial Statistics.
Global risk Parent banks CDS spreads
0102030405060708090
100
Mar-09
May-09
Jul-0
9
Sep-09
Nov-09
Jan-10
Mar-10
May-10
Jul-1
0
Sep-10
Nov-10
Jan-11
Mar-11
0
200
400
600
800
1000
1200
1400
1600
1800
2000
VIX EMBIG Europe EMBIG US high-yield
VIX
U.S. high-yield bond spreads
EMBI
EMBIG Europe
Source: Bloomberg.
50
100
150
200
250
Jun-10 Jul-10 Aug-10 Sep-10 Oct-10 Nov-10 Dec-10 Jan-11 Feb-11 Mar-11 Apr-11Societe Generale Intesa Sanpaolo SpACitigroup Inc Raiffeisen Zentralbank OesteUniCredit SpA ING Groep NV
Citigroup UniCredit
Societe
Raiffeisen
ING Groep NVIntesa Sanpaolo SpA
Source: Bloomberg.
18

dicators
Figure 2. Currencies and financial market indicators (daily frequency) Currencies
262
267
272
277
282
287
HUF/EUR
May-11
Apr-11
Mar-11
Jan-11
Dec-10
Nov-10
3.8
4.0
4.2
PLN / EUR
33
34
34
35
35
36
36
37
37
May-11
Apr-11
Mar-11
Jan-11
Dec-10
Nov-10
140
142
144
146
148
150
152
154
KZT/USD
RUB vs EUR/USD basket
95
100
105
110
Serbian dinar/EUR
1.35
1.40
1.45
1.50
1.55
1.60
1.65
Turkish lira/USD
May-11
Apr-11
Mar-11
Jan-
11
Dec-10
Nov-10
7.67.77.87.98.08.18.28.38.4
UAH/USD
May-11
Apr-11
Mar-11
Jan-1
1
Dec-10
Nov-10
4.0
4.1
4.2
4.3
4.4
RON/EUR
Source: Bloomberg.
Sovereign risk (bond spreads)
0
200
400
600
800
1000
1200
May-10
Jun-
10
Jul-1
0
Aug-10
Sep-
10
Oct-10
Nov-10
Dec-1
0
Jan-
11
Feb-
11
Mar-11
Apr-1
1
May-11
0
200
400
600
800
1000
1200
May-10
Jun-10
Jul-1
0
Aug-10
Sep-10
Oct-10
Nov-10
Dec-10
Jan-11
Feb-1
1
Mar-11
Apr-11
May-11
Russia EMBI Ukraine EMBIBulgaria EMBI Hungary 10yrKazakhstanPoland 10yr
Hu
Pol
Bg
Turkey EMBI
Ukr
Ru
Tur
Source: Bloomberg.
Kaz
Stock markets (July 2008=100)
2030405060708090
100110120130140
Mar-0
9
Apr-09
May-09
Jun-
09
Jul-0
9
Aug-09
Sep-09
Oct-09
Nov-09
Dec-09
Jan-
10
Feb-
10
Mar-1
0
Apr-10
May-10
Jun-
10
Jul-1
0
Aug-10
Sep-10
Oct-10
Nov-10
Dec-10
Jan-
11
Feb-
11
HungaryBUX
2030405060708090
100110120
Mar-09
May-09
Jul-0
9
Sep-09
Nov-09
Jan-
10
Mar-10
May-10
Jul-1
0
Sep-10
Nov-10
Jan-
11
Mar-11
May-11
MSCI EM MSCI EMEARussian RTS Czech PX
Ru
Cz
EMEA
EM
UkrainePFTSRomaniaBetBulgariaSOFIX Ukr
Hu
Ro
Bul
Source: Bloomberg.
Interbank rates
0
5
10
15
20
May-11
Apr-11
Mar-11
Feb-11
Jan-11
Dec-10
Nov-10
Oct-10
Sep-10
Aug-10Ju
l-10
Jun-10
May-100
4
8
12
16
20
May-11
Apr-11
Mar-11
Feb-11
Jan-11
Dec-10
Nov-10
Oct-10
Sep-10
Aug-10Ju
l-10
Jun-10
May-10
Latvia Mosprime 3mKazprimeHungary
Lithuania
Kievprime 3m
Source: Bloomberg.
19
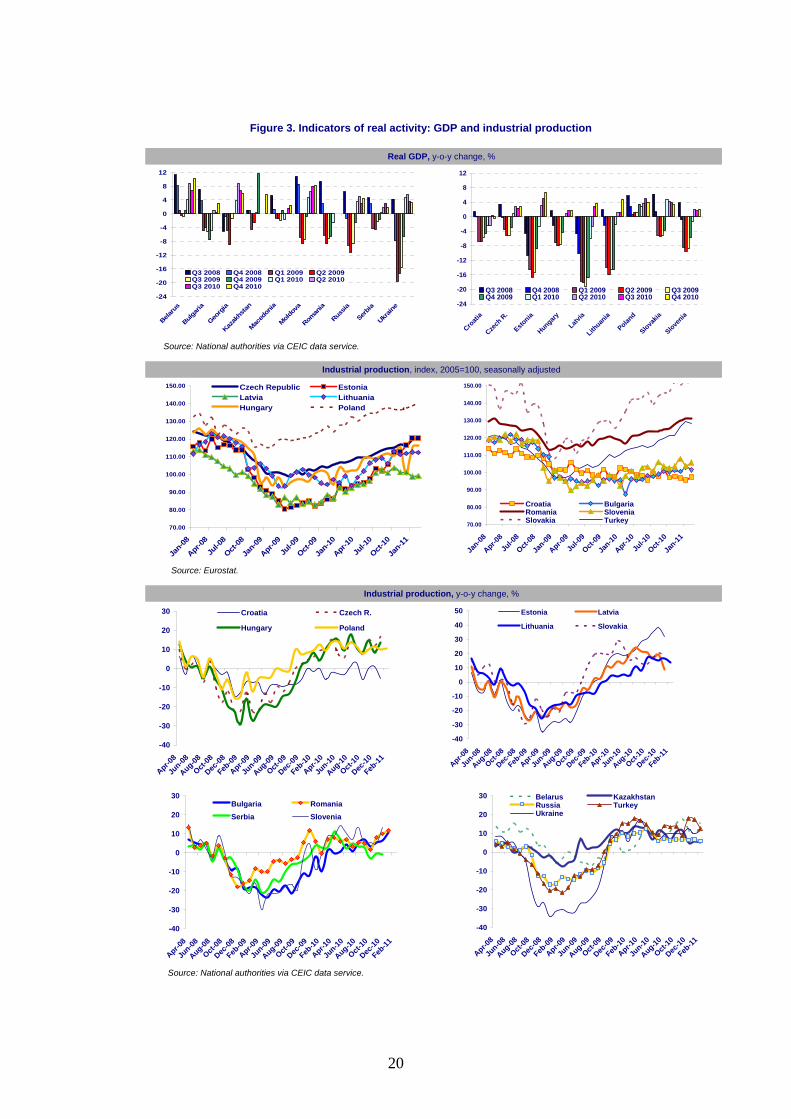
Figure 2Indicators of real activity
Figure 3. Indicators of real activity: GDP and industrial production
Real GDP, y-o-y change, %
-24
-20
-16
-12
-8
-4
0
4
8
12
Belaru
s
Bulgar
ia
Georg
ia
Kazak
hstan
Maced
onia
Moldov
a
Roman
ia
Russia
Serbia
Ukrain
e
Q3 2008 Q4 2008 Q1 2009 Q2 2009Q3 2009 Q4 2009 Q1 2010 Q2 2010Q3 2010 Q4 2010
-24
-20
-16
-12
-8
-4
0
4
8
12
Croati
a
Czech
R.
Estonia
HungaryLatv
ia
Lithuan
ia
Poland
Slovakia
Slovenia
Q3 2008 Q4 2008 Q1 2009 Q2 2009 Q3 2009Q4 2009 Q1 2010 Q2 2010 Q3 2010 Q4 2010
Source: National authorities via CEIC data service.
Industrial production, index, 2005=100, seasonally adjusted
70.00
80.00
90.00
100.00
110.00
120.00
130.00
140.00
150.00
Jan-0
8
Apr-08
Jul-0
8
Oct-08
Jan-0
9
Apr-09
Jul-0
9
Oct-09
Jan-1
0
Apr-10
Jul-1
0
Oct-10
Jan-1
1
Czech Republic EstoniaLatvia LithuaniaHungary Poland
70.00
80.00
90.00
100.00
110.00
120.00
130.00
140.00
150.00
Jan-08
Apr-08
Jul-0
8
Oct-08
Jan-09
Apr-09
Jul-0
9
Oct-09
Jan-10
Apr-10
Jul-1
0
Oct-10
Jan-11
Croatia BulgariaRomania SloveniaSlovakia Turkey
Source: Eurostat.
Industrial production, y-o-y change, %
-40
-30
-20
-10
0
10
20
30
Apr-08
Jun-08
Aug-08
Oct-08
Dec-08
Feb-09
Apr-09
Jun-09
Aug-09
Oct-09
Dec-09
Feb-10
Apr-10
Jun-10
Aug-10
Oct-10
Dec-10
Feb-11
Croatia Czech R.
Hungary Poland
-40
-30
-20
-10
0
10
20
30
40
50
Apr-08
Jun-08
Aug-08
Oct-08
Dec-08
Feb-09
Apr-09
Jun-09
Aug-09
Oct-09
Dec-09
Feb-10
Apr-10
Jun-10
Aug-10
Oct-10
Dec-10
Feb-11
Estonia Latvia
Lithuania Slovakia
-40
-30
-20
-10
0
10
20
30
Apr-08
Jun-08
Aug-08
Oct-08
Dec-08
Feb-09
Apr-09
Jun-09
Aug-09
Oct-09
Dec-09
Feb-10
Apr-10
Jun-10
Aug-10
Oct-10
Dec-10
Feb-11
Bulgaria RomaniaSerbia Slovenia
-40
-30
-20
-10
0
10
20
30
Apr-08
Jun-08
Aug-08
Oct-08
Dec-08
Feb-09
Apr-09
Jun-09
Aug-09
Oct-09
Dec-09
Feb-10
Apr-10
Jun-10
Aug-10
Oct-10
Dec-10
Feb-11
Belarus KazakhstanRussia TurkeyUkraine
Source: National authorities via CEIC data service.
20

Figure 3Indicators of real activity: retail sales and confidence indic3es
Figure 4. Indicators of real activity: retail sales and confidence indexes
Retail sales, y-o-y change, %
-40
-30
-20
-10
0
10
20
30
40
Apr-08
Jun-08
Aug-08
Oct-08
Dec-08
Feb-09
Apr-09
Jun-09
Aug-09
Oct-09
Dec-09
Feb-10
Apr-10
Jun-10
Aug-10
Oct-10
Dec-10
Croatia Czech R.
Hungary Poland
-40
-30
-20
-10
0
10
20
30
40
Apr-08
Jun-08
Aug-08
Oct-08
Dec-08
Feb-09
Apr-09
Jun-09
Aug-09
Oct-09
Dec-09
Feb-10
Apr-10
Jun-10
Aug-10
Oct-10
Dec-10
Estonia Latvia Lithuania
Slovakia Slovenia
-40
-30
-20
-10
0
10
20
30
40
Apr-08
Jun-08
Aug-08
Oct-08
Dec-08
Feb-09
Apr-09
Jun-09
Aug-09
Oct-09
Dec-09
Feb-10
Apr-10
Jun-10
Aug-10
Oct-10
Dec-10
Feb-11
Kazakhstan Russia Ukraine
-40
-30
-20
-10
0
10
20
30
40
Apr-08
Jun-08
Aug-08
Oct-08
Dec-08
Feb-09
Apr-09
Jun-09
Aug-09
Oct-09
Dec-09
Feb-10
Apr-10
Jun-10
Aug-10
Oct-10
Dec-10
Feb-11
Bulgaria Romania Serbia
Source: National authorities via CEIC data service.
Consumer confidence, seasonally adjusted balances, defined as the difference (in percentage points of total answers) between positive and negative answers
-70.0
-60.0
-50.0
-40.0
-30.0
-20.0
-10.0
0.0
Apr-08
Jun-08
Aug-08
Oct-08
Dec-08
Feb-09
Apr-09
Jun-09
Aug-09
Oct-09
Dec-09
Feb-10
Apr-10
Jun-10
Aug-10
Oct-10
Dec-10
Feb-11
Czech RepublicEstoniaLatviaLithuaniaHungary
-70.0
-60.0
-50.0
-40.0
-30.0
-20.0
-10.0
0.0
10.0
Apr-08
Jun-08
Aug-08
Oct-08
Dec-08
Feb-09
Apr-09
Jun-0
9
Aug-09
Oct-09
Dec-09
Feb-10
Apr-10
Jun-10
Aug-10
Oct-10
Dec-10
Feb-11
Bulgaria RomaniaPoland SloveniaSlovakia
. Source: Eurostat.
Industrial confidence, seasonally adjusted balances, defined as the difference (in percentage points of total answers) between positive and negative answers
-45.0
-35.0
-25.0
-15.0
-5.0
5.0
15.0
25.0
Jul-0
8
Sep-08
Nov-08
Jan-09
Mar-09
May-09
Jul-0
9
Sep-09
Nov-09
Jan-10
Mar-10
May-10
Jul-1
0
Sep-10
Nov-10
Jan-11
Czech Republic EstoniaLatvia LithuaniaHungary
-40.0
-30.0
-20.0
-10.0
0.0
10.0
20.0
Jul-0
8
Sep-08
Nov-08
Jan-09
Mar-09
May-09
Jul-0
9
Sep-09
Nov-09
Jan-10
Mar-10
May-10
Jul-1
0
Sep-10
Nov-10
Jan-11
Bulgaria PolandRomania SloveniaSlovakia
Source: Eurostat.
21

Figure 4Indicators of real activity: and unemployment
Figure 5. Indicators of real activity: CPI and unemployment
CPI, y-o-y change, %
-5
0
5
10
15
20
Apr-08
Jun-08
Aug-08
Oct-08
Dec-08
Feb-09
Apr-09
Jun-09
Aug-09
Oct-09
Dec-09
Feb-10
Apr-10
Jun-10
Aug-10
Oct-10
Dec-10
Feb-11
Czech R.HungaryLatviaLithuania
-5
0
5
10
15
20
Apr-08
Jun-08
Aug-08
Oct-08
Dec-08
Feb-09
Apr-09
Jun-09
Aug-09
Oct-09
Dec-09
Feb-10
Apr-10
Jun-10
Aug-10
Oct-10
Dec-10
Feb-11
Croatia EstoniaPoland SlovakiaSlovenia
-5
0
5
10
15
20
Apr-08
Jun-08
Aug-08Oct-
08
Dec-08
Feb-09
Apr-09
Jun-09
Aug-09Oct-
09
Dec-09
Feb-10Apr-1
0
Jun-10
Aug-10Oct-
10
Dec-10
Feb-11
Albania BiHBulgaria MontenegroRomania Serbia
-5
0
5
10
15
20
25
30
35
40
Apr-08
Jun-08
Aug-08
Oct-08
Dec-08
Feb-09
Apr-09
Jun-09
Aug-09
Oct-09
Dec-09
Feb-10
Apr-10
Jun-10
Aug-10
Oct-10
Dec-10
Feb-11
Kazakhstan RussiaUkraine Turkey
-10-505
10152025303540
Apr-08
Jun-08
Aug-08
Oct-08
Dec-08
Feb-09
Apr-09
Jun-09
Aug-09
Oct-09
Dec-09
Feb-10
Apr-10
Jun-10
Aug-10
Oct-10
Dec-10
Feb-11
ArmeniaAzerbaijanGeorgia
-505
10152025303540
Apr-08
Jun-08
Aug-08Oct-
08
Dec-08
Feb-09Apr-0
9
Jun-09
Aug-09Oct-
09
Dec-09
Feb-10
Apr-10
Jun-10
Aug-10Oct-
10
Dec-10
Feb-11
Belarus
Moldova
Tajikistan
Source: National authorities via CEIC data service.
Unemployment rate, %
0
2
4
6
8
10
12
14
16
18
Apr-08
Jun-
08
Aug-08
Oct-08
Dec-08
Feb-
09
Apr-09
Jun-
09
Aug-09
Oct-09
Dec-09
Feb-
10
Apr-10
Jun-
10
Aug-10
Oct-10
Dec-10
Feb-
11
Bulgaria Czech R. EstoniaHungary Latvia PolandRomania
0
2
4
6
8
10
12
14
16
18
Apr-08
Jun-
08
Aug-08
Oct-08
Dec-08
Feb-
09
Apr-09
Jun-
09
Aug-09
Oct-09
Dec-09
Feb-
10
Apr-10
Jun-
10
Aug-10
Oct-10
Dec-10
Feb-
11
Armenia Belarus Kazakhstan
Russia Tajikistan Turkey
Source: National authorities via CEIC data service.
22

Figure 5Finacial sector indicators: deposits by currency
Figure 6. Financial sector indicators: deposits by currency Local currency total deposits, stocks. January 2008 = 100
60
80
100
120
140
Jan-08
Mar-08
May-08Ju
l-08
Sep-08
Nov-08
Jan-09
Mar-09
May-09Ju
l-09
Sep-09
Nov-09
Jan-10
Mar-10
May-10Ju
l-10
Sep-10
Nov-10
Jan-11
Estonia Latvia Lithuania
60
80
100
120
140
Jan-08
Mar-08
May-08Ju
l-08
Sep-08
Nov-08
Jan-09
Mar-09
May-09Ju
l-09
Sep-09
Nov-09
Jan-10
Mar-10
May-10Ju
l-10
Sep-10
Nov-10
Jan-11
Croatia Czech RepublicHungary Poland
80
100
120
140
Jan-08
Mar-08
May-08Ju
l-08
Sep-08
Nov-08
Jan-09
Mar-09
May-09Ju
l-09
Sep-09
Nov-09
Jan-10
Mar-10
May-10Ju
l-10
Sep-10
Nov-10
Jan-11
Bulgaria Romania Slovenia
80
90
100
110
120
Jan-08
Mar-08
May-08
Jul-0
8
Sep-08
Nov-08
Jan-09
Mar-09
May-09
Jul-0
9
Sep-09
Nov-09
Jan-10
Mar-10
May-10
Jul-1
0
Sep-10
Nov-10
Jan-11
Albania BiHFYR Macedonia Serbia
50
70
90
110
130
150
170
190
Jan-08
Mar-08
May-08Ju
l-08
Sep-08
Nov-08
Jan-09
Mar-09
May-09Ju
l-09
Sep-09
Nov-09
Jan-10
Mar-10
May-10Ju
l-10
Sep-10
Nov-10
Jan-11
ArmeniaAzerbaijanGeorgiaBelarusTajikistan
50
70
90
110
130
150
170
190
Jan-08
Mar-08
May-08Ju
l-08
Sep-08
Nov-08
Jan-09
Mar-09
May-09Ju
l-09
Sep-09
Nov-09
Jan-10
Mar-10
May-10Ju
l-10
Sep-10
Nov-10
Jan-11
Kazakhstan MoldovaRussia TurkeyUkraine
Source: National authorities via CEIC data service.
Foreign currency total deposits, stocks (FX adjusted) /1. January 2008 = 100
60
80
100
120
140
160
180
Jan-08
Mar-08
May-08Ju
l-08
Sep-08
Nov-08
Jan-09
Mar-09
May-09Ju
l-09
Sep-09
Nov-09
Jan-10
Mar-10
May-10Ju
l-10
Sep-10
Nov-10
Jan-11
Estonia Latvia Lithuania
60
80
100
120
140
160
180
Jan-08
Mar-08
May-08Ju
l-08
Sep-08
Nov-08
Jan-09
Mar-09
May-09Ju
l-09
Sep-09
Nov-09
Jan-10
Mar-10
May-10Ju
l-10
Sep-10
Nov-10
Jan-11
Croatia Czech RepublicHungary Poland
60
80
100
120
140
160
180
Jan-08
Mar-08
May-08Ju
l-08
Sep-08
Nov-08
Jan-09
Mar-09
May-09Ju
l-09
Sep-09
Nov-09
Jan-10
Mar-10
May-10Ju
l-10
Sep-10
Nov-10
Jan-11
Bulgaria RomaniaSlovenia
60
80
100
120
140
160
180
Jan-08
Mar-08
May-08Ju
l-08
Sep-08
Nov-08
Jan-09
Mar-09
May-09Ju
l-09
Sep-09
Nov-09
Jan-10
Mar-10
May-10Ju
l-10
Sep-10
Nov-10
Jan-11
Albania BiHFYR Macedonia Serbia
406080
100120140160180200220240260
Jan-08
Mar-08
May-08Ju
l-08
Sep-08
Nov-08
Jan-09
Mar-09
May-09Ju
l-09
Sep-09
Nov-09
Jan-10
Mar-10
May-10Ju
l-10
Sep-10
Nov-10
Jan-11
ArmeniaAzerbaijanGeorgiaBelarusTajikistan
60
80
100
120
140
160
180
Jan-08
Mar-08
May-08Ju
l-08
Sep-08
Nov-08
Jan-09
Mar-09
May-09Ju
l-09
Sep-09
Nov-09
Jan-10
Mar-10
May-10Ju
l-10
Sep-10
Nov-10
Jan-11
Kazakhstan MoldovaRussia TurkeyUkraine
/1Composition of assumed FX Baskets (€ : $ weights): 100:0 for Bulgaria, Latvia, Lithuania, Poland, Serbia; 90:10 for Croatia and Romania; 50:50 for Albania, Armenia, Bosnia, Czech Republic, Estonia, FYR Macedonia, Georgia, Hungary, Moldova and Turkey; 20:80 for Ukraine; 15:85 for Russia, 10:90 for Kazakhstan, 0:100 for Azerbaijan and Tajikistan and 30:40:30 as a €-$-RUB basket for Belarus.
Source: National authorities via CEIC data service.
23

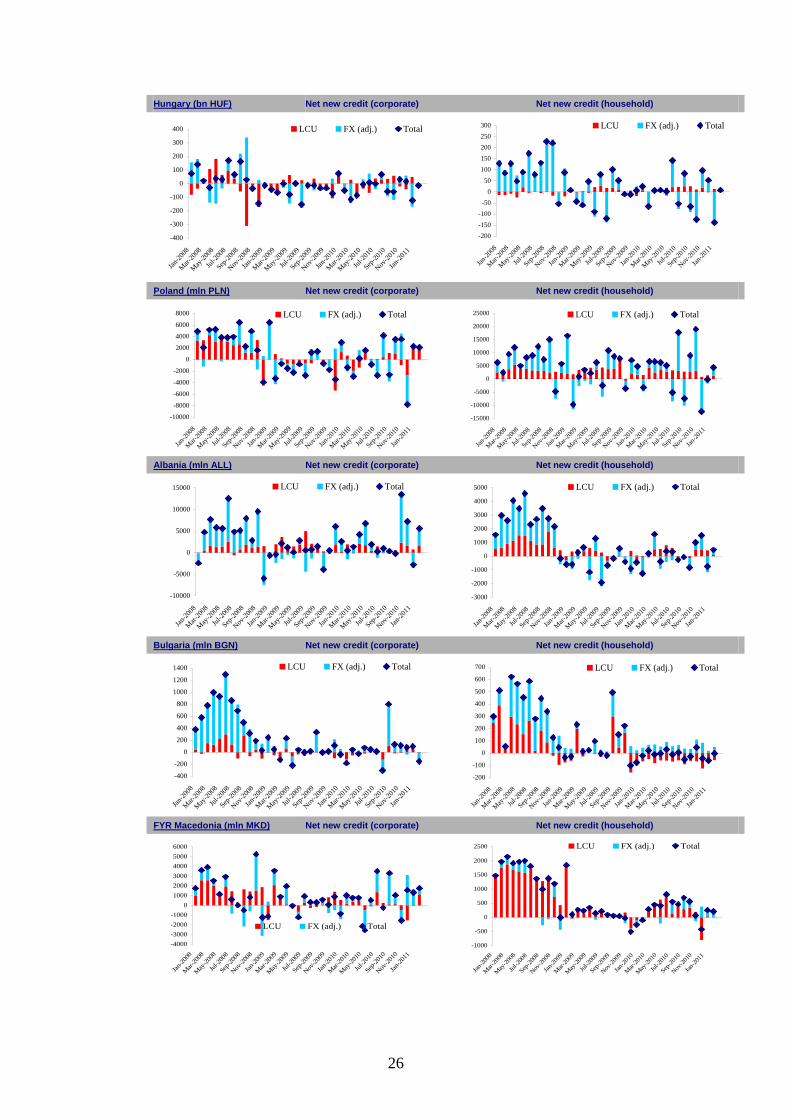
Figure 6Financial sector indicators: foreign and local currency lending
Figure 7a. Financial sector indicators: foreign and local currency lending Contribution to private sector growth (year-on-year, in %)
-35
-15
5
25
45
65
080910080910080910080910080910080910080910080910080910080910080910080910080910
ALB BIH FYR SRB ARM AZE BEL GEO MDV TAJ KAZ RUS UKR
FX LC TOTAL
Per cent
-25
-20
-15
-10
-5
0
5
10
15
20
25
30
35
08 09 10 08 09 10 08 09 10 08 09 10 08 09 10 08 09 10 08 09 10 08 09 10 08 09 10 08 09 10 08 09 10 08 09 10
BGR CRO LAT LIT HUN SVN EST SVK CZE POL ROM TUR
FX LC TOTAL
Per cent
Source: National authorities via CEIC data service.
24

Figure 7Financial sector indicators: new credit to private sector
Figure 7b. Financial sector indicators: new credit to private sector Croatia (HRK mln) Net new credit (corporate) Net new credit (household)
-1500
-1000
-500
0
500
1000
1500
2000
2500Jan
-2008
Mar-20
08May
-2008
Jul-20
08Sep
-2008
Nov-20
08Jan
-2009
Mar-20
09May
-2009
Jul-20
09Sep
-2009
Nov-20
09Jan
-2010
Mar-20
10May
-2010
Jul-20
10Sep
-2010
Nov-20
10Jan
-2011
LCU FX (adj.) Total
-3000
-2000
-1000
0
1000
2000
3000
4000
Jan-20
08Mar-
2008
May-20
08Jul
-2008
Sep-20
08Nov
-2008
Jan-20
09Mar-
2009
May-20
09Jul
-2009
Sep-20
09Nov
-2009
Jan-20
10Mar-
2010
May-20
10Jul
-2010
Sep-20
10Nov
-2010
Jan-20
11
LCU FX (adj.) Total
Czech Republic (CZK mln) Net new credit (corporate) Net new credit (household)
-25000-20000-15000-10000
-50000
50001000015000200002500030000
Jan-20
08Mar-
2008
May-20
08Jul
-2008
Sep-20
08Nov
-2008
Jan-20
09Mar-
2009
May-20
09Jul
-2009
Sep-20
09Nov
-2009
Jan-20
10Mar-
2010
May-20
10Jul
-2010
Sep-20
10Nov
-2010
Jan-20
11
LCU FX (adj.) Total
-5000
0
5000
10000
15000
20000
25000
Jan-20
08Mar-
2008
May-20
08Jul
-2008
Sep-20
08Nov
-2008
Jan-20
09Mar-
2009
May-20
09Jul
-2009
Sep-20
09Nov
-2009
Jan-20
10Mar-
2010
May-20
10Jul
-2010
Sep-20
10Nov
-2010
Jan-20
11
LCU FX (adj.) Total
Estonia (EEK mln) Net new credit (corporate) Net new credit (household)
-150
-100
-50
0
50
100
150
200
Jan-20
08Mar-
2008
May-20
08Jul
-2008
Sep-2
008
Nov-20
08Jan
-2009
Mar-20
09May
-2009
Jul-20
09Sep
-2009
Nov-20
09Jan
-2010
Mar-20
10May
-2010
Jul-20
10Sep
-2010
Nov-20
10
LCU FX (adj.) Total
-150
-100
-50
0
50
100
150
Jan-20
08Mar-
2008
May-20
08Jul
-2008
Sep-20
08Nov
-2008
Jan-20
09Mar-
2009
May-20
09Jul
-2009
Sep-20
09Nov
-2009
Jan-20
10Mar-
2010
May-20
10Jul
-2010
Sep-20
10Nov
-2010
LCU FX (adj.) Total
Latvia (mln LVL) Net new credit (corporate) Net new credit (household)
-250
-200
-150
-100
-50
0
50
100
150
200
Jan-20
08M
ar-20
08M
ay-20
08Ju
l-200
8Se
p-200
8Nov
-2008
Jan-20
09M
ar-20
09M
ay-20
09Ju
l-200
9Se
p-200
9Nov
-2009
Jan-20
10M
ar-20
10M
ay-20
10Ju
l-201
0Se
p-201
0Nov
-2010
LCU FX (adj.) Total
-80-60-40-20
020406080
100120
Jan-20
08M
ar-20
08M
ay-20
08Ju
l-200
8Se
p-200
8Nov
-2008
Jan-20
09M
ar-20
09M
ay-20
09Ju
l-200
9Se
p-200
9Nov
-2009
Jan-20
10M
ar-20
10M
ay-20
10Ju
l-201
0Se
p-201
0Nov
-2010
LCU FX (adj.) Total
Lithuania (mln LTL) Net new credit (corporate) Net new credit (household)
-1500
-1000
-500
0
500
1000
1500
2000
Jan-20
08Mar-
2008
May-20
08Jul
-2008
Sep-20
08Nov
-2008
Jan-20
09Mar-
2009
May-20
09Jul
-2009
Sep-20
09Nov
-2009
Jan-20
10Mar-
2010
May-20
10Jul
-2010
Sep-20
10Nov
-2010
Jan-20
11
LCU FX (adj.) Total
-600
-400
-200
0
200
400
600
800
1000
Jan-20
08Mar-
2008
May-20
08Jul
-2008
Sep-20
08Nov
-2008
Jan-20
09Mar-
2009
May-20
09Jul
-2009
Sep-20
09Nov
-2009
Jan-20
10Mar-
2010
May-20
10Jul
-2010
Sep-20
10Nov
-2010
Jan-20
11
LCU FX (adj.) Total
25
Hungary (bn HUF) Net new credit (corporate) Net new credit (household)
-400
-300
-200
-100
0
100
200
300
400
Jan-20
08Mar-
2008
May-20
08Jul
-2008
Sep-20
08Nov
-2008
Jan-20
09Mar-
2009
May-20
09Jul
-2009
Sep-20
09Nov
-2009
Jan-20
10Mar-
2010
May-20
10Jul
-2010
Sep-20
10Nov
-2010
Jan-20
11
LCU FX (adj.) Total
-200-150-100
-500
50100150200250300
Jan-20
08Mar-
2008
May-20
08Jul
-2008
Sep-20
08Nov
-2008
Jan-20
09Mar-
2009
May-20
09Jul
-2009
Sep-20
09Nov
-2009
Jan-20
10Mar-
2010
May-20
10Jul
-2010
Sep-20
10Nov
-2010
Jan-20
11
LCU FX (adj.) Total
Poland (mln PLN) Net new credit (corporate) Net new credit (household)
-10000
-8000
-6000
-4000
-2000
0
2000
4000
6000
8000
Jan-20
08Mar-
2008
May-20
08Jul
-2008
Sep-20
08Nov
-2008
Jan-20
09Mar-
2009
May-20
09Jul
-2009
Sep-20
09Nov
-2009
Jan-20
10Mar-
2010
May-20
10Jul
-2010
Sep-20
10Nov
-2010
Jan-20
11
LCU FX (adj.) Total
-15000
-10000
-5000
0
5000
10000
15000
20000
25000
Jan-20
08Mar-
2008
May-20
08Jul
-2008
Sep-20
08Nov
-2008
Jan-20
09Mar-
2009
May-20
09Jul
-2009
Sep-20
09Nov
-2009
Jan-20
10Mar-
2010
May-20
10Jul
-2010
Sep-20
10Nov
-2010
Jan-20
11
LCU FX (adj.) Total
Albania (mln ALL) Net new credit (corporate) Net new credit (household)
-10000
-5000
0
5000
10000
15000
Jan-20
08Mar-
2008
May-20
08Jul
-2008
Sep-20
08Nov
-2008
Jan-20
09Mar-
2009
May-20
09Jul
-2009
Sep-20
09Nov
-2009
Jan-20
10Mar-
2010
May-20
10Jul
-2010
Sep-20
10Nov
-2010
Jan-20
11
LCU FX (adj.) Total
-3000
-2000
-1000
0
1000
2000
3000
4000
5000
Jan-20
08Mar-
2008
May-20
08Jul
-2008
Sep-20
08Nov
-2008
Jan-20
09Mar-
2009
May-20
09Jul
-2009
Sep-20
09Nov
-2009
Jan-20
10Mar-
2010
May-20
10Jul
-2010
Sep-20
10Nov
-2010
Jan-20
11
LCU FX (adj.) Total
Bulgaria (mln BGN) Net new credit (corporate) Net new credit (household)
-400
-200
0
200
400
600
800
1000
1200
1400
Jan-20
08Mar-
2008
May-20
08Jul
-2008
Sep-20
08Nov
-2008
Jan-20
09Mar-
2009
May-20
09Jul
-2009
Sep-20
09Nov
-2009
Jan-20
10Mar-
2010
May-20
10Jul
-2010
Sep-20
10Nov
-2010
Jan-20
11
LCU FX (adj.) Total
-200
-100
0
100
200
300
400
500
600
700
Jan-20
08Mar-
2008
May-20
08Jul
-2008
Sep-20
08Nov
-2008
Jan-20
09Mar-
2009
May-20
09Jul
-2009
Sep-20
09Nov
-2009
Jan-20
10Mar-
2010
May-20
10Jul
-2010
Sep-20
10Nov
-2010
Jan-20
11
LCU FX (adj.) Total
FYR Macedonia (mln MKD) Net new credit (corporate) Net new credit (household)
-4000-3000-2000-1000
0100020003000400050006000
Jan-20
08M
ar-20
08M
ay-20
08Ju
l-200
8Se
p-200
8Nov
-2008
Jan-20
09M
ar-20
09M
ay-20
09Ju
l-200
9Se
p-200
9Nov
-2009
Jan-20
10M
ar-20
10M
ay-20
10Ju
l-201
0Se
p-201
0Nov
-2010
Jan-20
11
LCU FX (adj.) Total
-1000
-500
0
500
1000
1500
2000
2500
Jan-20
08M
ar-20
08M
ay-20
08Ju
l-200
8Se
p-200
8Nov
-2008
Jan-20
09M
ar-20
09M
ay-20
09Ju
l-200
9Se
p-200
9Nov
-2009
Jan-20
10M
ar-20
10M
ay-20
10Ju
l-201
0Se
p-201
0Nov
-2010
Jan-20
11
LCU FX (adj.) Total
26

Romania (mln RON) Net new credit (corporate) Net new credit (household)
-3000
-2000
-1000
0
1000
2000
3000
4000
Jan-20
08M
ar-20
08M
ay-20
08Ju
l-200
8Se
p-200
8Nov
-2008
Jan-20
09M
ar-20
09M
ay-20
09Ju
l-200
9Se
p-200
9Nov
-2009
Jan-20
10M
ar-20
10M
ay-20
10Ju
l-201
0Se
p-201
0Nov
-2010
Jan-20
11
LCU FX (adj.) Total
-3000
-2000
-1000
0
1000
2000
3000
4000
5000
Jan-20
08Mar-
2008
May-20
08Jul
-2008
Sep-20
08Nov
-2008
Jan-20
09Mar-
2009
May-20
09Jul
-2009
Sep-20
09Nov
-2009
Jan-20
10Mar-
2010
May-20
10Jul
-2010
Sep-20
10Nov
-2010
Jan-20
11
LCU FX (adj.) Total
Serbia (mln RSD) Net new credit (corporate) Net new credit (household)
-30000
-20000
-10000
0
10000
20000
30000
40000
50000
60000
Jan-20
08Mar-
2008
May-20
08Jul
-2008
Sep-20
08Nov
-2008
Jan-20
09Mar-
2009
May-20
09Jul
-2009
Sep-20
09Nov
-2009
Jan-20
10Mar-
2010
May-20
10Jul
-2010
Sep-20
10Nov
-2010
Jan-20
11
LCU FX (adj.) Total
-30000
-20000
-10000
0
10000
20000
30000
40000
50000
Jan-20
08Mar-
2008
May-20
08Jul
-2008
Sep-20
08Nov
-2008
Jan-20
09Mar-
2009
May-20
09Jul
-2009
Sep-20
09Nov
-2009
Jan-20
10Mar-
2010
May-20
10Jul
-2010
Sep-20
10Nov
-2010
Jan-20
11
LCU FX (adj.) Total
Kazakhstan (mln KZT) Net new credit (corporate) Net new credit (household)
-200000
-150000
-100000
-50000
0
50000
100000
150000
Jan-20
08M
ar-20
08M
ay-20
08Ju
l-200
8Se
p-200
8Nov
-2008
Jan-20
09M
ar-20
09M
ay-20
09Ju
l-200
9Se
p-200
9Nov
-2009
Jan-20
10M
ar-20
10M
ay-20
10Ju
l-201
0Se
p-201
0Nov
-2010
Jan-20
11
LCU FX (adj.) Total
-60000
-50000
-40000
-30000
-20000
-10000
0
10000
20000Jan
-2008
Mar-
2008
May
-2008
Jul-20
08Se
p-200
8Nov
-2008
Jan-20
09M
ar-20
09May
-2009
Jul-2
009
Sep-2
009
Nov-20
09Jan
-2010
Mar-20
10M
ay-20
10Jul
-2010
Sep-20
10Nov
-2010
Jan-20
11
LCU FX (adj.) Total
Russia (bn RUB) Net new credit (corporate) Net new credit (household)
-300
-200
-100
0
100
200
300
400
500
600
Jan-20
08M
ar-20
08M
ay-20
08Ju
l-200
8Se
p-200
8Nov
-2008
Jan-20
09M
ar-20
09M
ay-20
09Ju
l-200
9Se
p-200
9Nov
-2009
Jan-20
10M
ar-20
10M
ay-20
10Ju
l-201
0Se
p-201
0Nov
-2010
Jan-20
11
LCU FX (adj.) Total
-100
-50
0
50
100
150
200
Jan-20
08Mar-
2008
May
-2008
Jul-2
008
Sep-2
008
Nov-20
08Jan
-2009
Mar-20
09M
ay-20
09Ju
l-200
9Se
p-200
9Nov
-2009
Jan-20
10Mar-
2010
May
-2010
Jul-2
010
Sep-2
010
Nov-20
10Jan
-2011
LCU FX (adj.) Total
Ukraine (mln UAH) Net new credit (corporate) Net new credit (household)
-15000
-10000
-5000
0
5000
10000
15000
20000
25000
Jan-20
08M
ar-20
08M
ay-20
08Ju
l-200
8Se
p-200
8Nov
-2008
Jan-20
09M
ar-20
09M
ay-20
09Ju
l-200
9Se
p-200
9Nov
-2009
Jan-20
10M
ar-20
10M
ay-20
10Ju
l-201
0Se
p-201
0Nov
-2010
Jan-20
11
LCU FX (adj.) Total
-8000
-6000
-4000
-2000
0
2000
4000
6000
8000
10000
12000
Jan-20
08M
ar-20
08M
ay-20
08Ju
l-200
8Se
p-200
8Nov
-2008
Jan-20
09M
ar-20
09M
ay-20
09Ju
l-200
9Se
p-200
9Nov
-2009
Jan-20
10M
ar-20
10M
ay-20
10Ju
l-201
0Se
p-201
0Nov
-2010
Jan-20
11
LCU FX (adj.) Total
Source: National authorities via CEIC data service.
27
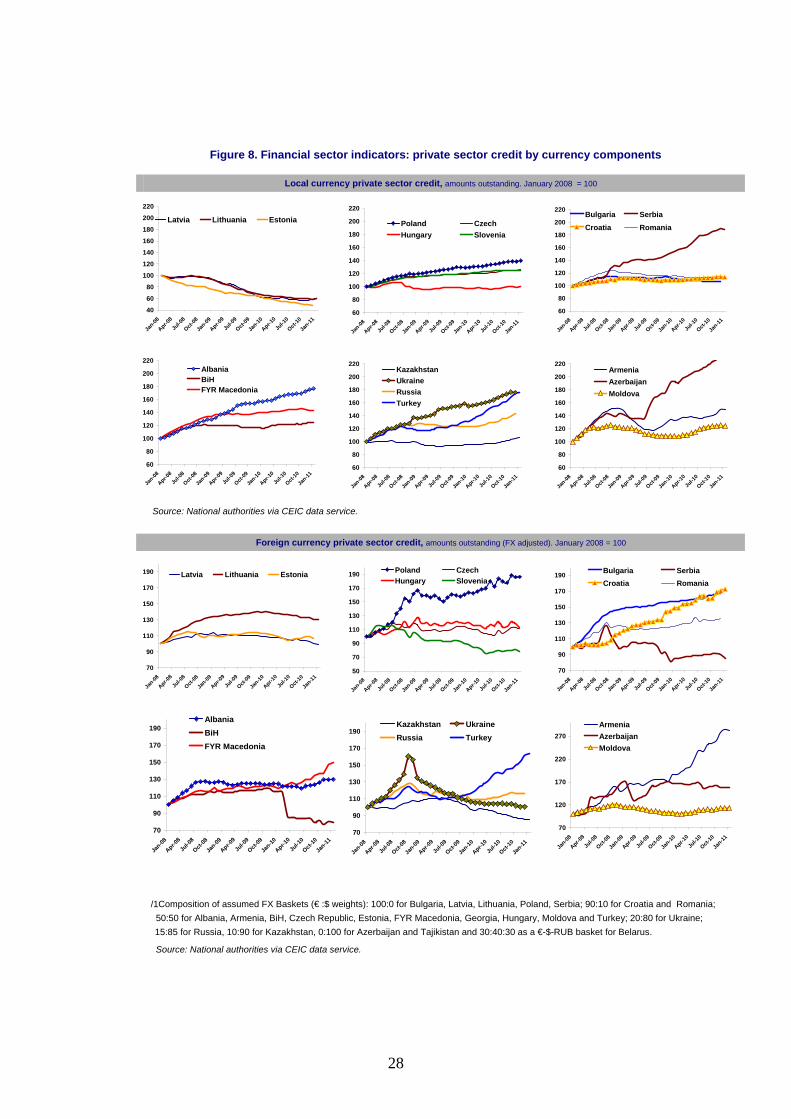
Figure 8Financial sector indicators: Private sector credit by currency comonents
Figure 8. Financial sector indicators: private sector credit by currency components
Local currency private sector credit, amounts outstanding. January 2008 = 100
4060
80100120
140160180
200220
Jan-08
Apr-08
Jul-0
8
Oct-08
Jan-09
Apr-09
Jul-0
9
Oct-09
Jan-10
Apr-10
Jul-1
0
Oct-10
Jan-11
Latvia Lithuania Estonia
60
80
100
120
140
160
180
200
220
Jan-08
Apr-08
Jul-0
8
Oct-08
Jan-09
Apr-09
Jul-0
9
Oct-09
Jan-10
Apr-10
Jul-1
0
Oct-10
Jan-11
Poland CzechHungary Slovenia
60
80
100
120
140
160
180
200
220
Jan-08
Apr-08
Jul-0
8
Oct-08
Jan-09
Apr-09
Jul-0
9
Oct-09
Jan-10
Apr-10
Jul-1
0
Oct-10
Jan-11
Bulgaria SerbiaCroatia Romania
60
80
100
120
140
160
180
200
220
Jan-08
Apr-08
Jul-0
8
Oct-08
Jan-09
Apr-09
Jul-0
9
Oct-09
Jan-10
Apr-10
Jul-1
0
Oct-10
Jan-11
AlbaniaBiHFYR Macedonia
60
80
100
120
140
160
180
200
220
Jan-08
Apr-08
Jul-0
8
Oct-08
Jan-09
Apr-09
Jul-0
9
Oct-09
Jan-10
Apr-10
Jul-1
0
Oct-10
Jan-11
KazakhstanUkraineRussiaTurkey
60
80
100
120
140
160
180
200
220
Jan-08
Apr-08
Jul-0
8
Oct-08
Jan-09
Apr-09
Jul-0
9
Oct-09
Jan-10
Apr-10
Jul-1
0
Oct-10
Jan-11
ArmeniaAzerbaijanMoldova
Source: National authorities via CEIC data service.
Foreign currency private sector credit, amounts outstanding (FX adjusted). January 2008 = 100
70
90
110
130
150
170
190
Jan-08
Apr-08
Jul-0
8
Oct-08
Jan-09
Apr-09
Jul-0
9
Oct-09
Jan-10
Apr-10
Jul-1
0
Oct-10
Jan-11
Latvia Lithuania Estonia
50
70
90
110
130
150
170
190
Jan-08
Apr-08
Jul-0
8
Oct-08
Jan-09
Apr-09
Jul-0
9
Oct-09
Jan-10
Apr-10
Jul-1
0
Oct-10
Jan-11
Poland CzechHungary Slovenia
70
90
110
130
150
170
190
Jan-08
Apr-08
Jul-0
8
Oct-08
Jan-09
Apr-09
Jul-0
9
Oct-09
Jan-10
Apr-10
Jul-1
0
Oct-10
Jan-11
Bulgaria SerbiaCroatia Romania
70
90
110
130
150
170
190
Jan-08
Apr-08
Jul-0
8
Oct-08
Jan-09
Apr-09
Jul-0
9
Oct-09
Jan-10
Apr-10
Jul-1
0
Oct-10
Jan-11
AlbaniaBiHFYR Macedonia
70
90
110
130
150
170
190
Jan-08
Apr-08
Jul-0
8
Oct-08
Jan-09
Apr-09
Jul-0
9
Oct-09
Jan-10
Apr-10
Jul-1
0
Oct-10
Jan-11
Kazakhstan UkraineRussia Turkey
70
120
170
220
270
Jan-08
Apr-08
Jul-0
8
Oct-08
Jan-09
Apr-09
Jul-0
9
Oct-09
Jan-10
Apr-10
Jul-1
0
Oct-10
Jan-11
ArmeniaAzerbaijanMoldova
/1Composition of assumed FX Baskets (€ :$ weights): 100:0 for Bulgaria, Latvia, Lithuania, Poland, Serbia; 90:10 for Croatia and Romania; 50:50 for Albania, Armenia, BiH, Czech Republic, Estonia, FYR Macedonia, Georgia, Hungary, Moldova and Turkey; 20:80 for Ukraine; 15:85 for Russia, 10:90 for Kazakhstan, 0:100 for Azerbaijan and Tajikistan and 30:40:30 as a €-$-RUB basket for Belarus.
Source: National authorities via CEIC data service.
28