Embed Size (px)
Citation preview
1
Regional Economic Prospects in
EBRD Countries of Operations: January 20141
EBRD Office of the Chief Economist
Overview
Slow recovery ahead
Since our forecast in November 2013, the recovery has gained further momentum in
advanced economies, including the United States and the Eurozone. But capital
outflows from emerging markets continued and for the first time since 2011 net
private capital flows turned negative for the region as a whole in the third quarter.
These outflows are likely to persist, as monetary conditions in the United States are
expected to be gradually tightened.
On balance, the outlook for growth in the transition region has remained largely
unchanged. The region is expected to grow at 2.7 per cent in 2014 compared with 2.0
per cent in 2013, broadly in line with our November forecast. For sustained recovery
to take hold, countries in the region need to resume structural reforms and tackle the
persistent legacies of the crisis, including high rates of non-performing loans and
long-term unemployment. In the new global environment of greater differentiation
among emerging markets, sound domestic policies will play a decisive role in
supporting investor confidence and growth.
Regional overview
Growth across the transition region as a whole decelerated from 2.6 per cent in
2012 to 2 per cent in 2013, according to preliminary estimates. This primarily
reflects a slowdown in Russia, Eastern Europe and Caucasus (EEC) and Southern and
Eastern Mediterranean (SEMED).
At the same time, growth picked up in the countries with closest links to the
Eurozone. Preliminary data suggest that output in the single currency area expanded
in both the second and the third quarters of 2013, as recovery gained momentum in
advanced countries more broadly, including in the United States and Japan.
Helped by the improving external environment and stronger demand for
exports, growth accelerated further in the third quarter in Central Europe and
the Baltics (CEB). Growth picked up to around 2 per cent in annualised terms in
Poland and Hungary in the third quarter, and Latvia and Lithuania remained growth
leaders among European Union countries. On 1 January 2014 Latvia also became the
fourth country in the region to join the euro single currency area, having successfully
1 This document is provided as a companion to the EBRD’s growth forecasts for its countries of
operations, which are released three times a year. For more comprehensive coverage of economic
policies and structural changes, the reader is referred to the EBRD’s Transition Report 2013 as well as
country strategies and updates and statistical series on economic and structural reform variables, which
are all available on the EBRD’s website (www.ebrd.com).
2
met the qualification criteria. Overall, average growth in CEB in 2013 remained
broadly unchanged from 2012 as the slowdown of late 2012 and early 2013 was offset
by the acceleration in the second half of the year; however, Croatia and Slovenia
remained in recession. The latest recovery has been driven mainly by stronger export
performance, while domestic consumption and investment growth remains slow.
All south-eastern Europe (SEE) countries that were in recession in 2012
recorded positive growth in 2013. These include Bosnia and Herzegovina, FYR
Macedonia, Montenegro and Serbia, while growth in Romania is estimated to have
accelerated to 2.5 per cent. As a result, average growth in the region picked up
markedly, from 0.4 per cent in 2012 to an estimated 2 per cent in 2013. Stronger
export performance and a better harvest have been important drivers of recovery in
these economies. However, unemployment remains high across the region.
Russia’s growth remained low. Commodity prices no longer provide a boost to the
economy and increasingly limit the fiscal policy room: the average annual price of
Urals brand of oil declined in 2013, by about 3 per cent, after years of almost
uninterrupted increases. Further, investment activity has remained subdued even
though the economy works close to capacity, limiting current and future potential
growth.
Weak external demand and low investment activity weighed on growth in
Eastern Europe and Caucasus (EEC). Ukraine has been in recession since mid-
2012, exacerbated by domestic policy uncertainty. Growth has slowed down
considerably in Armenia, Belarus and Georgia but accelerated in Azerbaijan and
Moldova, supported by stabilised oil output and fiscal stimulus measures in the former
and a strong harvest in the latter.
Growth remained strong in Central Asian countries. Large new mining and
hydrocarbon extraction projects contributed to growth in Kazakhstan, Mongolia and
Turkmenistan. In the Kyrgyz Republic growth rebounded strongly following last
year’s disruption at the country’s largest gold mine. Remittances from Russia to the
Kyrgyz Republic, Tajikistan and Uzbekistan continued to grow, notwithstanding
Russia’s slowdown, providing an important source of external financing and
consumer demand.
Growth in Turkey remained relatively strong, despite volatility in the financial
markets. Government spending was the major driver of growth in the first half of the
year. As it slowed down in the second half of the year, consumption and private
investment picked up, the latter for the first time since the third quarter of 2011. They
were boosted by monetary expansion with interbank rates averaging 5.7 per cent in
the first half of 2013, 1.5 percentage points below inflation. At the same time, the
Turkish lira depreciated by around 20 per cent against the US dollar over the course of
2013, first following US Fed’s announcement of forthcoming tapering and then again
in December, amidst heightened political uncertainty.
Recovery in the South-eastern Mediterranean (SEMED) has been slow,
constrained by political and policy uncertainty in Tunisia and Egypt, the region’s
largest economy. Export receipts have declined across the region. At the same time
3
growth in Morocco accelerated markedly in 2013 reflecting a strong harvest, and
increased FDI thanks to a relatively more favourable policy environment.
In line with global trends, inflation rates continued declining in most countries (with the notable exception of Egypt). Lower inflation reflects weaker demand
pressures against the background of economic slowdown with high unemployment as
well as lower prices of agricultural and energy commodities. Administrative
reductions in utility tariffs in a number of countries also contributed to lower inflation.
They may, however, undermine the attractiveness of investments in the utilities
sectors in the longer term. In many CEB and SEE countries the rates of inflation
dropped to below one per cent, pointing to a possibility of deflation, which would
exacerbate the burden of servicing corporate and consumer debt. Inflation has already
turned negative in Bosnia and Herzegovina, Bulgaria and Latvia.
Boosting longer-term prospects
For a sustained recovery to take hold, the region needs to reignite structural
reforms and deal with the persistent legacy of the crisis. Priority areas include
deepening energy sector reforms, phasing out unsustainable subsidy schemes and cuts
in administrative prices below long-term cost recovery levels, reducing barriers to
trade, development of deeper local capital markets, ensuring long-term sustainability
of pension systems and reinvigorating privatisations with a view to boost economies’
long-term competitiveness.
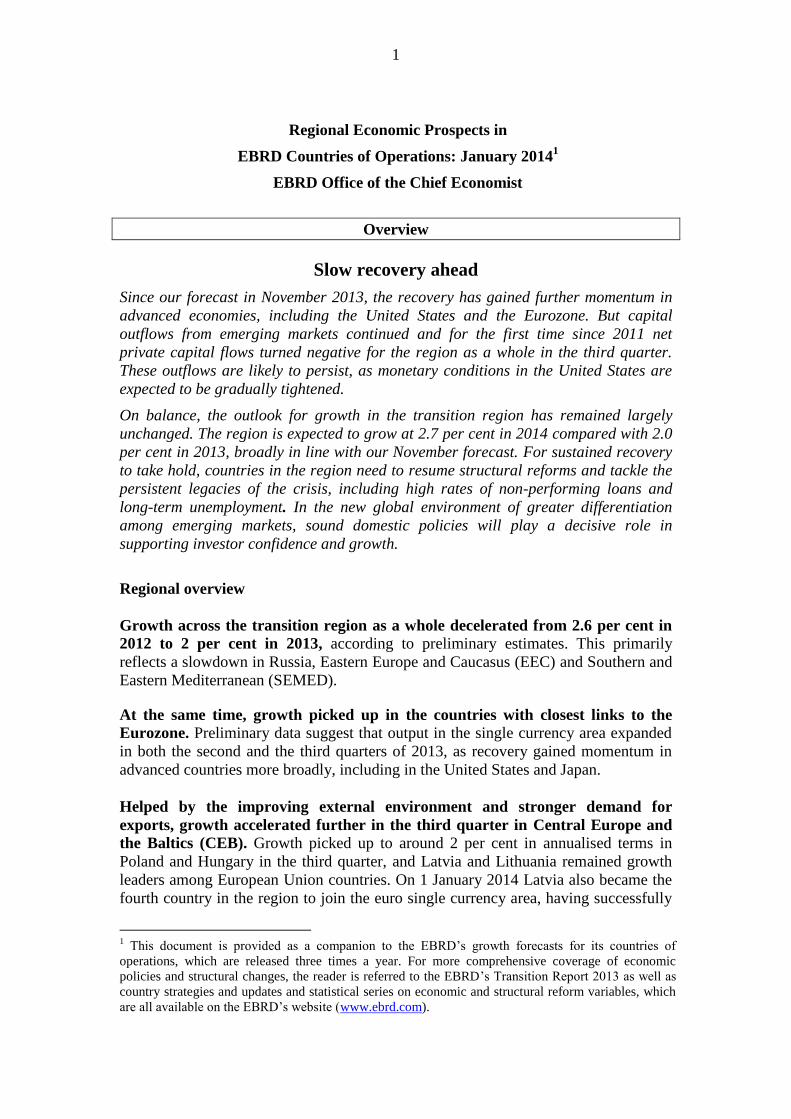
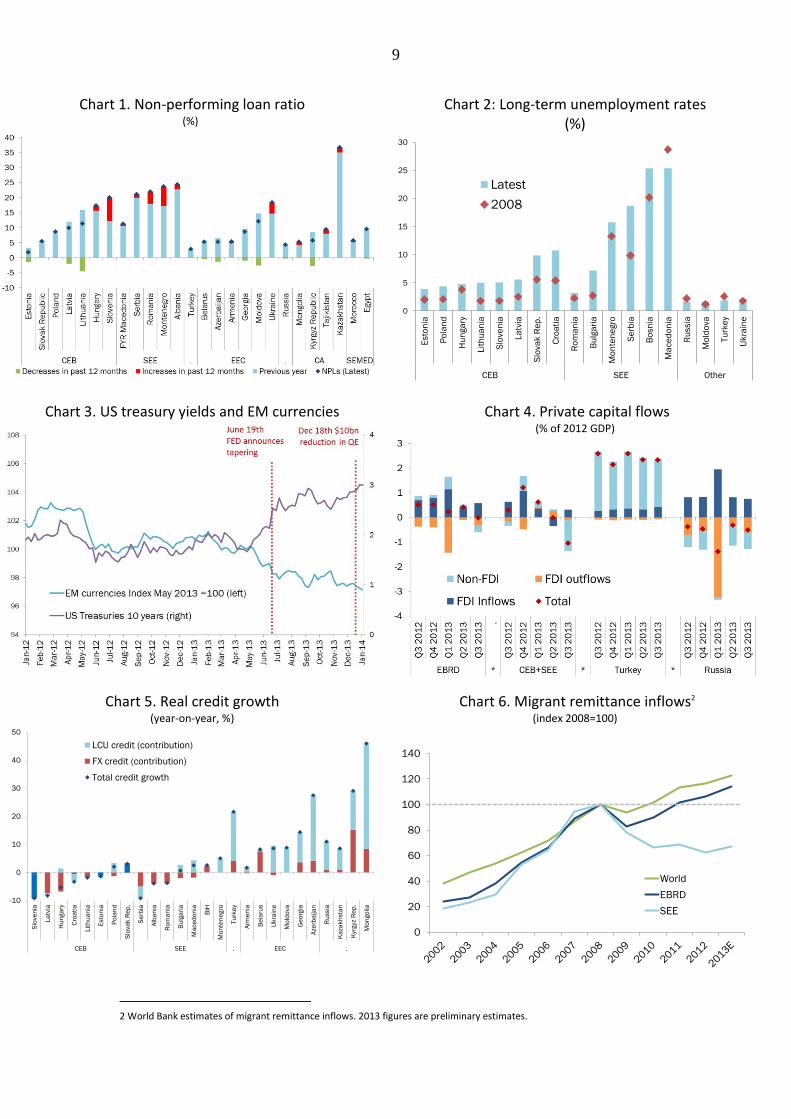
The overhang of non-performing loans (NPLs) and entrenched long-term
unemployment are key impediments to recovery. The estimate of NPLs in Slovenia
has been revised upwards significantly following the recent bank asset quality review,
to around 20 per cent of total loans. NPL ratios continued rising in Hungary,
Kazakhstan and most SEE countries. All these countries and Ukraine now have NPL
ratios close to 20 per cent, and over 30 per cent in the case of Kazakhstan (Chart 1).
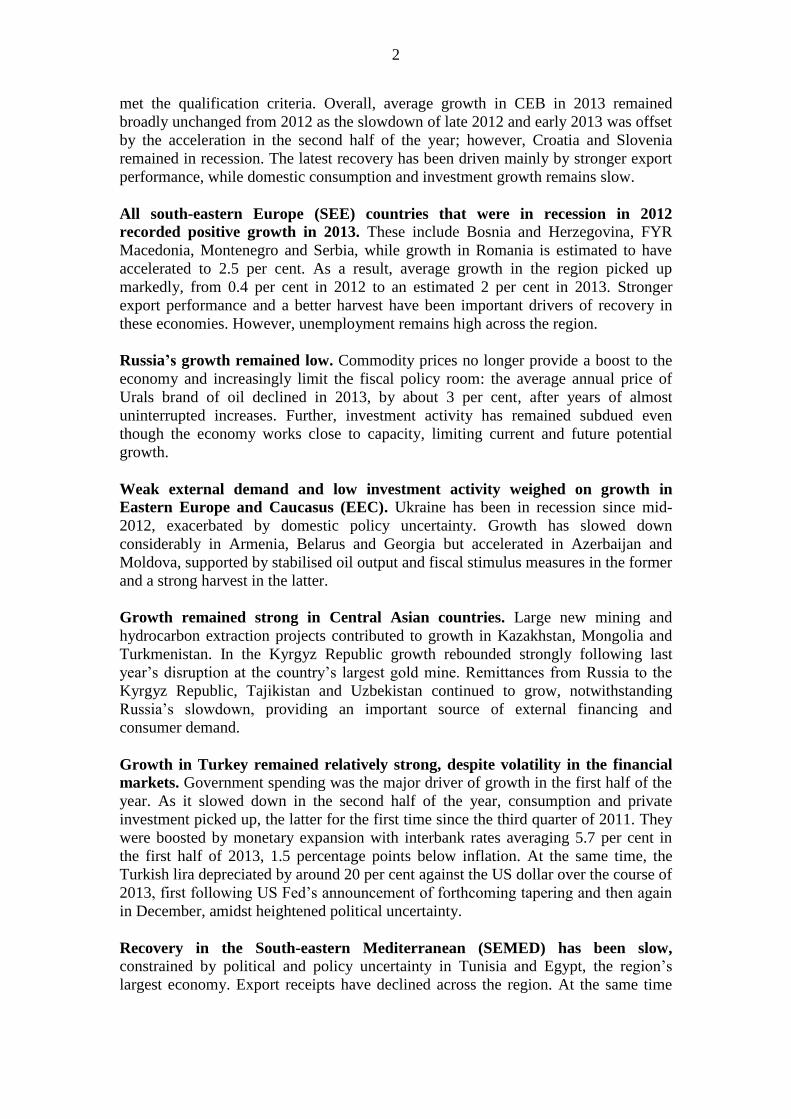
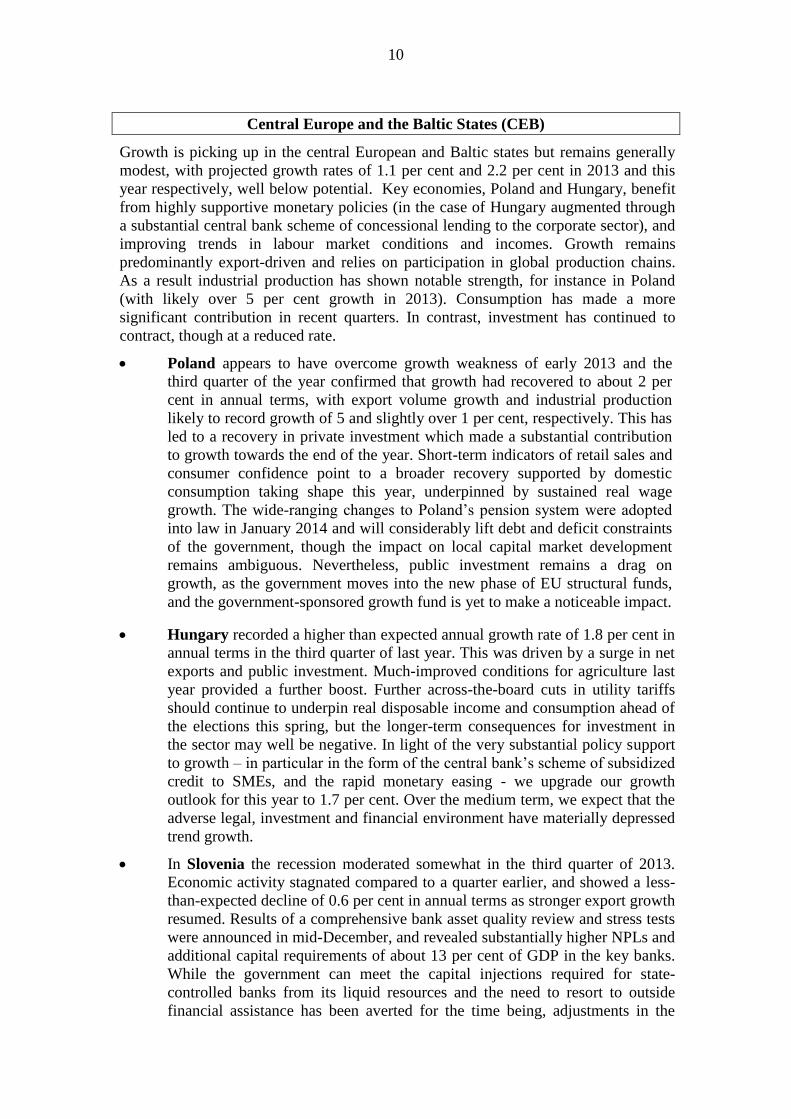
Long-term unemployment rates are on average 3 to 4 percentage points higher
than before the crisis in CEB and SEE countries (Chart 2). They now stand at 6 per
cent on average in CEB and at 16 per cent in the SEE region. A particular concern is
the widespread rise in the share of the long-term unemployed – those of work for
more than 12 months – except in the Baltic States, where long-term unemployment
has declined since 2011.
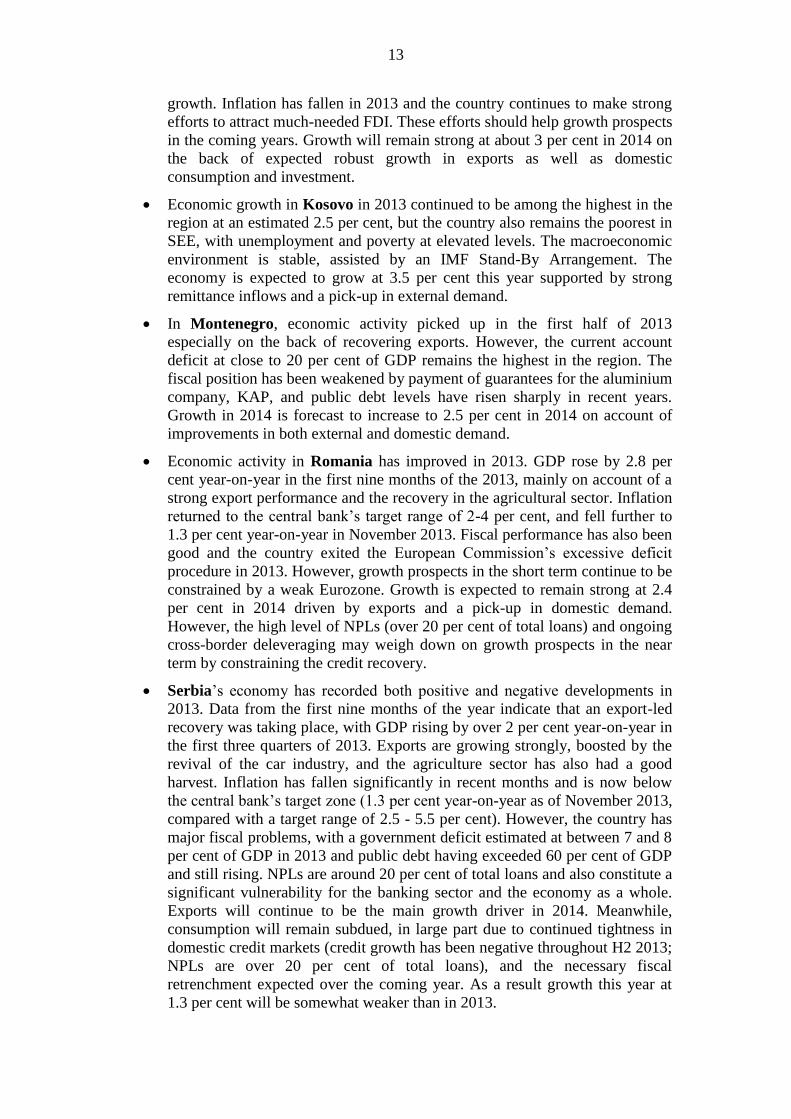
Capital flows
Total private capital flows for the transition region as a whole turned negative in
the third quarter, for the first time in two years. Non-FDI (portfolio) capital
outflows from the CEB and SEE regions turned negative and FDI inflows were not
sufficient to compensate, as they did jointly in the past, for ongoing cross-border bank
deleveraging. This resulted in net outflows from CEB and SEE regions of around one
per cent of annual GDP in the third quarter of 2013 (Chart 3). Currencies and stock
markets in the transition region continued experiencing downward pressures.
The outflows mirrored broader trends in the emerging markets brought about
by increased expectations of monetary tightening in the United States. Emerging
4
market currencies have been by and large under pressure since June 2013 when the
U.S. Federal Reserve indicated that it would reduce its monthly purchases of assets
from the level of US$ 85 billion, while long-term U.S. treasury yields have continued
rising (Chart 4). The start of the tapering itself was announced more than half a year
later, on 18 December 2013. As it was modest in size (US$ 10 billion) and largely
anticipated, it did not have a major impact on market trends.
Deleveraging and de-dollarisation
Cross-border deleveraging in the transition region appears to have intensified
again. In particular, the speed of withdrawal of funds by foreign banks increased in
most CEB and SEE countries. Continued deleveraging is delaying the resumption of
credit growth: as in previous quarters, real credit growth remained negative or near-
zero across the CEB and SEE regions. In Turkey, EEC and Central Asia credit to the
private sector continued expanding.
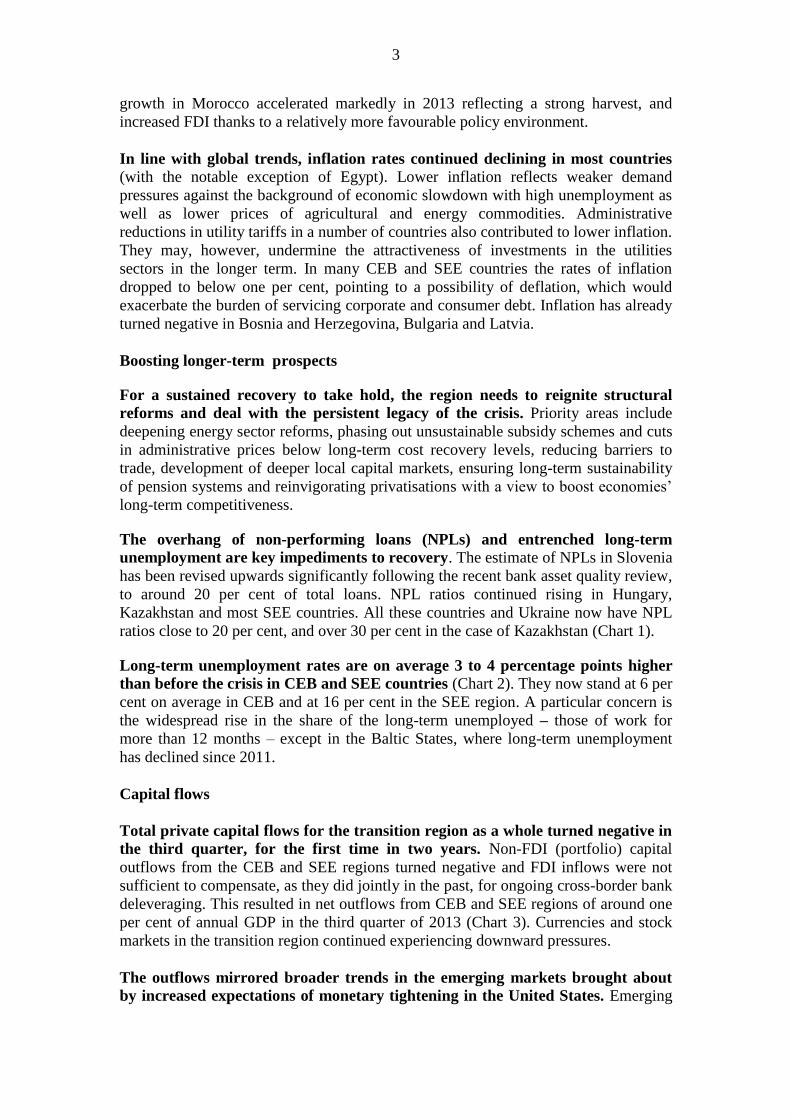
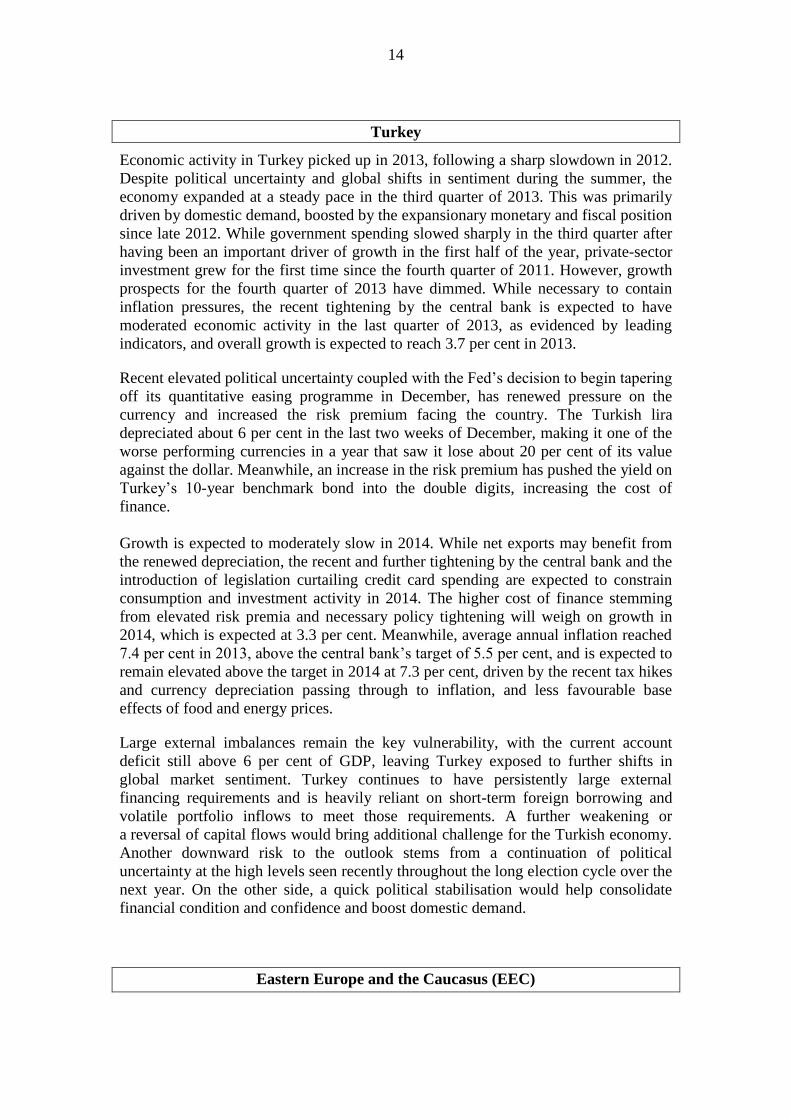
In countries with a positive credit growth, local-currency denominated loans
have been the main driver (with a notable exception of Belarus). A number of CEB
and SEE countries including Hungary, Poland, Bulgaria and FYR Macedonia also
witnessed welcome growth in local currency lending, while deleveraging manifested
itself primarily in a reduced volume of foreign currency credit (Chart 5). A number of
factors contributed to this trend:
Decreasing interest rate differentials due to lower inflation and increasing
international risk appetite
Stricter lending standards for foreign currency loans to unhedged borrowers
(for example, in Poland)
Greater reliance on domestic funding in the light of continued deleveraging
Certain government-subsidised lending programmes (such as the Funding for
Growth programme in Hungary which envisages zero-interest Central Bank
funding to banks to on-lend to small and medium-sized enterprises). At the
same time, such programmes may have distortive effects on allocation of
capital in the economy.
Remittance flows
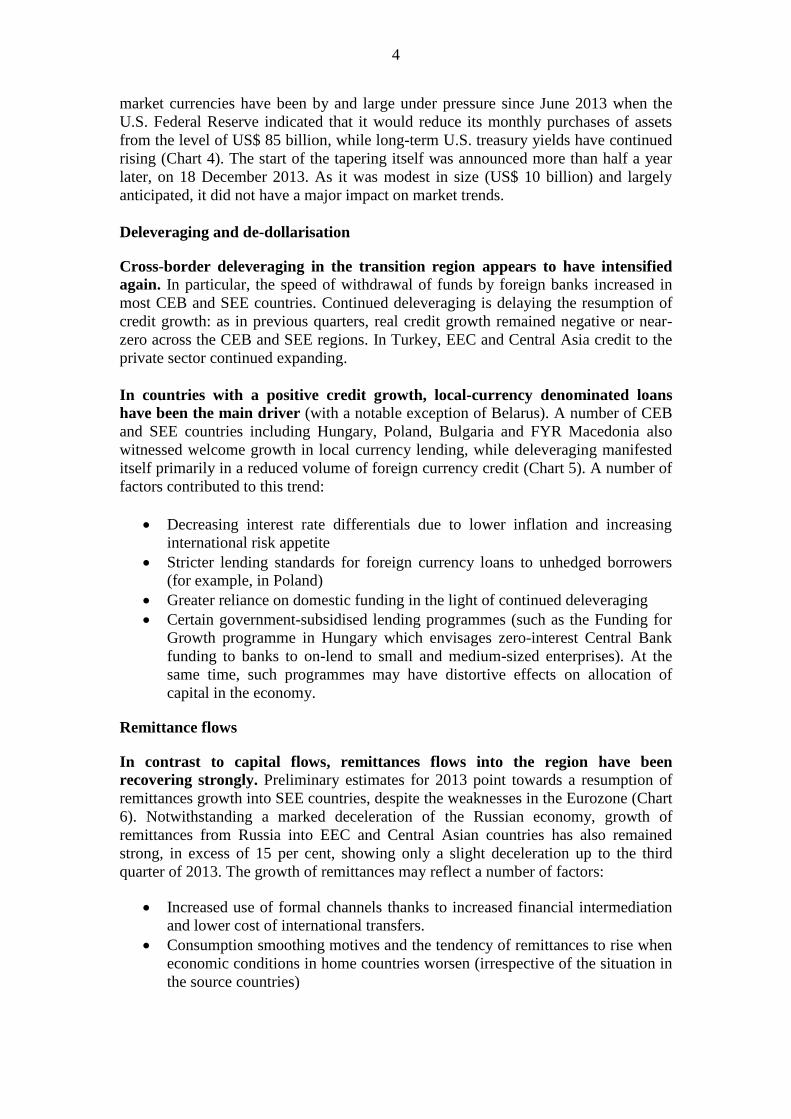
In contrast to capital flows, remittances flows into the region have been
recovering strongly. Preliminary estimates for 2013 point towards a resumption of
remittances growth into SEE countries, despite the weaknesses in the Eurozone (Chart
6). Notwithstanding a marked deceleration of the Russian economy, growth of
remittances from Russia into EEC and Central Asian countries has also remained
strong, in excess of 15 per cent, showing only a slight deceleration up to the third
quarter of 2013. The growth of remittances may reflect a number of factors:
Increased use of formal channels thanks to increased financial intermediation
and lower cost of international transfers.
Consumption smoothing motives and the tendency of remittances to rise when
economic conditions in home countries worsen (irrespective of the situation in
the source countries)
5
Remittances sent through informal channels and saved entering official
estimates with a delay, at the point when they are actually spent. An increase
in official estimates in remittances may thus in part reflect drawing down of
such savings during economic downturn.
Comparative resilience of Russia’s services and construction sectors, which
are the main employers of migrants.
Outlook
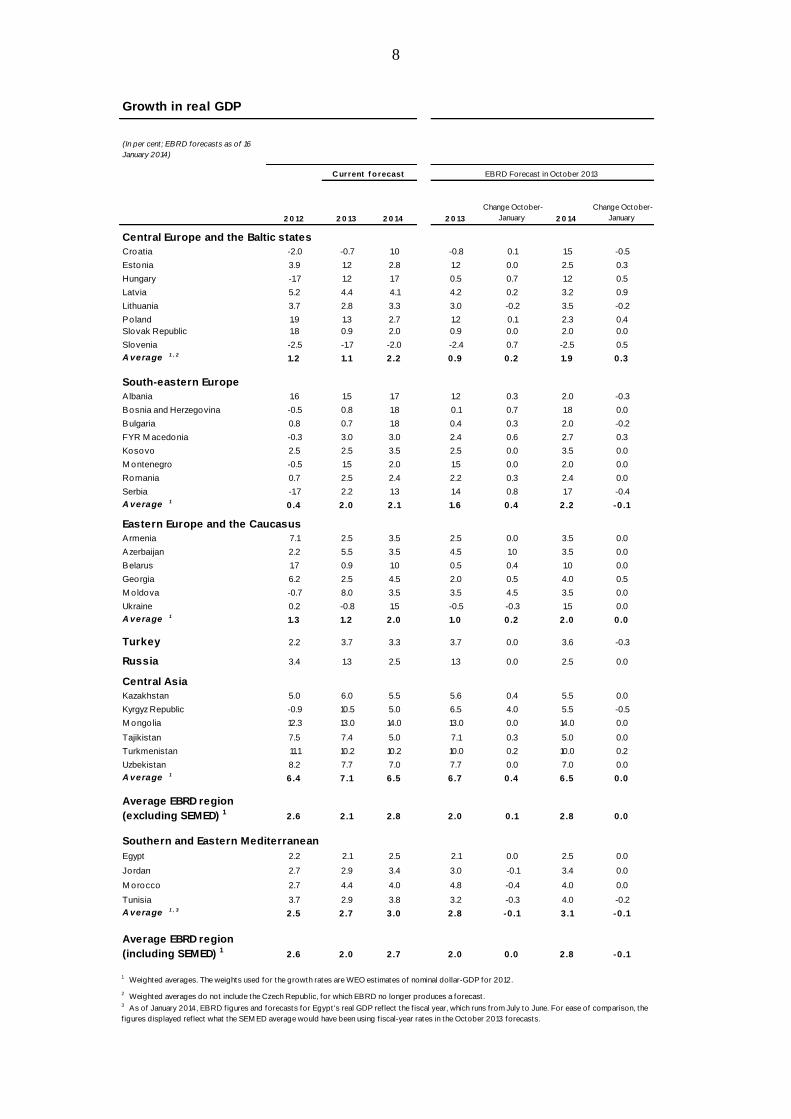
Growth in the transition region is expected to recover modestly to 2.7 per cent in
2014 from 2.0 per cent in 2013. This is about the same as our November forecast for
2014, which stood at 2.8 per cent. The revision is largely driven by lower growth
expectations for Turkey, mostly offset by expectations of a quicker recovery in the
CEB region.
The external environment is expected to be improving slowly but will remain
weak overall. The projections assume a slow and uneven recovery in the Eurozone
and a deceleration in emerging markets, partly offset by a stronger outlook for the
United States and Japan:
Recent data point towards the return of growth in the single currency area,
even though the headline number is likely to be negative for 2013 as a whole.
Various policy decisions, including European Central Bank policies and steps
towards the establishment of a banking union, have reduced the probability of
a further substantial deterioration of the crisis.
Growth has also picked up in the US, Japan and other advanced economies.
Output in the US expanded at an annualised rate of over 4 per cent in the third
quarter; employment has been steadily growing and is now only one per cent
below the pre-crisis level, and consumer confidence is the highest since 2008.
As the recovery takes hold and US monetary policy is gradually tightened,
emerging markets are likely to continue receiving lower inflows of capital.
Positive developments in the advanced economies are likely to be partially
offset by the continued deceleration in major emerging markets. Growth in
China slowed down to 7.7 per cent year-on-year in the first three quarters of
2013 and may decelerate further as the authorities put increased emphasis on
rebalancing of the economy away from strong reliance on investment and net
exports and towards domestic consumption.
Under the baseline scenario, the negative impact of the Eurozone crisis on the
transition region should continue to decrease in magnitude, with stronger export
demand, stronger remittances growth and milder contraction of cross-border lending.
The global trade deal signed in Bali in December 2013, the first one since the
establishment of the World Trade Organization in 1994, may over time give further
boost to growth in the region and globally, provided the agreed trade facilitation
measures are effectively implemented.
At the same time, growth in countries most closely integrated with the Euro area
will remain modest. Given low domestic savings rates and underdeveloped local
capital markets in CEB and SEE countries, the recent reduction in foreign funding is
6
unlikely to be swiftly offset by funding from local sources. This constrains potential
investment growth and hinders long-term growth prospects. In addition, cross-border
bank deleveraging pressures may intensify further if the Eurozone-wide stress tests
reveal significant recapitalisation needs of major banking groups operating in the CEB
and SEE countries.
In the environment of greater differentiation among emerging markets, domestic
policies will play a crucial role in supporting investor confidence and growth.
Overall, the CEB region is expected to grow at 2.2 per cent this year. The rate
of growth is thus expected to almost double compared with the rates seen in
2012 and 2013, as recovery finally takes hold in Croatia and gains momentum
in Hungary, Poland and the Slovak Republic. At the same time, growth
remains well below potential and Slovenia is expected to remain in recession
under the burden of high indebtedness in the corporate sector and the
additional need for bank recapitalisation.
Recovery in SEE will continue but growth rates will remain modest overall.
In Kosovo, the poorest economy in the region, growth is expected to reach 3.5
per cent.
Economic growth in Russia will only partially recover in 2014, to 2.5 per
cent. This assumes a moderate growth of government spending, including
increased outlays on large public infrastructure projects. At the same time,
structural reforms and improvements in the overall business environment are
needed to boost investment and lift Russia’s growth above 2.5 per cent per
annum, the new official government estimate of the long-term potential
growth rate.
Growth in EEC is likely to accelerate. Ukraine is expected to exit recession
after virtually no growth in 2012 and an output contraction in 2013. However,
the economy’s medium-term prospects remain highly uncertain given large
external imbalances, which in the short term will be partly financed by the
package agreed with Russia. Growth in other economies is expected at the
level of 3 to 4 per cent with the exception of Belarus, where growth remains
constrained by high external vulnerabilities.
Growth in Central Asia will remain relatively strong owing to a number of
large natural resource projects in Kazakhstan, Mongolia and Turkmenistan.
Growth is expected to decelerate somewhat in the Kyrgyz Republic and
Tajikistan on account of weaker demand and lower expected growth of
remittances from Russia.
Growth in Turkey is likely to moderate somewhat to 3.3 per cent in 2014.
Recent and further monetary tightening and higher risk premia will increase
the cost of finance and weigh on growth performance, while still high current
account deficit (currently above 6 per cent of GDP) leaves the economy
vulnerable to further shifts in global market sentiment. Nevertheless, domestic
demand is still expected to grow, albeit at a slower pace, and net exports may
benefit from the recent depreciation of the currency.
The SEMED region is likely to grow somewhat faster in 2014. Growth is
expected to accelerate to a still modest 3.0 per cent in 2014 but is subject to a
high degree of uncertainty as all countries in the region remain vulnerable to
external shocks.
7
Risks to the outlook
The economic outlook in the region remains highly sensitive to the developments
in the Eurozone. In the (unlikely) downside scenario, the crisis would engulf larger
members of the single currency area, resulting in insolvencies of several major banks
in Europe. In response to these events, parent banks would accelerate withdrawal of
funding from the region, exacerbating the credit crunch and triggering recession in
much of the emerging Europe. This downside external scenario has remained largely
unchanged since October 2011, but its perceived likelihood has been diminishing.
At the same time, the risks of faster deceleration in large emerging markets, and
in particular in China, have increased. China now accounts for between one third
and one half of world-wide increase in value added. The growth rate of the Chinese
economy decelerated from 8-10 per cent over the past decade to 7.7 per cent in the
first three quarters of 2013 and concerns are growing about rapid expansion of bank
and non-bank credit since 2009 and the underlying quality of assets of financial
institutions. A hard landing in China, or a marked deterioration of the situation in the
Eurozone, would likely lead to prolonged market turmoil, a drop in commodity prices
and a lower growth in advanced and emerging economies.
Risks of a fiscal impasse in the United States have diminished significantly. Two
months after the October government shutdown, which lasted for two and a half
weeks, a deal on the extent and composition of fiscal adjustment has been reached. It
foresees a moderate “fiscal squeeze” of around 0.5 per cent of GDP in 2014.
A realisation of downside risks would affect countries in Central and south-
eastern Europe through trade, financial, and commodity price channels. Exports
would be depressed and financial flows disrupted to a much higher extent than under
the baseline assumptions. A sustained drop in commodity prices would hit the
economies of Russia and commodity exporters in Eastern Europe and Central Asia,
with a knock-on effect on other CIS economies via lower remittances and subdued
demand for exports.
8
Growth in real GDP
2 0 12 2 0 13 2 0 14 2 0 13
Change October-
January 2 0 14
Change October-
January
Central Europe and the Baltic states
Croatia -2.0 -0.7 1.0 -0.8 0.1 1.5 -0.5
Estonia 3.9 1.2 2.8 1.2 0.0 2.5 0.3
Hungary -1.7 1.2 1.7 0.5 0.7 1.2 0.5
Latvia 5.2 4.4 4.1 4.2 0.2 3.2 0.9
Lithuania 3.7 2.8 3.3 3.0 -0.2 3.5 -0.2
Poland 1.9 1.3 2.7 1.2 0.1 2.3 0.4
Slovak Republic 1.8 0.9 2.0 0.9 0.0 2.0 0.0
Slovenia -2.5 -1.7 -2.0 -2.4 0.7 -2.5 0.5
A verage 1 , 21.2 1.1 2.2 0.9 0.2 1.9 0.3
A verage 1 , 21.2
South-eastern Europe
Albania 1.6 1.5 1.7 1.2 0.3 2.0 -0.3
Bosnia and Herzegovina -0.5 0.8 1.8 0.1 0.7 1.8 0.0
Bulgaria 0.8 0.7 1.8 0.4 0.3 2.0 -0.2
FYR M acedonia -0.3 3.0 3.0 2.4 0.6 2.7 0.3
Kosovo 2.5 2.5 3.5 2.5 0.0 3.5 0.0
M ontenegro -0.5 1.5 2.0 1.5 0.0 2.0 0.0
Romania 0.7 2.5 2.4 2.2 0.3 2.4 0.0
Serbia -1.7 2.2 1.3 1.4 0.8 1.7 -0.4
A verage 10.4 2.0 2.1 1.6 0.4 2.2 -0.1
Eastern Europe and the Caucasus
Armenia 7.1 2.5 3.5 2.5 0.0 3.5 0.0
Azerbaijan 2.2 5.5 3.5 4.5 1.0 3.5 0.0
Belarus 1.7 0.9 1.0 0.5 0.4 1.0 0.0
Georgia 6.2 2.5 4.5 2.0 0.5 4.0 0.5
M oldova -0.7 8.0 3.5 3.5 4.5 3.5 0.0
Ukraine 0.2 -0.8 1.5 -0.5 -0.3 1.5 0.0
A verage 11.3 1.2 2.0 1.0 0.2 2.0 0.0
Turkey 2.2 3.7 3.3 3.7 0.0 3.6 -0.3
Russia 3.4 1.3 2.5 1.3 0.0 2.5 0.0
Central Asia
Kazakhstan 5.0 6.0 5.5 5.6 0.4 5.5 0.0
Kyrgyz Republic -0.9 10.5 5.0 6.5 4.0 5.5 -0.5
M ongolia 12.3 13.0 14.0 13.0 0.0 14.0 0.0
Tajikistan 7.5 7.4 5.0 7.1 0.3 5.0 0.0
Turkmenistan 11.1 10.2 10.2 10.0 0.2 10.0 0.2
Uzbekistan 8.2 7.7 7.0 7.7 0.0 7.0 0.0
A verage 16.4 7.1 6.5 6.7 0.4 6.5 0.0
Average EBRD region
(excluding SEMED) 12.6 2.1 2.8 2.0 0.1 2.8 0.0
Southern and Eastern Mediterranean
Egypt 2.2 2.1 2.5 2.1 0.0 2.5 0.0
Jordan 2.7 2.9 3.4 3.0 -0.1 3.4 0.0
M orocco 2.7 4.4 4.0 4.8 -0.4 4.0 0.0
Tunisia 3.7 2.9 3.8 3.2 -0.3 4.0 -0.2
A verage 1 , 32.5 2.7 3.0 2.8 -0.1 3.1 -0.1
Average EBRD region
(including SEMED) 12.6 2.0 2.7 2.0 0.0 2.8 -0.1
C urrent f o recast
3 As of January 2014, EBRD f igures and forecasts for Egypt 's real GDP ref lect the f iscal year, which runs from July to June. For ease of comparison, the
f igures displayed ref lect what the SEM ED average would have been using f iscal-year rates in the October 2013 forecasts.
1 Weighted averages. The weights used for the growth rates are WEO est imates of nominal dollar-GDP for 2012.
2 Weighted averages do not include the Czech Republic, for which EBRD no longer produces a forecast.
(In per cent; EBRD forecasts as of 16
January 2014)
EBRD Forecast in October 2013
9
Chart 1. Non-performing loan ratio
(%)
Chart 2: Long-term unemployment rates (%)
Chart 3. US treasury yields and EM currencies
Chart 4. Private capital flows
(% of 2012 GDP)
Chart 5. Real credit growth (year-on-year, %)
Chart 6. Migrant remittance inflows2 (index 2008=100)
2 World Bank estimates of migrant remittance inflows. 2013 figures are preliminary estimates.
0
5
10
15
20
25
30
Esto
nia
Po
lan
d
Hu
nga
ry
Lit
hu
an
ia
Slo
ve
nia
La
tvia
Slo
vak
Re
p.
Cro
ati
a
Ro
ma
nia
Bu
lga
ria
Mo
nte
ne
gro
Se
rbia
Bo
sn
ia
Ma
ce
do
nia
Ru
ssia
Mo
ldo
va
Tu
rke
y
Ukra
ine
CEB SEE Other
Latest
2008
-10
0
10
20
30
40
50
Slo
ve
nia
La
tvia
Hu
nga
ry
Cro
ati
a
Lit
hu
an
ia
Esto
nia
Po
lan
d
Slo
va
k R
ep
.
Se
rbia
Alb
an
ia
Ro
ma
nia
Bu
lga
ria
Ma
ce
do
nia
BiH
Mo
nte
ne
gro
Tu
rke
y
Arm
en
ia
Be
laru
s
Ukra
ine
Mo
ldo
va
Ge
org
ia
Aze
rba
ija
n
Ru
ssia
Ka
zak
hsta
n
Kyr
gyz
Re
p.
Mo
ngo
lia
CEB SEE . EEC .
LCU credit (contribution)
FX credit (contribution)
Total credit growth
0
20
40
60
80
100
120
140
World
EBRD
SEE
10
Central Europe and the Baltic States (CEB)
Growth is picking up in the central European and Baltic states but remains generally
modest, with projected growth rates of 1.1 per cent and 2.2 per cent in 2013 and this
year respectively, well below potential. Key economies, Poland and Hungary, benefit
from highly supportive monetary policies (in the case of Hungary augmented through
a substantial central bank scheme of concessional lending to the corporate sector), and
improving trends in labour market conditions and incomes. Growth remains
predominantly export-driven and relies on participation in global production chains.
As a result industrial production has shown notable strength, for instance in Poland
(with likely over 5 per cent growth in 2013). Consumption has made a more
significant contribution in recent quarters. In contrast, investment has continued to
contract, though at a reduced rate.
Poland appears to have overcome growth weakness of early 2013 and the
third quarter of the year confirmed that growth had recovered to about 2 per
cent in annual terms, with export volume growth and industrial production
likely to record growth of 5 and slightly over 1 per cent, respectively. This has
led to a recovery in private investment which made a substantial contribution
to growth towards the end of the year. Short-term indicators of retail sales and
consumer confidence point to a broader recovery supported by domestic
consumption taking shape this year, underpinned by sustained real wage
growth. The wide-ranging changes to Poland’s pension system were adopted
into law in January 2014 and will considerably lift debt and deficit constraints
of the government, though the impact on local capital market development
remains ambiguous. Nevertheless, public investment remains a drag on
growth, as the government moves into the new phase of EU structural funds,
and the government-sponsored growth fund is yet to make a noticeable impact.
Hungary recorded a higher than expected annual growth rate of 1.8 per cent in
annual terms in the third quarter of last year. This was driven by a surge in net
exports and public investment. Much-improved conditions for agriculture last
year provided a further boost. Further across-the-board cuts in utility tariffs
should continue to underpin real disposable income and consumption ahead of
the elections this spring, but the longer-term consequences for investment in
the sector may well be negative. In light of the very substantial policy support
to growth – in particular in the form of the central bank’s scheme of subsidized
credit to SMEs, and the rapid monetary easing - we upgrade our growth
outlook for this year to 1.7 per cent. Over the medium term, we expect that the
adverse legal, investment and financial environment have materially depressed
trend growth.
In Slovenia the recession moderated somewhat in the third quarter of 2013.
Economic activity stagnated compared to a quarter earlier, and showed a less-
than-expected decline of 0.6 per cent in annual terms as stronger export growth
resumed. Results of a comprehensive bank asset quality review and stress tests
were announced in mid-December, and revealed substantially higher NPLs and
additional capital requirements of about 13 per cent of GDP in the key banks.
While the government can meet the capital injections required for state-
controlled banks from its liquid resources and the need to resort to outside
financial assistance has been averted for the time being, adjustments in the

11
banking sector will likely continue to weigh on private sector activity. Under
EU state aid rules the two largest banks will need to engage in considerable
deleveraging, and foreign bank subsidiaries are likely to continue to withdraw
funding at a high pace. Comprehensive corporate debt restructuring is
encouraged through a new legal framework, though given extensive cross-
ownership linkages, this will further weigh on domestic investment sentiment.
Domestic consumption remains similarly depressed and the repair of bank
balance sheets will extend the recession well into 2014. Yet, the better than
expected export performance leads us to moderate our expectation for
contraction in both 2013 and this year.
In the Slovak Republic growth expectations remain unchanged, with the 2 per
cent growth forecast for 2014 remaining well below the more buoyant export-
led growth seen in 2010-11. Gross investment continued to contract in 2013,
falling by almost 8 per cent in the first three quarters compared to a year
earlier. Investment in foreign-invested manufacturing firms will remain muted,
though private and public infrastructure investment may recover somewhat.
To date, private income growth and consumption have remained dampened by
persistent high unemployment (which remained 14 per cent in August).
All three Baltic economies witnessed a growth deceleration in 2013, though
Latvia and Lithuania remained the top performers in the EU with estimated
growth rates of 4.4 and 2.8 per cent, respectively. Estonia saw a sharper
deceleration to only 1.2 per cent as a number of public investment projects
came to an end, and the slowdown in key export markets such as Russia and
Finland showed its impact. All three economies should be well poised to
benefit from the slight recovery in European import demand and industrial
production, and will further benefit from gains in export market shares. All
will continue to see robust increases in incomes and private consumption,
making growth reasonably well balanced. Latvia’s adoption of the euro this
month should further bolster sentiment of domestic and foreign investors, and
modestly ease financing costs. There have been minor revisions to forecasts
for Lithuania and Estonia, though a more marked upgrade to 4.1 for Latvia in
2014, given the performance evident late last year.
The recession in Croatia that took hold in 2009 persisted throughout 2013, as
the economy continues to struggle with long-standing problems of
competitiveness, a large public sector and problems with the business
environment. The rate of annual growth in the third quarter of 2013 was -0.6
per cent, a slight improvement on the previous two quarters (-1.5 and -0.7 per
cent in the first and second quarters, respectively) but prospects for this year
are still uncertain, with only a modest return to growth expected. However, EU
membership should enable the country to benefit from full access to the single
market and to substantial EU funds.
South-Eastern Europe (SEE)
The year 2013 saw a pickup in growth in SEE but growth for the region as a whole
was just 2 per cent, as domestic demand remains subdued and foreign direct
investment flows to the region continue to lag well behind levels seen in the pre-
crisis years. Several countries in the region face big fiscal challenges, as the

12
combination of weak growth and the failure to rein in public expenditure has led to
rising fiscal deficits and public debt levels. In the financial sector, deleveraging
pressures persist and the level of non-performing loans is close to, or has exceeded, 20
per cent of total loans in several cases. On the more positive side, exports are
performing well in most cases, boosted by slightly improved economic performance
in the Eurozone and increasing access to non-EU markets. Harvest was strong across
the region. Inflation is low in all countries and has come down significantly in both
Romania and Serbia to below-target range (in both countries it had been for some
time above the central bank’s target). A good agricultural season has contributed to
lower food prices in the region. However, progress in deeper structural reforms
remains hesitant throughout the region .
Economic activity in Albania remained subdued throughout 2013. The
anaemic growth performance reflects primarily the extent of difficulties in the
eurozone and particularly in periphery countries that are Albania’s major
economic partners, but also home-grown problems related to weak
corporate balance sheets and accumulation of government arrears have also
played roles. Public debt is now above 60 per cent of GDP and still rising, and
financial sector vulnerabilities are evident with NPLs of around 25 per cent of
total loans. The new government has committed to tackle investment climate
improvements, and an agreement has been reached with the IMF at staff level
on a new programme, which should help anchor fiscal stability. Only a mild
increase in growth is forecast for this year as expected fiscal tightening under a
new IMF programme will dampen the positive growth contributions from the
continued recovery in both domestic and external demand.
Bosnia and Herzegovina’s economy emerged from recession with GDP
growth estimated at 0.8 per cent in 2013. The country’s economic and
political reform programme is stalled and relations with the EU are at a
standstill, which jeopardises further EU funding. At the same time, the
authorities have shown a commitment to targets agreed under the IMF Stand-
By Arrangement, approved in September 2012, with four reviews completed
so far. Economic recovery is expected to continue in 2014 on the back of
strong export growth and a pick-up in domestic consumption. The EU’s freeze
on IPA funds for BiH, however, could have negative implications on
investment this year. The highly challenging political environment presents
further downside risks to the baseline growth scenario.
The economy in Bulgaria showed few signs of a sustained recovery in 2013.
Export performance continued to improve but weak internal demand means
that growth in 2013 is likely to have been slightly lower than the 0.7 per cent
growth recorded in 2012. On the positive side, the fiscal deficit is under
control and public debt is among the lowest in the EU. Inflation remains low
but this reflects to some extent the series of cuts in utility prices over the past
year, which could have negative implications for future investment in the
sector. Growth is expected to pick up this year to about 1.8 per cent driven by
exports and some recovery in domestic private consumption.
Economic performance has improved in FYR Macedonia in 2013. Output
grew on average by 3.4 per cent year-on-year over the first three quarters of
2013 driven primarily by continued strong rise in investment as well as some
recovery of exports. Consumption meanwhile continues to be a drag on
13
growth. Inflation has fallen in 2013 and the country continues to make strong
efforts to attract much-needed FDI. These efforts should help growth prospects
in the coming years. Growth will remain strong at about 3 per cent in 2014 on
the back of expected robust growth in exports as well as domestic
consumption and investment.
Economic growth in Kosovo in 2013 continued to be among the highest in the
region at an estimated 2.5 per cent, but the country also remains the poorest in
SEE, with unemployment and poverty at elevated levels. The macroeconomic
environment is stable, assisted by an IMF Stand-By Arrangement. The
economy is expected to grow at 3.5 per cent this year supported by strong
remittance inflows and a pick-up in external demand.
In Montenegro, economic activity picked up in the first half of 2013
especially on the back of recovering exports. However, the current account
deficit at close to 20 per cent of GDP remains the highest in the region. The
fiscal position has been weakened by payment of guarantees for the aluminium
company, KAP, and public debt levels have risen sharply in recent years.
Growth in 2014 is forecast to increase to 2.5 per cent in 2014 on account of
improvements in both external and domestic demand.
Economic activity in Romania has improved in 2013. GDP rose by 2.8 per
cent year-on-year in the first nine months of the 2013, mainly on account of a
strong export performance and the recovery in the agricultural sector. Inflation
returned to the central bank’s target range of 2-4 per cent, and fell further to
1.3 per cent year-on-year in November 2013. Fiscal performance has also been
good and the country exited the European Commission’s excessive deficit
procedure in 2013. However, growth prospects in the short term continue to be
constrained by a weak Eurozone. Growth is expected to remain strong at 2.4
per cent in 2014 driven by exports and a pick-up in domestic demand.
However, the high level of NPLs (over 20 per cent of total loans) and ongoing
cross-border deleveraging may weigh down on growth prospects in the near
term by constraining the credit recovery.
Serbia’s economy has recorded both positive and negative developments in
2013. Data from the first nine months of the year indicate that an export-led
recovery was taking place, with GDP rising by over 2 per cent year-on-year in
the first three quarters of 2013. Exports are growing strongly, boosted by the
revival of the car industry, and the agriculture sector has also had a good
harvest. Inflation has fallen significantly in recent months and is now below
the central bank’s target zone (1.3 per cent year-on-year as of November 2013,
compared with a target range of 2.5 - 5.5 per cent). However, the country has
major fiscal problems, with a government deficit estimated at between 7 and 8
per cent of GDP in 2013 and public debt having exceeded 60 per cent of GDP
and still rising. NPLs are around 20 per cent of total loans and also constitute a
significant vulnerability for the banking sector and the economy as a whole.
Exports will continue to be the main growth driver in 2014. Meanwhile,
consumption will remain subdued, in large part due to continued tightness in
domestic credit markets (credit growth has been negative throughout H2 2013;
NPLs are over 20 per cent of total loans), and the necessary fiscal
retrenchment expected over the coming year. As a result growth this year at
1.3 per cent will be somewhat weaker than in 2013.
14
Turkey
Economic activity in Turkey picked up in 2013, following a sharp slowdown in 2012.
Despite political uncertainty and global shifts in sentiment during the summer, the
economy expanded at a steady pace in the third quarter of 2013. This was primarily
driven by domestic demand, boosted by the expansionary monetary and fiscal position
since late 2012. While government spending slowed sharply in the third quarter after
having been an important driver of growth in the first half of the year, private-sector
investment grew for the first time since the fourth quarter of 2011. However, growth
prospects for the fourth quarter of 2013 have dimmed. While necessary to contain
inflation pressures, the recent tightening by the central bank is expected to have
moderated economic activity in the last quarter of 2013, as evidenced by leading
indicators, and overall growth is expected to reach 3.7 per cent in 2013.
Recent elevated political uncertainty coupled with the Fed’s decision to begin tapering
off its quantitative easing programme in December, has renewed pressure on the
currency and increased the risk premium facing the country. The Turkish lira
depreciated about 6 per cent in the last two weeks of December, making it one of the
worse performing currencies in a year that saw it lose about 20 per cent of its value
against the dollar. Meanwhile, an increase in the risk premium has pushed the yield on
Turkey’s 10-year benchmark bond into the double digits, increasing the cost of
finance.
Growth is expected to moderately slow in 2014. While net exports may benefit from
the renewed depreciation, the recent and further tightening by the central bank and the
introduction of legislation curtailing credit card spending are expected to constrain
consumption and investment activity in 2014. The higher cost of finance stemming
from elevated risk premia and necessary policy tightening will weigh on growth in
2014, which is expected at 3.3 per cent. Meanwhile, average annual inflation reached
7.4 per cent in 2013, above the central bank’s target of 5.5 per cent, and is expected to
remain elevated above the target in 2014 at 7.3 per cent, driven by the recent tax hikes
and currency depreciation passing through to inflation, and less favourable base
effects of food and energy prices.
Large external imbalances remain the key vulnerability, with the current account
deficit still above 6 per cent of GDP, leaving Turkey exposed to further shifts in
global market sentiment. Turkey continues to have persistently large external
financing requirements and is heavily reliant on short-term foreign borrowing and
volatile portfolio inflows to meet those requirements. A further weakening or
a reversal of capital flows would bring additional challenge for the Turkish economy.
Another downward risk to the outlook stems from a continuation of political
uncertainty at the high levels seen recently throughout the long election cycle over the
next year. On the other side, a quick political stabilisation would help consolidate
financial condition and confidence and boost domestic demand.
Eastern Europe and the Caucasus (EEC)
15
Growth trends in the region have diverged in the past year. Growth in Moldova and
Azerbaijan accelerated in 2013 benefiting, respectively, from a good harvest and from
policy-induced stimulus. Ukraine remained in recession. The economies of Armenia,
Belarus and Georgia slowed down significantly due to subdued investment activity
and weakening consumer spending growth. External demand improved for Moldova
and the three countries of the South Caucasus whereas Ukraine and Belarus saw their
export markets weakening. We expect growth rates across the region to somewhat
converge in 2014 as last year’s laggards will demonstrate modest recovery while
growth leaders will slow down to a lower path.
Armenia’s economy slowed down considerably in 2013 hit by the contraction
of private and public investments and a halt in real consumer spending growth,
which was affected by the hike in energy tariffs. Remittances, which had been
growing fast in the first nine months of 2013, started to slow down by the end
of the year, likely reflecting a certain cooling of construction activity in
Russia. These late-2013 developments impacted upon the annual 2013 growth
rate, which we estimate at approximately 2.5 per cent. At the same time, closer
ties with Russia, progress on structural reforms and planned capital and social
spending increases may spur growth to 3-4 per cent in 2014.
Azerbaijan’s economy accelerated in 2013, boosted by the pre-election fiscal
and monetary stimulus. Oil output stabilized in 2013 after two years of
decline, while the non-oil sector expanded at near double-digit rates,
benefiting from increased public spending and expansion of credit. The
government’s plans to curb stimulus by shrinking the non-oil consolidated
fiscal deficit in 2014 could potentially lead to growth in 2014 in the range of
3-4 per cent.
Growth in Belarus remained lackluster in 2013 reflecting a fall in exports,
volatile economic policies and a lack of structural reforms, which is hindering
competitiveness. Although the export outlook may improve in 2014 on the
account of the trade relations with Russia and of the moderate devaluation of
the currency in 2013, domestic demand will likely slow down as and when the
authorities tighten macroeconomic policies to reduce vulnerabilities. External
risks, which had been rising throughout the last year, eased somewhat after
Russia’s pledge to provide to Belarus a loan which could cover a major
portion of the public external debt repayment in 2014. Our 2014 growth
outlook for Belarus remains at 1 per cent.
In Georgia, after a significant growth slowdown in the first nine months of
2013, early signs of the rebound emerged towards the year-end. Weak
domestic demand was countered by an acceleration of exports growth as
demand from the EU strengthened and Russia continued to reopen access of
Georgian foodstuffs to its market, resulting in a sizable drop in the current
account deficit. Lower political uncertainty following October’s elections,
coupled with prospects of the Association Agreement with the EU and of the
improvement of trade relations with Russia, have paved the way to recovery in
domestic demand, already evident in some pick-up in credit growth. Our
outlook for Georgia is thus moderately upgraded to 4.5 per cent in 2014.
Moldova’s economic growth increased in the third quarter of 2013, supported
by a rebound in harvest and continued expansion in manufacturing and trade.
Investment activity, however, remained subdued, aggravated by a weak
16
business environment and poor corporate governance in banks. Remittances
were growing steadily in the first nine months of the year, although some signs
of a slowdown emerged by year-end. Given the one-off nature of the positive
growth shock in 2013 and volatility in growth rates, short-term prospects are
uncertain. The evolution of remittances and external demand for Moldovan
products will be crucial in 2014. Investor confidence will depend on the
completion of reforms related to the signing of the Association Agreement
with the EU.
In Ukraine, the economy has been in a shallow recession since the second half
of 2012, due to the decline in traditional exports, the contraction of private and
public investments, and weakening growth in consumer spending. Lower
external demand, some temporary trade restrictions by the main trading
partner country, and subdued steel and other commodity prices have led to a
broad contraction in the industrial sector. Investment activity and construction
remain subdued, affected by tight monetary conditions, an unfriendly business
environment and more recently social unrest and political uncertainty. Short-
term external pressures have been relieved for the time being by Russia’s
pledge to cut gas prices for Ukraine by one-third and to provide loans of US$
15 billion, amounting to a total package of about U$20 billion. The announced
cuts in domestic gas tariffs and possible fiscal and monetary loosening in the
run-up to the March 2015 presidential elections may provide a short-lived
boost to the economy. In the absence of comprehensive structural fiscal
transformation such policies could exacerbate the vulnerability of the
stretched public finances and lead to greater macroeconomic volatility over the
medium term. Any boost to growth from the deal with Russia would likely be
offset by the deterioration of private investment. In light of these
uncertainties, we leave our 2014 growth forecast for Ukraine unchanged at 1.5
per cent.
Russia
Economic growth remained subdued in 2013. After growing at the rate of 3 to 5 per
cent in 2010-12, the economy slowed down in the first quarter of 2013, growing at 1.6
per cent year-on-year. In the second and third quarters output increased by only 1.2
per cent year-on-year.
A number of factors contributed to the deceleration. The external environment
remains difficult, as growth in the Eurozone, Russia’s key trading partner, is estimated
to have been negative in 2013 as a whole and the price of oil, Russia’s dominant
export, has declined in year-on-year terms for the first time since the 2008-09 crisis
(Urals brand oil was around three per cent cheaper on average in 2013 compared with
2012). Further, the post-crisis recovery effect has subsided over time while investment
activity has remained subdued, resulting in capacity constraints becoming binding on
the supply side. Against this background, the Ministry of Economic Development
revised the official forecast for the average long-term economic growth rate from 4
per cent to 2.5 per cent per annum.
Net private capital outflows persisted. They fell somewhat from US$ 81 billion in
2011 to US$ 54 billion in 2012 (around 3 per cent of GDP), but the rate of outflow

17
picked up again in the first nine months of 2013 (to US$ 48 billion). The outflows and
a relatively subdued investment activity may in part reflect concerns about the quality
of the overall business environment and effective cost of investment. Against the
background of higher capital outflows from emerging markets more generally and
lower current account surpluses, the rouble has weakened somewhat against the
basket of the euro and the US dollar. Inflation has remained relatively high, at around
6.5 per cent year-on-year.
The slowdown led to mounting pressures to increase government spending. A new
fiscal rule, which came into force in 2013, was designed to make fiscal policy more
conservative by linking budget expenditure to the average historical oil price
calculated over a number of years. The rule might now be relaxed, and part of the
savings in the National Welfare Fund has been earmarked to finance selected
infrastructure projects in the run-up to the 2018 FIFA World Cup as well as to
purchase Ukraine’s Eurobonds.
GDP growth is expected to pick up to only 2.5 per cent in 2014. Russia’s medium-
term outlook remains dependent on commodity prices, particularly oil and gas, while
the growth potential has declined due to low investment and productivity in a
generally weak business environment.
Central Asia
In most of Central Asia, economic growth remained relatively strong, albeit weaker
than in recent years. The deceleration reflects a more difficult external environment,
particularly weaker growth in Russia, and flattening of commodity prices. The
slowdown in Russia may have a further negative impact on growth in this region,
mainly through the impact on remittance flows, which have so far continued growing.
At the same time, certain delays notwithstanding, large natural resource exploration
projects remain broadly on track throughout the region, and are expected to make a
sizable contribution to growth over the medium term.
In Kazakhstan, GDP growth slowed from 7.5 per cent in 2011 to around 5 per
cent in 2012 owing to the more difficult external environment. Growth then
picked up to an estimated 6 per cent in 2013 on the back of strong investment
growth. It is expected to remain around this level in 2014, supported by an
expansion of oil output. The banking sector remains weak, suffering from
overhang of non-performing loans (in excess of 30 per cent of total loans).
Inflation has slowed down somewhat, to 4.8 per cent in December 2013, and
remains broadly within the targeted range.
In the Kyrgyz Republic, growth rebounded strongly after a disruption at the
Kumtor gold mine in early 2012. It is estimated to have reached 10.5 per cent
in 2013, reflecting the base effect, and is expected to moderate to 5 per cent in
2014. Inflation picked up from around 2 per cent in August 2012 to 8 per cent
in summer 2013 but has now moderated to 4.8 per cent due to the slowdown in
food prices.
In Tajikistan, GDP growth remained strong at 7.5 per cent in 2012 and an
estimated 7.4 per cent in 2013. It is expected to moderate somewhat to 5 per
cent in 2014 on account of slowing remittances, which come mainly from

18
Russia. Moreover, the growth outlook in Tajikistan is particularly uncertain
given weaknesses in the banking system. Inflation declined from 7 per cent in
the beginning of the year to 3.4 per cent in November 2013 due to almost flat
food prices.
Turkmenistan continues to experience a strong economic expansion with
GDP growth of 11.1 per cent in 2012 and an estimated 10.2 per cent in 2013,
driven by large public construction projects and increased gas exports to
China. GDP growth is expected to reach 10 per in 2014, as a new gas field
comes on stream, and remain strong over the medium term, supported by
exploration of Turkmenistan’s abundant gas reserves and further
diversification of gas export routes.
Uzbekistan’s GDP growth remained strong at 8.2 per cent in 2012 and 8.1 per
cent in the first nine months of 2013. It was driven by a combination of
increases in public spending, diversification of gas export routes and
accommodating monetary conditions. Growth is expected to slow down
somewhat to around 7 per cent in 2014.
Mongolia continued to benefit from a mining boom, and in July 2013 the first
commercial shipments of copper concentrate departed from Oyu Tolgoi,
expected to become one of the world’s largest copper mines. The economy
grew at the rate of 11.5 per cent year-on-year in the first nine months of 2013,
notwithstanding weaker external demand, decreases in prices of key
commodities and delays at key mining projects. Growth is projected to reach
14 per cent in 2014, as the first phase of Oyu Tolgoi comes fully on stream.
Inflation remained relatively high, at around 12 per cent at end-November
2013 reflecting expansionary fiscal policy and higher import prices.
Southern and Eastern Mediterranean (SEMED)
The SEMED economies continue to face adverse conditions, amid regional turmoil, a
weak external environment, and a heightened political uncertainty in a number of
countries. The increased government spending on social benefits and subsidies in
response to rising social pressures since 2011 has exacerbated fiscal deficits, which
remain high across the board. However, SEMED countries have taken some positive
steps towards reforming expensive subsidy schemes, in particular by raising some
energy prices. In the meantime, pressures on the balance of payments continue to
persist. IMF programmes in place in Jordan, Morocco, and Tunisia continue to
provide buffers against any further deterioration of external conditions while in Egypt
the GCC financial support has eased immediate financing concerns. Meanwhile,
implementing comprehensive reform programmes to restore macroeconomic stability
remains challenging in the SEMED countries, as this requires a broad buy-in from key
stakeholders, which has proved difficult to secure during complex political transitions.
Growth for the region as a whole has been muted in 2013, and expected to pick up
modestly in 2014. In Egypt and Tunisia, economic performance is primarily
dependent on the unravelling domestic and political situation. In Jordan and Morocco,
the external environment will be a key factor in economic recovery.
The recent financial assistance from the Gulf countries has eased immediate
financing concerns in Egypt. The receipt of the financial assistance package of
US$15 billion by the Saudi Arabia, UAE and Kuwait, following the ousting of
19
President Morsi in July, has provided the government some breathing space,
helping to shore up reserves, ease pressure on the currency, and finance parts
of the fiscal deficit. This has prompted S&P to raise Egypt’s sovereign credit
rating by one notch to B-, with a stable outlook. The financial support has also
allowed the government to announce a stimulus plan of US$4.3 billion (1.6
per cent of GDP), mostly directed to infrastructure projects. Meanwhile,
macroeconomic fundamentals remain weak, and key structural reforms are still
needed to boost growth prospects. Output grew by just 2.1 per cent in fiscal
year 2012-13 (which runs from July to June), and forecasted to increase by 2.5
per cent in fiscal year 2013-14. Risks to the outlook remain tilted to the
downside and are mostly associated with the domestic political situation.
Economic developments in Jordan remain weak amid continued regional
turmoil. The conflict in Syria has disrupted trade and resulted in an influx of
over half a million refugees (estimates including nonregistered refugees are
higher), and continues to strain public services and labour market conditions.
In addition, natural gas inflows from Egypt have been severely disrupted since
2011, resulting in imports of expensive fuels, and leading to a significant
deterioration of Jordan’s fiscal and current accounts. Leading indicators
continue to reflect weak economic activity as indicated by the subdued
dynamics of industrial production and tourism. GDP is expected to gradually
recover in the near-term, with output growth projected at 2.9 per cent in 2013
and 3.4 per cent in 2014.
Output in Morocco continued to improve in 2013, with real GDP growth
reaching 4 percent in Q3. This mainly comes on the back of the continued
rebound in the agricultural sector (which accounts for around 13 per cent of
GDP and 40 per cent of employment) while growth in non-agricultural
production slowed. Economic growth is expected to reach 4.4 per cent in
2013, but is expected to slow to 4.0 per cent in 2014 as agriculture growth
normalizes. Meanwhile, inflation remains under control, and Morocco enjoys
the lowest rate in SEMED. Downside risks to the outlook mainly emanate
from external factors related to the recovery of the Eurozone. A period of
prolonged stagnation in the euro area would depress growth prospects, mostly
through their impact on exports, tourism, and remittances.
In Tunisia, recent political and security turmoil has impacted economic
performance. Real GDP slowed to 2.7 per cent in the third quarter of 2013,
down from 3.2 per cent in the second quarter. The slowdown reflects weaker
domestic and external demand, and the adverse impact of continuing social
unrest on production, especially in the mining and energy sectors. Heightened
political uncertainty has dampened business confidence and further weakened
domestic private investment. Renewed protests and labour strikes have
disrupted activity in tourism and manufacturing which were key growth
drivers in the second quarter. As a result, overall growth is expected to reach
only 2.9 per cent in 2013. The balance of payments remains under pressure, on
the back of weak export earnings from the mining and energy sectors as well
as depressed tourist receipts. The recent resolution of the political crisis could
instil some stability which would help the growth rate reach 3.8 per cent in
2014.

20
21
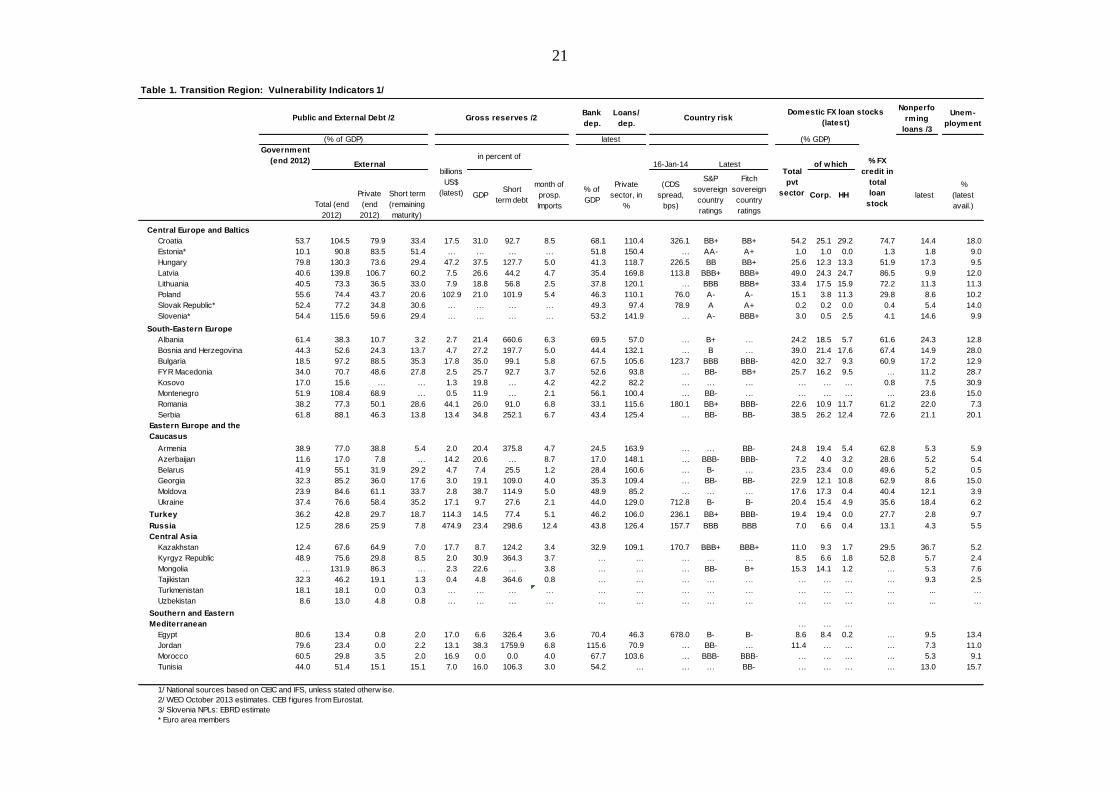
Table 1. Transition Region: Vulnerability Indicators 1/
Bank
dep.
Loans/
dep.
Unem-
ployment
Government
(end 2012) 16-Jan-14
Total (end
2012)
Private
(end
2012)
Short term
(remaining
maturity)
GDPShort
term debt
month of
prosp.
Imports
% of
GDP
Private
sector, in
%
(CDS
spread,
bps)
S&P
sovereign
country
ratings
Fitch
sovereign
country
ratings
Corp. HH latest
%
(latest
avail.)
Central Europe and Baltics
Croatia 53.7 104.5 79.9 33.4 17.5 31.0 92.7 8.5 68.1 110.4 326.1 BB+ BB+ 54.2 25.1 29.2 74.7 14.4 18.0
Estonia* 10.1 90.8 83.5 51.4 … … … … 51.8 150.4 … AA- A+ 1.0 1.0 0.0 1.3 1.8 9.0
Hungary 79.8 130.3 73.6 29.4 47.2 37.5 127.7 5.0 41.3 118.7 226.5 BB BB+ 25.6 12.3 13.3 51.9 17.3 9.5
Latvia 40.6 139.8 106.7 60.2 7.5 26.6 44.2 4.7 35.4 169.8 113.8 BBB+ BBB+ 49.0 24.3 24.7 86.5 9.9 12.0
Lithuania 40.5 73.3 36.5 33.0 7.9 18.8 56.8 2.5 37.8 120.1 … BBB BBB+ 33.4 17.5 15.9 72.2 11.3 11.3
Poland 55.6 74.4 43.7 20.6 102.9 21.0 101.9 5.4 46.3 110.1 76.0 A- A- 15.1 3.8 11.3 29.8 8.6 10.2
Slovak Republic* 52.4 77.2 34.8 30.6 … … … … 49.3 97.4 78.9 A A+ 0.2 0.2 0.0 0.4 5.4 14.0
Slovenia* 54.4 115.6 59.6 29.4 … … … … 53.2 141.9 … A- BBB+ 3.0 0.5 2.5 4.1 14.6 9.9
South-Eastern Europe
Albania 61.4 38.3 10.7 3.2 2.7 21.4 660.6 6.3 69.5 57.0 … B+ … 24.2 18.5 5.7 61.6 24.3 12.8
Bosnia and Herzegovina 44.3 52.6 24.3 13.7 4.7 27.2 197.7 5.0 44.4 132.1 … B … 39.0 21.4 17.6 67.4 14.9 28.0
Bulgaria 18.5 97.2 88.5 35.3 17.8 35.0 99.1 5.8 67.5 105.6 123.7 BBB BBB- 42.0 32.7 9.3 60.9 17.2 12.9
FYR Macedonia 34.0 70.7 48.6 27.8 2.5 25.7 92.7 3.7 52.6 93.8 … BB- BB+ 25.7 16.2 9.5 … 11.2 28.7
Kosovo 17.0 15.6 … … 1.3 19.8 … 4.2 42.2 82.2 … … … … … … 0.8 7.5 30.9
Montenegro 51.9 108.4 68.9 … 0.5 11.9 … 2.1 56.1 100.4 … BB- … … … … … 23.6 15.0
Romania 38.2 77.3 50.1 28.6 44.1 26.0 91.0 6.8 33.1 115.6 180.1 BB+ BBB- 22.6 10.9 11.7 61.2 22.0 7.3
Serbia 61.8 88.1 46.3 13.8 13.4 34.8 252.1 6.7 43.4 125.4 … BB- BB- 38.5 26.2 12.4 72.6 21.1 20.1
Eastern Europe and the
Caucasus
Armenia 38.9 77.0 38.8 5.4 2.0 20.4 375.8 4.7 24.5 163.9 … … BB- 24.8 19.4 5.4 62.8 5.3 5.9
Azerbaijan 11.6 17.0 7.8 … 14.2 20.6 … 8.7 17.0 148.1 … BBB- BBB- 7.2 4.0 3.2 28.6 5.2 5.4
Belarus 41.9 55.1 31.9 29.2 4.7 7.4 25.5 1.2 28.4 160.6 … B- … 23.5 23.4 0.0 49.6 5.2 0.5
Georgia 32.3 85.2 36.0 17.6 3.0 19.1 109.0 4.0 35.3 109.4 … BB- BB- 22.9 12.1 10.8 62.9 8.6 15.0
Moldova 23.9 84.6 61.1 33.7 2.8 38.7 114.9 5.0 48.9 85.2 … … … 17.6 17.3 0.4 40.4 12.1 3.9
Ukraine 37.4 76.6 58.4 35.2 17.1 9.7 27.6 2.1 44.0 129.0 712.8 B- B- 20.4 15.4 4.9 35.6 18.4 6.2
Turkey 36.2 42.8 29.7 18.7 114.3 14.5 77.4 5.1 46.2 106.0 236.1 BB+ BBB- 19.4 19.4 0.0 27.7 2.8 9.7
Russia 12.5 28.6 25.9 7.8 474.9 23.4 298.6 12.4 43.8 126.4 157.7 BBB BBB 7.0 6.6 0.4 13.1 4.3 5.5
Central Asia
Kazakhstan 12.4 67.6 64.9 7.0 17.7 8.7 124.2 3.4 32.9 109.1 170.7 BBB+ BBB+ 11.0 9.3 1.7 29.5 36.7 5.2
Kyrgyz Republic 48.9 75.6 29.8 8.5 2.0 30.9 364.3 3.7 … … … … … 8.5 6.6 1.8 52.8 5.7 2.4
Mongolia … 131.9 86.3 … 2.3 22.6 … 3.8 … … … BB- B+ 15.3 14.1 1.2 … 5.3 7.6
Tajikistan 32.3 46.2 19.1 1.3 0.4 4.8 364.6 0.8 … … … … … … … … … 9.3 2.5
Turkmenistan 18.1 18.1 0.0 0.3 … … … … … … … … … … … … … ... …
Uzbekistan 8.6 13.0 4.8 0.8 … … … … … … … … … … … … … ... …
Southern and Eastern
Mediterranean … … …
Egypt 80.6 13.4 0.8 2.0 17.0 6.6 326.4 3.6 70.4 46.3 678.0 B- B- 8.6 8.4 0.2 … 9.5 13.4
Jordan 79.6 23.4 0.0 2.2 13.1 38.3 1759.9 6.8 115.6 70.9 … BB- … 11.4 … … … 7.3 11.0
Morocco 60.5 29.8 3.5 2.0 16.9 0.0 0.0 4.0 67.7 103.6 … BBB- BBB- … … … … 5.3 9.1
Tunisia 44.0 51.4 15.1 15.1 7.0 16.0 106.3 3.0 54.2 … … … BB- … … … … 13.0 15.7
1/ National sources based on CEIC and IFS, unless stated otherw ise.
2/ WEO October 2013 estimates. CEB figures from Eurostat.
3/ Slovenia NPLs: EBRD estimate
* Euro area members
Country risk
External
Public and External Debt /2
(% of GDP)
Gross reserves /2
billions
US$
(latest)
in percent of
Nonperfo
rming
loans /3
latest
Domestic FX loan stocks
(latest)
(% GDP)
Total
pvt
sector
of whichLatest % FX
credit in
total
loan
stock

22
Table 2. Transition Region: Annual indicators and projections 1/
Fiscal
Balance /4 Net FDI
(Gen. gov; %
of GDP) (% of GDP) (% of GDP)
Forecast 2/ Estimate Forecast 2/ 3/ 3/ 3/ 3/ 3/
2012 2013 2014 2011 2012 2013 2013 2014 2012 2012 2012 2012 2012
Central Europe and Baltics
Croatia -2.0 -0.7 1.0 -0.3 -2.3 -0.1 2.2 2.0 -3.8 -1.2 140.6 -0.2 ... 2.6
Estonia 3.9 1.2 2.8 5.2 4.9 1.7 3.2 2.8 -0.2 0.0 22.2 -1.8 2.5
Hungary -1.7 1.2 1.7 1.3 -2.7 2.9 1.7 2.0 -2.0 2.2 171.2 1.0 2.1
Latvia 5.2 4.4 4.1 5.1 4.6 4.5 0.0 2.0 -1.3 0.0 98.4 -2.5 2.7
Lithuania 3.7 2.8 3.3 5.7 4.0 1.7 1.2 1.8 -3.2 -1.4 126.9 -0.2 0.7
Poland 1.9 1.3 2.7 4.9 0.8 1.3 0.8 2.0 -3.9 -1.1 144.8 -3.7 1.1
Slovak Republic 1.8 0.9 2.0 3.5 0.4 1.2 1.5 1.6 -4.5 -2.7 157.5 2.2 3.2
Slovenia -2.5 -1.7 -2.0 -2.0 -3.3 0.0 1.9 1.5 -3.8 -1.7 123.1 3.3 0.5
South-Eastern Europe
Albania 1.6 1.5 1.7 2.2 1.7 2.7 1.9 2.2 -3.2 -0.1 251.1 -10.5 7.5
Bosnia and Herzegovina -0.5 0.8 1.8 … … … 0.3 0.3 -2.8 -2.0 96.9 -9.4 2.0
Bulgaria 0.8 0.7 1.8 0.6 0.3 0.6 0.5 1.4 -0.8 0.1 53.1 -1.4 3.0
FYR Macedonia -0.3 3.0 3.0 0.9 0.4 1.9 2.8 2.1 -3.9 -2.9 113.9 -3.1 1.0
Kosovo 2.5 2.5 3.5 … … … 2.1 2.0 -2.6 -2.4 61.1 -7.6 4.3
Montenegro -0.5 1.5 2.0 … … … 3.0 2.9 -4.3 -2.5 134.9 -18.3 14.0
Romania 0.7 2.5 2.4 2.1 0.9 2.0 3.4 2.5 -2.5 -0.7 116.1 -4.4 1.7
Serbia -1.7 2.2 1.3 0.7 -2.1 2.6 7.9 5.0 -7.1 -5.1 148.3 -10.6 0.8
Eastern Europe and the Caucasus
Armenia 7.1 2.5 3.5 5.2 6.2 2.4 5.8 3.9 -1.6 -0.6 187.7 -11.3 4.8
Azerbaijan 2.2 5.5 3.5 -3.8 4.3 5.6 2.5 3.8 3.0 3.2 29.0 21.8 1.2
Belarus 1.7 0.9 1.0 0.6 0.0 0.4 18.3 14.5 0.6 2.0 102.7 -2.7 2.1
Georgia 6.2 2.5 4.5 8.5 3.0 4.5 -0.5 4.1 -2.3 0.2 112.5 -11.7 3.9
Moldova -0.7 8.0 3.5 5.8 -2.5 6.7 4.4 4.7 -2.1 -1.3 62.7 -6.8 2.1
Ukraine 0.2 -0.8 1.5 5.0 -2.5 0.3 -0.3 2.6 -4.5 -1.1 84.0 -8.1 3.8
Turkey 2.2 3.7 3.3 5.3 1.4 3.0 7.5 7.3 -1.6 1.9 104.0 -6.2 1.1
Russia 3.4 1.3 2.5 5.1 2.1 1.2 6.8 5.6 -0.2 1.0 33.3 3.5 0.1
Central Asia
Kazakhstan 5.0 6.0 5.5 8.7 4.5 6.7 5.9 5.9 4.5 5.0 46.0 0.3 6.1
Kyrgyz Republic -0.9 10.5 5.0 4.6 8.1 13.1 6.7 5.4 -5.8 -4.8 141.8 -21.8 4.5
Mongolia 12.3 13.0 14.0 20.2 10.6 16.8 10.4 10.6 -7.7 -6.8 159.2 -32.8 43.0
Tajikistan 7.5 7.4 5.0 7.2 7.5 7.4 5.2 4.4 0.5 1.1 128.7 -3.3 2.6
Turkmenistan 11.1 10.2 10.2 … … … 5.7 5.7 6.4 ... 85.9 0.0 8.9
Uzbekistan 8.2 7.7 7.0 8.5 8.2 7.3 11.0 11.0 8.5 8.6 20.8 0.7 1.3
Southern and Eastern Mediterranean
Egypt 2.2 2.1 2.5 3.3 1.5 1.1 6.9 10.4 -10.7 -4.7 356.0 -2.7 1.0
Jordan 2.7 2.9 3.4 3.1 2.2 3.0 5.5 4.0 -8.8 -6.2 251.0 -17.2 4.8
Morocco 2.7 4.4 4.0 4.6 2.3 4.6 2.0 2.5 -7.5 -5.2 215.1 -10.0 2.6
Tunisia 3.7 2.9 3.8 -1.6 4.0 2.6 6.1 5.0 -4.9 -3.1 143.7 -8.0 3.5
1/ EBRD data and projections unless otherw ise stated.
2/ As of January 16, 2014. Figures for Egypt reflect the f iscal year, w hich runs from July to June.
3/ WEO October 2013. CEB figures from Eurostat.
4/ Ukraine: Augmented general government balance: overall government balance includes Naftogaz and other debt-creating f low s.
GG
Debt/rev
enues
(%)
Primary
fiscal
balance to
GDP /4
Current
Account
(year over year
percent change)(Q4 over Q4 percent change)
GDP Growth (end year)
Forecast 2/
(year over year percent change)
GDP Growth Inflation (average)
23
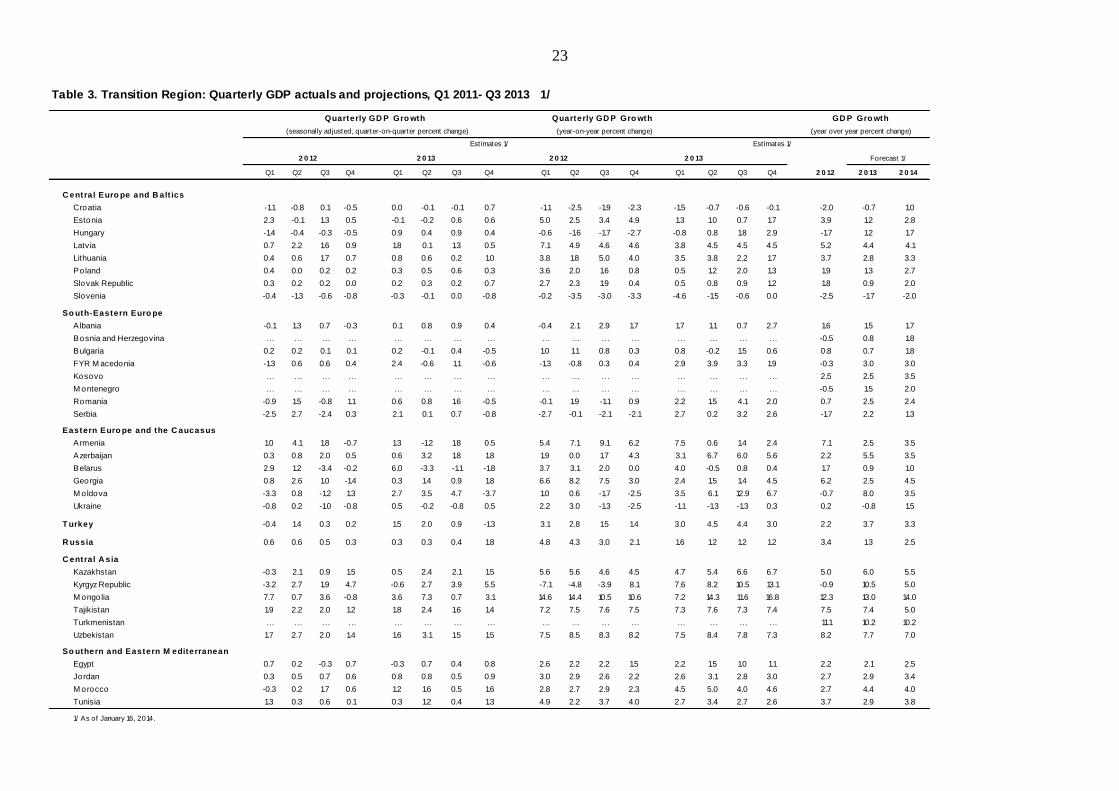
Table 3. Transition Region: Quarterly GDP actuals and projections, Q1 2011- Q3 2013 1/
Estimates 1/ Est imates 1/
Q1 Q2 Q3 Q4 Q1 Q2 Q3 Q4 Q1 Q2 Q3 Q4 Q1 Q2 Q3 Q4 2 0 12 2 0 13 2 0 14
C entral Euro pe and B alt ics
Croatia -1.1 -0.8 0.1 -0.5 0.0 -0.1 -0.1 0.7 -1.1 -2.5 -1.9 -2.3 -1.5 -0.7 -0.6 -0.1 -2.0 -0.7 1.0
Estonia 2.3 -0.1 1.3 0.5 -0.1 -0.2 0.6 0.6 5.0 2.5 3.4 4.9 1.3 1.0 0.7 1.7 3.9 1.2 2.8
Hungary -1.4 -0.4 -0.3 -0.5 0.9 0.4 0.9 0.4 -0.6 -1.6 -1.7 -2.7 -0.8 0.8 1.8 2.9 -1.7 1.2 1.7
Latvia 0.7 2.2 1.6 0.9 1.8 0.1 1.3 0.5 7.1 4.9 4.6 4.6 3.8 4.5 4.5 4.5 5.2 4.4 4.1
Lithuania 0.4 0.6 1.7 0.7 0.8 0.6 0.2 1.0 3.8 1.8 5.0 4.0 3.5 3.8 2.2 1.7 3.7 2.8 3.3
Poland 0.4 0.0 0.2 0.2 0.3 0.5 0.6 0.3 3.6 2.0 1.6 0.8 0.5 1.2 2.0 1.3 1.9 1.3 2.7
Slovak Republic 0.3 0.2 0.2 0.0 0.2 0.3 0.2 0.7 2.7 2.3 1.9 0.4 0.5 0.8 0.9 1.2 1.8 0.9 2.0
Slovenia -0.4 -1.3 -0.6 -0.8 -0.3 -0.1 0.0 -0.8 -0.2 -3.5 -3.0 -3.3 -4.6 -1.5 -0.6 0.0 -2.5 -1.7 -2.0
So uth-Eastern Euro pe
Albania -0.1 1.3 0.7 -0.3 0.1 0.8 0.9 0.4 -0.4 2.1 2.9 1.7 1.7 1.1 0.7 2.7 1.6 1.5 1.7
Bosnia and Herzegovina … … … … … … … … … … … … … … … … -0.5 0.8 1.8
Bulgaria 0.2 0.2 0.1 0.1 0.2 -0.1 0.4 -0.5 1.0 1.1 0.8 0.3 0.8 -0.2 1.5 0.6 0.8 0.7 1.8
FYR M acedonia -1.3 0.6 0.6 0.4 2.4 -0.6 1.1 -0.6 -1.3 -0.8 0.3 0.4 2.9 3.9 3.3 1.9 -0.3 3.0 3.0
Kosovo … … … … … … … … … … … … … … … … 2.5 2.5 3.5
M ontenegro … … … … … … … … … … … … … … … … -0.5 1.5 2.0
Romania -0.9 1.5 -0.8 1.1 0.6 0.8 1.6 -0.5 -0.1 1.9 -1.1 0.9 2.2 1.5 4.1 2.0 0.7 2.5 2.4
Serbia -2.5 2.7 -2.4 0.3 2.1 0.1 0.7 -0.8 -2.7 -0.1 -2.1 -2.1 2.7 0.2 3.2 2.6 -1.7 2.2 1.3
Eastern Euro pe and the C aucasus
Armenia 1.0 4.1 1.8 -0.7 1.3 -1.2 1.8 0.5 5.4 7.1 9.1 6.2 7.5 0.6 1.4 2.4 7.1 2.5 3.5
Azerbaijan 0.3 0.8 2.0 0.5 0.6 3.2 1.8 1.8 1.9 0.0 1.7 4.3 3.1 6.7 6.0 5.6 2.2 5.5 3.5
Belarus 2.9 1.2 -3.4 -0.2 6.0 -3.3 -1.1 -1.8 3.7 3.1 2.0 0.0 4.0 -0.5 0.8 0.4 1.7 0.9 1.0
Georgia 0.8 2.6 1.0 -1.4 0.3 1.4 0.9 1.8 6.6 8.2 7.5 3.0 2.4 1.5 1.4 4.5 6.2 2.5 4.5
M oldova -3.3 0.8 -1.2 1.3 2.7 3.5 4.7 -3.7 1.0 0.6 -1.7 -2.5 3.5 6.1 12.9 6.7 -0.7 8.0 3.5
Ukraine -0.8 0.2 -1.0 -0.8 0.5 -0.2 -0.8 0.5 2.2 3.0 -1.3 -2.5 -1.1 -1.3 -1.3 0.3 0.2 -0.8 1.5
T urkey -0.4 1.4 0.3 0.2 1.5 2.0 0.9 -1.3 3.1 2.8 1.5 1.4 3.0 4.5 4.4 3.0 2.2 3.7 3.3
R ussia 0.6 0.6 0.5 0.3 0.3 0.3 0.4 1.8 4.8 4.3 3.0 2.1 1.6 1.2 1.2 1.2 3.4 1.3 2.5
C entral A sia
Kazakhstan -0.3 2.1 0.9 1.5 0.5 2.4 2.1 1.5 5.6 5.6 4.6 4.5 4.7 5.4 6.6 6.7 5.0 6.0 5.5
Kyrgyz Republic -3.2 2.7 1.9 4.7 -0.6 2.7 3.9 5.5 -7.1 -4.8 -3.9 8.1 7.6 8.2 10.5 13.1 -0.9 10.5 5.0
M ongolia 7.7 0.7 3.6 -0.8 3.6 7.3 0.7 3.1 14.6 14.4 10.5 10.6 7.2 14.3 11.6 16.8 12.3 13.0 14.0
Tajikistan 1.9 2.2 2.0 1.2 1.8 2.4 1.6 1.4 7.2 7.5 7.6 7.5 7.3 7.6 7.3 7.4 7.5 7.4 5.0
Turkmenistan … … … … … … … … … … … … … … … … 11.1 10.2 10.2
Uzbekistan 1.7 2.7 2.0 1.4 1.6 3.1 1.5 1.5 7.5 8.5 8.3 8.2 7.5 8.4 7.8 7.3 8.2 7.7 7.0
So uthern and Eastern M editerranean
Egypt 0.7 0.2 -0.3 0.7 -0.3 0.7 0.4 0.8 2.6 2.2 2.2 1.5 2.2 1.5 1.0 1.1 2.2 2.1 2.5
Jordan 0.3 0.5 0.7 0.6 0.8 0.8 0.5 0.9 3.0 2.9 2.6 2.2 2.6 3.1 2.8 3.0 2.7 2.9 3.4
M orocco -0.3 0.2 1.7 0.6 1.2 1.6 0.5 1.6 2.8 2.7 2.9 2.3 4.5 5.0 4.0 4.6 2.7 4.4 4.0
Tunisia 1.3 0.3 0.6 0.1 0.3 1.2 0.4 1.3 4.9 2.2 3.7 4.0 2.7 3.4 2.7 2.6 3.7 2.9 3.8
1/ As of January 16, 2014.
2 0 122 0 12 Forecast 1/2 0 13 2 0 13
GD P Gro wth
(year over year percent change)
Quarterly GD P Gro wth
(year-on-year percent change)
Quarterly GD P Gro wth
(seasonally adjusted, quarter-on-quarter percent change)
24
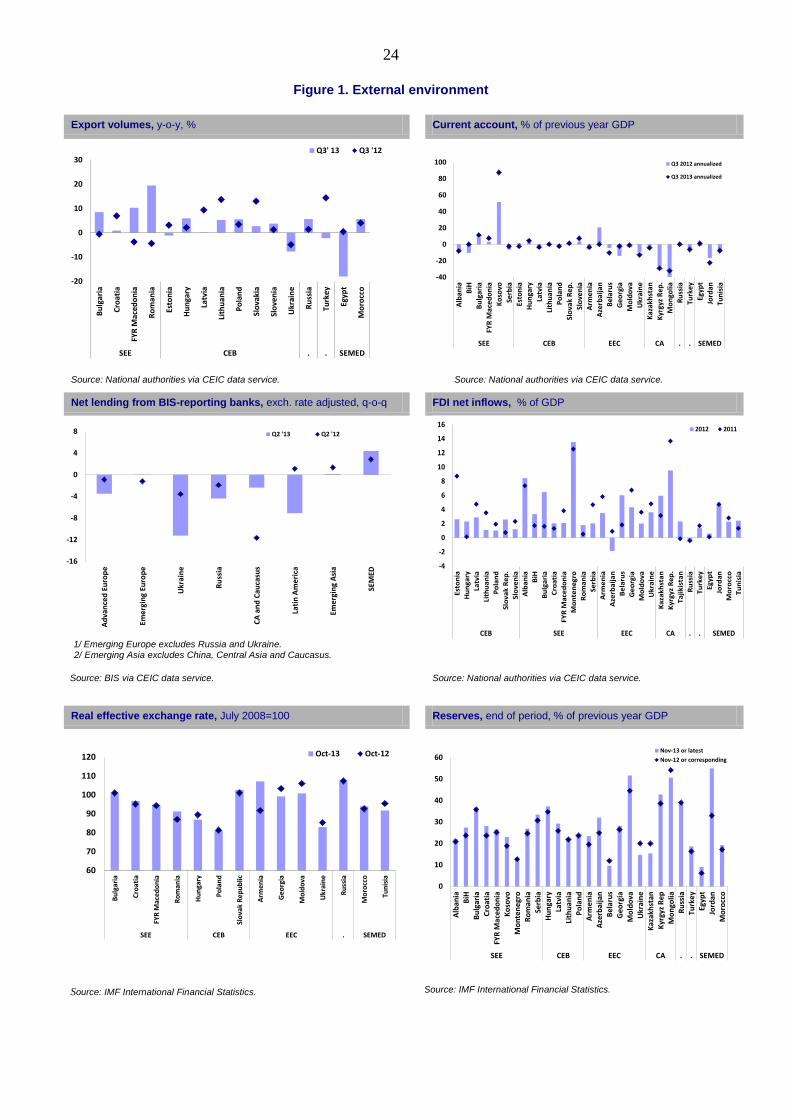
Figure 1. External environment
Export volumes, y-o-y, % Current account, % of previous year GDP
Source: National authorities via CEIC data service. Source: National authorities via CEIC data service.
Net lending from BIS-reporting banks, exch. rate adjusted, q-o-q FDI net inflows, % of GDP
1/ Emerging Europe excludes Russia and Ukraine. 2/ Emerging Asia excludes China, Central Asia and Caucasus.
Source: BIS via CEIC data service.
Source: National authorities via CEIC data service.
Real effective exchange rate, July 2008=100 Reserves, end of period, % of previous year GDP
Source: IMF International Financial Statistics. Source: IMF International Financial Statistics.
-20
-10
0
10
20
30
Bu
lgar
ia
Cro
atia
FYR
Mac
edo
nia
Ro
man
ia
Esto
nia
Hu
nga
ry
Latv
ia
Lith
uan
ia
Po
lan
d
Slo
vaki
a
Slo
ven
ia
Ukr
ain
e
Ru
ssia
Turk
ey
Egyp
t
Mo
rocc
oSEE CEB . . SEMED
Q3' 13 Q3 '12
-40
-20
0
20
40
60
80
100
Alb
ania
BiH
Bu
lgar
ia
FYR
Mac
ed
on
ia
Ko
sovo
Serb
ia
Esto
nia
Hu
nga
ry
Latv
ia
Lith
uan
ia
Po
lan
d
Slo
vak
Rep
.
Slo
ven
ia
Arm
en
ia
Aze
rbai
jan
Be
laru
s
Geo
rgia
Mo
ldo
va
Ukr
ain
e
Kaz
akh
stan
Kyr
gyz
Rep
.
Mo
ngo
lia
Ru
ssia
Turk
ey
Egyp
t
Jord
an
Tun
isia
SEE CEB EEC CA . . SEMED
Q3 2012 annualized
Q3 2013 annualized
-16
-12
-8
-4
0
4
8
Ad
van
ced
Eu
rop
e
Eme
rgin
g Eu
rop
e
Ukr
ain
e
Ru
ssia
CA
an
d C
auca
sus
Lati
n A
me
rica
Eme
rgin
g A
sia
SEM
ED
Q2 '13 Q2 '12
-4
-2
0
2
4
6
8
10
12
14
16
Est
on
ia
Hu
ng
ary
Latv
ia
Lith
ua
nia
Po
lan
d
Slo
va
k R
ep
.
Slo
ve
nia
Alb
an
ia
BiH
Bu
lga
ria
Cro
ati
a
FYR
Ma
ced
on
ia
Mo
nte
ne
gro
Ro
ma
nia
Se
rbia
Arm
en
ia
Aze
rba
ija
n
Be
laru
s
Ge
org
ia
Mo
ldo
va
Uk
rain
e
Ka
zak
hst
an
Ky
rgyz
Re
p.
Ta
jik
ista
n
Ru
ssia
Tu
rke
y
Eg
yp
t
Jord
an
Mo
rocc
o
Tu
nis
ia
CEB SEE EEC CA . . SEMED
2012 2011
60
70
80
90
100
110
120
Bu
lgar
ia
Cro
atia
FYR
Mac
edo
nia
Ro
man
ia
Hu
nga
ry
Po
lan
d
Slo
vak
Rep
ub
lic
Arm
enia
Geo
rgia
Mo
ldo
va
Ukr
ain
e
Ru
ssia
Mo
rocc
o
Tun
isia
SEE CEB EEC . SEMED
Oct-13 Oct-12
0
10
20
30
40
50
60
Alb
ania
BiH
Bu
lgar
iaC
roat
iaFY
R M
ace
do
nia
Ko
sovo
Mo
nte
ne
gro
Ro
man
iaSe
rbia
Hu
nga
ryLa
tvia
Lith
uan
iaP
ola
nd
Arm
en
iaA
zerb
aija
nB
ela
rus
Geo
rgia
Mo
ldo
vaU
krai
ne
Kaz
akh
stan
Kyr
gyz
Rep
Mo
ngo
liaR
uss
iaTu
rke
yEg
ypt
Jord
anM
oro
cco
SEE CEB EEC CA . . SEMED
Nov-13 or latest
Nov-12 or corresponding
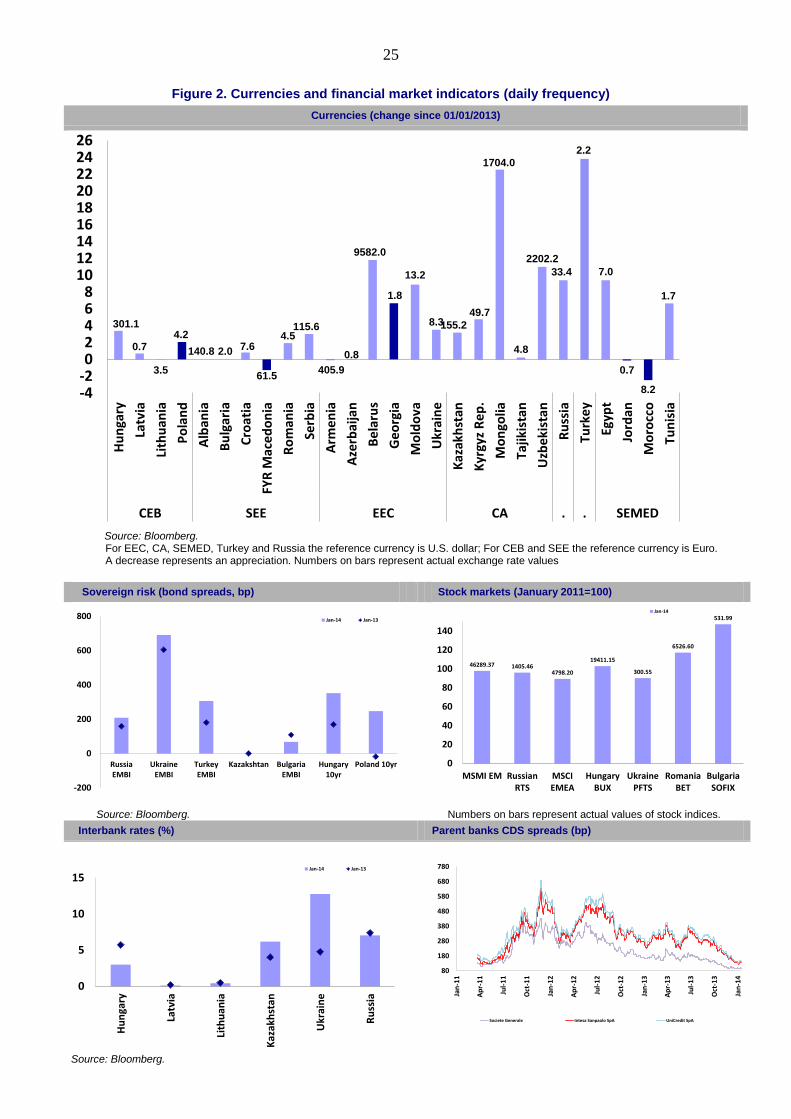
25
Figure 2. Currencies and financial market indicators (daily frequency)
Currencies (change since 01/01/2013)
Source: Bloomberg. For EEC, CA, SEMED, Turkey and Russia the reference currency is U.S. dollar; For CEB and SEE the reference currency is Euro. A decrease represents an appreciation. Numbers on bars represent actual exchange rate values
Sovereign risk (bond spreads, bp) Stock markets (January 2011=100)
Source: Bloomberg. Numbers on bars represent actual values of stock indices.
Interbank rates (%) Parent banks CDS spreads (bp)
Source: Bloomberg.
301.1
0.7
3.5
4.2
140.8 2.0 7.6
61.5
4.5115.6
405.9
0.8
9582.0
1.8
13.2
8.3155.2
49.7
1704.0
4.8
2202.2
33.4
2.2
7.0
0.7
8.2
1.7
-4-202468
101214161820222426
Hu
nga
ry
Latv
ia
Lith
uan
ia
Po
lan
d
Alb
ania
Bu
lgar
ia
Cro
atia
FYR
Mac
ed
on
ia
Ro
man
ia
Serb
ia
Arm
en
ia
Aze
rbai
jan
Be
laru
s
Ge
org
ia
Mo
ldo
va
Ukr
ain
e
Kaz
akh
stan
Kyr
gyz
Re
p.
Mo
ngo
lia
Tajik
ista
n
Uzb
eki
stan
Ru
ssia
Turk
ey
Egyp
t
Jord
an
Mo
rocc
o
Tun
isia
CEB SEE EEC CA . . SEMED
-200
0
200
400
600
800
RussiaEMBI
UkraineEMBI
TurkeyEMBI
Kazakshtan BulgariaEMBI
Hungary10yr
Poland 10yr
Jan-14 Jan-13
46289.37 1405.464798.20
19411.15
300.55
6526.60
531.99
0
20
40
60
80
100
120
140
MSMI EM RussianRTS
MSCIEMEA
HungaryBUX
UkrainePFTS
RomaniaBET
BulgariaSOFIX
Jan-14
0
5
10
15
Hu
nga
ry
Latv
ia
Lith
uan
ia
Kaz
akh
stan
Ukr
ain
e
Ru
ssia
Jan-14 Jan-13
80
180
280
380
480
580
680
780
Jan
-11
Ap
r-1
1
Jul-
11
Oct
-11
Jan
-12
Ap
r-1
2
Jul-
12
Oct
-12
Jan
-13
Ap
r-1
3
Jul-
13
Oct
-13
Jan
-14
Societe Generale Intesa Sanpaolo SpA UniCredit SpA
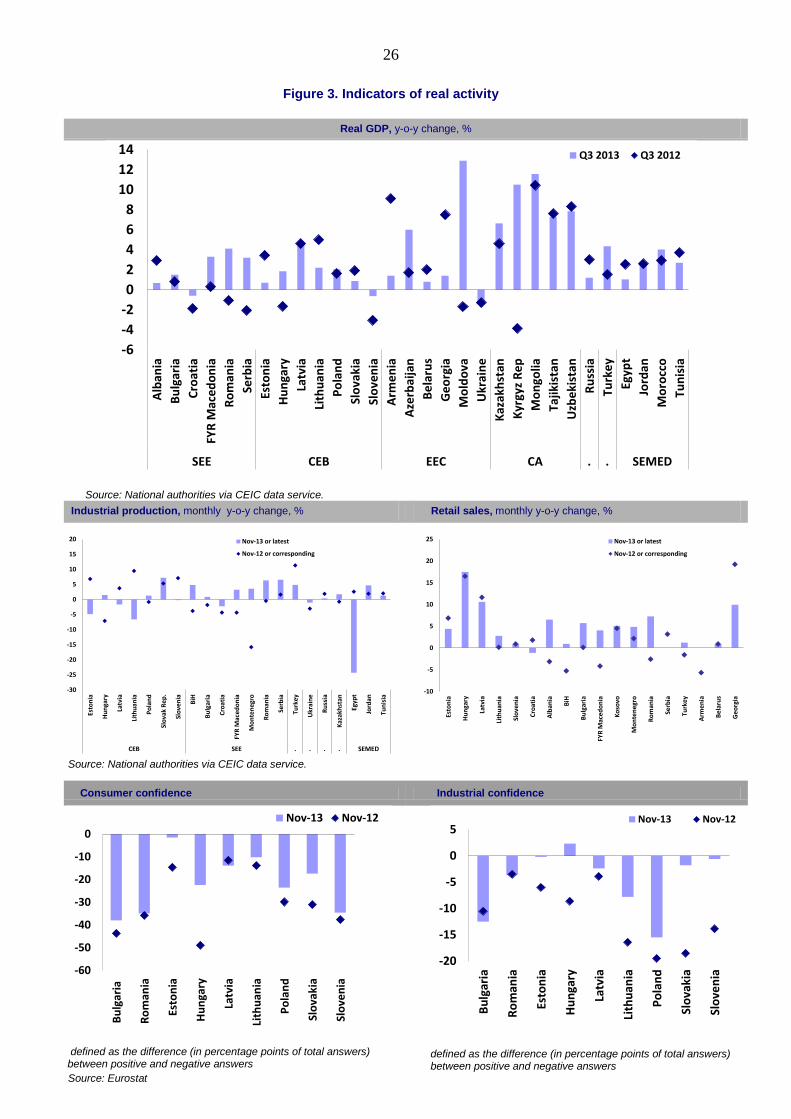
26
Figure 3. Indicators of real activity
Real GDP, y-o-y change, %
Source: National authorities via CEIC data service.
Industrial production, monthly y-o-y change, % Retail sales, monthly y-o-y change, %
Source: National authorities via CEIC data service.
Consumer confidence Industrial confidence
defined as the difference (in percentage points of total answers) between positive and negative answers
defined as the difference (in percentage points of total answers) between positive and negative answers
Source: Eurostat
-6
-4
-2
0
2
4
6
8
10
12
14A
lban
ia
Bu
lgar
ia
Cro
atia
FYR
Mac
ed
on
ia
Ro
man
ia
Serb
ia
Esto
nia
Hu
nga
ry
Latv
ia
Lith
uan
ia
Po
lan
d
Slo
vaki
a
Slo
ven
ia
Arm
en
ia
Aze
rbai
jan
Be
laru
s
Ge
org
ia
Mo
ldo
va
Ukr
ain
e
Kaz
akh
stan
Kyr
gyz
Re
p
Mo
ngo
lia
Tajik
ista
n
Uzb
eki
stan
Ru
ssia
Turk
ey
Egyp
t
Jord
an
Mo
rocc
o
Tun
isia
SEE CEB EEC CA . . SEMED
Q3 2013 Q3 2012
-30
-25
-20
-15
-10
-5
0
5
10
15
20
Esto
nia
Hu
nga
ry
Latv
ia
Lith
uan
ia
Po
lan
d
Slo
vak
Re
p.
Slo
ven
ia
BiH
Bu
lgar
ia
Cro
atia
FYR
Mac
edo
nia
Mo
nte
neg
ro
Ro
man
ia
Serb
ia
Turk
ey
Ukr
ain
e
Ru
ssia
Kaz
akh
stan
Egyp
t
Jord
an
Tun
isia
CEB SEE . . . . SEMED
Nov-13 or latest
Nov-12 or corresponding
-10
-5
0
5
10
15
20
25
Esto
nia
Hu
nga
ry
Latv
ia
Lith
uan
ia
Slo
ven
ia
Cro
atia
Alb
ania
BiH
Bu
lgar
ia
FYR
Mac
ed
on
ia
Ko
sovo
Mo
nte
ne
gro
Ro
man
ia
Serb
ia
Turk
ey
Arm
en
ia
Be
laru
s
Ge
org
ia
Nov-13 or latest
Nov-12 or corresponding
-60
-50
-40
-30
-20
-10
0
Bu
lgar
ia
Ro
man
ia
Esto
nia
Hu
nga
ry
Latv
ia
Lith
uan
ia
Po
lan
d
Slo
vaki
a
Slo
ven
ia
Nov-13 Nov-12
-20
-15
-10
-5
0
5
Bu
lgar
ia
Ro
man
ia
Esto
nia
Hu
nga
ry
Latv
ia
Lith
uan
ia
Po
lan
d
Slo
vaki
a
Slo
ven
ia
Nov-13 Nov-12
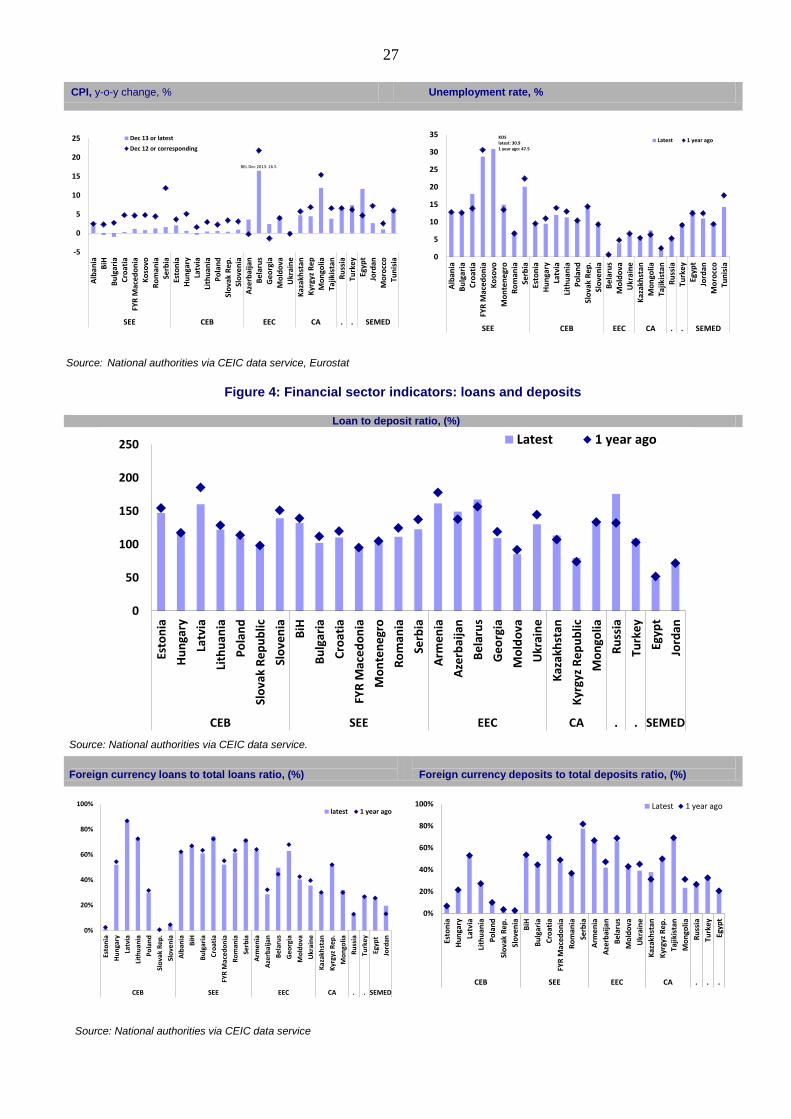
27
CPI, y-o-y change, % Unemployment rate, %
Source: National authorities via CEIC data service, Eurostat
Figure 4: Financial sector indicators: loans and deposits
Loan to deposit ratio, (%)
Source: National authorities via CEIC data service.
k Foreign currency loans to total loans ratio, (%)
Foreign currency deposits to total deposits ratio, (%)
Source: National authorities via CEIC data service
-5
0
5
10
15
20
25
Alb
ania
BiH
Bu
lgar
iaC
roat
iaFY
R M
ace
do
nia
Ko
sovo
Ro
man
iaSe
rbia
Esto
nia
Hu
nga
ryLa
tvia
Lith
uan
iaP
ola
nd
Slo
vak
Rep
.Sl
ove
nia
Aze
rbai
jan
Be
laru
sG
eo
rgia
Mo
ldo
vaU
krai
ne
Kaz
akh
stan
Kyr
gyz
Rep
Mo
ngo
liaTa
jikis
tan
Ru
ssia
Turk
ey
Egyp
tJo
rdan
Mo
rocc
oTu
nis
ia
SEE CEB EEC CA . . SEMED
Dec 13 or latest
Dec 12 or corresponding
BEL Dec 2013: 16.5
0
5
10
15
20
25
30
35
Alb
ania
Bu
lgar
iaC
roat
iaFY
R M
ace
do
nia
Ko
sovo
Mo
nte
ne
gro
Ro
man
iaSe
rbia
Esto
nia
Hu
nga
ryLa
tvia
Lith
uan
iaP
ola
nd
Slo
vak
Rep
.Sl
ove
nia
Be
laru
sM
old
ova
Ukr
ain
eK
azak
hst
anM
on
golia
Tajik
ista
nR
uss
iaTu
rke
yEg
ypt
Jord
anM
oro
cco
Tun
isia
SEE CEB EEC CA . . SEMED
Latest 1 year agoKOSlatest: 30.91 year ago: 47.5
0
50
100
150
200
250
Esto
nia
Hu
nga
ry
Latv
ia
Lith
uan
ia
Po
lan
d
Slo
vak
Re
pu
blic
Slo
ven
ia
BiH
Bu
lgar
ia
Cro
atia
FYR
Mac
ed
on
ia
Mo
nte
ne
gro
Ro
man
ia
Serb
ia
Arm
en
ia
Aze
rbai
jan
Be
laru
s
Ge
org
ia
Mo
ldo
va
Ukr
ain
e
Kaz
akh
stan
Kyr
gyz
Re
pu
blic
Mo
ngo
lia
Ru
ssia
Turk
ey
Egyp
t
Jord
an
CEB SEE EEC CA . . SEMED
Latest 1 year ago
0%
20%
40%
60%
80%
100%
Esto
nia
Hu
nga
ry
Latv
ia
Lith
uan
ia
Po
lan
d
Slo
vak
Re
p.
Slo
ven
ia
Alb
ania
BiH
Bu
lgar
ia
Cro
atia
FYR
Mac
ed
on
ia
Ro
man
ia
Serb
ia
Arm
en
ia
Aze
rbai
jan
Be
laru
s
Ge
org
ia
Mo
ldo
va
Ukr
ain
e
Kaz
akh
stan
Kyr
gyz
Re
p.
Mo
ngo
lia
Ru
ssia
Turk
ey
Egyp
t
Jord
an
CEB SEE EEC CA . . SEMED
latest 1 year ago
0%
20%
40%
60%
80%
100%
Esto
nia
Hu
nga
ry
Latv
ia
Lith
uan
ia
Po
lan
d
Slo
vak
Re
p.
Slo
ven
ia
BiH
Bu
lgar
ia
Cro
atia
FYR
Mac
edo
nia
Ro
man
ia
Serb
ia
Arm
en
ia
Aze
rbai
jan
Be
laru
s
Mo
ldo
va
Ukr
ain
e
Kaz
akh
stan
Kyr
gyz
Rep
.
Taji
kist
an
Mo
ngo
lia
Ru
ssia
Turk
ey
Egyp
t
CEB SEE EEC CA . . .
Latest 1 year ago
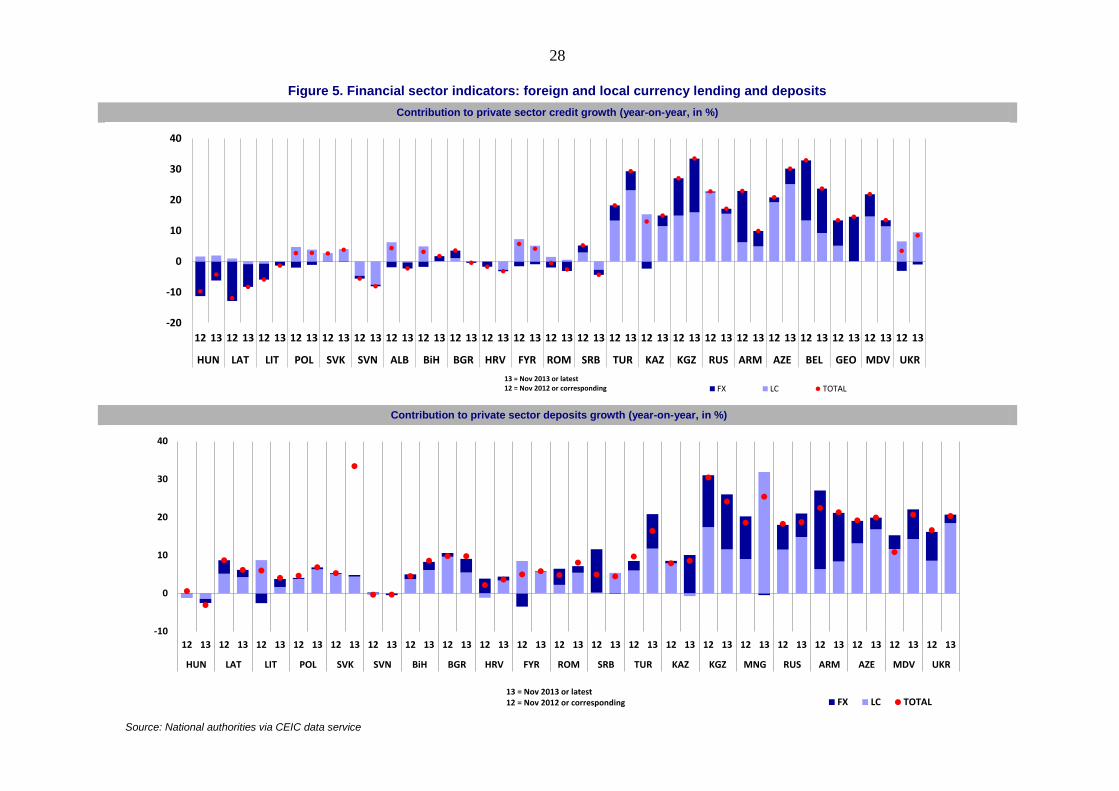
28
Figure 5. Financial sector indicators: foreign and local currency lending and deposits
Contribution to private sector credit growth (year-on-year, in %)
Contribution to private sector deposits growth (year-on-year, in %)
Source: National authorities via CEIC data service
-20
-10
0
10
20
30
40
12 13 12 13 12 13 12 13 12 13 12 13 12 13 12 13 12 13 12 13 12 13 12 13 12 13 12 13 12 13 12 13 12 13 12 13 12 13 12 13 12 13 12 13 12 13
HUN LAT LIT POL SVK SVN ALB BiH BGR HRV FYR ROM SRB TUR KAZ KGZ RUS ARM AZE BEL GEO MDV UKR
FX LC TOTAL13 = Nov 2013 or latest12 = Nov 2012 or corresponding
-10
0
10
20
30
40
12 13 12 13 12 13 12 13 12 13 12 13 12 13 12 13 12 13 12 13 12 13 12 13 12 13 12 13 12 13 12 13 12 13 12 13 12 13 12 13 12 13
HUN LAT LIT POL SVK SVN BiH BGR HRV FYR ROM SRB TUR KAZ KGZ MNG RUS ARM AZE MDV UKR
FX LC TOTAL13 = Nov 2013 or latest12 = Nov 2012 or corresponding