Embed Size (px)
Citation preview

For release 10:00 a.m. (EST) Wednesday, March 3, 2010 USDL-10-0231 Technical information: (202) 691-6392 • [email protected] • www.bls.gov/lau Media contact: (202) 691-5902 • [email protected]
REGIONAL AND STATE UNEMPLOYMENT – 2009 ANNUAL AVERAGES Annual average unemployment rates rose in 2009 in all regions, divisions, and states, the U.S. Bureau of Labor Statistics reported today. Employment-population ratios decreased across all of these geographic areas as well. The U.S. jobless rate jumped by 3.5 percentage points from the prior year to 9.3 percent, while the national employment-population ratio fell by 2.9 points to 59.3 percent.
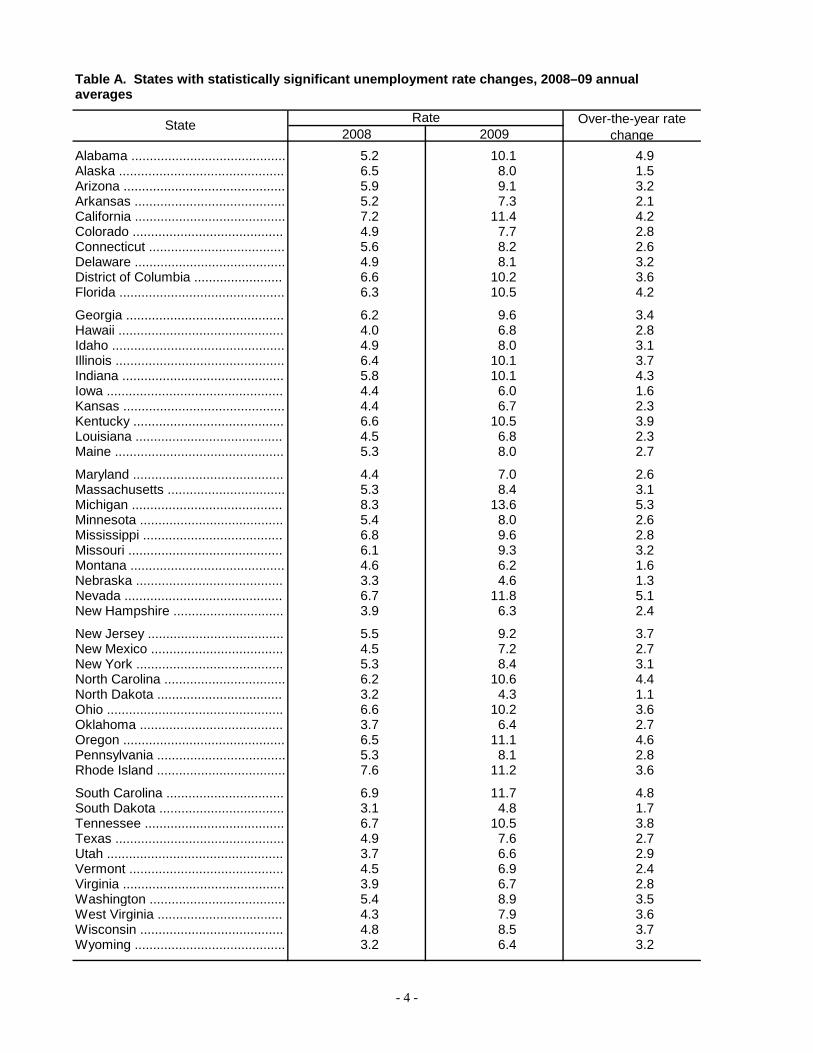
Regional Unemployment All four regions posted statistically significant unemployment rate increases from 2008. The West experienced the greatest jump (+3.8 percentage points), followed by the Midwest (+3.6 points), South (+3.4 points), and Northeast (+3.0 points). The West, at 10.1 percent, and Midwest, at 9.6 percent, regis-tered jobless rates significantly higher than the U.S. rate in 2009. The Northeast and South, at 8.4 and 8.9 percent, respectively, both had rates significantly below the national figure. In 2009, the West recorded the highest annual jobless rate in its series. (All region, division, and state series begin in 1976.) (See table 1.) All nine geographic divisions also reported statistically significant over-the-year unemployment rate increases in 2009, with the largest occurring in the Pacific and East North Central (+4.1 and +4.0 per-centage points, respectively). The divisions with the smallest rate increases were the West North Central (+2.4 percentage points) and West South Central (+2.6 points). Three divisions registered unemploy-ment rates over 10.0 percent: the Pacific division posted the highest rate, 10.9 percent, followed by the East North Central, 10.6 percent, and the East South Central, 10.2 percent—all three rates were signi-ficantly above the U.S. rate. The divisions with the lowest jobless rates last year were the West North Central, 7.3 percent, and West South Central, 7.4 percent. In addition to these two, the Middle Atlantic, Mountain, and New England divisions had rates significantly below the national figure. Two divisions reported the highest jobless rates in their series in 2009: the Pacific, 10.9 percent, and South Atlantic, 9.5 percent. State Unemployment All 50 states and the District of Columbia posted statistically significant unemployment rate increases in 2009. Michigan and Nevada experienced the largest increases in their jobless rates (+5.3 and +5.1 per-centage points, respectively). Seven additional states recorded rate jumps of at least 4.0 percentage points. (See table A and chart 1.) In 2009, 14 states and the District of Columbia reported unemployment rates of 10.0 percent or more. Michigan posted the highest unemployment rate for the fourth year in a row, 13.6 percent, followed by
- 2 -
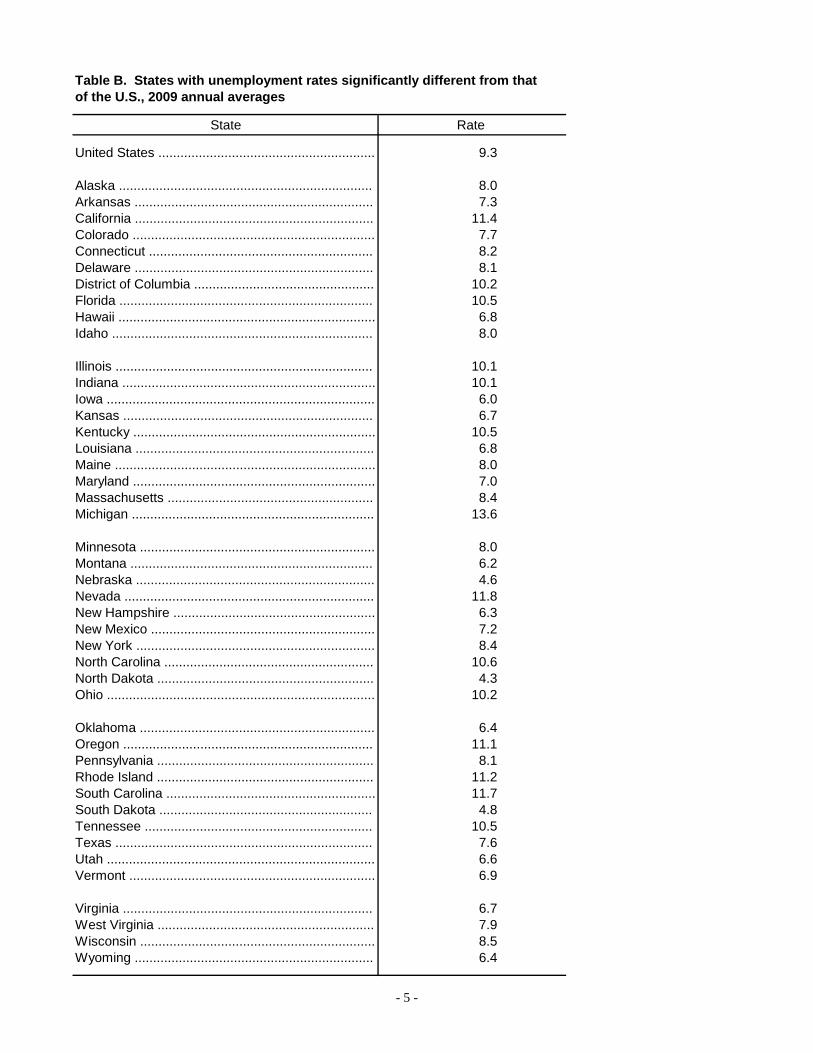
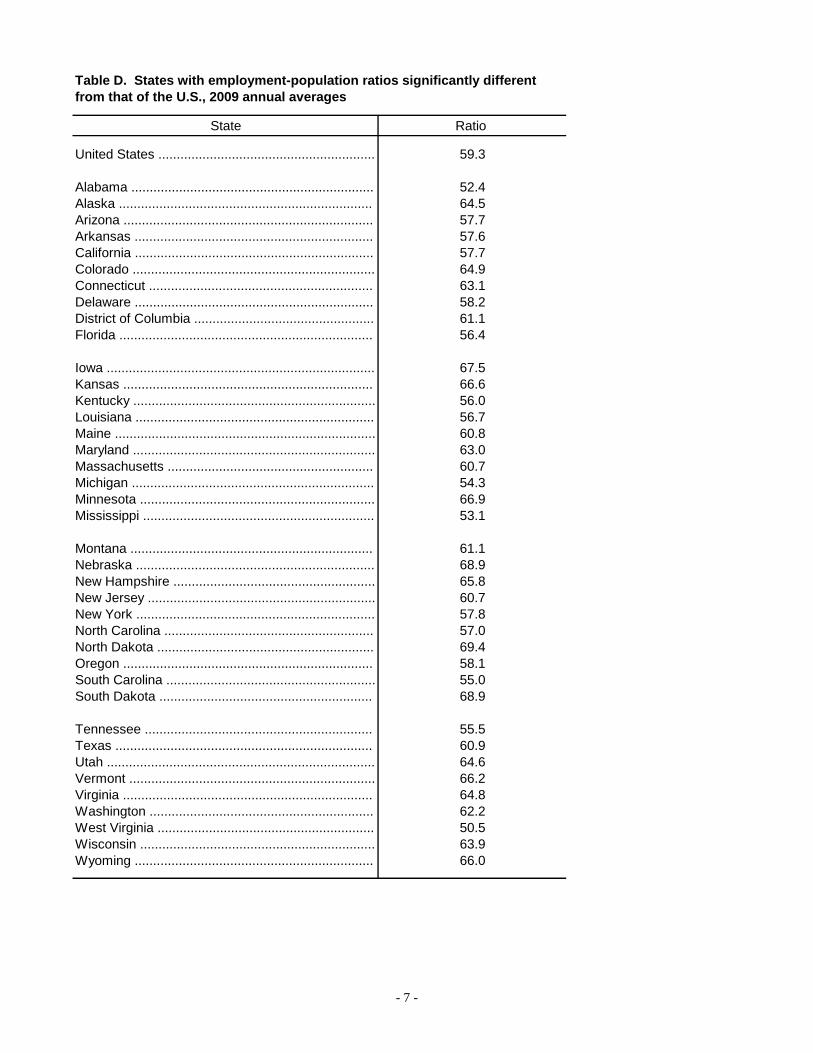
Nevada, 11.8 percent, and South Carolina, 11.7 percent. North Dakota registered the lowest jobless rate among the states, 4.3 percent, with Nebraska and South Dakota close behind at 4.6 and 4.8 percent, re-spectively. Thirty states had unemployment rates that were significantly lower than the U.S. rate of 9.3 percent, and 13 states and the District of Columbia recorded rates significantly above it. Nine states reported the highest jobless rates in their annual series: California (11.4 percent), Delaware (8.1 per-cent), Florida (10.5 percent), Georgia (9.6 percent), Kansas (6.7 percent), Nevada (11.8 percent), North Carolina (10.6 percent), Rhode Island (11.2 percent), and South Carolina (11.7 percent). (See table B and chart 2.) Regional Employment-Population Ratios In 2009, all four regions registered statistically significant deterioration in their employment-population ratios—the proportion of the civilian noninstitutional population 16 years and older with a job. The West experienced the largest over-the-year decrease in its employment-population ratio (-3.3 percentage points), followed by the Midwest (-3.1 points), South (-2.7 points), and Northeast (-2.2 points). Despite the large decline in its employment-population ratio, the Midwest continued to report the highest ratio, 60.8 percent, while the South, at 58.3 percent, recorded the lowest. These two regions had employment-population ratios that were significantly different from the national figure of 59.3 percent. (See table 2.) All nine divisions registered statistically significant decreases in their employment-population ratios in 2009. The East North Central reported the greatest drop (-3.5 percentage points), followed by the Pacific and South Atlantic (-3.3 points each) and East South Central and Mountain (-3.2 points each). In 2009, the East South Central again recorded the lowest proportion of employed persons, 54.4 percent, with the South Atlantic and Pacific posting the next lowest, 58.4 and 58.5 percent, respectively. All were signifi-cantly below the national average. The divisions with the highest employment-population ratios were the West North Central, 65.2 percent, and New England, 62.0 percent. The Mountain division also recorded an employment-population ratio significantly above the U.S. figure. State Employment-Population Ratios In 2009, all 50 states and the District of Columbia registered statistically significant decreases in their proportions of employed persons. Four states and the District of Columbia reported drops of 4.0 percent-age points or more: Alabama (-4.4 points), Indiana and Michigan (-4.3 points), North Carolina (-4.1 points), and the District of Columbia (-4.0 points). Sixteen other states recorded declines in their em-ployment-population ratios of -3.0 to -3.9 percentage points, 20 states had decreases of -2.0 to -2.9 points, and the remaining 10 states had declines of -1.0 to -1.9 points. West Virginia again reported the lowest employment-population ratio among the states (50.5 percent), which it has done for 34 consecutive years. Almost half (24) of the states had employment-population ratios in 2009 that were below 60.0 percent, while no state registered a ratio of 70.0 percent or higher last year. Three states in the West North Central division again posted the highest ratios: North Dakota (69.4 percent) and Nebraska and South Dakota (68.9 percent each). Twenty-two states and the District of Columbia recorded employment-population ratios that were significantly above the U.S. ratio of 59.3 percent, and 16 states had ratios that were appreciably below it. The remaining 12 states reported ratios that were not measurably different from that of the nation. Four states registered the lowest employment-population ratios in their series in 2009: Hawaii (59.9 percent), Nevada (60.4 percent), North Carolina (57.0 percent), and South Carolina (55.0 percent). (See tables C and D and chart 3.)

- 3 -
The Regional and State Employment and Unemployment news release for January 2010 is scheduled to be released on Wednesday, March 10, 2010, at 10:00 a.m. (EST). The Metropolitan Area Employment and Unemployment news release for January 2010 is scheduled to be released on Friday, March 19, 2010, at 10:00 a.m. (EDT).
- 4 -
Table A. States with statistically significant unemployment rate changes, 2008–09 annualaverages
2008 2009Alabama .......................................... 5.2 10.1 4.9Alaska ............................................. 6.5 8.0 1.5Arizona ............................................ 5.9 9.1 3.2Arkansas ......................................... 5.2 7.3 2.1California ......................................... 7.2 11.4 4.2Colorado ......................................... 4.9 7.7 2.8Connecticut ..................................... 5.6 8.2 2.6Delaware ......................................... 4.9 8.1 3.2District of Columbia ........................ 6.6 10.2 3.6Florida ............................................. 6.3 10.5 4.2
Georgia ........................................... 6.2 9.6 3.4Hawaii ............................................. 4.0 6.8 2.8Idaho ............................................... 4.9 8.0 3.1Illinois .............................................. 6.4 10.1 3.7Indiana ............................................ 5.8 10.1 4.3Iowa ................................................ 4.4 6.0 1.6Kansas ............................................ 4.4 6.7 2.3Kentucky ......................................... 6.6 10.5 3.9Louisiana ........................................ 4.5 6.8 2.3Maine .............................................. 5.3 8.0 2.7
Maryland ......................................... 4.4 7.0 2.6Massachusetts ................................ 5.3 8.4 3.1Michigan ......................................... 8.3 13.6 5.3Minnesota ....................................... 5.4 8.0 2.6Mississippi ...................................... 6.8 9.6 2.8Missouri .......................................... 6.1 9.3 3.2Montana .......................................... 4.6 6.2 1.6Nebraska ........................................ 3.3 4.6 1.3Nevada ........................................... 6.7 11.8 5.1New Hampshire .............................. 3.9 6.3 2.4
New Jersey ..................................... 5.5 9.2 3.7New Mexico .................................... 4.5 7.2 2.7New York ........................................ 5.3 8.4 3.1North Carolina ................................. 6.2 10.6 4.4North Dakota .................................. 3.2 4.3 1.1Ohio ................................................ 6.6 10.2 3.6Oklahoma ....................................... 3.7 6.4 2.7Oregon ............................................ 6.5 11.1 4.6Pennsylvania ................................... 5.3 8.1 2.8Rhode Island ................................... 7.6 11.2 3.6
South Carolina ................................ 6.9 11.7 4.8South Dakota .................................. 3.1 4.8 1.7Tennessee ...................................... 6.7 10.5 3.8Texas .............................................. 4.9 7.6 2.7Utah ................................................ 3.7 6.6 2.9Vermont .......................................... 4.5 6.9 2.4Virginia ............................................ 3.9 6.7 2.8Washington ..................................... 5.4 8.9 3.5West Virginia .................................. 4.3 7.9 3.6Wisconsin ....................................... 4.8 8.5 3.7Wyoming ......................................... 3.2 6.4 3.2
RateState Over-the-year rate change
- 5 -
State Rate
United States ........................................................... 9.3
Alaska ..................................................................... 8.0Arkansas ................................................................. 7.3California ................................................................. 11.4Colorado .................................................................. 7.7Connecticut ............................................................. 8.2Delaware ................................................................. 8.1District of Columbia ................................................. 10.2Florida ..................................................................... 10.5Hawaii ...................................................................... 6.8Idaho ....................................................................... 8.0
Illinois ...................................................................... 10.1Indiana ..................................................................... 10.1Iowa ......................................................................... 6.0Kansas .................................................................... 6.7Kentucky .................................................................. 10.5Louisiana ................................................................. 6.8Maine ....................................................................... 8.0Maryland .................................................................. 7.0Massachusetts ........................................................ 8.4Michigan .................................................................. 13.6
Minnesota ................................................................ 8.0Montana .................................................................. 6.2Nebraska ................................................................. 4.6Nevada .................................................................... 11.8New Hampshire ....................................................... 6.3New Mexico ............................................................. 7.2New York ................................................................. 8.4North Carolina ......................................................... 10.6North Dakota ........................................................... 4.3Ohio ......................................................................... 10.2
Oklahoma ................................................................ 6.4Oregon .................................................................... 11.1Pennsylvania ........................................................... 8.1Rhode Island ........................................................... 11.2South Carolina ......................................................... 11.7South Dakota .......................................................... 4.8Tennessee .............................................................. 10.5Texas ...................................................................... 7.6Utah ......................................................................... 6.6Vermont ................................................................... 6.9
Virginia .................................................................... 6.7West Virginia ........................................................... 7.9Wisconsin ................................................................ 8.5Wyoming ................................................................. 6.4
of the U.S., 2009 annual averagesTable B. States with unemployment rates significantly different from that

- 6 -
Table C. States with statistically significant employment-population ratio changes, 2008–09 annual averages
2008 2009
Alabama .......................................... 56.8 52.4 -4.4Alaska ............................................. 66.5 64.5 -2.0Arizona ............................................ 60.3 57.7 -2.6Arkansas ......................................... 59.6 57.6 -2.0California ......................................... 61.2 57.7 -3.5Colorado ......................................... 68.8 64.9 -3.9Connecticut ..................................... 64.7 63.1 -1.6Delaware ......................................... 61.8 58.2 -3.6District of Columbia ........................ 65.1 61.1 -4.0Florida ............................................. 59.6 56.4 -3.2
Georgia ........................................... 63.0 59.1 -3.9Hawaii ............................................. 62.9 59.9 -3.0Idaho ............................................... 63.6 60.1 -3.5Illinois .............................................. 63.6 60.1 -3.5Indiana ............................................ 62.6 58.3 -4.3Iowa ................................................ 69.3 67.5 -1.8Kansas ............................................ 67.6 66.6 -1.0Kentucky ......................................... 57.8 56.0 -1.8Louisiana ........................................ 58.8 56.7 -2.1Maine .............................................. 62.8 60.8 -2.0
Maryland ......................................... 66.3 63.0 -3.3Massachusetts ................................ 63.3 60.7 -2.6Michigan ......................................... 58.6 54.3 -4.3Minnesota ....................................... 68.7 66.9 -1.8Mississippi ...................................... 55.3 53.1 -2.2Missouri .......................................... 62.5 59.7 -2.8Montana .......................................... 64.2 61.1 -3.1Nebraska ........................................ 71.1 68.9 -2.2Nevada ........................................... 63.6 60.4 -3.2New Hampshire .............................. 68.0 65.8 -2.2
New Jersey ..................................... 63.2 60.7 -2.5New Mexico .................................... 61.0 58.3 -2.7New York ........................................ 59.9 57.8 -2.1North Carolina ................................. 61.1 57.0 -4.1North Dakota .................................. 70.8 69.4 -1.4Ohio ................................................ 62.6 59.7 -2.9Oklahoma ....................................... 61.4 59.7 -1.7Oregon ............................................ 61.4 58.1 -3.3Pennsylvania ................................... 61.6 59.3 -2.3Rhode Island ................................... 63.0 60.1 -2.9
South Carolina ................................ 57.9 55.0 -2.9South Dakota .................................. 70.8 68.9 -1.9Tennessee ...................................... 59.0 55.5 -3.5Texas .............................................. 62.3 60.9 -1.4Utah ................................................ 68.1 64.6 -3.5Vermont .......................................... 67.8 66.2 -1.6Virginia ............................................ 66.8 64.8 -2.0Washington ..................................... 64.7 62.2 -2.5West Virginia .................................. 53.4 50.5 -2.9Wisconsin ....................................... 66.9 63.9 -3.0Wyoming ......................................... 69.4 66.0 -3.4
StateRatio Over-the-year ratio
change
- 7 -
State Ratio
United States ........................................................... 59.3
Alabama .................................................................. 52.4Alaska ..................................................................... 64.5Arizona .................................................................... 57.7Arkansas ................................................................. 57.6California ................................................................. 57.7Colorado .................................................................. 64.9Connecticut ............................................................. 63.1Delaware ................................................................. 58.2District of Columbia ................................................. 61.1Florida ..................................................................... 56.4
Iowa ......................................................................... 67.5Kansas .................................................................... 66.6Kentucky .................................................................. 56.0Louisiana ................................................................. 56.7Maine ....................................................................... 60.8Maryland .................................................................. 63.0Massachusetts ........................................................ 60.7Michigan .................................................................. 54.3Minnesota ................................................................ 66.9Mississippi ............................................................... 53.1
Montana .................................................................. 61.1Nebraska ................................................................. 68.9New Hampshire ....................................................... 65.8New Jersey .............................................................. 60.7New York ................................................................. 57.8North Carolina ......................................................... 57.0North Dakota ........................................................... 69.4Oregon .................................................................... 58.1South Carolina ......................................................... 55.0South Dakota .......................................................... 68.9
Tennessee .............................................................. 55.5Texas ...................................................................... 60.9Utah ......................................................................... 64.6Vermont ................................................................... 66.2Virginia .................................................................... 64.8Washington ............................................................. 62.2West Virginia ........................................................... 50.5Wisconsin ................................................................ 63.9Wyoming ................................................................. 66.0
from that of the U.S., 2009 annual averagesTable D. States with employment-population ratios significantly different

Technical Note
This release presents labor force and unemployment data for census regions and divisions and states from the Local Area Unemployment Statistics (LAUS) program. The LAUS program is a federal-state cooperative endeavor.
Concepts
Definitions. The labor force and unemployment data
are based on the same concepts and definitions as those used for the official national estimates obtained from the Current Population Survey (CPS), a sample survey of households that is conducted for the Bureau of Labor Statistics (BLS) by the U.S. Census Bureau. The LAUS program measures employment and unemployment on a place-of-residence basis. The universe for each is the civilian noninstitutional population 16 years of age and over. Employed persons are those who did any work at all for pay or profit in the reference week (the week including the 12th of the month) or worked 15 hours or more without pay in a family business or farm, plus those not working who had a job from which they were temporarily absent, whether or not paid, for such reasons as labor-management dispute, illness, or vacation. Unemployed persons are those who were not employed during the reference week (based on the definition above), had actively looked for a job sometime in the 4-week period ending with the reference week, and were currently available for work; persons on layoff expecting recall need not be looking for work to be counted as unemployed. The labor force is the sum of employed and unemployed persons. The unemployment rate is the number of unemployed as a percent of the labor force. The employment-population ratio is the proportion of the civilian noninstitutional population aged 16 years and over that is employed.
Method of estimation. Estimates for 48 of the 50
states, the District of Columbia, the Los Angeles-Long Beach-Glendale metropolitan division, New York City, and the balances of California and New York State are produced using estimating equations based on regression techniques. This method, which underwent substantial enhancement at the beginning of 2005, utilizes data from several sources, including the CPS, the Current Employment Statistics (CES) survey of nonfarm payroll employment, and state unemployment insurance (UI) programs. Estimates for the state of California are derived by summing the estimates for the Los Angeles-Long Beach-Glendale metropolitan division and the balance of California. Similarly, estimates for New York State are derived by summing the estimates for New York City and the balance of New York State. Estimates for all nine census divisions are based on a similar regression approach that does not incorporate CES or UI data. Estimates for census regions are obtained by summing the model-based estimates for the component divisions and then calculating the unemployment rate. Each month, census division estimates are controlled to national totals; state estimates are then controlled to their respective division totals. Estimates for Puerto Rico are derived from a monthly
household survey similar to the CPS. A detailed description of the estimation procedures is available from BLS upon request.
Annual revisions. Labor force and unemployment data
for prior years reflect adjustments made at the end of each year. The adjusted estimates reflect updated population data from the U.S. Census Bureau, any revisions in the other data sources, and model reestimation. In most years, historical data for the most recent 5 years (both seasonally adjusted and not seasonally adjusted) are revised near the beginning of each calendar year, prior to or coincident with the release of January estimates.
Reliability of the estimates
The estimates presented in this release are based on sample surveys, administrative data, and modeling and, thus, are subject to sampling and other types of errors. Sampling error is a measure of sampling variability—that is, variation that occurs by chance because a sample rather than the entire population is surveyed. Survey data also are subject to nonsampling errors, such as those which can be introduced into the data collection and processing operations. Estimates not directly derived from sample surveys are subject to additional errors resulting from the specific estimation processes used. The sums of individual items may not always equal the totals shown in the same tables because of rounding. Unemployment rates are computed from unrounded data and thus may differ slightly from rates computed using the rounded data displayed in the tables.
Use of error measures. In 2005, the LAUS program
introduced several improvements to its methodology. Among these were the development of model-based error measures for the monthly estimates and the estimates of over-the-month changes. Annual average error measures became available for the first time after 2006. The introductory section of this release preserves the long-time practice of highlighting the direction of the movements in regional and state unemployment rates regardless of their statistical significance. The remainder of the analysis in the release takes statistical significance into consideration. Model-based error measures are available online at www.bls.gov/lau/lastderr.htm. BLS uses a 90-percent confidence level in determining whether changes in LAUS unemployment rates are statistically significant. The average magnitude of the over-the-year change in an annual average state unemployment rate that is required in order to be statistically significant at the 90-percent confidence level is about 0.5 percentage point. More details can be found on the Web site. Measures of nonsampling error are not available, but additional information on the subject is provided in Employment and Earnings Online available on the BLS Web site at www.bls.gov/opub/ee/home.htm.

Additional information
More complete information on the technical procedures used to develop these estimates and additional data appear in
Employment and Earnings Online. Information in this release will be made available to
sensory impaired individuals upon request. Voice phone: (202) 691-5200; Federal Relay Service: (800) 877-8339.
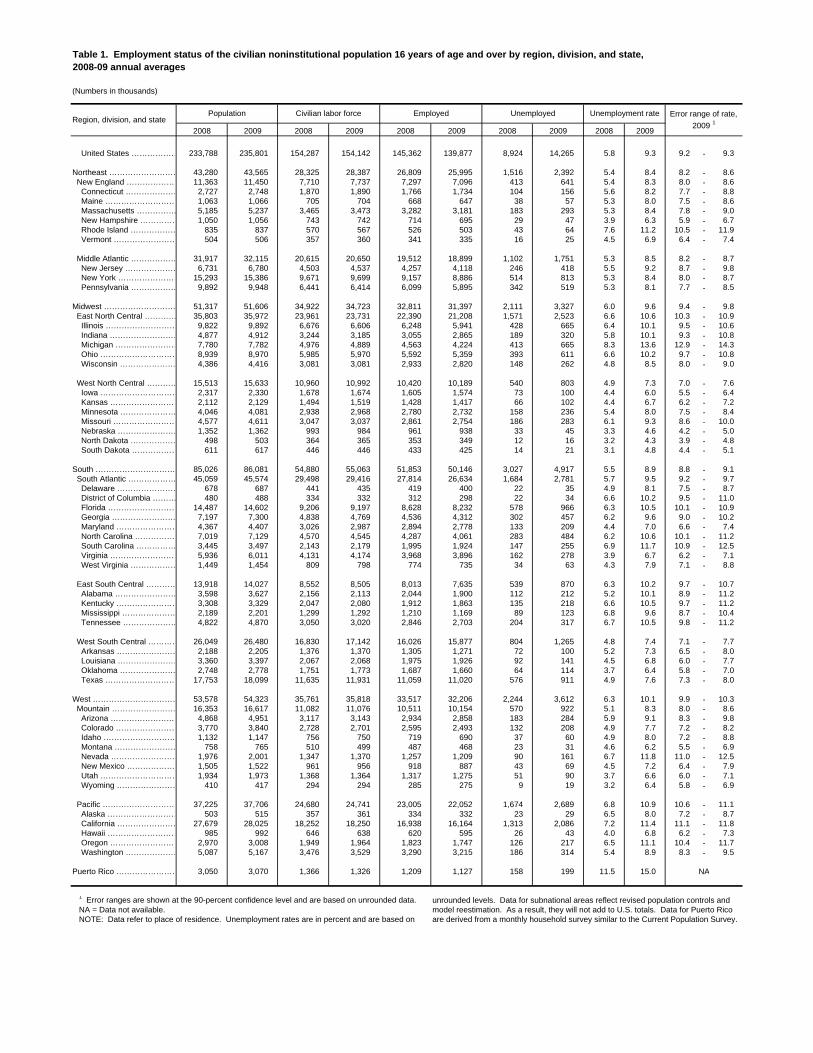
Table 1. Employment status of the civilian noninstitutional population 16 years of age and over by region, division, and state, 2008-09 annual averages
(Numbers in thousands)
United States ……………… 233,788 235,801 154,287 154,142 145,362 139,877 8,924 14,265 5.8 9.3 9.2 - 9.3
Northeast ……………………… 43,280 43,565 28,325 28,387 26,809 25,995 1,516 2,392 5.4 8.4 8.2 - 8.6 New England ………………… 11,363 11,450 7,710 7,737 7,297 7,096 413 641 5.4 8.3 8.0 - 8.6 Connecticut ………………… 2,727 2,748 1,870 1,890 1,766 1,734 104 156 5.6 8.2 7.7 - 8.8 Maine ……………………… 1,063 1,066 705 704 668 647 38 57 5.3 8.0 7.5 - 8.6 Massachusetts …………… 5,185 5,237 3,465 3,473 3,282 3,181 183 293 5.3 8.4 7.8 - 9.0 New Hampshire …………… 1,050 1,056 743 742 714 695 29 47 3.9 6.3 5.9 - 6.7 Rhode Island ……………… 835 837 570 567 526 503 43 64 7.6 11.2 10.5 - 11.9 Vermont …………………… 504 506 357 360 341 335 16 25 4.5 6.9 6.4 - 7.4
Middle Atlantic ……………… 31,917 32,115 20,615 20,650 19,512 18,899 1,102 1,751 5.3 8.5 8.2 - 8.7 New Jersey ………………… 6,731 6,780 4,503 4,537 4,257 4,118 246 418 5.5 9.2 8.7 - 9.8 New York …………………… 15,293 15,386 9,671 9,699 9,157 8,886 514 813 5.3 8.4 8.0 - 8.7 Pennsylvania ……………… 9,892 9,948 6,441 6,414 6,099 5,895 342 519 5.3 8.1 7.7 - 8.5
Midwest ……………………… 51,317 51,606 34,922 34,723 32,811 31,397 2,111 3,327 6.0 9.6 9.4 - 9.8 East North Central ………… 35,803 35,972 23,961 23,731 22,390 21,208 1,571 2,523 6.6 10.6 10.3 - 10.9 Illinois ……………………… 9,822 9,892 6,676 6,606 6,248 5,941 428 665 6.4 10.1 9.5 - 10.6 Indiana ……………………… 4,877 4,912 3,244 3,185 3,055 2,865 189 320 5.8 10.1 9.3 - 10.8 Michigan …………………… 7,780 7,782 4,976 4,889 4,563 4,224 413 665 8.3 13.6 12.9 - 14.3 Ohio ………………………… 8,939 8,970 5,985 5,970 5,592 5,359 393 611 6.6 10.2 9.7 - 10.8 Wisconsin ………………… 4,386 4,416 3,081 3,081 2,933 2,820 148 262 4.8 8.5 8.0 - 9.0
West North Central ………… 15,513 15,633 10,960 10,992 10,420 10,189 540 803 4.9 7.3 7.0 - 7.6 Iowa ………………………… 2,317 2,330 1,678 1,674 1,605 1,574 73 100 4.4 6.0 5.5 - 6.4 Kansas ……………………… 2,112 2,129 1,494 1,519 1,428 1,417 66 102 4.4 6.7 6.2 - 7.2 Minnesota ………………… 4,046 4,081 2,938 2,968 2,780 2,732 158 236 5.4 8.0 7.5 - 8.4 Missouri …………………… 4,577 4,611 3,047 3,037 2,861 2,754 186 283 6.1 9.3 8.6 - 10.0 Nebraska …………………… 1,352 1,362 993 984 961 938 33 45 3.3 4.6 4.2 - 5.0 North Dakota ……………… 498 503 364 365 353 349 12 16 3.2 4.3 3.9 - 4.8 South Dakota ……………… 611 617 446 446 433 425 14 21 3.1 4.8 4.4 - 5.1
South ………………………… 85,026 86,081 54,880 55,063 51,853 50,146 3,027 4,917 5.5 8.9 8.8 - 9.1 South Atlantic ……………… 45,059 45,574 29,498 29,416 27,814 26,634 1,684 2,781 5.7 9.5 9.2 - 9.7 Delaware …………………… 678 687 441 435 419 400 22 35 4.9 8.1 7.5 - 8.7 District of Columbia ……… 480 488 334 332 312 298 22 34 6.6 10.2 9.5 - 11.0 Florida ……………………… 14,487 14,602 9,206 9,197 8,628 8,232 578 966 6.3 10.5 10.1 - 10.9 Georgia …………………… 7,197 7,300 4,838 4,769 4,536 4,312 302 457 6.2 9.6 9.0 - 10.2 Maryland …………………… 4,367 4,407 3,026 2,987 2,894 2,778 133 209 4.4 7.0 6.6 - 7.4 North Carolina ……………… 7,019 7,129 4,570 4,545 4,287 4,061 283 484 6.2 10.6 10.1 - 11.2 South Carolina …………… 3,445 3,497 2,143 2,179 1,995 1,924 147 255 6.9 11.7 10.9 - 12.5 Virginia ……………………… 5,936 6,011 4,131 4,174 3,968 3,896 162 278 3.9 6.7 6.2 - 7.1 West Virginia ……………… 1,449 1,454 809 798 774 735 34 63 4.3 7.9 7.1 - 8.8
East South Central ………… 13,918 14,027 8,552 8,505 8,013 7,635 539 870 6.3 10.2 9.7 - 10.7 Alabama …………………… 3,598 3,627 2,156 2,113 2,044 1,900 112 212 5.2 10.1 8.9 - 11.2 Kentucky …………………… 3,308 3,329 2,047 2,080 1,912 1,863 135 218 6.6 10.5 9.7 - 11.2 Mississippi ………………… 2,189 2,201 1,299 1,292 1,210 1,169 89 123 6.8 9.6 8.7 - 10.4 Tennessee ………………… 4,822 4,870 3,050 3,020 2,846 2,703 204 317 6.7 10.5 9.8 - 11.2
West South Central ………… 26,049 26,480 16,830 17,142 16,026 15,877 804 1,265 4.8 7.4 7.1 - 7.7 Arkansas …………………… 2,188 2,205 1,376 1,370 1,305 1,271 72 100 5.2 7.3 6.5 - 8.0 Louisiana …………………… 3,360 3,397 2,067 2,068 1,975 1,926 92 141 4.5 6.8 6.0 - 7.7 Oklahoma ………………… 2,748 2,778 1,751 1,773 1,687 1,660 64 114 3.7 6.4 5.8 - 7.0 Texas ……………………… 17,753 18,099 11,635 11,931 11,059 11,020 576 911 4.9 7.6 7.3 - 8.0
West …………………………… 53,578 54,323 35,761 35,818 33,517 32,206 2,244 3,612 6.3 10.1 9.9 - 10.3 Mountain …………………… 16,353 16,617 11,082 11,076 10,511 10,154 570 922 5.1 8.3 8.0 - 8.6 Arizona ……………………… 4,868 4,951 3,117 3,143 2,934 2,858 183 284 5.9 9.1 8.3 - 9.8 Colorado …………………… 3,770 3,840 2,728 2,701 2,595 2,493 132 208 4.9 7.7 7.2 - 8.2 Idaho ……………………… 1,132 1,147 756 750 719 690 37 60 4.9 8.0 7.2 - 8.8 Montana …………………… 758 765 510 499 487 468 23 31 4.6 6.2 5.5 - 6.9 Nevada ……………………… 1,976 2,001 1,347 1,370 1,257 1,209 90 161 6.7 11.8 11.0 - 12.5 New Mexico ………………… 1,505 1,522 961 956 918 887 43 69 4.5 7.2 6.4 - 7.9 Utah ………………………… 1,934 1,973 1,368 1,364 1,317 1,275 51 90 3.7 6.6 6.0 - 7.1 Wyoming …………………… 410 417 294 294 285 275 9 19 3.2 6.4 5.8 - 6.9
Pacific ………………………… 37,225 37,706 24,680 24,741 23,005 22,052 1,674 2,689 6.8 10.9 10.6 - 11.1 Alaska ……………………… 503 515 357 361 334 332 23 29 6.5 8.0 7.2 - 8.7 California …………………… 27,679 28,025 18,252 18,250 16,938 16,164 1,313 2,086 7.2 11.4 11.1 - 11.8 Hawaii ……………………… 985 992 646 638 620 595 26 43 4.0 6.8 6.2 - 7.3 Oregon ……………………… 2,970 3,008 1,949 1,964 1,823 1,747 126 217 6.5 11.1 10.4 - 11.7 Washington ………………… 5,087 5,167 3,476 3,529 3,290 3,215 186 314 5.4 8.9 8.3 - 9.5
Puerto Rico …………………… 3,050 3,070 1,366 1,326 1,209 1,127 158 199 11.5 15.0
1 Error ranges are shown at the 90-percent confidence level and are based on unrounded data. unrounded levels. Data for subnational areas reflect revised population controls and NA = Data not available. model reestimation. As a result, they will not add to U.S. totals. Data for Puerto Rico NOTE: Data refer to place of residence. Unemployment rates are in percent and are based on are derived from a monthly household survey similar to the Current Population Survey.
Error range of rate,
2009 1
NA
Unemployed
2008 2009
Unemployment rate
2008 2009
Region, division, and statePopulation Civilian labor force Employed
2008 20092009 2008 2009 2008
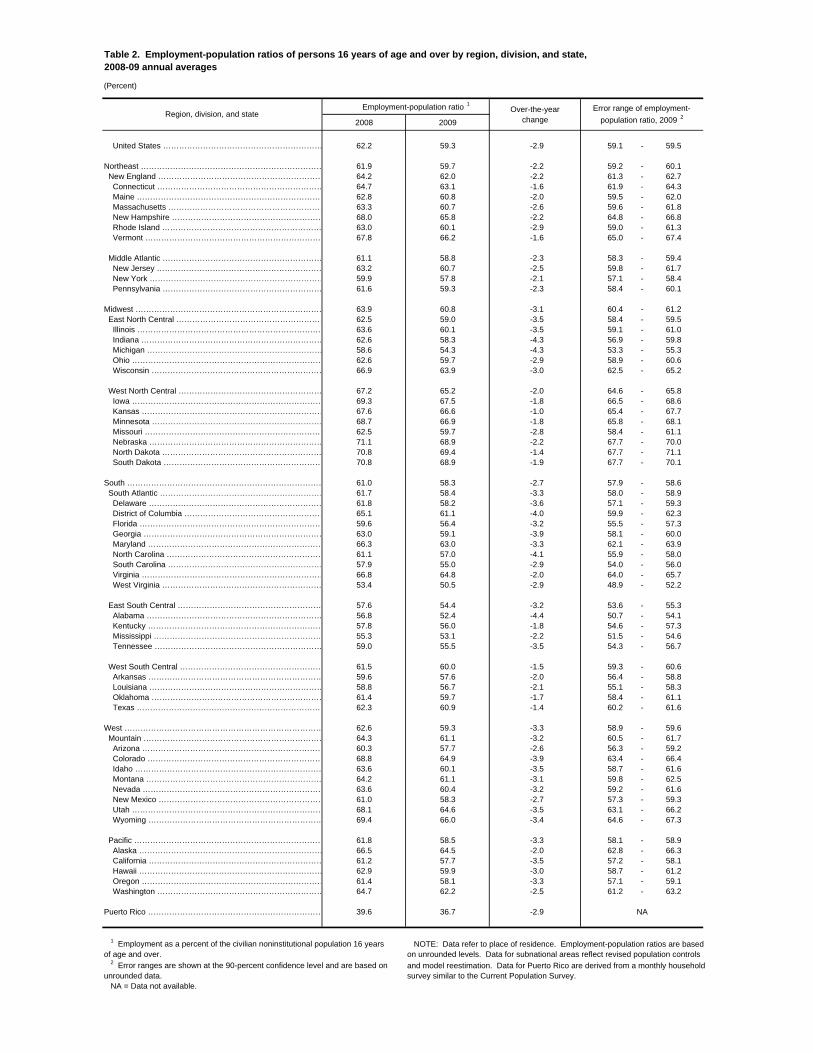
Table 2. Employment-population ratios of persons 16 years of age and over by region, division, and state,2008-09 annual averages
(Percent)
2008 2009
United States …………………………………………………… 62.2 59.3 -2.9 59.1 - 59.5
Northeast …………………………………………………………… 61.9 59.7 -2.2 59.2 - 60.1 New England ……………………………………………………… 64.2 62.0 -2.2 61.3 - 62.7 Connecticut ……………………………………………………… 64.7 63.1 -1.6 61.9 - 64.3 Maine ……………………………………………………………… 62.8 60.8 -2.0 59.5 - 62.0 Massachusetts …………………………………………………… 63.3 60.7 -2.6 59.6 - 61.8 New Hampshire ………………………………………………… 68.0 65.8 -2.2 64.8 - 66.8 Rhode Island …………………………………………………… 63.0 60.1 -2.9 59.0 - 61.3 Vermont ………………………………………………………… 67.8 66.2 -1.6 65.0 - 67.4
Middle Atlantic …………………………………………………… 61.1 58.8 -2.3 58.3 - 59.4 New Jersey ……………………………………………………… 63.2 60.7 -2.5 59.8 - 61.7 New York ………………………………………………………… 59.9 57.8 -2.1 57.1 - 58.4 Pennsylvania …………………………………………………… 61.6 59.3 -2.3 58.4 - 60.1
Midwest ……………………………………………………………… 63.9 60.8 -3.1 60.4 - 61.2 East North Central ………………………………………………… 62.5 59.0 -3.5 58.4 - 59.5 Illinois …………………………………………………………… 63.6 60.1 -3.5 59.1 - 61.0 Indiana …………………………………………………………… 62.6 58.3 -4.3 56.9 - 59.8 Michigan ………………………………………………………… 58.6 54.3 -4.3 53.3 - 55.3 Ohio ……………………………………………………………… 62.6 59.7 -2.9 58.9 - 60.6 Wisconsin ………………………………………………………… 66.9 63.9 -3.0 62.5 - 65.2
West North Central ……………………………………………… 67.2 65.2 -2.0 64.6 - 65.8 Iowa ……………………………………………………………… 69.3 67.5 -1.8 66.5 - 68.6 Kansas …………………………………………………………… 67.6 66.6 -1.0 65.4 - 67.7 Minnesota ………………………………………………………… 68.7 66.9 -1.8 65.8 - 68.1 Missouri …………………………………………………………… 62.5 59.7 -2.8 58.4 - 61.1 Nebraska ………………………………………………………… 71.1 68.9 -2.2 67.7 - 70.0 North Dakota …………………………………………………… 70.8 69.4 -1.4 67.7 - 71.1 South Dakota …………………………………………………… 70.8 68.9 -1.9 67.7 - 70.1
South ………………………………………………………………… 61.0 58.3 -2.7 57.9 - 58.6 South Atlantic ……………………………………………………… 61.7 58.4 -3.3 58.0 - 58.9 Delaware ………………………………………………………… 61.8 58.2 -3.6 57.1 - 59.3 District of Columbia ……………………………………………… 65.1 61.1 -4.0 59.9 - 62.3 Florida …………………………………………………………… 59.6 56.4 -3.2 55.5 - 57.3 Georgia …………………………………………………………… 63.0 59.1 -3.9 58.1 - 60.0 Maryland ………………………………………………………… 66.3 63.0 -3.3 62.1 - 63.9 North Carolina …………………………………………………… 61.1 57.0 -4.1 55.9 - 58.0 South Carolina …………………………………………………… 57.9 55.0 -2.9 54.0 - 56.0 Virginia …………………………………………………………… 66.8 64.8 -2.0 64.0 - 65.7 West Virginia …………………………………………………… 53.4 50.5 -2.9 48.9 - 52.2
East South Central ……………………………………………… 57.6 54.4 -3.2 53.6 - 55.3 Alabama ………………………………………………………… 56.8 52.4 -4.4 50.7 - 54.1 Kentucky ………………………………………………………… 57.8 56.0 -1.8 54.6 - 57.3 Mississippi ……………………………………………………… 55.3 53.1 -2.2 51.5 - 54.6 Tennessee ……………………………………………………… 59.0 55.5 -3.5 54.3 - 56.7
West South Central ……………………………………………… 61.5 60.0 -1.5 59.3 - 60.6 Arkansas ………………………………………………………… 59.6 57.6 -2.0 56.4 - 58.8 Louisiana ………………………………………………………… 58.8 56.7 -2.1 55.1 - 58.3 Oklahoma ………………………………………………………… 61.4 59.7 -1.7 58.4 - 61.1 Texas ……………………………………………………………… 62.3 60.9 -1.4 60.2 - 61.6
West ………………………………………………………………… 62.6 59.3 -3.3 58.9 - 59.6 Mountain …………………………………………………………… 64.3 61.1 -3.2 60.5 - 61.7 Arizona …………………………………………………………… 60.3 57.7 -2.6 56.3 - 59.2 Colorado ………………………………………………………… 68.8 64.9 -3.9 63.4 - 66.4 Idaho ……………………………………………………………… 63.6 60.1 -3.5 58.7 - 61.6 Montana ………………………………………………………… 64.2 61.1 -3.1 59.8 - 62.5 Nevada …………………………………………………………… 63.6 60.4 -3.2 59.2 - 61.6 New Mexico ……………………………………………………… 61.0 58.3 -2.7 57.3 - 59.3 Utah ……………………………………………………………… 68.1 64.6 -3.5 63.1 - 66.2 Wyoming ………………………………………………………… 69.4 66.0 -3.4 64.6 - 67.3
Pacific ……………………………………………………………… 61.8 58.5 -3.3 58.1 - 58.9 Alaska …………………………………………………………… 66.5 64.5 -2.0 62.8 - 66.3 California ………………………………………………………… 61.2 57.7 -3.5 57.2 - 58.1 Hawaii …………………………………………………………… 62.9 59.9 -3.0 58.7 - 61.2 Oregon …………………………………………………………… 61.4 58.1 -3.3 57.1 - 59.1 Washington ……………………………………………………… 64.7 62.2 -2.5 61.2 - 63.2
Puerto Rico ………………………………………………………… 39.6 36.7 -2.9
1 Employment as a percent of the civilian noninstitutional population 16 years NOTE: Data refer to place of residence. Employment-population ratios are basedof age and over. on unrounded levels. Data for subnational areas reflect revised population controls
2 Error ranges are shown at the 90-percent confidence level and are based on and model reestimation. Data for Puerto Rico are derived from a monthly householdunrounded data. survey similar to the Current Population Survey. NA = Data not available.
NA
Employment-population ratio 1
Region, division, and statechange
Over-the-year Error range of employment-
population ratio, 2009 2

Cha
rt 1.
Ove
r-the
-yea
r cha
nge
in u
nem
ploy
men
t rat
es b
y st
ate,
2009
ann
ual a
vera
ges
WA
SH.
Wes
tN
orth
Cen
tral
Mou
ntai
n
East
New
Eng
land
WA
SH.
(U.S
. cha
nge
= +3
.5 p
erce
ntag
e po
ints
)
OR
E.
IDA
HO
MO
NT.
WY
O.
N.D
.
S.D
.
MIN
N.
IOW
A
WIS
.
MIC
H.
N.Y
.
VT. N
.H.M
AIN
E
#
MAS
S.
#
CO
NN
.#
R.I.
Nor
thC
entra
l Mid
dle
Atla
ntic
OR
E.
IDA
HO
MO
NT.
WY
O.
N.D
.
S.D
.
MIN
N.
IOW
A
WIS
.
MIC
H.
N.Y
.
VT. N
.H.M
AIN
E
#
MAS
S.
#
CO
NN
.
NEV
.
CAL
IF.
UTA
H
CO
LO.
NEB
.
KAN
.
ARIZ
.
MO
.
ILL.
IOW
A
IND
.O
HIO
KY.
PA.
W.V
A.VA
.
#
N.J
.
#
DEL
.#
MD
.
DC
NEV
.
CAL
IF.
UTA
H
CO
LO.
NEB
.
KAN
.
ARIZ
.
MO
.
ILL.
IOW
A
IND
.O
HIO
KY.
PA.
W.V
A.VA
.
#
N.J
.
#
DEL
.#
MD
.
ARIZ
.N
.M.
TEX
AS
OK
LA.
ARK
.
LA.
MIS
S.
TEN
N.
N.C
.
S.C
.
GA
.
ALA
.
D.C
.
Sou
thAt
lant
ic
Paci
fic
ARIZ
.N
.M.
TEX
AS
OK
LA.
ARK
.
LA.
MIS
S.
TEN
N.
N.C
.
S.C
.
GA
.
ALA
.
FLA.
East
Sout
h C
entra
lW
est
Sout
h C
entra
l
FLA.
+3.6
poi
nts
or m
ore
+2.6
to +
3.5
poin
ts
+2.5
poi
nts
or le
ss
HAW
AII
ALA
SKA

(U.S
.rat
e=
9.3
perc
ent)
Cha
rt 2.
Une
mpl
oym
ent r
ates
by
stat
e, 2
009
annu
al a
vera
ges
WA
SH.
Wes
tN
orth
Cen
tral
Mou
ntai
n
East
New
Eng
land
WA
SH.
(U.S
.rat
e9.
3pe
rcen
t)
OR
E.
IDA
HO
MO
NT.
WY
O.
N.D
.
S.D
.
MIN
N.
IOW
A
WIS
.
MIC
H.
N.Y
.
VT. N
.H.M
AIN
E
#
MAS
S.
#
CO
NN
.#
R.I.
Nor
thC
entra
l Mid
dle
Atla
ntic
OR
E.
IDA
HO
MO
NT.
WY
O.
N.D
.
S.D
.
MIN
N.
IOW
A
WIS
.
MIC
H.
N.Y
.
VT. N
.H.M
AIN
E
#
MAS
S.
#
CO
NN
.
NEV
.
CAL
IF.
UTA
H
CO
LO.
NEB
.
KAN
.
ARIZ
.
MO
.
ILL.
IOW
A
IND
.O
HIO
KY.
PA.
W.V
A.VA
.
#
N.J
.
#
DEL
.#
MD
.
DC
NEV
.
CAL
IF.
UTA
H
CO
LO.
NEB
.
KAN
.
ARIZ
.
MO
.
ILL.
IOW
A
IND
.O
HIO
KY.
PA.
W.V
A.VA
.
#
N.J
.
#
DEL
.#
MD
.
ARIZ
.N
.M.
TEX
AS
OK
LA.
ARK
.
LA.
MIS
S.
TEN
N.
N.C
.
S.C
.
GA
.
ALA
.
D.C
.
Sou
thAt
lant
ic
Paci
fic
ARIZ
.N
.M.
TEX
AS
OK
LA.
ARK
.
LA.
MIS
S.
TEN
N.
N.C
.
S.C
.
GA
.
ALA
.
FLA.
East
Sout
h C
entra
lW
est
Sout
h C
entra
l
FLA.
8.0%
to 9
.9%
10.0
% to
11.
9%
12.0
% o
r hig
her
5.9%
or l
ower
6.0%
to 7
.9%
HAW
AII
ALA
SKA

(U.S
.ave
rage
=59
.3pe
rcen
t)
Cha
rt 3.
Em
ploy
men
t-pop
ulat
ion
ratio
s by
sta
te, 2
009
annu
al a
vera
ges
WA
SH.
Wes
tN
orth
Cen
tral
Mou
ntai
n
East
New
Eng
land
WA
SH.
(U.S
.ave
rage
59.3
perc
ent)
OR
E.
IDA
HO
MO
NT.
WY
O.
N.D
.
S.D
.
MIN
N.
IOW
A
WIS
.
MIC
H.
N.Y
.
VT. N
.H.M
AIN
E
#
MAS
S.
#
CO
NN
.#
R.I.
Nor
thC
entra
l Mid
dle
Atla
ntic
OR
E.
IDA
HO
MO
NT.
WY
O.
N.D
.
S.D
.
MIN
N.
IOW
A
WIS
.
MIC
H.
N.Y
.
VT. N
.H.M
AIN
E
#
MAS
S.
#
CO
NN
.
NEV
.
CAL
IF.
UTA
H
CO
LO.
NEB
.
KAN
.
ARIZ
.
MO
.
ILL.
IOW
A
IND
.O
HIO
KY.
PA.
W.V
A.VA
.
#
N.J
.
#
DEL
.#
MD
.
DC
NEV
.
CAL
IF.
UTA
H
CO
LO.
NEB
.
KAN
.
ARIZ
.
MO
.
ILL.
IOW
A
IND
.O
HIO
KY.
PA.
W.V
A.VA
.
#
N.J
.
#
DEL
.#
MD
.
ARIZ
.N
.M.
TEX
AS
OK
LA.
ARK
.
LA.
MIS
S.
TEN
N.
N.C
.
S.C
.
GA
.
ALA
.
D.C
.
Sou
thAt
lant
ic
Paci
fic
ARIZ
.N
.M.
TEX
AS
OK
LA.
ARK
.
LA.
MIS
S.
TEN
N.
N.C
.
S.C
.
GA
.
ALA
.
FLA.
East
Sout
h C
entra
lW
est
Sout
h C
entra
l
FLA.
62.0
% o
r hig
her
59.0
% to
61.
9%
58.9
% o
r low
er
HAW
AII
ALA
SKA


![€¦ · Web view2009. 4. 23. · [Cr2O72-] Reverse Rate. A. increases increases. B. increases decreases. C. decreases decreases. D. decreases increases. 31. A small amount of H2SO4](https://img.dokumen.tips/doc/110x75/608f2c47b9e3f5096f2e5efc/web-view-2009-4-23-cr2o72-reverse-rate-a-increases-increases-b-increases.jpg)