Embed Size (px)
Citation preview
30 Churchill Place Canary Wharf London E14 5EU United Kingdom
An agency of the European Union
Telephone +44 (0)20 3660 6000 Facsimile +44 (0)20 3660 5555
Send a question via our website www.ema.europa.eu/contact
© European Medicines Agency, 2018. Reproduction is authorised provided the source is acknowledged.
19 July 2018 1 EMA/CVMP/849775/2017 2 Committee for Medicinal Products for Veterinary Use (CVMP) 3
4
Reflection paper on dose optimisation of established 5
veterinary antibiotics in the context of SPC harmonisation 6
Draft 7
Adopted by CVMP for release for consultation 19 July 2018
Start of public consultation 27 July 2018
End of consultation (deadline for comments) 31 January 2019
8
Comments should be provided using this template. The completed comments form should be sent to
9
Keywords antimicrobial resistance (AMR), summary of product characteristics (SPC),
Dose optimisation, pharmacokinetic/pharmacodynamic (PK/PD) modelling,
target animal safety (TAS), withdrawal periods (WP) and the environmental
risk assessment (ERA)
10

Reflection paper on dose optimisation of established veterinary antibiotics in the context of SPC harmonisation
EMA/CVMP/849775/2017 Page 2/120
Executive summary 11
The Committee for Medicinal Products for Veterinary Use (CVMP) has conducted a pilot project on dose 12
optimisation of established veterinary antibiotics. Established veterinary antibiotics are not always used 13
at the authorised dose. Doses may need to be reviewed in order to maintain effectiveness and to limit 14
the development of antimicrobial resistance (AMR). However, a change in dose may have implications 15
for target animal safety (TAS), withdrawal periods (WP) and the environmental risk assessment (ERA). 16
This implies the need for many studies, but Marketing Authorisation Holders may not have the 17
resources to perform them. Thus, requiring such data may lead to decreased product availability, 18
which could have a negative impact also on the antimicrobial resistance problem. The project aimed at 19
developing and testing non-experimental approaches for dose optimisation and evaluating the 20
consequences on WP, TAS, and ERA, with the final objective to improve the Summary of Product 21
Characteristics of veterinary antibiotics authorised in the EU. 22
Dose optimisation of products or groups of products also could be helpful in the process of the 23
harmonisation of authorisation of VMPs throughout the EU. The desired minimum level of 24
harmonisation would obviously be a harmonisation of individual products authorised across different 25
Member States (i.e. at product level). However, because of the group-wise analysis (i.e. grouping of 26
products with the same animal species, disease, route of administration, and pharmaceutical form), 27
some aspects such as the optimised dose, may also be applied to different products within the same 28
group, as was done in this pilot project for the case studies with amoxicillin and oxytetracycline. 29
Non-experimental approaches based on well-established scientific principles, were used, namely PK/PD 30
integration for dose optimisation, PK modelling for WP adjustment, and scientific review approaches to 31
address the safety of both target animals and the environment, using data from the registration 32
dossiers and published literature. Where needed, the group consulted with additional experts from 33
academia, regulators and industry. The approaches were tested in two case studies: (1) the treatment 34
of respiratory infections in pigs by administration of amoxicillin (AMO) in drinking water; (2) the 35
treatment of respiratory infections in (lactating) cattle by injection of oxytetracycline (OTC). The latter 36
case study was expected to be more difficult due to formulation-specific pharmacokinetics and varying 37
WPs for tissues and milk and considering residues at the injection site. Anonymised relevant data for 38
these case studies were kindly provided by AnimalhealthEurope and the European Group for Generic 39
Veterinary Products (EGGVP). 40
The methods developed and used were applicable to both case studies and a comprehensive and 41
scientifically sound review of the approved doses was possible. PK/PD analysis clearly showed that the 42
dose for AMO should be 40 mg/kg bw, which is twice the dose for most of the currently authorised 43
products. For OTC, different optimised doses had to be calculated for the 10% vs 20% formulations, 44
due to different pharmacokinetics. For the 10% formulations, the optimised daily dose was 10 mg/kg 45
bw for 3-5 days, which was equal to the currently authorised doses for most products. For the 20% 46
formulations, the optimised dose was two doses of 20 mg/kg bw, given 36-48 hours apart. This dose 47
was the same as for most authorised products; however the addition of a second dose is currently not 48
part of most of the authorisations. The calculation of new WPs was based on tissue residue depletion 49
with overall tissue half-lives of 2 days for AMO and 6 days for OTC. Dose increases did not give rise to 50
any TAS or ERA concerns, except in relation to local reactions for OTC, which would limit the injection 51
site volume. 52
While a non-experimental dose review appears possible, its implementation depends very much on the 53
support of all interested parties, including the Heads of Medicines Agencies, the Federation of 54
Veterinarians of Europe, and industry. 55

Reflection paper on dose optimisation of established veterinary antibiotics in the context of SPC harmonisation
EMA/CVMP/849775/2017 Page 3/120
This Pilot Project was performed to test the feasibility of the various non experimental methods. It 56
should be noted, that the outcome of the dose review was based on a limited amount of data, gathered 57
from public sources or provided by industry. Therefore the numerical results (e.g. optimised dose, WT 58
etc.) are merely indicative, and may not reflect a final outcome (e.g. after a referral in which all related 59
VMP authorised in the EU are included). 60

Reflection paper on dose optimisation of established veterinary antibiotics in the context of SPC harmonisation
EMA/CVMP/849775/2017 Page 4/120
Table of contents 61
Executive summary ..................................................................................... 2 62
1. Introduction ............................................................................................ 6 63
1.1. Background ......................................................................................................... 6 64
1.2. Scope ................................................................................................................. 7 65
1.3. Aim of the project ................................................................................................ 7 66
1.4. Development and testing of the approaches ............................................................ 8 67
1.5. Acknowledgements ............................................................................................... 8 68
2. General considerations ............................................................................ 8 69
2.1. Criteria for selection of products for which doses should be optimised ......................... 8 70
2.2. Collection, integration, and application of data: the hour glass approach ..................... 9 71
3. PK/PD approach for dose optimisation .................................................. 10 72
3.1. Background to the evaluation of the applicability of PK/PD modelling approaches to 73
address doses .......................................................................................................... 10 74
3.2. Scientific appropriateness and the applicability of (modelling) approaches to address 75
doses ...................................................................................................................... 11 76
3.3. Proposed approach to address doses .................................................................... 12 77
4. PK approach for withdrawal period adjustment..................................... 17 78
4.1. General considerations on the calculation of withdrawal periods ............................... 17 79
4.2. Current situation regarding withdrawal periods for established antibiotics .................. 17 80
4.3. Proposed algorithm to address the extrapolation of withdrawal periods ..................... 18 81
4.4. Proposed steps to address the extrapolation of withdrawal periods ........................... 20 82
4.5. Injection sites .................................................................................................... 20 83
4.6. Some case studies from literature in eggs and milk ................................................ 21 84
5. Approach for addressing risks for the environment ............................... 23 85
5.1. Introduction....................................................................................................... 23 86
5.2. The impact of dose optimisation on the ERA .......................................................... 24 87
5.3. Proposed approach to address the ERA ................................................................. 25 88
6. Approach for addressing risks for the target animal .............................. 29 89
6.1. Background to the evaluation of target animal safety .............................................. 29 90
6.2. The impact of dose improvement on the evaluation of target animal safety ............... 29 91
6.3. Proposed approach to address target animal safety ................................................ 30 92
6.4. Data sources ..................................................................................................... 32 93
7. Case study amoxicillin ........................................................................... 33 94
7.1. Introduction....................................................................................................... 33 95
7.2. Dose optimisation ............................................................................................... 33 96

Reflection paper on dose optimisation of established veterinary antibiotics in the context of SPC harmonisation
EMA/CVMP/849775/2017 Page 5/120
7.3. Withdrawal period .............................................................................................. 42 97
7.4. Environmental risk assessment ............................................................................ 54 98
7.5. Target animal safety ........................................................................................... 55 99
7.6. Overall conclusion and recommendations on amoxicillin .......................................... 58 100
8. Case study oxytetracycline .................................................................... 59 101
8.1. Introduction....................................................................................................... 59 102
8.2. Dose optimisation ............................................................................................... 59 103
8.3. Withdrawal period .............................................................................................. 67 104
8.4. Environmental risk assessment ............................................................................ 84 105
8.5. Target animal safety ........................................................................................... 85 106
8.6. Overall conclusion on oxytetracycline .................................................................... 89 107
9. Discussion and conclusions ................................................................... 90 108
9.1. Dose optimisation by PK/PD analysis .................................................................... 90 109
9.2. Withdrawal Period adjustment by PK analysis ........................................................ 95 110
9.3. Addressing environmental risks by a data review approach ...................................... 96 111
9.4. Addressing target animal safety by a data review approach ..................................... 97 112
9.5. Regulatory processes to effectuate the harmonisation of the product literature .......... 98 113
9.6. Need for further research .................................................................................. 100 114
10. CVMP Recommendations ................................................................... 100 115
11. Glossary ............................................................................................ 101 116
12. References ........................................................................................ 105 117
13. Annexes ............................................................................................. 111 118
119
Reflection paper on dose optimisation of established veterinary antibiotics in the context of SPC harmonisation
EMA/CVMP/849775/2017 Page 6/120
1. Introduction 120
The Committee for Medicinal Products for Veterinary Use (CVMP) started a pilot project on dose 121
optimisation of established veterinary antibiotics to which AnimalhealthEurope (formerly IFAH Europe), 122
and the European Group for Generic Veterinary Products (EGGVP) were invited to provide anonymised 123
data. The results of this project are for consideration by the CVMP for possible future work on the 124
subject. 125
1.1. Background 126
Safeguarding the continued availability of established veterinary antibiotics is important for the 127
veterinary sector. The main reason for this is that likely very few new antibacterial active substances 128
will be developed for use in veterinary medicine. In addition, due to concerns about antimicrobial 129
resistance (AMR) in humans and animals, there is a pressure to limit the veterinary use of some 130
antibiotics (e.g. fluoroquinolones, 3rd- and 4th-generation cephalosporins, and colistin). However, the 131
availability of the older veterinary antibiotics is essential to keep a range of safe and effective 132
treatment options for bacterial diseases in animals in the EU. The strategy of the EU regulatory 133
network is to preserve the established antibiotics for veterinary medicine by ensuring that the 134
conditions of use are harmonised and aligned with the principles of responsible use. 135
It is acknowledged that established veterinary antibiotics are not always used in accordance with the 136
authorised Summary of Product Characteristics (SPC). One of the reasons could be that the SPC 137
recommendations are no longer up-to-date. In some cases, emerging antimicrobial resistance (AMR) 138
has resulted in changed susceptibility distributions of the pathogens for which these antibacterial 139
products are indicated. As a consequence, the posology described in the authorised product 140
information of these products may require a critical evaluation in order to be updated for the desired 141
level of effectiveness and to limit the development of AMR, under modern animal production 142
conditions. 143
Indications that a review of the posology could be needed can be based on the use of the product in 144
the field, susceptibility patterns of the target pathogens, pharmacokinetic and clinical data. Should 145
there be a need to optimise the posology, this should ideally be supported by data on dose finding, 146
dose confirmation, and field efficacy data. A change in the posology of a product, in particular an 147
increase in the dose or in the dosing frequency, can have implications for target animal safety (TAS), 148
and also, in the case of food producing species, for the withdrawal periods (WP) and the environmental 149
risk assessment (ERA). If the optimisation of posology is handled via variations using current dossier 150
requirements for new marketing authorisations, then this would require a substantial update to the 151
authorisation dossier. It is considered unlikely that this would be a viable approach: most Marketing 152
Authorisation Holders (MAHs) will not have the resources for this, and consequently this approach may 153
lead to a decreased availability of established veterinary antibiotics, which could have a negative 154
impact on the resistance problem. 155
The CVMP recognised that the current regulatory environment does not stimulate the realisation of the 156
desired dose optimisations. CVMP wished therefore to explore if non-experimental approaches to 157
improve the SPCs of old veterinary antibiotics could be identified in lieu of new clinical, safety and 158
residue data. The CVMP recognised that such options might be less optimal (as compared to a new full 159
dossier), but yet may still be helpful in improving the posology in the SPCs, which would in turn 160
facilitate harmonisation of national authorisations of individual products across EU Member States 161
(MSs). 162

Reflection paper on dose optimisation of established veterinary antibiotics in the context of SPC harmonisation
EMA/CVMP/849775/2017 Page 7/120
It was recognised that non-experimental approaches may be useful to improve the posology and to 163
address the safety issues that may be associated with a dose increase. However, such approaches 164
might not be possible in all situations or for all veterinary antibiotics (e.g. in the case of non-linear PK). 165
In order to test the non-experimental (e.g. modelling) approaches, it was agreed that the CVMP would 166
initiate a pilot project with data input from industry. 167
1.2. Scope 168
This pilot project comprises the development and testing of non-experimental scientific approaches for 169
dose optimisation, and for assessments of safety for consumers, target animals and the environment; 170
these approaches can be used as tools for improving the label instructions of established veterinary 171
antibiotics authorised in the EU, in the context of SPC harmonisation. Proposals for selection and 172
prioritisation of candidate antibiotics for dose optimisation will be made. Whilst recommendations for 173
future implementation of dose optimisation can be made, the selection of regulatory procedures for 174
SPC harmonisation and the legal implications are outside the scope of the pilot project. 175
1.3. Aim of the project 176
The general aim of the pilot project is to obtain knowledge on the feasibility of the use of modelling or 177
other approaches as a substitute for clinical data, residue depletion data, ERA data, and TAS data, as a 178
tool for the optimisation of the posology for established veterinary antibiotics in the context of 179
harmonisation of product literature of individual products. 180
Specific objectives included: 181
to agree on the rationale/objectives for the optimisation of the posology for established veterinary 182
antibiotics; 183
to establish criteria for selection of products for which doses should be optimised/reviewed; 184
to obtain a common understanding of the applicability of PK/PD modelling and other sources of 185
information for posology optimisation; 186
to obtain an agreement on the PK/PD techniques and applicability to be used for dose optimisation 187
in the context of harmonisation of established veterinary antibiotics; 188
to obtain an agreement on the acceptability and applicability of PK techniques for withdrawal 189
period extrapolation in the context of harmonisation of established veterinary antibiotics; 190
to obtain an agreement on the approach to be used for the evaluation of the impact of posology 191
optimisation on target animal safety in the context of harmonisation of established veterinary 192
antibiotics; 193
to obtain an agreement on the approach to be used for the evaluation of the impact of posology 194
optimisation on environmental safety in the context of harmonisation of established veterinary 195
antibiotics; 196
to discuss the possible approaches for the regulatory processes to effectuate the harmonisation of 197
the product literature, and consider the impact and implications on the future product development 198
and improvements. 199
to explore possibilities for funding under Horizon 2020 or other funding sources, for studies to fill 200
gaps in data for off-patent veterinary antibiotics related to optimising dosing with respect to 201
minimising risks from AMR where progress is not possible without generation of additional data. 202
Reflection paper on dose optimisation of established veterinary antibiotics in the context of SPC harmonisation
EMA/CVMP/849775/2017 Page 8/120
1.4. Development and testing of the approaches 203
The non-experimental approaches developed were based on scientific considerations, and on well-204
established modelling techniques. Where needed, the group consulted additional experts from 205
academia, regulators, and industry. A PK/PD modelling approach for the dose optimisation, a PK 206
modelling approach for the adjustment of the withdrawal periods, and data review approaches to 207
address the safety of both the environment and target animals were developed. These approaches are 208
described in chapters 3, 4, 5, and 6, respectively. 209
Whilst the approaches need to be scientifically robust, they also should be practically applicable and fit 210
for purpose. Therefore, the approaches were tested in two case studies. The case studies were 211
selected based on the expectation that one would be relatively easy and the other one would be 212
relatively difficult, so they could be used to demonstrate both the capabilities and the limitations of the 213
approaches. The treatment of respiratory infections in pigs by oral administration of amoxicillin in the 214
drinking water was selected as the relatively easy case study. The treatment of respiratory infections 215
in cattle, including lactating cattle, by parenteral administration of oxytetracycline was selected as the 216
relatively difficult case study. The difficulties for the latter case study were expected to be related to 217
formulation-specific pharmacokinetics and to withdrawal periods for meat (including injection sites) 218
and milk. Relevant data for these case studies were kindly provided by AnimalhealthEurope and 219
EGGVP. The case studies for amoxicillin and oxytetracycline are presented in chapters 7 and 8, 220
respectively. 221
This Pilot Project was performed to test the feasibility of the various non experimental methods. It 222
should be noted, that the outcome of the dose review was based on a limited amount of data, gathered 223
from public sources or provided by industry. Therefore the numerical results (e.g. optimised dose, WT 224
etc.) are merely indicative, and may not reflect a final outcome (e.g. after a referral in which all related 225
VMP authorised in the EU are included). 226
1.5. Acknowledgements 227
Ludovic Pelligand and Alain Bousquet-Melou are gratefully acknowledged for providing their expertise. 228
2. General considerations 229
2.1. Criteria for selection of products for which doses should be optimised 230
It is acknowledged that the established veterinary antibiotics authorised in the EU might not always 231
have the optimal dose on the label today. However, this may not be the case for all products. 232
Therefore, not all veterinary antibiotics need to be reviewed. To select the candidates for which a dose 233
optimisation may be needed, the following criteria is proposed: 234
the existence of different dosage recommendations for the products in the SPCs, 235
o within a product between MSs; different doses within a product from the same MAH are a 236
clear indicator of the need to optimise the dose. 237
o or between similar products without obvious reasons (such as differences in formulation) 238
evidence of lack of efficacy from pharmacovigilance data, formularies, literature 239
evidence of decreased susceptibility or increased resistance of target pathogens. 240

Reflection paper on dose optimisation of established veterinary antibiotics in the context of SPC harmonisation
EMA/CVMP/849775/2017 Page 9/120
A further prioritisation of the selected candidates is proposed, by scoring on Antimicrobial Advice Ad 241
Hoc Expert Group (AMEG) categorisation, administration route, use, and specific evidence of AMR risks, 242
in accordance with the table below. 243
Table 1. Scoring table for prioritisation of selected candidates for dose optimisation 244
AMEG
categorisation
OIE
categorisation
Administration
route
Antibiotic
consumption (in
accordance with
ESVAC data)*
Specific evidence
of AMR risk
Category 2 ++ VCIA ++ Group oral ++ Expert judgement
Category 1 + VHIA + Parenteral or
individual oral +
No category / VIA / Topical/local** /
* Stratification to be further developed 245
**The PKPD approach has not been considered for topical/locally applied products within this project 246
The scores are graded as “/” (nil), “+”and “++”. 247
2.2. Collection, integration, and application of data: the hour glass 248
approach 249
This pilot project, was aimed at the dose optimisation and harmonisation at the level of the veterinary 250
medicinal product, not at the level of the pharmacologically active substance. The decision was based 251
on the following scientific and practical considerations. 252
1. Although products with the same active ingredient may be indicated for the same condition in the 253
same target animal, the difference in formulation and route or method of administration may result 254
in different absorption characteristics and therefore a different pharmacokinetic profile. 255
Consequently, in some cases a different posology may be needed to attain a similar plasma 256
concentration of the active ingredient. 257
2. A product-by-product approach will result in safe and effective posologies, with a minimal market 258
disturbance. 259
Whereas a product-by-product approach is used, the modelling and review approaches will benefit 260
from the input of all relevant information across products, and in addition the information from other 261
sources such as published papers. Therefore, the data will be collected at the level of an animal 262
species-disease indication-route of administration-pharmaceutical form level (as in the case studies, 263
see 1.4. ). The information will be integrated in the review approaches (ERA and TAS) and in the 264
selection of model parameters (dose and WP). It should be noted that the integration of data from 265
different dossiers would not be legally possible in the context of procedures for a single veterinary 266
medicinal product. However, in procedures where more products are included, such as an article 35 267
referral procedure, this would be possible. Information integration will facilitate the optimal estimation 268
for the relevant parameters. Following the integration of the information, the outcome of the 269
(modelling) approaches will be applied to the individual products. For example, if a 2-fold increase in 270
dose requires an extra 3 days withdrawal period, then 3 days would be added to the authorised 271
withdrawal periods, which can be different for the different products. In this way, the current 272
difference in authorised withdrawal periods will not be disturbed. This approach was designated as the 273
hour glass approach which is depicted in Figure 1. 274

Reflection paper on dose optimisation of established veterinary antibiotics in the context of SPC harmonisation
EMA/CVMP/849775/2017 Page 10/120
275
276
Figure 1. The hour glass approach 277
3. PK/PD approach for dose optimisation 278
3.1. Background to the evaluation of the applicability of PK/PD modelling 279
approaches to address doses 280
In the EU, the evaluation of doses for new veterinary medicinal products is in accordance with the 281
requirements of Directive 2001/82/EC. The revised guideline for the demonstration of efficacy for 282
veterinary medicinal products containing antimicrobial substances (EMA/CVMP/627/2001-Rev.1) 283
specifies the data required to demonstrate the therapeutic efficacy of a veterinary medicinal product 284
(VMP) containing an antibacterial agent for (a) given indication(s) using an appropriate therapeutic 285
regimen. 286
To be effective, the dose of an antibacterial agent must be selected considering the susceptibility of the 287
target bacteria. Therefore, for all compounds with systemic activity, the in vitro susceptibility data 288
(Minimal Inhibitory Concentration, MIC) (Pharmacodynamic or PD) collected should be compared with 289
the concentration of the compound at the relevant biophase (Pharmacokinetic or PK) following 290
administration at the assumed therapeutic dose as recorded in the pharmacokinetic studies. Based on 291
MIC data, and target animal PK data, an analysis for the PK/PD relationship may be used to support 292
dose regimen selection and interpretation criteria for resistance. The overall assessment of the PK/PD 293
relationship should be sufficiently comprehensive to assess with reasonable confidence whether or not 294
the investigational antibacterial agent, when used at the selected dose regimen, would show clinical 295
efficacy against claimed target pathogens that appear to be susceptible in vitro. It is acknowledged 296
that the PK/PD analyses will be based on PK data obtained from healthy or experimentally infected 297
animals. 298

Reflection paper on dose optimisation of established veterinary antibiotics in the context of SPC harmonisation
EMA/CVMP/849775/2017 Page 11/120
3.2. Scientific appropriateness and the applicability of (modelling) 299
approaches to address doses 300
In the last 20 years, the PK/PD approach has been recognised as an important tool for the 301
development of new antibiotics as a way to integrate different data about antibacterial efficacy, 302
pharmacology and bacteriology during product development (Drusano, 2016). According to guideline 303
EMA/CVMP/627/2001-Rev.1, use of the PK/PD relationship can be made to justify the dosages to be 304
used in dose-determination studies or in some cases where the PK/PD relationship is well established 305
using validated approaches, it may be possible to omit dose-determination studies and to confirm the 306
efficacy of one or a very few dose regimens in clinical trials (dose confirmation and clinical field 307
studies). In human health, the PK/PD approach is also used in the process of definition of a clinical 308
breakpoint by EUCAST (Mouton et al., 2012). With the increase of knowledge about the relationship 309
between antibiotic exposure, AMR selection and bacteriological and clinical cure, it was recommended 310
to review available data to investigate the dosage regimen of established veterinary antibiotics and to 311
assess their potency against target pathogens. 312
The PK/PD approach combines information about the PK of the molecule and the PD which describe the 313
effect of the molecule on the target bacteria. Mathematical models have been developed to describe 314
the evolution of concentration-time curve and to assess the effect on bacteria using parameters 315
observed in vivo or extrapolated from in vitro or ex vivo studies. These approaches are currently used 316
to analyse data obtained from different experimental studies and to simulate different exposure 317
conditions (Nielsen & Friberg, 2013). Based on the analysis of clinical trials, experimental in vitro and 318
in vivo studies, and mathematical models, a relationship between clinical and bacteriological targets 319
and PK/PD was established (Ambrose et al., 2007). 320
The relationship between a pharmacokinetic parameter and apharmacodynamic parameter to predict 321
clinical efficacy is labelled as a PK/PD index (PDI). Minimal inhibitory concentration (MIC) is the most 322
used pharmacodynamic parameter. It corresponds to the first concentration where no visible growth of 323
bacteria is observed under standardised conditions. Three pharmacokinetic parameters are commonly 324
used in PK/PD integrations (Annex 2): 325
the total concentration integrated over a given time interval (area under the curve, AUC), 326
the highest concentration (Cmax) observed at the peak, 327
the time during which the concentration exceeds a specific threshold (time above MIC, TC>MIC). 328
PK/PD assessments are based upon the MIC for the target pathogen and the unbound antibiotic 329
concentration in the host plasma, because only the free fraction has an antibacterial activity. An italic f 330
(for free) is added when indices are based on unbound product concentration. The notation of the 331
three PK/PD indices have been standardised (Mouton et al., 2005) into fAUC/MIC, fCmax/MIC and 332
fT>MIC. If there are no subscripts indicating a time interval, it is assumed that the calculations of AUC 333
and T>MIC were based on a 24-hour interval at pharmacokinetic steady-state conditions. 334
PK/PD indices can be viewed as predictors of clinical efficacy. Correlation between PK/PD indices and 335
clinical and bacteriological cure were determined from experimental models with laboratory animals. 336
Retrospective and prospective clinical trials in human medicine have studied this correlation for 337
different pathologies and show a good agreement between experimental and clinical observations 338
(Ambrose et al., 2007). Based on the review of this observation for different classes of antibiotics, a 339
consensus was reached to propose the definition of PK/PD target (PDT) predicting a high level of cure 340
(>80-90 %). 341
Reflection paper on dose optimisation of established veterinary antibiotics in the context of SPC harmonisation
EMA/CVMP/849775/2017 Page 12/120
- Betalactams (penicillins, cephalosporins) exhibit time-dependent microbiological effects, meaning 342
that maximizing ƒT>MIC will enhance bacterial killing. In general, betalactams require 40-80% 343
ƒT>MIC of the dosage interval to achieve bactericidal activity depending on the individual class 344
and the target bacterial species (Ambrose, Bhavnani et al., 2007). 345
- For fluoroquinolones which are concentration-dependent, fAUC24h/MIC predicts efficacy against 346
gram-negative bacteria if a target value from 70 to 125 is reached. A target value of 125 hours, 347
corresponds to mean concentrations over 24 hours equal to 5 times the MIC (i.e. 125/24) 348
(Ambrose et al., 2007; Schentag, et al., 2000). 349
- For aminoglycosides, the fCmax/MIC is used as best predicator of therapeutic efficacy. It is 350
generally agreed that to obtain a clinical response of >90% in patients and reduce the risk of 351
emergence of resistance, Cmax/MIC needs to be 8-12 (Moore et al., 1984; Craig et al., 1998). 352
It is important to note that all three PK/PD indices are correlated in the sense that Cmax/MIC describes 353
an intensity, T>MIC describes a duration, and AUC/MIC is a combination of intensity/duration. The 354
calculation of the three PK/PD indices is always tested as derived from the same PK data. The best 355
PK/PD index for a certain antibiotic-bacteria combination is determined by plotting the value of a 356
specific endpoint (typically log10 CFU/ml after 24 hours of treatment) versus the magnitude of each of 357
the three PK/PD indices. The PK/PD index should ideally be used in combination with clinical 358
information to determine an optimal dose and dosing regimens. It must be considered as a 359
simplification when it is used in isolation. Several points should be kept in mind for its use. To note 360
that, different dosing regimens could result in the same PK/PD index value. All indices are based on an 361
MIC which is a measure of the net effect on growth and antibiotic-induced bacterial killing over the 362
incubation period. MIC is determined at a fixed time and at a fixed concentration using standardized 363
medium and growth conditions. MIC testing has been highly standardized (e.g. CLSI, EUCAST) to avoid 364
potential errors due to different testing methodologies. However, MIC values may differ if they are 365
tested in other conditions. Also, MIC testing requires a 2-fold dilution approach which provides only an 366
approximate inhibitory value. 367
It should be noted that recently, some scientific evidence has established that the AUC24h/MIC index 368
could also be used for time-dependent antibiotics, as for example for phenicols (Manning et al., 2011) 369
or beta-lactams (Nielsen et al., 2011; Kristoffersson et al., 2016). These recent updates to the 370
knowledge of PK/PD relationships have shown, using mathematical physiological models, that when the 371
half-life of the antibiotic is long (e.g. 1.5-3.5 hours), the AUC24h/MIC index is at least as effective as 372
the T>MIC index for predicting antibacterial activity. These new insights in PK/PD relationships could 373
be of importance for those veterinary medicines which are long-acting formulations. Thus, the use of 374
AUC/MIC as a universal PK/PD index would facilitate the finding of an optimal dosage regimen of most 375
long-acting formulations (Toutain et al., 2017). 376
3.3. Proposed approach to address doses 377
It is assumed that in regards to dose improvement, products will be harmonised in groups dependent 378
on: 379
Active substance 380
Target animal species 381
Disease 382
Route of administration 383

Reflection paper on dose optimisation of established veterinary antibiotics in the context of SPC harmonisation
EMA/CVMP/849775/2017 Page 13/120
Pharmaceutical form 384
Refer to Annex 1 for an overview of the PK and PD data available for the proposed modelling approach 385
to address doses. 386
Refer to Annex 2 for an overview of the general definition of PK, PD and PK/PD indices. 387
3.3.1. Step 1: Determine the PK for the active substance according to the 388
route of administration, the target animal species and indication 389
Most pathogens of clinical interest are located extracellularly and the biophase for antibiotics is the 390
extracellular fluid (Schentag et al., 1990). Extracellular fluids are difficult to sample but if there is no 391
barrier to impede drug diffusion, the concentration of free antibiotic in plasma approximates its free 392
concentration in the extracellular space (Toutain & Bousquet-Melou, 2002). So the PK/PD integration is 393
appropriate for acute infections in vascularized tissue. 394
The PK/PD integration approach allows the calculation of a dose by taking into account the combined 395
PK and PD properties of an antibiotic. The simplest relationship between the dose and the PK/PD 396
parameters is given by the following equation: 397
Equation 1. 𝑫𝒐𝒔𝒆 =𝑪𝒍𝒆𝒂𝒓𝒂𝒏𝒄𝒆
𝑩𝒊𝒐𝒂𝒗𝒂𝒊𝒍𝒂𝒃𝒊𝒍𝒊𝒕𝒚× 𝑪𝑻𝒂𝒓𝒈𝒆𝒕 398
Where “Dose” is the dose of antibiotic by time unit. “Clearance” is the PK parameter describing the 399
volume of blood cleared from the antibiotic by time and “Bioavailability” is the fraction of dose reaching 400
blood. “Ctarget” is the mean plasma concentration required to obtain the effect. This equation can be 401
used for any type of products. In the case of antibiotics, the target concentration must reach the 402
threshold value (or critical value or PDT) of the PK/PD index correlated with their effectiveness. 403
The values of the PK parameters (clearance, fraction unbound (f), bioavailability), determine the link 404
between plasma exposure and the dose. Concerning the PK component, to address dose using PK/PD 405
integration, a review of all products with the same active substance, the same route of administration, 406
the same type of formulations will have to be done for each target animal species and indication. The 407
following points should be considered: 408
- Is there a dose linearity? 409
- Is there a difference in bioavailability between products? 410
- Is the free plasma concentration representative for the target tissue biophase? 411
412
3.3.2. Step 2: Define the target bacteria and determine the MIC 413
The pharmacodynamic effects of the active substance against the target pathogen bacteria must be 414
defined. Two types of information are required. 415
1) The mode of action of the active substance and the relationship between concentration and 416
bacterial killing rate must be defined. According the pharmacological class of the active 417
substance, the mode of action can be defined as time-dependent or concentration-dependent. 418
2) Determine the MIC distribution for the wild type (WT) population of the active substance 419
against the target bacteria and establish the epidemiological cut-off value (ECOFF), which is 420
the MIC value identifying the upper limit of the WT population. 421

Reflection paper on dose optimisation of established veterinary antibiotics in the context of SPC harmonisation
EMA/CVMP/849775/2017 Page 14/120
422
423
424
Figure 2. Oxytetracycline MIC distribution for P. multocida and comparison of MIC50, MIC90 and ECOFF 425
values. ECOFF definition from EUCAST: MIC value identifying the upper limit of the WT population. 426
MIC90 stands for Minimum Inhibitory Concentration required to inhibit the growth of 90% of susceptible 427
organisms. MIC50 stands for Minimum Inhibitory Concentration required to inhibit the growth of 50% of 428
susceptible organisms. 429
430
In regards to the PD component, to address the dose using PK/PD integration, a review of the PD data 431
and scientific papers to support the choice of a mode of action and to provide the MIC distribution will 432
have to be done. The following points should be considered: 433
- What is the available information on the pharmacodynamics of the active substance, and of 434
other compounds belonging in the same pharmacological class, against the targeted bacterial 435
species? 436
- What are the data available to describe the MIC distribution? 437
- Is the MIC determination based on standardised method? 438
- Are they any available time-kill curves obtained on strains representative of the targeted 439
bacterial species? 440
- Which is the least susceptible target pathogen, i.e. the dose-limiting bacterial target species? 441
3.3.3. Step 3: Define the PK/PD index (PDI) 442
The PK/PD index is the key parameter in the modelling of dose (Annex 2). Three PDI are commonly 443
used (Mouton et al., 2012): 444
AUC/MIC : the ratio between the total concentration integrated over a given time interval (area 445
under the curve, AUC) and MIC, 446
Cmax/MIC : the ratio between the highest concentration (Cmax) observed at the peak and MIC 447
T>MIC : time above MIC, the period of time when the concentration exceeds the MIC. 448
MIC50 MIC90 / ECOFF
Wild Type population non Wild Type population

Reflection paper on dose optimisation of established veterinary antibiotics in the context of SPC harmonisation
EMA/CVMP/849775/2017 Page 15/120
Concerning the definition of the PDI, a review of the scientific literature to support the choice according 449
to the pharmacological class of the antibiotic, the pharmacokinetics of the active substance in the 450
target animal species in that class and the chosen target pathogen will have to be done. The following 451
points should be considered: 452
What is the mode of action of the active substances against the targeted bacteria (time or 453
concentration dependent)? 454
What is the pharmacokinetic profile of the active substance? 455
What is the protein binding of the active substance? 456
Which PK/PD index is considered best predictive for clinical efficacy in the target animal species 457
for the indication? 458
In the context of this pilot project, an approach based on two steps is proposed to model an optimal 459
dosing. The point of departure for the PK/PD analysis will be the AUC/MIC for all antibiotic classes to 460
define a daily dose and then, the analysis would be refined with the T>MIC or the Cmax/MIC in function 461
of the antibiotic class. 462
3.3.4. Step 4: Set a target value for the PDI (PDT) 463
After selecting the index appropriate to the antibiotic class, the numerical target value (PDT) to be 464
achieved under steady-state conditions to predict clinical efficacy must be established. Different target 465
values of the PDI are described (Lees et al., 2015). They vary according to the antibacterial effect 466
(bacteriostatic, bactericidal), the clinical context (clinical burden, immune response), the prevention of 467
mutant selection for the targeted pathogen for certain antibiotic classes (fluoroquinolones, 468
aminoglycosides), the protection against toxicological outcomes (aminoglycosides). 469
Studies from peer-reviewed journals may be used to support the choice of target value (PDT) for the 470
selected PDI according the pharmacological class of the antibiotics, the clinical indications and the 471
targeted bacteria. In this case, the sources and search strategy should be documented. The following 472
points should be considered: 473
- What is the clinical context of treatment (severe or mild infections)? 474
- What is the clinical expected outcome (risk of relapse)? 475
- What is the risk of mutant selection for the pathogen? 476
- What is the therapeutic objective of the treatment (bacteriostatic, bactericidal, magnitude of 477
the reduction e.g. 2-4log)? 478
In case of a lack of available information from veterinary pharmacology, the PDT can be derived from 479
available data from experimental or pre-clinical trials in the target animal species or supported by 480
pharmacological and clinical data obtained in human medicine. 481
3.3.5. Step 5: Set a Probability of target attainment for the PDI value 482
(PTA) 483
The next step consists in the determination of the percentage of animals, in the treated population, for 484
a particular dosage regimen, likely to attain the target value of the selected PDI, across a range of 485
relevant MIC values. According to the disease to be treated, the mode of usage (individual, group 486
treatment) a Probability of Target Attainment (PTA also historically termed Target Attainment Rate or 487

Reflection paper on dose optimisation of established veterinary antibiotics in the context of SPC harmonisation
EMA/CVMP/849775/2017 Page 16/120
TAR) for the PDI value must be defined. The acceptable level of PTA is still under debate. Values of 488
99%, 95% or 90% have all been used. Based on expert considerations (Toutain et al., 2017), it was 489
considered that in the context of this project of dose optimisation of VMPs a PTA of 90% is acceptable 490
when a population PK/PD model takes into account simultaneously the population PK and the MIC 491
distribution of the wild type population with a MIC below or equal to the ECOFF. 492
3.3.6. Step 6: Model of the relationship between dose and PDI target 493
attainment (PTA) 494
According to the PK and PD data available, the relationship between dose and PDI can be defined using 495
two of approaches. 496
- The first approach is based on a summary of PK parameters (AUC, clearance, fraction 497
unbound, etc.). If they are available, a meta-analysis can be performed to derive an overall 498
mean and standard deviations of each parameter from the pool. A model of the relation 499
between dose and PDI can be used to estimate distribution of the PDI (equation 1) and 500
calculate the PTA of the PDT. This approach can be used to define a daily dose based in 501
relation with the point of departure as PDI, the AUC/MIC and estimate a range of dose. 502
- The second approach requires the use of pharmacokinetic raw data (time, concentration) for 503
different dosage regimen, different formulations and different individual characteristics (age, 504
weight, sex). A population pharmacokinetic analysis based on non-linear mixed effect 505
algorithm can be performed to estimate distribution of the PDI and calculate the PTA for a 506
PDT. This approach is applied to analyse the other PDI (T>MIC, Cmax/MIC) chosen in function 507
of the antibiotic class, because it requires to estimate the distribution of their values in 508
function of the population distribution of key pharmacokinetic parameters (bioavailability, 509
volume of distribution, clearance). 510
In both cases, a Monte Carlo Simulation (MCS) of 5000 cycles should be performed. The range of 511
doses tested must be based on good veterinary practices and pragmatic approaches of the feasibility of 512
treatment in field conditions. The number of daily doses and interval between doses must be justified. 513
3.3.7. Step 7: Set a clinical breakpoint (CBP) based on the dose 514
The definition of a new CBP first needs the determination of three critical MIC values; which allow a 515
decision to be made on the CBP. 516
The three critical concentrations are: 517
(i) Wild type cut-off: ECOFF. An ECOFF is defined for each bacterial species targeted by 518
the treatment. 519
(ii) PK/PD cut-off: is the maximal MIC value reaching the PTA of the selected PDI 520
(iii) Clinical cut-off: MIC value reflecting clinical outcomes and able to discriminate 521
between clinical failure and success. It requires data able to discriminate clinical 522
case outcomes according the MIC of isolates and the level of exposure. 523
The CBP is the final concentration value determined by considering all three critical MIC values. To 524
ensure that a dose leads to an optimal exposure, a CBP does not cut the wild type distribution of 525
targeted pathogens. If a dose is defined, a CBP can be set in relation with the PTA for different values 526
of MIC (Mouton et al., 2012). However, within the context of this pilot project, and in the absence of 527

Reflection paper on dose optimisation of established veterinary antibiotics in the context of SPC harmonisation
EMA/CVMP/849775/2017 Page 17/120
clinical data reflecting the clinical outcomes according the MIC of isolates and the level of exposure, 528
only a PK/PD breakpoint could be established. 529
3.3.8. Step 8: Define an optimal daily dose 530
After complying with all the previous steps, the results of the PK/PD integration approaches should 531
allow to define an optimal daily dose based on the available PK and PD data used for the computation. 532
For each case, the new daily dose will be defined as the one able to reach a PTA of 90 % for the least 533
susceptible target pathogen. 534
4. PK approach for withdrawal period adjustment 535
4.1. General considerations on the calculation of withdrawal periods 536
In general, the methods of calculating withdrawal periods (WPs) could be defined as: a mutually 537
agreed way, to use and treat the experimental data of residue depletion studies in order to calculate a 538
WP. These methods have been harmonised in CVMP guidelines, with the aim to: 539
ensure consumer safety; 540
guarantee a level playing field for MAHs regarding the estimation of WPs. 541
It is acknowledged that these methods can be considered a pragmatic compromise between science 542
and feasibility. From a scientific point of view, a large amount of residues data would be needed to 543
cover all aspects and variables involved. Therefore, multiple residue depletion studies would be needed 544
in order to cover the large variation under field conditions, such as different breeds, different animal 545
life stages with different ages and body weights, different housing and feeding conditions, and different 546
health status. However, in view of the costs involved and the number of experimental animals needed, 547
such data requirements are considered not practicable, and therefore, as a pragmatic approach, only 548
one standardised residue depletion study is normally required. Although this approach may have 549
scientific limitations in terms of predictability under field conditions, it is considered that the resulting 550
WPs are adequately protective for consumers in view of the many safety margins that already exist in 551
the consumer safety assessment (ADI/MRLs). 552
4.2. Current situation regarding withdrawal periods for established 553
antibiotics 554
With respect to the available residue data used for the establishment of the WPs for established 555
veterinary antibiotics, the following observations can be made: 556
Dossiers of established veterinary antibiotics often contain old residue studies. These studies may 557
be non-GLP, using old analytical methods, but often represent field conditions. 558
Even when the same residue depletion data were available, the same products may have different 559
WPs in the different Member States. 560
Although there are many generic products for a number of VMPs, there may be only few residue 561
depletion studies available (e.g. in an article 35 referral on ivermectin there were only 11 residue 562
depletion studies covering 287 authorisations of VMPs). 563

Reflection paper on dose optimisation of established veterinary antibiotics in the context of SPC harmonisation
EMA/CVMP/849775/2017 Page 18/120
Residue studies often failed to meet the statistical demands of the required first order kinetical 564
decay (e.g. due to low numbers of time points in the elimination phase), which led to the use of 565
the so-called alternative method, applying chosen safety margins. 566
Most of the more recent residue depletion studies do comply with required statistical criteria. 567
However, they are often designed to minimise inter-animal variance, although this may have the 568
consequence that they are less representative of field conditions. 569
4.3. Proposed algorithm to address the extrapolation of withdrawal periods 570
The proposed method for the calculation of WPs in this project is similar to the algorithm used by 571
FARAD (Food Animal Residue Avoidance Databank) since 2002. Both make use of long established and 572
validated pharmacokinetic principles. The Extrapolated Withdrawal-Interval Estimator (EWE) algorithm 573
from FARAD provides a tool for calculating withdrawal periods in case of off-label use (Martin-Jimenez 574
et al., 2002). After calculation of the new dose, the terminal tissue half live is used to calculate the 575
new WP. 576
Because in this project, an appropriate new dose would be established via the outcome of the PK/PD-577
modelling, only the extrapolation part of the model is needed, with the inclusion of an Frel factor to 578
account for possible differences in bioavailability between the old and new dose. 579
The proposed algorithm within this project: 580
Equation 2. WPnew = WPold + log2(Frel x Dnew/Dold) x T1/2(final phase)rounded up
581
Where: 582
Frel = Relative bioavailability new dose/old dose (a default value of 1 is used, but may be 583
adjusted if needed); 584
T1/2(final phase) = Mean half live (days; rounded up) in WP determining tissue(s) after distribution is complete 585
WP = Withdrawal period (days) 586
D = Dose (mg/kg); it is assumed that the dosing frequency and duration will not change. 587
However, if the dosing interval and/or duration would change, use could be made of FARAD 588
subroutines, to calculate the new dose (Dnew). 589
590
591
Figure 3. Theoretical simulations. Under the conditions: Linear kinetics and complete distribution. 592
Proportional increase of WP at various doses 593
Dose WP Difference in WP
D 7.4 -
2D 10.1 2.7
4D 12.8 2.7
8D 15.5 2.7

Reflection paper on dose optimisation of established veterinary antibiotics in the context of SPC harmonisation
EMA/CVMP/849775/2017 Page 19/120
Because within this project only dose variations are considered and no extra label use (e.g. other 594
routes of administration, other target animal species), the conditions to be fulfilled are: 595
Linear kinetics (for all ADME-processes) apply within the dose extrapolation range 596
o (see Figure 4 for simulations in case of non-linearity) 597
At MRL-level, tissue distribution is complete 598
o (see Figure 5 for simulations in case of non-complete distribution) 599
Figure 3 shows the proportional increase (delta) of the WP under the conditions mentioned above. 600
Doubling the dose leads to the addition of one half-life (in this example 2.7 days). 601
602
603
Figure 4. Theoretical simlations Under the conditions: Non-linear kinetics, resulting in a 604
disproportional increase of WP at higher doses 605
606
607
Figure 5. Theoretical simulations under the conditions Linear kinetics, 608
tissue distribution not complete at MRL-level, resulting in disproportional increases of the WP at higher 609
doses 610
It is acknowledged that the current guideline on the calculation of WPs provides a statistical approach 611
that takes into account a 95% confidence limit on the 95th percentile. Due to the convex nature of the 612
95/95 interval curve, there is a probability of a slight increase of the WP (when using the statistical 613
Dose WP Difference in WP
D 3.4 -
2D 4.9 1.5
4D 6.5 1.6
8D 8.7 2.2
Dose WP Difference In WP
D 3.5 -
2D 4 0.5
4D 4.9 0.9
8D 6.4 1.5

Reflection paper on dose optimisation of established veterinary antibiotics in the context of SPC harmonisation
EMA/CVMP/849775/2017 Page 20/120
method), on top the WP calculated with Equation 2, even when dose-linearity is assumed. Theoretical 614
calculations suggest that this additional increase is around 5%. Whereas the current statistical method 615
and the proposed algorithm (Equation 2) can not be fully compared, the addition of a safety factor of 616
10% to the selected worst-case half-life in tissues may be considered. 617
4.4. Proposed steps to address the extrapolation of withdrawal periods 618
It is proposed to conduct the extrapolation of WPs in accordance with the following stepwise 619
procedure: 620
1. Establish the general pharmacokinetic particulars of VMP/active substance/residues involved, 621
such as: 622
a. Do linear kinetics apply for the intended dose range (yes/no) 623
b. Relative bioavailability new dose (default Frel=1) 624
c. General ADME particulars (e.g. active transport) 625
2. Establish the terminal half-life in tissues/milk/eggs 626
a. Data sources: 627
i. Dossier data 628
ii. FARAD database 629
iii. Public Assessment Reports ( if available) 630
iv. International Journals (peer reviewed) 631
v. Publications by public committees ( e.g. EMA/JECFA/EFSA) 632
3. If conditions (linear kinetics and complete distribution) are fulfilled, calculate the WP 633
(extrapolated): 634
a. Apply algorithm (Equation 2) to each VMP separately, calculating a new WP. There 635
should be a check whether other tissues (than the original WP-determining tissue) may 636
become critical for the WP, as a result of possible differences in T1/2 between the tissues. 637
4. If conditions are not fulfilled, perform further kinetic modelling: 638
a. Apply adjusted and validated model to each VMP separately, calculating a new WP. 639
4.5. Injection sites 640
If the injection site would be the WP determining tissue, doubling the dose by injecting a same amount 641
and volume of the product at another location leads theoretically to the same withdrawal period if the 642
injection site would remain the determining tissue (see Figure 6). This would continue to be the case 643
until, due to the increase of the dose, residues in one of the other tissues would become WP 644
determining. 645
If the injection site would not be the WP determining tissue (anymore), then the algorithm (Equation 646
2) can be used. Also in this case the same injection volume at another location should be used to for 647
instance double the dose, because altering the injection volume could lead to a different absorption 648
rate, hence to different residue kinetics. 649

Reflection paper on dose optimisation of established veterinary antibiotics in the context of SPC harmonisation
EMA/CVMP/849775/2017 Page 21/120
650
Figure 6. Theoretical simulations where the Injection sites remain WP determining at various doses, 651
resulting in the same WP for all doses. 652
4.6. Some case studies from literature in eggs and milk 653
Since this project potentially should cover WPs in milk and eggs as well, the proposed algorithm was 654
also tested on residue depletion data in regarding these food commodities, obtained from literature. 655
Example on residues in eggs 656
The example for eggs was taken from Liu et al. (2017), in which residues of amoxicillin in eggs were 657
determined following doses of 25 and 50 mg/kg bodyweight. 658
Table 2. Comparison of the predicted WP and the experimentally derived WP using data from Liu et 659
al., 2017 660
Dose
mg/Kg
WP egg
(days)
WP 50 mg/kg calc according to Equation 2 based on 25 mg/kg
dose and T1/2= 1.5 days
25 6
50 8 8
661
The authors used the statistical method for tissues (WT1.4) from the CVMP guideline (EMA/CVMP, 662
1995) for the calculation of the WP on the residue data for the 25 and 50 mg/kg bw dose. However, 663
the experimental design does not justify the use of this method, because the data are not 664
independent. In this case a more appropriate method would have been the Time To Safe Concentration 665
(TTSC) method which was developed for withdrawal periods for milk (EMA/CVMP, 1998). But 666
nevertheless, this example shows the validity of the algorithm used in this project, where the new WP 667
for the 50 mg/kg bw dose is calculated using the T1/2 of the 25 mg/kg bw dose (1.5 days), resulting in 668
the same withdrawal period as when the WP is calculated based on the actual measured residue 669
concentrations in tissues for the 50 mg/kg bw dose. 670
For this project, these residue data in eggs were also analysed using a Physiologically Based 671
Pharmacokinetic (PBPK) model for eggs that was recently developed (Hekman & Schefferlie, 2011). 672

Reflection paper on dose optimisation of established veterinary antibiotics in the context of SPC harmonisation
EMA/CVMP/849775/2017 Page 22/120
673
Figure 7. Fits of the time dependent course of amoxicillin residues in albumen (open circles) and yolk 674
(closed circles) after 50 mg/kg bw during the first 5 days via the drinking water. Parameters for egg 675
formation, kinetics (1 compartment) and transport rates of amoxicillin in to albumen (Kw) and yolk 676
(Ky) were kept constant: e.g. T1/2 elimination= 1,6 days; Kw/Ky= 0,54 677
678
679
Figure 8. Fits of the time dependent course of amoxicillin residues in whole egg, Dose: 25 and 50 680
mg/kg bw during the first 5 days via the drinking water. Parameters for egg formation, kinetics (1 681
compartment) and transport rates of amoxicillin in to albumen (Kw) and yolk (Ky) were kept constant: 682
e.g. T1/2 elimination= 1,6 days; Kw/Ky= 0,54 683
684
The analysis by Liu, et al. (2017) using WT1.4 and the fits according to the PBPK-model (see Figure 7 685
and Figure 8) clearly show, that the final phase of the residue depletion curve is log-linear. This 686
justifies the use of Equation 2 for calculating the WP when using the higher dose. Further from the 687
analysis dose linearity could be concluded, meaning at the dose range 25-50 mg/kg bw the kinetics of 688
amoxicillin are linear. 689
690

Reflection paper on dose optimisation of established veterinary antibiotics in the context of SPC harmonisation
EMA/CVMP/849775/2017 Page 23/120
Example on residues in milk: 691
The example for milk was taken from Malreddy et al. (2013). This example relates to residues of 692
gabapentin in milk following oral administration to lactating cattle at a dose of 10 and 20 mg/kg 693
bodyweight, using an 8 hour milking scheme and a fictive MRL of 0.1 µg/ml. 694
695
Figure 9. Mean plasma and milk concentrations of gabapentin following 10 and 20 mg/kg bodyweight 696
PO administration; based on Malreddy et al., 2013 697
698
Table 3. Comparison of the predicted WP and the experimentally derived WP using data from Malreddy 699
et al., 2013 700
Dose
mg/kg
WP milk (h)
calculated WP (h) based on the 10 mg/kg dose
and mean T1/2= 6.2 h (lin regression)
10 32 -
20 40 40
From Figure 9 it can be observed that the final phase of the residue depletion curve is log-linear. This 701
example also shows the validity of the algorithm used in this example, where the new WP for the 20 702
mg/kg bw dose is calculated using the T1/2 of the 10 mg/kg bw dose (T1/2: 6.2 hours) resulting in the 703
same withdrawal period as when the WP is calculated based on the actual measured residue 704
concentrations in tissues for the 20 mg/kg bw dose. 705
706
These examples in eggs and milk demonstrate the usability of the algorithm for residue depletion in 707
these food commodities. 708
5. Approach for addressing risks for the environment 709
5.1. Introduction 710
In the EU, the Environmental Risk Assessment (ERA) is conducted for all veterinary medicinal products 711
in accordance with VICH and CVMP Guidelines. Typically, the ERA is conducted in two phases. In Phase 712

Reflection paper on dose optimisation of established veterinary antibiotics in the context of SPC harmonisation
EMA/CVMP/849775/2017 Page 24/120
I, products with a low environmental exposure are filtered out; these products do not need further 713
assessment and substance related environmental fate and effect data are not strictly required, 714
although data showing extensive metabolism or complete degradation in manure may be provided 715
optionally. Examples of products with a low environmental exposure are products for companion 716
animals only and products that result in a Predicted Environmental Concentration in soil (PECsoil) of less 717
than 100 µg/kg, based on a worst-case estimation. In Phase II, starting with Tier A, a basic set of 718
environmental effect data in representative species is produced, to estimate Predicted No Effect 719
Concentrations (PNECs) for up to three environmental compartments: soil, surface water, and if 720
needed groundwater. PECs for these compartments are also calculated, taking into account data on 721
metabolism, excretion and the environmental fate of the substance. It should be noted that a PEC in 722
groundwater (PECgw) ≥0.1 µg/l triggers further risk assessment. As a general rule, when the PECs for 723
all environmental compartments are below the relevant PNECs, no further assessment is needed. 724
However, if any of these PECs is above the PNEC for that compartment, then further data on fate and 725
effects are required for the relevant environmental compartment(s) in Tier B. In Tier B, also the risk 726
for sediment-dwelling organisms will be calculated if needed. This tiered approach progresses from a 727
crude worst-case risk estimation to a refined, more realistic risk estimation. In the situation where 728
following a full ERA a risk for the environment cannot be ruled out, i.e. the PEC is higher than the 729
PNEC, this should be considered in the overall benefit/risk balance for the product, and risk mitigation 730
measures (RMMs) may need to be recommended in the product literature. 731
The presence of antibiotics in the environment may influence the distribution and perseverence of AMR 732
in the environment. Thus, dose optimisation may increase the risks due to AMR in the environment. 733
However, currently there is no assessment procedure for AMR in the environment and the relative risks 734
of this route for humans, compared to other routes, are still mainly unknown. Thus, the assessment of 735
increased AMR risk via the environment is not further taken into account. 736
5.2. The impact of dose optimisation on the ERA 737
5.2.1. The relation between the dose and the PEC 738
The total dose (in mg/animal for the entire treatment) is one of the inputs into the models used to 739
calculate the PECsoil. The PECs for the other environmental compartments are directly linked to the 740
PECsoil. The relation between the dose and the calculated PECsoil is linear, meaning that a certain 741
increase in the total dose will result in the same relative increase of the PECsoil. This will be the case for 742
the initial PECsoil (as calculated in Phase I) as well as for the refined PECsoil (as calculated in Phase II). 743
Likewise, the PECs for the other environmental compartments that are calculated in Phase II Tier A 744
have a linear relationship with the dose. Only in Phase II Tier B the relation between the dose and the 745
PECs for groundwater, surface water and sediment may become non-linear due to the use of the KOC in 746
the Tier B models. Therefore, in Phase II Tier B these PECs will need to be recalculated. 747
5.2.2. The importance of triggers 748
As explained above, the ERA follows a tiered approach using triggers; when one of the triggers is 749
exceeded, a further targeted assessment in the next Tier is required. The main trigger in phase I is 750
based on environmental exposure (the PECsoil) and the main trigger in Phase II Tier A is based on 751
environmental risk (the Risk Quotient (RQ), i.e. the PEC/PNEC; when the RQ ≥ 1, further assessment 752
is required in Tier B). Another trigger in Tier A is exposure of groundwater at concentrations of ≥ 0.1 753
µg/L. When this trigger is exceeded, an RQ for groundwater will be calculated using the available Tier A 754
data for aquatic species, and the risk for humans via consumption of drinking water will be assesed (it 755
Reflection paper on dose optimisation of established veterinary antibiotics in the context of SPC harmonisation
EMA/CVMP/849775/2017 Page 25/120
should be noted that a new CVMP guideline on groundwater, coming into effect in November 2018, 756
specifies additional situations for which a risk assessment for groundwater will be required). When the 757
RQ for groundwater is ≥ 1, even after refinement of the PECgw, further Tier B studies are required. The 758
tiered approach implies that the final conclusion on the risk for the environment for a product with an 759
optimised (higher) dose will remain unchanged when no triggers are exceeded that were not exceeded 760
for the previous (authorised) dose. 761
5.2.3. Possible data gaps as a result of trigger crossing 762
In general, there can be three situations where an optimised (higher) dose will result in the need for 763
additional ERA data: (1) when the PECsoil exceeds the Phase I trigger for the new dose but not for the 764
old dose; (2) when the RQ in Phase II Tier A exceeds 1 for the new dose but not for the old dose; and 765
(3) when the concentration in groundwater exceeds 0.1 µg/L for the new dose but not for the old dose. 766
In situation (1), according to the guidelines, a basic set of (Tier A) fate and effect data for the active 767
ingredient(s) is required, whereas in situations (2) and possibly (3) the guideline may require further 768
Tier B studies (e.g. long term studies), further PEC-refinement and/or risk mitigation. A pragmatic 769
strategy for dealing with ERA-related data gaps in the context of dose optimisation will be necessary. 770
5.3. Proposed approach to address the ERA 771
It is anticipated that the worst case PECsoil calculated in Phase I exceeds the trigger value for the 772
majority of the established veterinary antibiotics at the currently authorised doses. Whereas the Phase 773
I guidance allows for the provision of data (not obligatory) to show extensive metabolism of the 774
substance in animals or extensive degradation in their excreta, experience has shown that such a 775
complete metabolism or mineralisation does generally not take place for the established antibiotics. 776
Therefore, in most cases, the starting position will be that Phase II data are available. 777
It is also envisaged that the established veterinary antibiotics are not likely to fulfil PBT or vPvB 778
criteria. Therefore, the PBT assessment shall be outside the scope of the ERA in the context of dose 779
optimisation. 780
The environmental risks for products with an optimised dose can be addressed in a stepwise approach. 781
As explained above, the need for additional assessment of environmental risk(s) depends on the 782
individual situation, for example on whether or not triggers are exceeded. The stepwise approach is 783
explained below and is schematically illustrated in the decision tree (Figure 10). 784
5.3.1. Step 1: Determine the assessment situation 785
The first step of the revised dose assessment includes a comparison between the ERA situation for the 786
authorised dose and for the optimised dose. There may be different authorised doses for the same or 787
similar products, and as a general rule, the available ERA(s) covering the highest (total) dose for the 788
relevant target species will be used for the comparison. 789
If the product with the optimised dose still has a lower dose than the product with the highest 790
authorised dose, no further ERA action is required. If the optimised dose is higher, but the outcome of 791
the initial assessment with the optimised dose is that the ERA can stop in Phase I (e.g. PECsoil <100 792
µg/kg, or complete mineralisation of the active ingredient(s) in either the animals or in their excreta 793
occurs), then it can be concluded that no further assessment is necessary. The risks for the 794
environment have been sufficiently addressed for the optimised dose, and no further action is required. 795
If this is not the case, then proceed to step 2 (see the decision tree below). 796

Reflection paper on dose optimisation of established veterinary antibiotics in the context of SPC harmonisation
EMA/CVMP/849775/2017 Page 26/120
5.3.2. Step 2: Retrieve Tier A ERA data and identify data gaps 797
All substance related Tier A data will be collected from the dossiers of the relevant authorised products. 798
If sufficient Tier A data are available, then proceed to step 4, otherwise proceed to step 3 before 799
continuing to step 4. 800
5.3.3. Step 3: Fill data gaps 801
A. Substance specific Tier A data that are not available from the marketing authorisation (MA) 802
dossiers may be retrieved from the published literature, from public assessment reports for VMPs 803
authorised in the EU or elsewhere, or from any other published assessments by any regulatory 804
body. In the context of the dose optimisation for established veterinary antibiotics, published end-805
points may be sufficient. In addition, the concerned Marketing Authorisation Holders (MAHs) may 806
be asked if they have any additional studies that have not been submitted previously. The 807
suitability of the additional information may be judged on a case-by-case basis; also information 808
other than GLP/OECD studies can be considered according to VICH GL 38. See chapter 2.2. for an 809
explanation on the use of data integration from different veterinary medicinal products. 810
B. If the data retrieved under A are still insufficient to conduct the Tier A risk assessment, then the 811
required information may be estimated, for example by the use of (Quantitative) Structural 812
Activity Relationships ((Q)SARs) or by using a “read across” procedure, i.e. taking on board 813
relevant information from similar substances. A scientific justification in terms of reliability and 814
relevance must be given for any tools used for the estimation. It is noted that such approaches 815
are not covered in existing guidelines and therefore not allowed for the regular ERA. However 816
these apporaches can be accepted for this specific purpose. 817
C. If the data are still insufficient, then the data gap may be taken into account in the overall B/R 818
assessment and in the consideration of RMMs (step 8). 819
5.3.4. Step 4: Calculate the Tier A Risk Quotients 820
On the basis of the Tier A data, the RQs for the different environmental compartments are calculated. 821
For groundwater, the RQ is only calculated in cases where the PECgw is at or above 0.1 µg/L (it should 822
be noted that a new CVMP guideline on groundwater, coming into effect in November 2018, specifies 823
additional situations for which a risk assessment for groundwater will be required). When necessary, 824
further PEC refinements are carried out in accordance with the guidelines. 825
If the outcome of step 4 is that the Tier A RQs are lower than 1 for all environmental compartments, 826
then it can be concluded that no further assessment is necessary. The risks for the environment have 827
been sufficiently addressed for the optimised dose, and no further action is required. The assessment 828
stops at this point. If this is not the case, then proceed to step 5. 829
5.3.5. Step 5: Retrieve Tier B ERA data and identify data gaps 830
All substance related Tier B data will be collected from the dossiers of the relevant authorised products. 831
This information should be limited to the relevant data for the compartment(s) for which the RQ was 832
>1 in Tier A. If sufficient Tier B data are available, then proceed directly to step 7, otherwise proceed 833
to step 6 before continuing to step 7. 834
5.3.6. Step 6: Fill data gaps 835
The same procedure as indicated under step 3 should be followed for the relevant Tier B data. 836

Reflection paper on dose optimisation of established veterinary antibiotics in the context of SPC harmonisation
EMA/CVMP/849775/2017 Page 27/120
5.3.7. Step 7: Calculate the Tier B RQ 837
On the basis of the Tier B data, the RQs for the relevant environmental compartment(s) including 838
sediment and, if needed, groundwater are calculated. It should be noted that the PECs for 839
groundwater, surfacewater, and sediment will need to be recalculated in Tier B because the models 840
used in Tier B can result in PECs that are not lineary related to the dose. Again, it is recommended to 841
perform any possible refinements, where needed. 842
If the outcome is that the Tier B RQ is lower than 1 for the relevant compartment(s), then it can be 843
concluded that no further assessment is necessary. The risks for the environment have been 844
sufficiently addressed for the optimised dose, and no further action is required. The assessment stops. 845
If this is not the case, then proceed to step 8. 846
5.3.8. Step 8: Benefit/Risk and Risk Mitigation Measures 847
Because the RQ=1 or above 1 for one or more environmental compartments following a Phase II Tier B 848
assessment, or the PECgw exceeds 0.1 µg/L for substances that are within the scope of points 1 to 6 of 849
Annex VIII to the WFD, and no further refinements of the risk assessment are possible, a risk for the 850
environment cannot be excluded. This fact has to be taken into account in an overall B/R assessment 851
for the product and the RMMs should be considered. 852

Reflection paper on dose optimisation of established veterinary antibiotics in the context of SPC harmonisation
EMA/CVMP/849775/2017 Page 28/120
853
Figure 10. Decision tree for addressing the environmental risk assessment for increased doses 854
855 856
Authorised dose PECsoil <100?
Authorised dose Tier A RQ<1 &
PECgw<0.1?
Authorised dose Tier B RQ<1 &
PECgw<0.1?
Optimised dose PECsoil <100?
Optimised dose Tier A RQ<1 &
PECgw<0.1 or RQgw<1?
Optimised dose Tier B RQ<1 &
PECgw<0.1 or RQgw<1?
No issue
Consider B/R – RMMs
Identify data gaps
NO
NO
NO
NO
NO
NO
YES YES
YES YES
YES YES
PEC refinement Tier A RQ<1 &
PECgw<0.1 or
RQgw<1? YES
NO
Step 1
Step 2
Fill data gaps Step 3
Step 4
Identify data gaps
Fill data gaps
Step 5
Step 6
Step 7
Step 8
Note: PECgw < 0.1 refers to the concentration in µg/L
Reflection paper on dose optimisation of established veterinary antibiotics in the context of SPC harmonisation
EMA/CVMP/849775/2017 Page 29/120
6. Approach for addressing risks for the target animal 857
6.1. Background to the evaluation of target animal safety 858
In the EU, the evaluation of target animal safety for new veterinary medicinal products is in 859
accordance with the requirements of Directive 2001/82/EC, as amended. 860
The general principles for the conduct of Target Animal Safety (TAS) studies for regulatory submissions 861
are laid out in VICH GL 43. TAS studies have the objective to investigate the safety of an investigatory 862
product in the target species, to identify the target organs for toxicity and to establish a margin of 863
safety (MOS) for the proposed dose regimen. These studies are conducted in healthy experimental 864
animals representative of the species/category (e.g. piglets, sows) in which the product will be used, 865
administered the final formulation of the VMP by the proposed administration route and at the 866
recommended dose and suitable multiples thereof. For products that are intended to be used in 867
animals for breeding, then effects on reproduction and viability of the off-spring are also investigated. 868
It is noted that VICH-compliant studies are unlikely to be available for products authorised before 869
2009. 870
As the safety of a product may also be dependent on the characteristics of the animal that is treated, 871
such as age, breed and the presence of underlying diseases, then observations on harms under 872
conditions of clinical field use are also required as evidence for safety in sensitive sub-populations of 873
the target population. 874
In addition to the TAS data provided to support new MA applications, once a product is authorised, 875
data on adverse events (AE) are regularly collected through the pharmacovigilance reporting system. 876
These AE data are provided in periodic safety update reports (PSURs) and are also monitored through 877
signal detection. PSURs include data on AEs following off-label use, including use at doses above the 878
approved dose. 879
6.2. The impact of dose improvement on the evaluation of target animal 880
safety 881
On the basis that, in the context of this project, any change to the dose of an antibiotic will be based 882
on PK/PD modelling, then it is assumed that any adverse impact on safety will be in most cases as a 883
consequence of an increase in the dose (mg/kg) administered in a given period, as opposed to an 884
increase in the duration of dosing. An increase in total dose over a given period of time will result in a 885
reduction in the MOS for a product, with some exceptions possible (e.g. gentamicin, where frequency 886
of administration may also impact safety). It would be necessary to assess if an acceptable MOS for 887
each product can be retained with the new dose. What is an ‘acceptable’ MOS is determined by the 888
benefit-risk for the product, taking into account any additional risk management measures that could 889
be applied. 890
It has been suggested that in order to improve the evidence base for decision-making in this exercise, 891
the outcomes of studies from similar products could be pooled (see chapter 2. ). In this respect, pooled 892
studies will be useful for establishing the toxicity syndrome and MOS. When pooling outcomes from 893
different products, consideration should be given to the fact that the formulation, pharmaceutical form 894
and route of administration may all affect the bioavailability and pharmacokinetics of the active 895
substance. 896
In addition to the impact of dose change on safety of the active substance, consideration also needs to 897
be given to the safety of a concurrent increase in exposure to the specific excipients included in the 898

Reflection paper on dose optimisation of established veterinary antibiotics in the context of SPC harmonisation
EMA/CVMP/849775/2017 Page 30/120
formulation of each product. It is anticipated that problems with toxicity of excipients would be less 899
likely as most commonly used excipients have a wide margin of safety; nevertheless, this should still 900
be considered. 901
For intra-muscular and sub-cutaneous injections, an increase in dose volume could affect local 902
tolerance. For orally administered products, then palatability of feed/water could be affected. 903
6.3. Proposed approach to address target animal safety 904
It is assumed that in regards to the approach and correction factors required for dose optimisation, 905
groups of products will be reviewed dependent on: 906
Active substance 907
Target animal species/category 908
Disease indication 909
Route of administration 910
Pharmaceutical form 911
The SPCs will then be harmonised at the level of individual reference products and their generics so 912
that differences in the bioavailability of the active substance from products that have not been 913
demonstrated as bioequivalent can be taken into account (see 2.2. , above). 914
Annex 4 provides an overview of the data considered useful for reviewing target animal safety. The 915
review can be done in a step-wise manner as explained below. 916
6.3.1. Step 1: Determine the target animal safety profile for the active 917
substance and establish the MOS for the active substance according to the 918
revised dose, pharmaceutical form and route of administration 919
Review the TAS studies for all products with the same active substance and pharmaceutical form that 920
are administered by the same route of administration. The aim is to: 921
Confirm the target organs and toxicity profile of the active substance. 922
The new MOS should be estimated based on the improved dose relative to the dose for which 923
no/an acceptable level of AEs was observed in the TAS. 924
When pooling studies within different product groups as outlined above, some attention may need to 925
be given to the relative bioavailability and differences in the PK profile for the active substance from 926
different product formulations (for example, long-acting compared to immediate release injections). 927
When calculating the MOS, studies from different products should only be pooled if the PK profiles are 928
similar (also considering that TAS studies are not anyway able to determine a precise MOS due to the 929
dose multiples used). Relevant information may be found in the pharmacokinetics studies for the 930
individual products. 931
In accordance with convention, the TAS are likely to have been conducted at 0x (negative control), 1x, 932
3x and 5x the highest original recommended treatment dose (ORTD); therefore if signs of toxicity were 933
already seen in either the 1x or 3x groups, it may be difficult to conclude that an acceptable MOS 934
remains for the increased dose. Pooling studies from different products may increase the data available 935
as different doses/dose multiples may have been used. An acceptable MOS is dependent on the 936
benefit-risk for the product. 937

Reflection paper on dose optimisation of established veterinary antibiotics in the context of SPC harmonisation
EMA/CVMP/849775/2017 Page 31/120
Additional risk management measures, if needed, could include strengthening of SPC warnings and 938
advice on overdose. If the risk due to the new MOS cannot be mitigated, then a dose change using this 939
methodology will not be possible. 940
Reproductive toxicity (where applicable): VICH GL 43 requires studies only to be conducted at 0x and 941
3x ORTD. It is assumed that if the product is approved for use in breeding animals, there would have 942
been no signs of reproductive toxicity at 3x ORTD. The new MOS should be determined based on the 943
increased dose. If this dose is lower than 3x ORTD and no adverse reactions were observed at 3x 944
ORTD, then it is probable that reproductive safety could be accepted for the improved dose. Further 945
information to support a decision may also be available from laboratory animal reproductive toxicity 946
studies and pharmacovigilance post-marketing. Additional risk management measures, if needed, 947
could include strengthening of warnings in SPC 4.7 (NtA, Volume 6C) including restrictions on use in 948
breeding animals. 949
Local tolerance: Consideration should be given to injection-site safety, which may have been 950
investigated at 1x ORTD, only. Additional risk management measures, if needed, could include 951
restrictions on the maximum volume of injection at individual sites, and/or bodyweight of animal to be 952
treated. 953
Evidence for reduced palatability at higher doses should also be noted. Additional risk management 954
measures, if needed, could include SPC warnings regarding the maximum inclusion rate in feed/water. 955
Step 1a: If needed as supplementary data, dose determination (and occasionally dose confirmation) 956
studies may have investigated doses higher than the ORTD. Useful safety information (from target and 957
non-target species) may also be available from studies presented in other sections of the dossier (see 958
Annex 4). 959
TAS studies conducted with products of a different pharmaceutical form or administered via a different 960
route of administration may provide additional information regarding the toxicity of the active 961
substance. Consideration would need to be given to the similarity of pharmacokinetic profiles before 962
these studies could be used to derive a MOS for a different pharmaceutical form or administration 963
route. 964
6.3.2. Step 2: Safety in the target population 965
Review the safety data from the clinical field trials for all products with the same active substance and 966
pharmaceutical form that are administered preferably by the same route of administration. The 967
following points can be considered: 968
Is there a relationship to dose, dosing frequency or treatment duration for the observed adverse 969
events? 970
Is there evidence of a decreased MOS in sensitive sub-populations (e.g. age groups)? 971
Additional risk management measures, if needed, could include strengthening of SPC contraindications 972
or warnings relating to sensitive sub-populations. 973
6.3.3. Step 3: Safety based on post-marketing pharmacovigilance 974
Review the Eudravigilance database for all products with the same active substance and 975
pharmaceutical form that are administered by the same route of administration and in the same 976
species with focus on reports where the product has been administered at overdose (subject to 977
availability). The main purpose is to gain a general impression of the safety of the products when used 978

Reflection paper on dose optimisation of established veterinary antibiotics in the context of SPC harmonisation
EMA/CVMP/849775/2017 Page 32/120
under field conditions; some specific information regarding the safety of increased doses may be 979
available in reports of overdose. 980
6.3.4. Step 4: Safety based on published literature and authorisations in 981
third countries (if needed) 982
If needed, studies from peer-reviewed journals may also be used to provide supporting evidence for 983
the safety of the increased dose and experience from field use. In this case, the sources and search 984
strategy should be documented. 985
In addition, similar products may be authorised in other e.g. VICH-participating countries where they 986
are used with different dosing regimens. SPCs and assessment reports relating to these products may 987
be publically available. 988
6.3.5. Step 5: Conclude on the safety of the increased dose of the active 989
substance according to the pharmaceutical form and route of 990
administration 991
Based on the totality of the data considered under steps 1 to 4, and 5 if necessary, a conclusion should 992
be made on the safety of the increased dose of the active substance according to the pharmaceutical 993
form and route of administration. 994
Consideration should also be given to additional risk management measures as indicated above. 995
6.3.6. Step 6: Further considerations for the conclusion on the safety and 996
benefit-risk for individual products 997
Excipients - Consideration should be given to the systemic and local safety of the excipients in the 998
individual formulation in relation to any impact of the concurrent dose increase. Information on the 999
product excipient formulation is available from Part 2 of the dossier. Further information on the 1000
MOS of excipients is available from public sources (e.g. MRL summary reports, Codex reports, 1001
GRAS list). 1002
Indications – If the change in the MOS could impact on the benefit-risk, then the indications for 1003
individual products will be part of this consideration, for example, consideration may have to be 1004
given to the severity of the concerned disease and availability of alternative treatments. 1005
6.3.7. Step 7: The conclusions above are incorporated into the final 1006
benefit-risk for the dose increase for each individual product 1007
6.4. Data sources 1008
Target Animal Safety studies, including reproductive and injection site safety as appropriate 1009
Pharmacological studies for individual products 1010
Pre-clinical studies (e.g. dose-finding) 1011
Clinical field trials in the target population 1012
Eudravigilance 1013
Detailed information on the product composition and formulation 1014

Reflection paper on dose optimisation of established veterinary antibiotics in the context of SPC harmonisation
EMA/CVMP/849775/2017 Page 33/120
Laboratory animal and human safety studies – reproductive toxicity and special studies 1015
Literature searches 1016
Information on authorisations of similar products in other e.g. VICH participating countries 1017
An overview of the TAS-related data considered useful is presented in Annex 4. 1018
7. Case study amoxicillin 1019
7.1. Introduction 1020
Ampicillin and amoxicillin are two very commonly used beta-lactam antibiotics in veterinary medicine. 1021
In the EU amoxicillin is licensed as various formulations (powder, granules, tablets and suspensions for 1022
injection) for a variety of animals (food-producing and non-food producing). 1023
This case study shall be limited to the oral administration of amoxicillin to pigs, by medicated drinking 1024
water. 1025
Amoxicillin is a broad-spectrum, semisynthetic aminopenicillin antibiotic with bactericidal activity. 1026
Amoxicillin binds to and inactivates penicillin-binding proteins (PBPs) located on the inner membrane of 1027
the bacterial cell wall. Inactivation of PBPs interferes with the cross-linkage of peptidoglycan chains 1028
necessary for bacterial cell wall strength and rigidity. This interrupts bacterial cell wall synthesis and 1029
results in the weakening of the bacterial cell wall and cell lysis. 1030
Amoxicillin is usually available as amoxicillin trihydrate. 1031
The approved doses vary widely between 10 – 20 mg/kg bw, to be given once or twice daily for 3-7 1032
consecutive days. Most commonly a daily dose of 10 – 20 mg/kg bw is recommended for 3-5 days. It 1033
should be noted that the dose can be expressed in amoxicillin or amoxicillin trihydrate. The conversion 1034
factor to the trihydrate is 1.15 and to amoxicillin 0.87. 1035
Licensed products are indicated for a wide variety of infections of the respiratory, gastro-intestinal and 1036
uro-genital tract as well as skin and joint diseases. This case study will focus on the indication for 1037
respiratory disease which is most commonly caused by Actinobacillus pleuropneumoniae, Haemophilus 1038
parasuis, Pasteurella multocida, Streptococcus suis and Bordetella bronchiseptica.1 1039
7.2. Dose optimisation 1040
7.2.1. Determination of the PK parameters 1041
PK parameters can be derived from published papers and available information in marketing 1042
authorisation dossier (Annex 1). For the purpose of the pilot study, a review of published papers was 1043
performed (Table 4). 1044
1045
1 From the clinical signs of the disease no firm conclusion can be drawn to the causative agent apart from typical
influenza virus infections (peracute-acute disease, rapid sprading) or an acute Actinobacillus pleuropneumoniae infection by a highly virulent strain (acute outbreak, circulation problems, bloody froth, quick spreading - pers. communication K.-H. Waldmann, 2017). Thus, from a clincial perspective, swine respiratory disease is often a mixed infection whereby the causative pathogen cannot be readily identified form the clinical signs. Bordetella bronchiseptica can cause monocausal infections although this is rather uncommon.

Reflection paper on dose optimisation of established veterinary antibiotics in the context of SPC harmonisation
EMA/CVMP/849775/2017 Page 34/120
1046
Table 4. Overview of published scientific papers for amoxicillin 1047
Reference Intravenous administration
dose (mg/Kg)
Oral administration dose
(mg/Kg)
Agersø & Friis (1998a) 9 10
Agersø & Friis (1998b) 9
Martínez-Larrañaga et al. (2004) 20 20
Hernandez et al. (2005) 15 15
Reyns et al. (2008) 20 20
Godoy et al. (2011) 15 5/9/10/15/18
Krasucka & Kowalski (2010) 28
The pharmacokinetic parameters extracted from the papers are the mean value and standard deviation 1048
of the clearance, the bioavailability and the apparent clearance. An overall mean and standard 1049
deviation for each parameter were calculated from the pool. 1050
Equation 3. 𝒎𝒆𝒂𝒏𝒂𝒍𝒍 =∑ 𝒎𝒆𝒂𝒏𝒊×𝑵𝒊
∑ 𝑵𝒊 1051
Equation 4. 𝑺𝑫𝒂𝒍𝒍 = √𝑽𝒂𝒓𝒂𝒍𝒍 = √∑(𝑽𝒂𝒓𝒊×(𝑵𝒊−𝟏))
∑(𝑵𝒊−𝟏) 1052
Where meanall is the mean of the pool, meani the mean reported for the ith study, Varall the variance of 1053
the pool, vari the variance for the ith study. 1054
- For amoxicillin in pigs, clearance is 0.5 ± 0.18 L.h-1.kg-1 and oral bioavailability is 0.33 ± 0.12. 1055
- The free fraction of amoxicillin in plasma was set at a mean value of 0.7 ranged 0.6 to 0.8. 1056
Population pharmacokinetics 1057
The availability of PK raw data or in this case study, the summary of PK parameters allows performing 1058
a meta-analysis for a given product using a non-linear mixed effect model (Figure 11 and Table 5). 1059
This approach allows integrating variability of biological origin (e.g. breed, sex, age, health status) and 1060
non-biological origin (e.g. study design, tested dose). 1061
In a peer reviewed paper (Rey et al., 2014), amoxicillin concentrations in function of time were 1062
obtained from 4 different sources (3 pharmaceutical companies, 1 academic laboratory). Five 1063
formulations administered by oral routes were analysed and a common pharmacokinetic model was 1064
established. It is a two-compartment model with a zero order input rate (K0) between lag time (Tlag) 1065
and end time (Tend). 1066
1067
1068
1069
1070
1071
1072
Figure 11. Diagram of pharmacokinetic model for amoxicillin administered orally to pigs. Cl= 1073
clearance of elimination, Vc= Volume of central compartment, Vp=Volume of peripheral compartment, 1074
Cld=Clearance of distribution. 1075
Cld
Cld
Vp
K0 Tlag<t<Tend
Cl
Vc
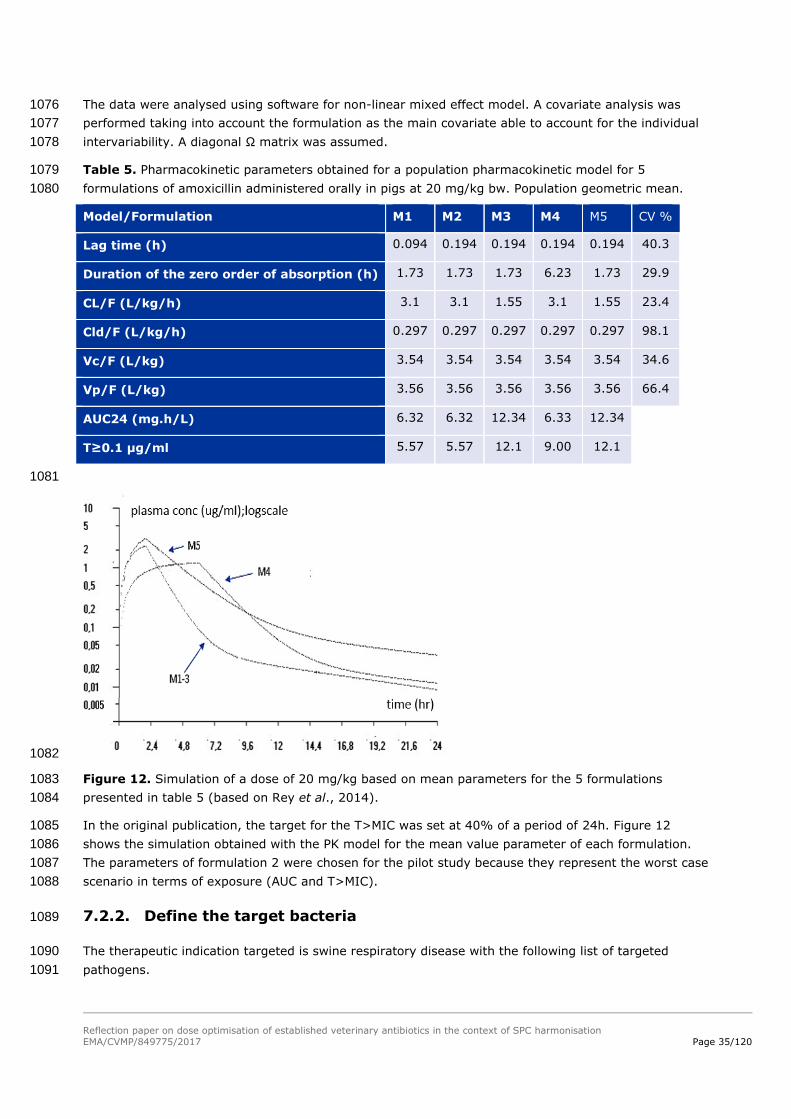
Reflection paper on dose optimisation of established veterinary antibiotics in the context of SPC harmonisation
EMA/CVMP/849775/2017 Page 35/120
The data were analysed using software for non-linear mixed effect model. A covariate analysis was 1076
performed taking into account the formulation as the main covariate able to account for the individual 1077
intervariability. A diagonal Ω matrix was assumed. 1078
Table 5. Pharmacokinetic parameters obtained for a population pharmacokinetic model for 5 1079
formulations of amoxicillin administered orally in pigs at 20 mg/kg bw. Population geometric mean. 1080
Model/Formulation M1 M2 M3 M4 M5 CV %
Lag time (h) 0.094 0.194 0.194 0.194 0.194 40.3
Duration of the zero order of absorption (h) 1.73 1.73 1.73 6.23 1.73 29.9
CL/F (L/kg/h) 3.1 3.1 1.55 3.1 1.55 23.4
Cld/F (L/kg/h) 0.297 0.297 0.297 0.297 0.297 98.1
Vc/F (L/kg) 3.54 3.54 3.54 3.54 3.54 34.6
Vp/F (L/kg) 3.56 3.56 3.56 3.56 3.56 66.4
AUC24 (mg.h/L) 6.32 6.32 12.34 6.33 12.34
T≥0.1 µg/ml 5.57 5.57 12.1 9.00 12.1
1081
1082
Figure 12. Simulation of a dose of 20 mg/kg based on mean parameters for the 5 formulations 1083
presented in table 5 (based on Rey et al., 2014). 1084
In the original publication, the target for the T>MIC was set at 40% of a period of 24h. Figure 12 1085
shows the simulation obtained with the PK model for the mean value parameter of each formulation. 1086
The parameters of formulation 2 were chosen for the pilot study because they represent the worst case 1087
scenario in terms of exposure (AUC and T>MIC). 1088
7.2.2. Define the target bacteria 1089
The therapeutic indication targeted is swine respiratory disease with the following list of targeted 1090
pathogens. 1091
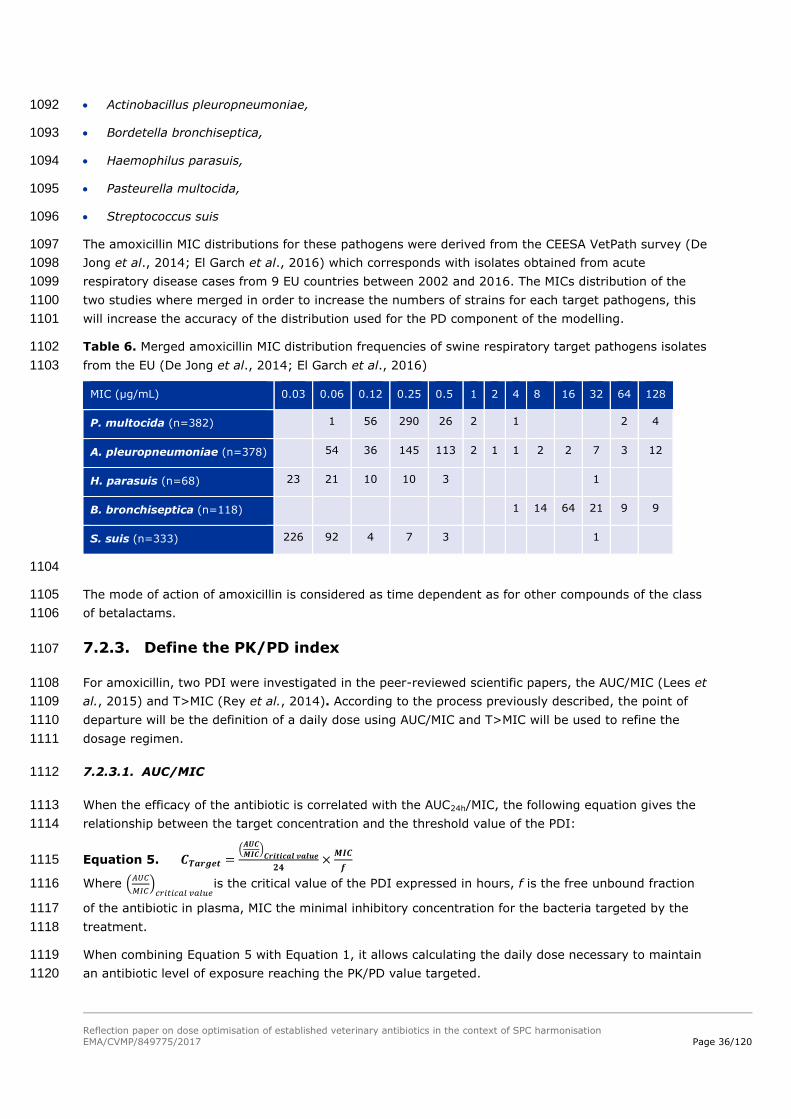
Reflection paper on dose optimisation of established veterinary antibiotics in the context of SPC harmonisation
EMA/CVMP/849775/2017 Page 36/120
Actinobacillus pleuropneumoniae, 1092
Bordetella bronchiseptica, 1093
Haemophilus parasuis, 1094
Pasteurella multocida, 1095
Streptococcus suis 1096
The amoxicillin MIC distributions for these pathogens were derived from the CEESA VetPath survey (De 1097
Jong et al., 2014; El Garch et al., 2016) which corresponds with isolates obtained from acute 1098
respiratory disease cases from 9 EU countries between 2002 and 2016. The MICs distribution of the 1099
two studies where merged in order to increase the numbers of strains for each target pathogens, this 1100
will increase the accuracy of the distribution used for the PD component of the modelling. 1101
Table 6. Merged amoxicillin MIC distribution frequencies of swine respiratory target pathogens isolates 1102
from the EU (De Jong et al., 2014; El Garch et al., 2016) 1103
MIC (µg/mL) 0.03 0.06 0.12 0.25 0.5 1 2 4 8 16 32 64 128
P. multocida (n=382) 1 56 290 26 2 1 2 4
A. pleuropneumoniae (n=378) 54 36 145 113 2 1 1 2 2 7 3 12
H. parasuis (n=68) 23 21 10 10 3 1
B. bronchiseptica (n=118) 1 14 64 21 9 9
S. suis (n=333) 226 92 4 7 3 1
1104
The mode of action of amoxicillin is considered as time dependent as for other compounds of the class 1105
of betalactams. 1106
7.2.3. Define the PK/PD index 1107
For amoxicillin, two PDI were investigated in the peer-reviewed scientific papers, the AUC/MIC (Lees et 1108
al., 2015) and T>MIC (Rey et al., 2014). According to the process previously described, the point of 1109
departure will be the definition of a daily dose using AUC/MIC and T>MIC will be used to refine the 1110
dosage regimen. 1111
7.2.3.1. AUC/MIC 1112
When the efficacy of the antibiotic is correlated with the AUC24h/MIC, the following equation gives the 1113
relationship between the target concentration and the threshold value of the PDI: 1114
Equation 5. 𝑪𝑻𝒂𝒓𝒈𝒆𝒕 =(
𝑨𝑼𝑪
𝑴𝑰𝑪)
𝑪𝒓𝒊𝒕𝒊𝒄𝒂𝒍 𝒗𝒂𝒍𝒖𝒆
𝟐𝟒×
𝑴𝑰𝑪
𝒇 1115
Where (𝐴𝑈𝐶
𝑀𝐼𝐶)
𝑐𝑟𝑖𝑡𝑖𝑐𝑎𝑙 𝑣𝑎𝑙𝑢𝑒is the critical value of the PDI expressed in hours, f is the free unbound fraction 1116
of the antibiotic in plasma, MIC the minimal inhibitory concentration for the bacteria targeted by the 1117
treatment. 1118
When combining Equation 5 with Equation 1, it allows calculating the daily dose necessary to maintain 1119
an antibiotic level of exposure reaching the PK/PD value targeted. 1120
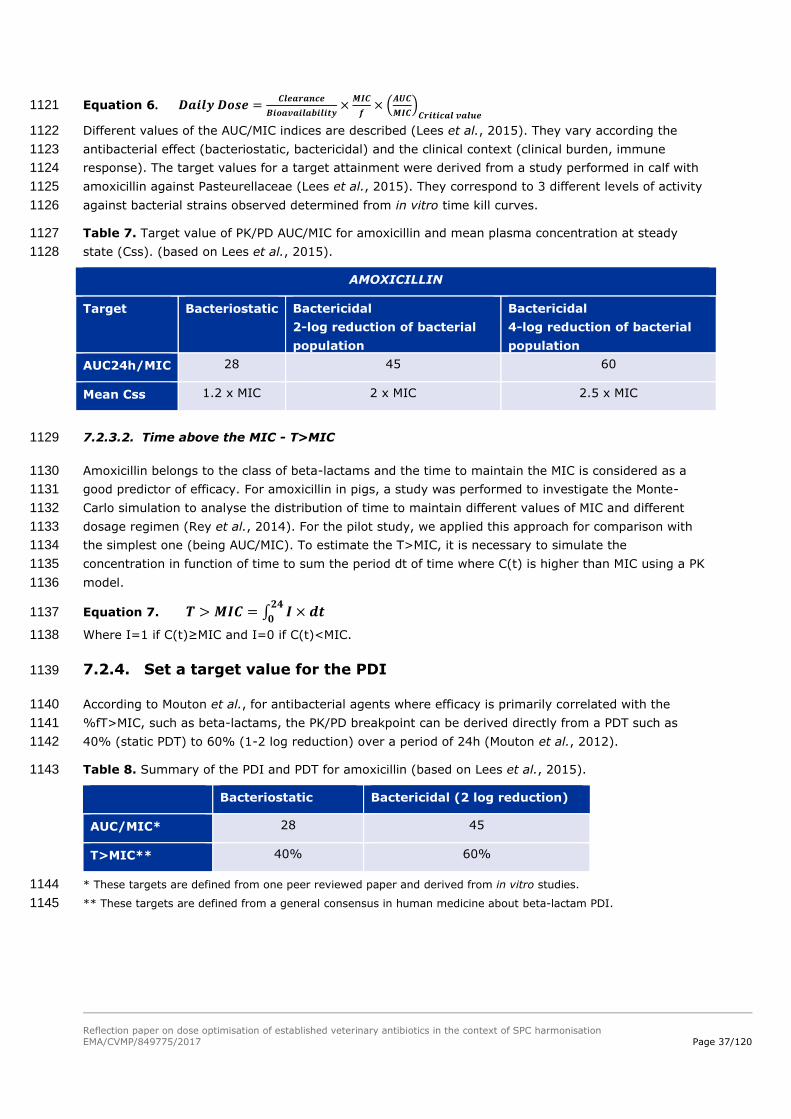
Reflection paper on dose optimisation of established veterinary antibiotics in the context of SPC harmonisation
EMA/CVMP/849775/2017 Page 37/120
Equation 6. 𝑫𝒂𝒊𝒍𝒚 𝑫𝒐𝒔𝒆 =𝑪𝒍𝒆𝒂𝒓𝒂𝒏𝒄𝒆
𝑩𝒊𝒐𝒂𝒗𝒂𝒊𝒍𝒂𝒃𝒊𝒍𝒊𝒕𝒚×
𝑴𝑰𝑪
𝒇× (
𝑨𝑼𝑪
𝑴𝑰𝑪)
𝑪𝒓𝒊𝒕𝒊𝒄𝒂𝒍 𝒗𝒂𝒍𝒖𝒆 1121
Different values of the AUC/MIC indices are described (Lees et al., 2015). They vary according the 1122
antibacterial effect (bacteriostatic, bactericidal) and the clinical context (clinical burden, immune 1123
response). The target values for a target attainment were derived from a study performed in calf with 1124
amoxicillin against Pasteurellaceae (Lees et al., 2015). They correspond to 3 different levels of activity 1125
against bacterial strains observed determined from in vitro time kill curves. 1126
Table 7. Target value of PK/PD AUC/MIC for amoxicillin and mean plasma concentration at steady 1127
state (Css). (based on Lees et al., 2015). 1128
AMOXICILLIN
Target Bacteriostatic Bactericidal
2-log reduction of bacterial
population
Bactericidal
4-log reduction of bacterial
population
AUC24h/MIC 28 45 60
Mean Css 1.2 x MIC 2 x MIC 2.5 x MIC
7.2.3.2. Time above the MIC - T>MIC 1129
Amoxicillin belongs to the class of beta-lactams and the time to maintain the MIC is considered as a 1130
good predictor of efficacy. For amoxicillin in pigs, a study was performed to investigate the Monte-1131
Carlo simulation to analyse the distribution of time to maintain different values of MIC and different 1132
dosage regimen (Rey et al., 2014). For the pilot study, we applied this approach for comparison with 1133
the simplest one (being AUC/MIC). To estimate the T>MIC, it is necessary to simulate the 1134
concentration in function of time to sum the period dt of time where C(t) is higher than MIC using a PK 1135
model. 1136
Equation 7. 𝑻 > 𝑴𝑰𝑪 = ∫ 𝑰 × 𝒅𝒕𝟐𝟒
𝟎 1137
Where I=1 if C(t)≥MIC and I=0 if C(t)<MIC. 1138
7.2.4. Set a target value for the PDI 1139
According to Mouton et al., for antibacterial agents where efficacy is primarily correlated with the 1140
%fT>MIC, such as beta-lactams, the PK/PD breakpoint can be derived directly from a PDT such as 1141
40% (static PDT) to 60% (1-2 log reduction) over a period of 24h (Mouton et al., 2012). 1142
Table 8. Summary of the PDI and PDT for amoxicillin (based on Lees et al., 2015). 1143
Bacteriostatic Bactericidal (2 log reduction)
AUC/MIC* 28 45
T>MIC** 40% 60%
* These targets are defined from one peer reviewed paper and derived from in vitro studies. 1144
** These targets are defined from a general consensus in human medicine about beta-lactam PDI. 1145
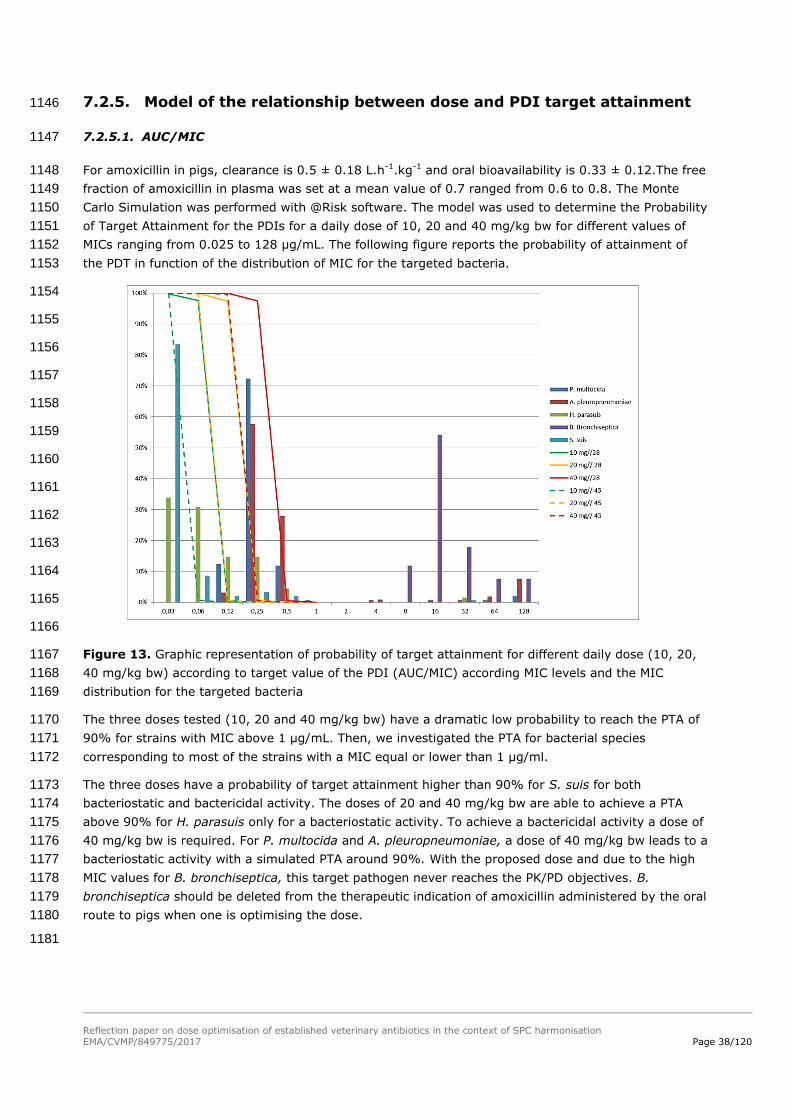
Reflection paper on dose optimisation of established veterinary antibiotics in the context of SPC harmonisation
EMA/CVMP/849775/2017 Page 38/120
7.2.5. Model of the relationship between dose and PDI target attainment 1146
7.2.5.1. AUC/MIC 1147
For amoxicillin in pigs, clearance is 0.5 ± 0.18 L.h-1.kg-1 and oral bioavailability is 0.33 ± 0.12.The free 1148
fraction of amoxicillin in plasma was set at a mean value of 0.7 ranged from 0.6 to 0.8. The Monte 1149
Carlo Simulation was performed with @Risk software. The model was used to determine the Probability 1150
of Target Attainment for the PDIs for a daily dose of 10, 20 and 40 mg/kg bw for different values of 1151
MICs ranging from 0.025 to 128 µg/mL. The following figure reports the probability of attainment of 1152
the PDT in function of the distribution of MIC for the targeted bacteria. 1153
1154
1155
1156
1157
1158
1159
1160
1161
1162
1163
1164
1165
1166
Figure 13. Graphic representation of probability of target attainment for different daily dose (10, 20, 1167
40 mg/kg bw) according to target value of the PDI (AUC/MIC) according MIC levels and the MIC 1168
distribution for the targeted bacteria 1169
The three doses tested (10, 20 and 40 mg/kg bw) have a dramatic low probability to reach the PTA of 1170
90% for strains with MIC above 1 µg/mL. Then, we investigated the PTA for bacterial species 1171
corresponding to most of the strains with a MIC equal or lower than 1 µg/ml. 1172
The three doses have a probability of target attainment higher than 90% for S. suis for both 1173
bacteriostatic and bactericidal activity. The doses of 20 and 40 mg/kg bw are able to achieve a PTA 1174
above 90% for H. parasuis only for a bacteriostatic activity. To achieve a bactericidal activity a dose of 1175
40 mg/kg bw is required. For P. multocida and A. pleuropneumoniae, a dose of 40 mg/kg bw leads to a 1176
bacteriostatic activity with a simulated PTA around 90%. With the proposed dose and due to the high 1177
MIC values for B. bronchiseptica, this target pathogen never reaches the PK/PD objectives. B. 1178
bronchiseptica should be deleted from the therapeutic indication of amoxicillin administered by the oral 1179
route to pigs when one is optimising the dose. 1180
1181

Reflection paper on dose optimisation of established veterinary antibiotics in the context of SPC harmonisation
EMA/CVMP/849775/2017 Page 39/120
Table 9. Overview of probability of target attainment according to target value of the PDI (AUC/MIC) 1182
and the MIC distribution for the targeted bacteria and for different daily dose. Red font: daily dose 1183
reaching the highest PTA for the different target pathogens considered according to PDT values (AUC/MIC). 1184
PDI Bacteriostactic = 28 Bactericidal = 45
Daily dose 10 mg/kg 20 mg/kg 40 mg/kg 10 mg/kg 20 mg/kg 40 mg/kg
P. multocida 27% 69% 95% 9% 39% 81%
A. pleuropneumoniae 31% 61% 88% 18% 39% 70%
H. parasuis 78% 91% 98% 65% 83% 94%
S. suis 94% 97% 99% 92% 94% 97%
1185
Table 10. Merged amoxicillin MIC distribution frequencies of swine respiratory target pathogens 1186
isolates from the EU (De Jong et al., 2014; El Garch et al., 2016) 1187
MIC (µg/mL) 0.03 0.06 0.12 0.25 0.5 1 2 4 8 16 32 64 128
P. multocida (n=382) 1 56 290 26 2 1 2 4
A. pleuropneumoniae (n=378) 54 36 145 113 2 1 1 2 2 7 3 12
H. parasuis (n=68) 23 21 10 10 3 1
B. bronchiseptica (n=118) 1 1
4 64 21 9 9
S. suis (n=333) 226 92 4 7 3 1
* ECOFF values are determined using the tool ECOFFinder to calculate the 99.9th percentile of ECOFF (Turnidge et 1188
al., 2006). In the context of this pilot project, all the requested criteria may not be fulfilled to use this tools with 1189
confidence, however in order to follow the methodology defined in section 3.3, the ECOFF of the different target 1190
pathogens was calculated. ECOFF value is for P. multocida 0.5 µg/mL, for A. pleuropneumoniae 2 µg/mL, for B. 1191
bronchiseptica 64 µg/mL and for S. suis 0.06 µg/mL. For H. parasuis an ECOFF of 0.0625 µg/mL can be calculated 1192
but the value is given only as an example in the context of this pilot project as the minimal number of strains is not 1193
reached. 1194
To perform a modelling for dose calculation, two different values for the PD parameters can be 1195
selected, (i) a single MIC values corresponding as for example to CBP, ECOFF or MIC90 or (ii) a 1196
distribution of MICs of the target pathogens. The impact of the PD value on the dose calculated was 1197
previously investigated in an ANSES report. The result indicates that the dose values calculated using 1198
the MIC distribution were always lower than those obtained with the selected MIC point values (CBP, 1199
ECOFF or MIC90). Indeed when we use a single MIC, we assume that 100% of the strains have the 1200
same MIC leading to an overestimate of the dose needed to reach the strains with a lower MIC and 1201
underestimate the dose needed for strains with a higher MIC. In this pilot project, according to the 1202
observations made in the ANSES report, the whole distribution of MICs for each species was used to 1203
estimate the dose covering 90% of the AUC/MIC target (ANSES report, 2017). They were investigated 1204
to estimate the highest dose required to reach a probability of target attainment of 90 % for the 1205
susceptible wild type distribution. 1206
1207
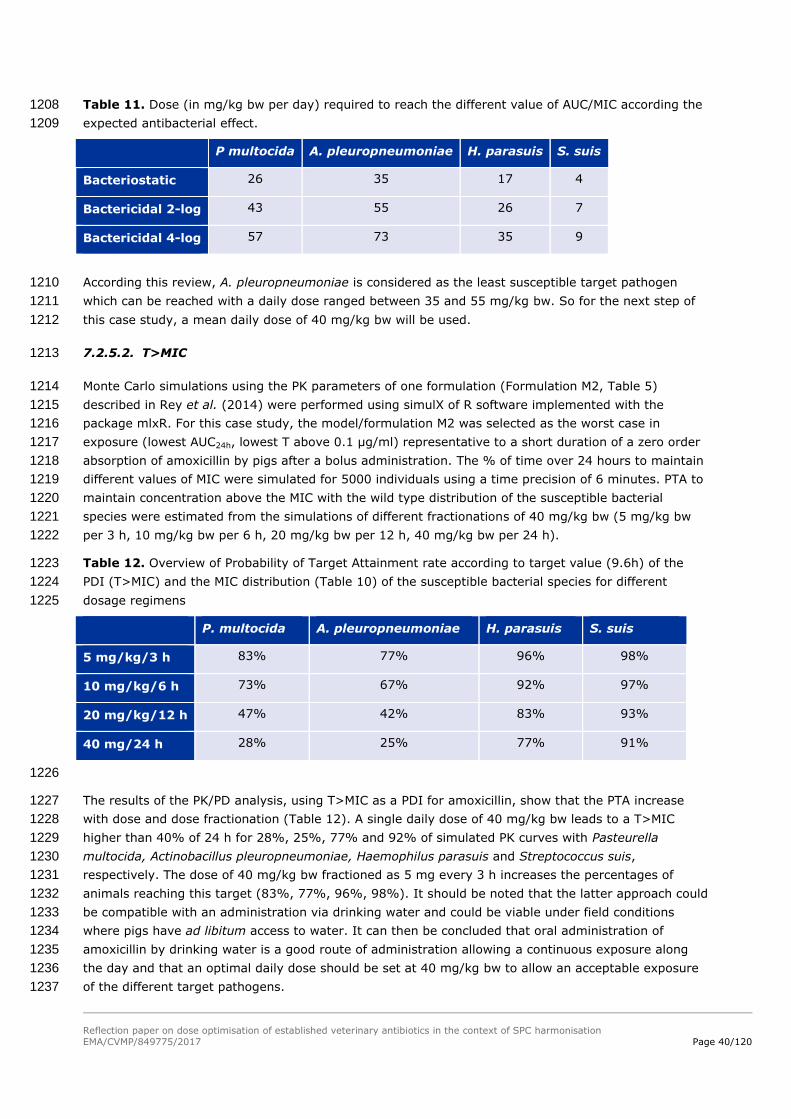
Reflection paper on dose optimisation of established veterinary antibiotics in the context of SPC harmonisation
EMA/CVMP/849775/2017 Page 40/120
Table 11. Dose (in mg/kg bw per day) required to reach the different value of AUC/MIC according the 1208
expected antibacterial effect. 1209
P multocida A. pleuropneumoniae H. parasuis S. suis
Bacteriostatic 26 35 17 4
Bactericidal 2-log 43 55 26 7
Bactericidal 4-log 57 73 35 9
According this review, A. pleuropneumoniae is considered as the least susceptible target pathogen 1210
which can be reached with a daily dose ranged between 35 and 55 mg/kg bw. So for the next step of 1211
this case study, a mean daily dose of 40 mg/kg bw will be used. 1212
7.2.5.2. T>MIC 1213
Monte Carlo simulations using the PK parameters of one formulation (Formulation M2, Table 5) 1214
described in Rey et al. (2014) were performed using simulX of R software implemented with the 1215
package mlxR. For this case study, the model/formulation M2 was selected as the worst case in 1216
exposure (lowest AUC24h, lowest T above 0.1 µg/ml) representative to a short duration of a zero order 1217
absorption of amoxicillin by pigs after a bolus administration. The % of time over 24 hours to maintain 1218
different values of MIC were simulated for 5000 individuals using a time precision of 6 minutes. PTA to 1219
maintain concentration above the MIC with the wild type distribution of the susceptible bacterial 1220
species were estimated from the simulations of different fractionations of 40 mg/kg bw (5 mg/kg bw 1221
per 3 h, 10 mg/kg bw per 6 h, 20 mg/kg bw per 12 h, 40 mg/kg bw per 24 h). 1222
Table 12. Overview of Probability of Target Attainment rate according to target value (9.6h) of the 1223
PDI (T>MIC) and the MIC distribution (Table 10) of the susceptible bacterial species for different 1224
dosage regimens 1225
P. multocida A. pleuropneumoniae H. parasuis S. suis
5 mg/kg/3 h 83% 77% 96% 98%
10 mg/kg/6 h 73% 67% 92% 97%
20 mg/kg/12 h 47% 42% 83% 93%
40 mg/24 h 28% 25% 77% 91%
1226
The results of the PK/PD analysis, using T>MIC as a PDI for amoxicillin, show that the PTA increase 1227
with dose and dose fractionation (Table 12). A single daily dose of 40 mg/kg bw leads to a T>MIC 1228
higher than 40% of 24 h for 28%, 25%, 77% and 92% of simulated PK curves with Pasteurella 1229
multocida, Actinobacillus pleuropneumoniae, Haemophilus parasuis and Streptococcus suis, 1230
respectively. The dose of 40 mg/kg bw fractioned as 5 mg every 3 h increases the percentages of 1231
animals reaching this target (83%, 77%, 96%, 98%). It should be noted that the latter approach could 1232
be compatible with an administration via drinking water and could be viable under field conditions 1233
where pigs have ad libitum access to water. It can then be concluded that oral administration of 1234
amoxicillin by drinking water is a good route of administration allowing a continuous exposure along 1235
the day and that an optimal daily dose should be set at 40 mg/kg bw to allow an acceptable exposure 1236
of the different target pathogens. 1237

Reflection paper on dose optimisation of established veterinary antibiotics in the context of SPC harmonisation
EMA/CVMP/849775/2017 Page 41/120
Main conclusions on the amoxicillin case study in relation to dose optimisation: 1238
As a reminder to summarise this first case study, by following the different steps, the PK/PD 1239
relationship allows to define a dosage regimen taking into account PK and PD variability but also by 1240
considering the probability to reach the target value of the selected PK/PD index for a defined drug-bug 1241
combination. 1242
For the amoxicillin case study, different conclusions can be drawn: 1243
- Concerning the dose computed : 1244
o Different doses can be computed in function of the therapeutic objective (e.g. 1245
Bacteriostatic, Bactericidal 2-log, Bactericidal 4-log); 1246
o Different doses can be computed in function of the target pathogens MIC distribution. 1247
Higher dose should for example, be applied to cover adequately the least susceptible 1248
bacterial species. 1249
- Concerning the modelling using AUC/MIC or T>MIC as PDI: 1250
o When modelling the Probability of Target Attainment (PTA; 90%) according to the selected 1251
PDI and MIC, it can be concluded that for T>MIC, the computation of the PDI requires 1252
simulation of time-concentrations curves which requires pharmacometric tools. The 1253
interest of this approach is to further refine the dosage regime in relation to the way of 1254
administration of the treatment. Indeed, the results in Table 12 revealed that fractionation 1255
of the dose increases the probability to attain the target value of the PDI. This is mainly 1256
due to the short half-life of the active substances. 1257
o T>MIC provides a better option for defining a precise daily dose for time-dependent 1258
antibiotics but it need then the definition of a frequency of administration by day to 1259
guarantee an acceptable exposure. 1260
o AUC is less precise but allows to define a daily dose allowing a good exposure and thus 1261
without taking into account the frequency of administration. The determination of a daily 1262
dose reaching the PTA of 90% using T>MIC as a PDI will not be feasible as the computed 1263
dose will be too high. The PK/PD analysis using T>MIC as PDI could be used to further 1264
refine the interval frequency after the determination of a daily dose using AUC/MIC. 1265
o The outcome of this pilot exercise, using AUC/MIC, indicates that the optimised dose to 1266
treat respiratory disease in pigs with amoxicillin in drinking water is 40 mg/kg bw to cover 1267
the major pathogens P. multocida, A. pleuropneumoniae, S. suis and H. parasuis. 1268
A recent paper (Burch & Sperling, 2018) reviewed the use of amoxicillin in swine looking at the various 1269
formulations and routes of administrations in regards to clinical efficacy. They considered 1270
epidemiological cut-off values in their PK/PD correlation and concluded that an oral dose of 20 mg/kg 1271
bw might not be suitable and should be increased. 1272
7.2.6. Set a PK/PD breakpoint 1273
The last step of the proposed approach to address doses is the definition of clinical breakpoint, or 1274
PK/PD breakpoints when lacking clinical data (cf. chapter 3.3 – step 7). According to the data available 1275
for amoxicillin, ECOFFs vary between the targeted bacterial species. In our example, the PK/PD 1276
breakpoint could be set at 0.5 µg/mL as the PTA of 90% for strains with MIC above 1 µg/mL is never 1277
reached (Figure 13). This value seems compatible with ECOFFs of studied species but with the 1278

Reflection paper on dose optimisation of established veterinary antibiotics in the context of SPC harmonisation
EMA/CVMP/849775/2017 Page 42/120
limitations that our dataset is too small to determine them correctly for all bacterial species (n<300). 1279
The highest daily dose tested of 40 mg/kg bw allows to reach a PTA close to 90 % when AUC/MIC is 1280
used but not with T>MIC for which the PTA value depends on the rate of administration. 1281
7.2.7. Define an optimal daily dose 1282
According to the PK/PD modelling done in for this case study, the approved oral daily dose of 20 mg/kg 1283
bw is insufficient to sufficiently expose the target pathogens for 24 hours. A recent paper reviewed the 1284
use of amoxicillin in swine looking at the various formulations and routes of administrations in regards 1285
to clinical efficacy. They considered epidemiological cut-off values in their PK/PD correlation and also 1286
concluded that an oral dose of 20 mg/kg bw might not be suitable and should be increased (Burch and 1287
Sperling, 2018). Indeed, using AUC/MIC as a PDI, the dose of 20 mg/kg bw is not able to reach a PTA 1288
of 90% for the different target pathogens. To achieve this goal, the outcome of this pilot exercise, 1289
indicates that the optimised dose to treat respiratory disease in pigs with amoxicillin in drinking water 1290
is 40 mg/kg bw to cover the major pathogens P. multocida, A. pleuropneumoniae, S. suis and H. 1291
parasuis. However, as amoxicillin is a time dependent antimicrobials where T>MIC is considered as 1292
best predictors of clinical efficacy, a second step was applied to refine the daily dose firstly set using 1293
AUC/MIC. Using T>MIC, the results show that the PTA increase with dose and dose fractionation (Table 1294
12). Thus, the medication by drinking water represents a good route administration for amoxicillin 1295
allowing fractionating the dose of 40 mg/kg bw newly defined, during the day in function of the 1296
drinking rhythm and behaviour of the treated animals. Furthermore, when a medicinal product is 1297
presented in a solution prior to administration through drinking water, the product’s formulation will 1298
usually not influence the bioavailability of the active substance (See Guideline 1299
EMA/CVMP/EWP/016/00-Rev.3; EMA/CVMP, 2017). 1300
7.3. Withdrawal period 1301
The Withdrawal Periods (WP) of the various products authorised in the EU Member States vary greatly 1302
and range from 2 – 28 days (an overview is provided in Annex 3). This overview was generated around 1303
2010 and might not be completely up to date anymore. However, it is unlikely that major changes 1304
have occurred in the meantime. There is no obvious pattern why for some products the WP is rather 1305
long or short. In this context it should be noted that the most of the products are generics for which no 1306
product specific residue depletion studies were usually required2. 1307
Table 13. Selection of amoxicillin products (powder for oral administration) for the treatment of 1308
respiratory disease in pigs licensed in the EU via the Mutual Recognition procedure 1309
Product Posology
(amoxicillin trihydrate)
Withdrawal Period (WP)
A 16 mg/kg bw per day for 5 days 2 days
B 20 mg/kg bw per day for 5 days 6 days
C 20 mg/kg bw per day for 5 days 14 days
D 20 mg/kg bw per day for 5 days 2 days
E 20 mg/kg bw per day for 5 days 2 days
F 13 mg/kg bw per day for 5 days 2 days
2 The products are soluble powders which are administered orally via drinking water. For this reason generic
products can make direct reference to the WP of the pioneer product.
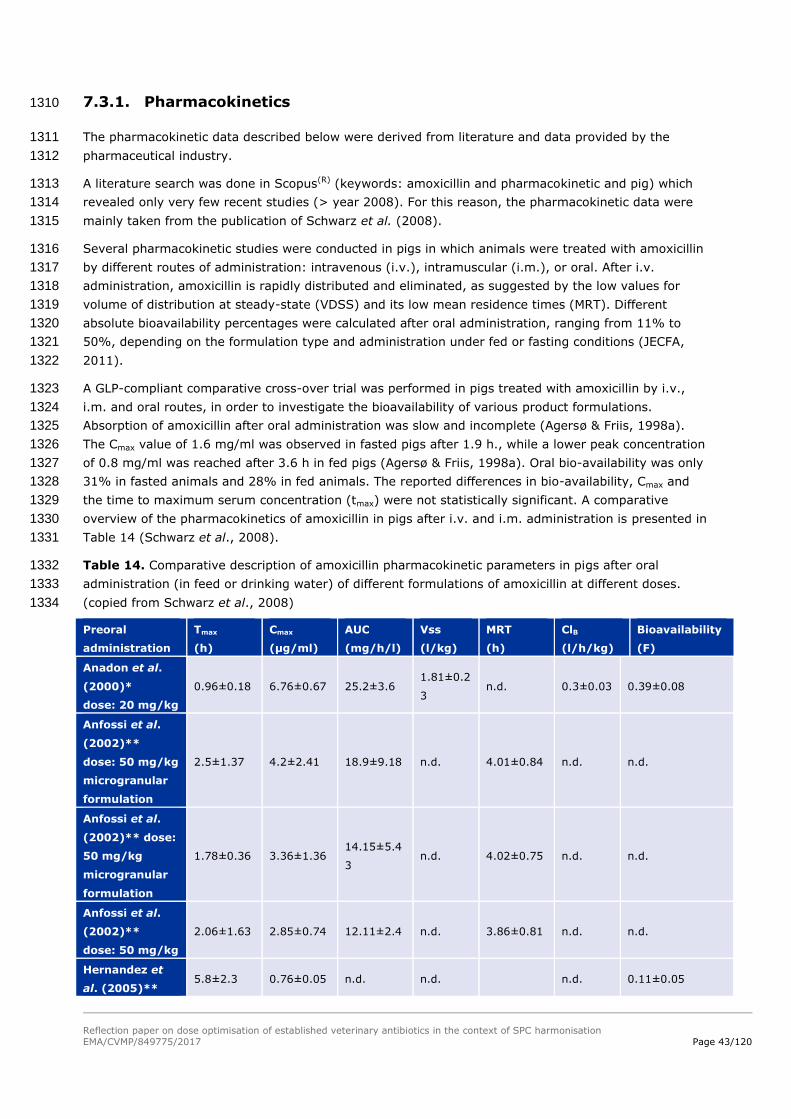
Reflection paper on dose optimisation of established veterinary antibiotics in the context of SPC harmonisation
EMA/CVMP/849775/2017 Page 43/120
7.3.1. Pharmacokinetics 1310
The pharmacokinetic data described below were derived from literature and data provided by the 1311
pharmaceutical industry. 1312
A literature search was done in Scopus(R) (keywords: amoxicillin and pharmacokinetic and pig) which 1313
revealed only very few recent studies (> year 2008). For this reason, the pharmacokinetic data were 1314
mainly taken from the publication of Schwarz et al. (2008). 1315
Several pharmacokinetic studies were conducted in pigs in which animals were treated with amoxicillin 1316
by different routes of administration: intravenous (i.v.), intramuscular (i.m.), or oral. After i.v. 1317
administration, amoxicillin is rapidly distributed and eliminated, as suggested by the low values for 1318
volume of distribution at steady-state (VDSS) and its low mean residence times (MRT). Different 1319
absolute bioavailability percentages were calculated after oral administration, ranging from 11% to 1320
50%, depending on the formulation type and administration under fed or fasting conditions (JECFA, 1321
2011). 1322
A GLP-compliant comparative cross-over trial was performed in pigs treated with amoxicillin by i.v., 1323
i.m. and oral routes, in order to investigate the bioavailability of various product formulations. 1324
Absorption of amoxicillin after oral administration was slow and incomplete (Agersø & Friis, 1998a). 1325
The Cmax value of 1.6 mg/ml was observed in fasted pigs after 1.9 h., while a lower peak concentration 1326
of 0.8 mg/ml was reached after 3.6 h in fed pigs (Agersø & Friis, 1998a). Oral bio-availability was only 1327
31% in fasted animals and 28% in fed animals. The reported differences in bio-availability, Cmax and 1328
the time to maximum serum concentration (tmax) were not statistically significant. A comparative 1329
overview of the pharmacokinetics of amoxicillin in pigs after i.v. and i.m. administration is presented in 1330
Table 14 (Schwarz et al., 2008). 1331
Table 14. Comparative description of amoxicillin pharmacokinetic parameters in pigs after oral 1332
administration (in feed or drinking water) of different formulations of amoxicillin at different doses. 1333
(copied from Schwarz et al., 2008) 1334
Preoral
administration
Tmax
(h)
Cmax
(µg/ml)
AUC
(mg/h/l)
Vss
(l/kg)
MRT
(h)
ClB
(l/h/kg)
Bioavailability
(F)
Anadon et al.
(2000)*
dose: 20 mg/kg
0.96±0.18 6.76±0.67 25.2±3.6 1.81±0.2
3 n.d. 0.3±0.03 0.39±0.08
Anfossi et al.
(2002)**
dose: 50 mg/kg
microgranular
formulation
2.5±1.37 4.2±2.41 18.9±9.18 n.d. 4.01±0.84 n.d. n.d.
Anfossi et al.
(2002)** dose:
50 mg/kg
microgranular
formulation
1.78±0.36 3.36±1.36 14.15±5.4
3 n.d. 4.02±0.75 n.d. n.d.
Anfossi et al.
(2002)**
dose: 50 mg/kg
2.06±1.63 2.85±0.74 12.11±2.4 n.d. 3.86±0.81 n.d. n.d.
Hernandez et
al. (2005)** 5.8±2.3 0.76±0.05 n.d. n.d. n.d. 0.11±0.05

Reflection paper on dose optimisation of established veterinary antibiotics in the context of SPC harmonisation
EMA/CVMP/849775/2017 Page 44/120
Preoral
administration
Tmax
(h)
Cmax
(µg/ml)
AUC
(mg/h/l)
Vss
(l/kg)
MRT
(h)
ClB
(l/h/kg)
Bioavailability
(F)
dose: 15 mg/kg
Martinez-
Larranaga et al.
(2004)**
dose: 20 mg/kg
0.97±0.29 7.37±0.42 27.4±4.93 1.35±0.2 4.47±0.30 n.d. 0.41
Morthorst
(2002)***
dose: 20 mg/kg
0.55±0.85 21.6±34.5 21.4±12.9 n.d. n.d. n.d. 0.98
*Oral administration not defined 1335
** in feed 1336
|*** in drinking water 1337
The most recent studies available since 2008 are briefly summarised below. In summary, the 1338
pharmacokinetic parameters assessed and evaluated where broadly in line with what has been 1339
published before. 1340
Godoy et al. (2011) made a comparative pharmacokinetic assessment of amoxicillin given to healthy 1341
pigs and pigs suffering from respiratory disease. After single intravenous bolus administration of 1342
amoxicillin to healthy pigs, the VDSS was 0.61 l/kg, total plasma clearance was 0.83 l/h/kg and MRT 1343
0.81 h. After oral bolus administration, the mean absorption time was 1.6 h and the peak plasma 1344
concentration of 3.09 µg/ml was reached after 1.2 h. The oral bioavailability was 34%. 1345
Pharmacokinetic parameters calculated (Cmaxss, Cminss, Cavss and AUC24ss) were significantly lower in 1346
healthy pigs in comparison to diseased pigs. This was due to higher bioavailability and longer 1347
absorption period observed in diseased pigs. Dose linearity was demonstrated in diseased pigs over a 1348
dose range of 4-18 mg/kg bw. 1349
Menotta et al. (2012) compared the bioavailability of a coated amoxicillin to an uncoated formulation. 1350
Oral bioavailability of the formulation with coated amoxicillin was higher than with uncoated 1351
amoxicillin, AUC was significant higher and there were statistically significant differences in Cmax, Time 1352
to Cmax (Tmax) and MRT. That confirms that the galenics of the formulation may have a significant effect 1353
on the pharmacokinetic profile. However, for conventional oral formulations (powder and granules) a 1354
difference in oral bioavailability is not expected, because of the good solubility of amoxicillin trihydrate 1355
in water.3 1356
Dai et al. (2017) conducted a relative bioavailability study of an oral amoxicillin-apramycin combination 1357
in pigs. The study was done in a three way cross-over design comparing the pharmacokinetics of 1358
amoxicillin and apramycin either as single components, or as combination product. The test articles 1359
were given intra-gastrically to fastened pigs at a dose of 16 mg/kg bw amoxicillin. There was no 1360
difference in the pharmacokinetic profile of amoxicillin whether administered alone or in combination 1361
with apramycin. Of interest are the basic pharmacokinetics parameters for amoxicillin obtained in this 1362
study. The peak plasma concentration was reached after 1.92 h with a Cmax of 3,25 µg/ml and AUC0-∞ 1363
of 8.43 mg/h/l. The MRT was 3.43 and T1/2 was 6.33 h. The data are overall consistent with previously 1364
reported data (see Table 14). 1365
In addition, several pharmacokinetic studies were made available from industry. Following, only the 1366
key findings are briefly reported. 1367
3 Data from a solubility study indicated that amoxicillin trihydrate (product; amoxicillin 80% oral powder) is soluble
in water of different qualities (soft / pH=5; hard / pH=8) and temperatures (20 ºC; 5 ºC) in the concentration of 1 g in 600 ml of water (Company A).

Reflection paper on dose optimisation of established veterinary antibiotics in the context of SPC harmonisation
EMA/CVMP/849775/2017 Page 45/120
A pilot study was set up to investigate the plasma pharmacokinetics of amoxicillin-trihydrate in eight 1368
14-week old pigs after single (pulse) oral administration of a soluble powder, first through feed and 1369
two weeks later through drinking water. Two dosages, i.e., 11.6 and 23.2 mg amoxicillin/kg bw were 1370
tested. When administered in combination with pelleted feed, absorption of amoxicillin was somewhat 1371
delayed as indicated by the Tmax of about 2.25 h and the terminal half-life of about 1.1 h for the 14.5 1372
mg/kg bw dose and 1.7 h for the 29 mg/kg bw dose. These values are higher than the corresponding 1373
values observed after administration in water. This indicates that absorption is the rate limiting step for 1374
elimination. The maximum plasma levels obtained do not linearly increase with the dose, i.e., 1.0 and 1375
1.25 mg amoxicillin per animal. This is also indicated by the observed area under the curve (AUC) for 1376
the two dosages, which tend to be somewhat lower for the higher dosage. The plasma-concentration 1377
profiles show that amoxicillin is rapidly absorbed as indicated by the observed Tmax of about 0.75 h and 1378
the terminal half-life of 0.5 to 1.0 h, suggesting that rate of absorption is not limiting for elimination. 1379
This is also indicated by the observed AUCs for the two dosages, which are proportional and represent 1380
more than 99% of the total extrapolated AUC at 7.25 h after consumption of the dose. The maximum 1381
plasma levels obtained show a roughly linear increase with the dose, with Cmax values of 1.5 and 2.7 1382
mg amoxicillin per animal for the 14.5 mg/kg bw and 29 mg/kg bw dose, respectively. 1383
In a second pilot study the pharmacokinetics of amoxicillin was assessed after repeated administration. 1384
Eight 14-weeks old pigs were divided into two medicated groups of four animals. Group I received a 1385
continuously administered daily dose of 8.0 mg amoxicillin/kg bw, mixed through the daily ration of 1386
drinking water for three consecutive days. Group II similarly received an oral dose of 16.0 mg 1387
amoxicillin/kg bw mixed through the daily ration of drinking water. Two weeks after the continuous 1388
medication, the animals received a single pulse dosage of 10. 0 or 20.0 mg/kg bw per day 1389
respectively. The average plateau plasma levels were ranging between 0.2 and 0.4 µg/ml after dosing 1390
of 10 mg/kg bw per day and between 0.3 and 0.7 µg/ml after the daily dosage of 20 mg/kg bw. After 1391
daily single pulse dosing peak plasma levels ranging from 0.7 to 1 µg/ml for the 10 mg/kg bw dose, 1392
and from 1.1 to 2.1 µg/ml for the 20 mg/kg bw dose were obtained. 1393
Further data were provided by Company B (1) which are summarised in the two figures below. 1394
1395
Figure 14. Amoxicillin plasma concentrations in pigs after a single oral dose. Mean values and 1396
standard deviation (+/-) are shown 1397
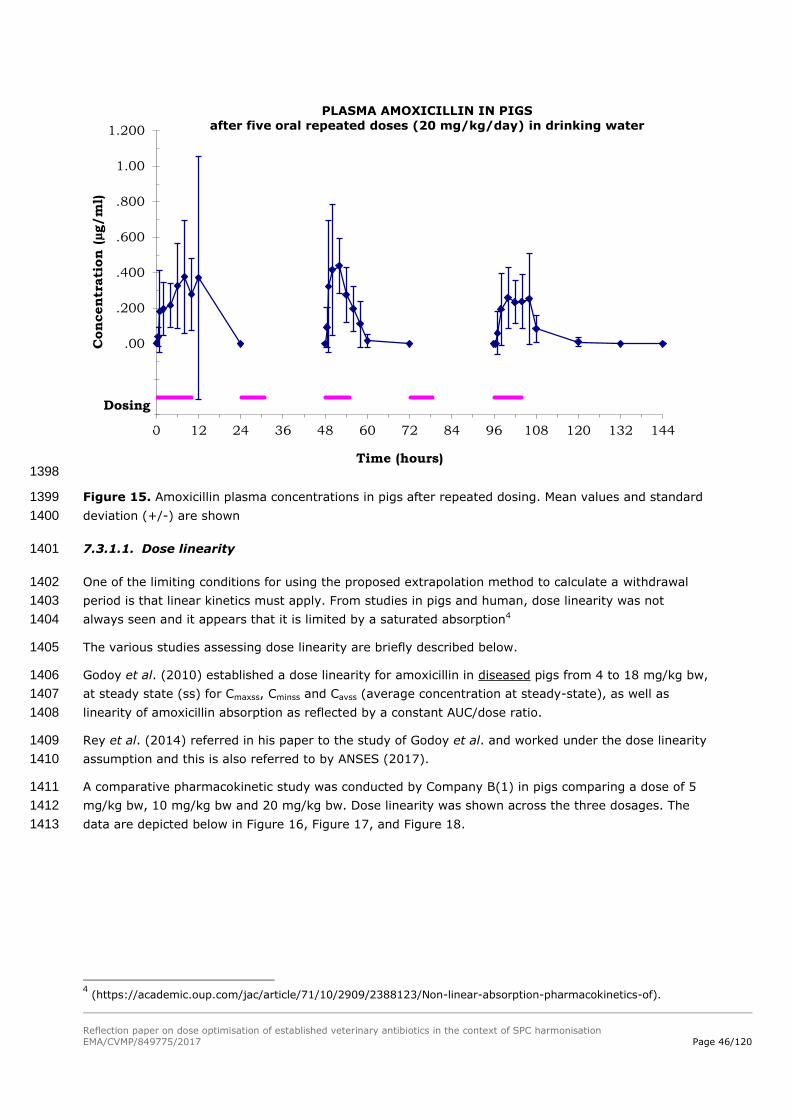
Reflection paper on dose optimisation of established veterinary antibiotics in the context of SPC harmonisation
EMA/CVMP/849775/2017 Page 46/120
1398
Figure 15. Amoxicillin plasma concentrations in pigs after repeated dosing. Mean values and standard 1399
deviation (+/-) are shown 1400
7.3.1.1. Dose linearity 1401
One of the limiting conditions for using the proposed extrapolation method to calculate a withdrawal 1402
period is that linear kinetics must apply. From studies in pigs and human, dose linearity was not 1403
always seen and it appears that it is limited by a saturated absorption4 1404
The various studies assessing dose linearity are briefly described below. 1405
Godoy et al. (2010) established a dose linearity for amoxicillin in diseased pigs from 4 to 18 mg/kg bw, 1406
at steady state (ss) for Cmaxss, Cminss and Cavss (average concentration at steady-state), as well as 1407
linearity of amoxicillin absorption as reflected by a constant AUC/dose ratio. 1408
Rey et al. (2014) referred in his paper to the study of Godoy et al. and worked under the dose linearity 1409
assumption and this is also referred to by ANSES (2017). 1410
A comparative pharmacokinetic study was conducted by Company B(1) in pigs comparing a dose of 5 1411
mg/kg bw, 10 mg/kg bw and 20 mg/kg bw. Dose linearity was shown across the three dosages. The 1412
data are depicted below in Figure 16, Figure 17, and Figure 18. 1413
4 (https://academic.oup.com/jac/article/71/10/2909/2388123/Non-linear-absorption-pharmacokinetics-of).
-.400
-.200
.00
.200
.400
.600
.800
1.00
1.200
0 12 24 36 48 60 72 84 96 108 120 132 144
Concentr
ati
on (
µg/m
l)
Time (hours)
PLASMA AMOXICILLIN IN PIGS
after five oral repeated doses (20 mg/kg/day) in drinking water
Dosing

Reflection paper on dose optimisation of established veterinary antibiotics in the context of SPC harmonisation
EMA/CVMP/849775/2017 Page 47/120
1414
Figure 16. Amoxicillin plasma concentrations at three different dose levels. Mean values and standard 1415
deviation (+/-) are shown 1416
1417
Figure 17. Dose linearity of individual amoxicillin plasma concentrations at three different dose levels 1418
(5 mg /kg bw, 10 mg /kg bw and 20 mg/kg bw). X-axis: dose (mg/kg bw); Y-axis : plasma amoxicillin 1419
concentrations (ng/ml) 1420
0
2000
4000
6000
8000
10000
12000
0 4 8 12 16 20 24
Co
ncen
trati
on
s (
ng
/mL
)
Time (h)
Amoxicillin in Pigs after oral administrations at 5, 10 and 20 mg/kg
5 mg/kg
10 mg/kg
20 mg/kg

Reflection paper on dose optimisation of established veterinary antibiotics in the context of SPC harmonisation
EMA/CVMP/849775/2017 Page 48/120
1421
Figure 18. Dose linearity of mean amoxicillin plasma concentrations at three different dose levels (5 1422
mg/kg bw, 10 mg/kg bw and 20 mg/kg bw). X-axis: dose (mg/kg bw); Y-axis : plasma amoxicillin 1423
concentrations (ng/ml) 1424
An acceptable and good dose-linearity relationship (R2>0.98) is observed for Cmax within the dose 1425
range of 5 to 20 mg/kg bw. 1426
Data from humans clearly state a dose linearity of amoxicillin 250 mg capsules GP over a range of 1427
250-3000 mg. Data in humans may also be considered because of the very similar gastro-intestinal 1428
tract system between the two species5. 1429
7.3.1.2. Overall Summary of Pharmacokinetics 1430
Studies have shown that the oral bioavailability of amoxicillin can be quite variable which is associated 1431
with different formulations and different methods of oral administration (gavage, fasted vs. non-fasted 1432
pigs, food-interaction). Bioavailability in diseased animals is also significantly higher than in healthy 1433
animals. 1434
Regarding Cmax, studies have demonstrated a dose-linearity relationship between 5 and 20 mg/kg bw. 1435
Plasma protein binding of amoxicillin has been described to be 28% and can be considered to be low. 1436
7.3.2. PK/PD Considerations 1437
Using PK/PD modelling methods, within this pilot project, an optimal dose of 40 mg/kg bw could be 1438
calculated (see above). This dose will be used in the section of this case study that considers the 1439
extrapolation of the withdrawal periods. 1440
7.3.3. Metabolism 1441
The two major metabolites of amoxicillin are amoxicilloic acid and amoxicillin piperazine-2,5-dione 1442
(diketopiperazine). These metabolites have lost the antibacterial activity of the parent component, but 1443
the amoxicilloic acid could have potential allergic properties. The metabolites are of no relevance for 1444
the purpose of this case study. Indeed a microbiological Acceptable Daily Intake (ADI) has been 1445
5 (https://www.medicines.org.uk/emc/medicine/25916)

Reflection paper on dose optimisation of established veterinary antibiotics in the context of SPC harmonisation
EMA/CVMP/849775/2017 Page 49/120
established by JECFA for amoxicillin, and this ADI covers the allergic risk associated with these two 1446
metabolites displaying almost nil antibacterial activity. 1447
7.3.4. Radiolabelled residue depletion studies 1448
There were no amoxicillin radiolabel residue depletion studies in pigs available for evaluation. The only 1449
microbiological active residue is the parent molecule. 1450
7.3.5. Maximum Residue Limits 1451
The CVMP (1996) did not establish an ADI for penicillins. In order to adequately protect the consumer 1452
and secure dairy production, the CVMP recommended the following maximum residue levels for six 1453
penicillins: 1454
Table 15. EU Maximum Residue Limits for penicillins 1455
Pharmacologically active
substance
Edible Tissues (µg/kg) Milk (µg/kg)
Benzylpenicillin 50 4
Ampicillin 50 4
Amoxicillin 50 4
Oxacillin 300 30
Cloxacillin 300 30
Dicloxacillin 300 30
1456
JECFA (2011, 2017) assessed amoxicillin at their 75th meeting in 2011 and their 85th meeting in 2017 1457
and came to the following conclusions: 1458
- An ADI of 0–0.002 mg/kg bw was established by the Committee based on a microbiological 1459
endpoint, equivalent to an upper bound value of 0.12 mg for a 60 kg person. 1460
- The Committee recommended MRLs for amoxicillin in cattle, sheep, pig and finfish tissues of 50 1461
μg/kg and in cattle and sheep milk of 4 μg/kg, determined as amoxicillin parent compound. The 1462
Committee determined also an Acute Reference Dose and a Global Estimated Acute and Chronic 1463
Dietary Exposure. 1464
7.3.6. Tissue residue studies 1465
Only few residue depletion studies in pigs are available. JECFA (75th meeting, 2011) reviewed data 1466
from 1979 where amoxicillin was given orally as an oily suspension. Amoxicillin was eliminated very 1467
quickly and no residue depletion profile could be established in tissues and organs. It was concluded 1468
that for many studies in all species assessed, namely cattle, pigs and poultry, the sampling time 1469
intervals were too long to permit a detailed analysis of residue depletion in tissues and, consequently, 1470
there are a substantial number of reported findings <LOQ (limit of quantification). 1471
The same conclusions apply to the study published by Reyns et al. (2007). Residue depletion of 1472
amoxicillin residues occurred rapidly and residues were below the limit of detection (LOD) already 48 h 1473
after last administration of 20 mg/kg bw amoxicillin administered once by gavage (stomach tube). 1474
A non-GLP residue depletion study was conducted in Belgian Landrace stress-negative pigs. Twenty 1475
animals received an i.v. bolus of amoxicillin at a dosage of 20 mg/kg bw through a catheter in an ear 1476
vein. Animals (n=4) were killed at 12, 48, 60, 72 and 84 h post-dosing. Amoxicillin and its major 1477
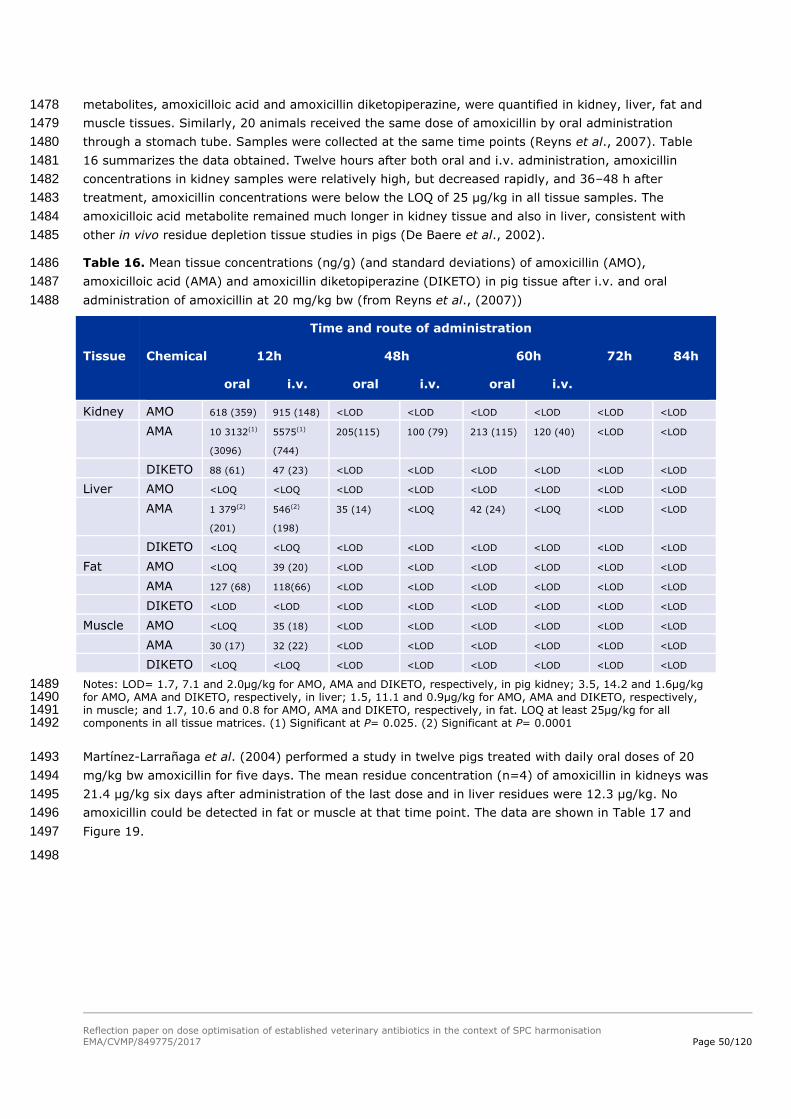
Reflection paper on dose optimisation of established veterinary antibiotics in the context of SPC harmonisation
EMA/CVMP/849775/2017 Page 50/120
metabolites, amoxicilloic acid and amoxicillin diketopiperazine, were quantified in kidney, liver, fat and 1478
muscle tissues. Similarly, 20 animals received the same dose of amoxicillin by oral administration 1479
through a stomach tube. Samples were collected at the same time points (Reyns et al., 2007). Table 1480
16 summarizes the data obtained. Twelve hours after both oral and i.v. administration, amoxicillin 1481
concentrations in kidney samples were relatively high, but decreased rapidly, and 36–48 h after 1482
treatment, amoxicillin concentrations were below the LOQ of 25 μg/kg in all tissue samples. The 1483
amoxicilloic acid metabolite remained much longer in kidney tissue and also in liver, consistent with 1484
other in vivo residue depletion tissue studies in pigs (De Baere et al., 2002). 1485
Table 16. Mean tissue concentrations (ng/g) (and standard deviations) of amoxicillin (AMO), 1486
amoxicilloic acid (AMA) and amoxicillin diketopiperazine (DIKETO) in pig tissue after i.v. and oral 1487
administration of amoxicillin at 20 mg/kg bw (from Reyns et al., (2007)) 1488
Tissue
Time and route of administration
Chemical 12h 48h 60h 72h 84h
oral i.v. oral i.v. oral i.v.
Kidney AMO 618 (359) 915 (148) <LOD <LOD <LOD <LOD <LOD <LOD
AMA 10 3132(1)
(3096)
5575(1)
(744)
205(115) 100 (79) 213 (115) 120 (40) <LOD <LOD
DIKETO 88 (61) 47 (23) <LOD <LOD <LOD <LOD <LOD <LOD
Liver AMO <LOQ <LOQ <LOD <LOD <LOD <LOD <LOD <LOD
AMA 1 379(2)
(201)
546(2)
(198)
35 (14) <LOQ 42 (24) <LOQ <LOD <LOD
DIKETO <LOQ <LOQ <LOD <LOD <LOD <LOD <LOD <LOD
Fat AMO <LOQ 39 (20) <LOD <LOD <LOD <LOD <LOD <LOD
AMA 127 (68) 118(66) <LOD <LOD <LOD <LOD <LOD <LOD
DIKETO <LOD <LOD <LOD <LOD <LOD <LOD <LOD <LOD
Muscle AMO <LOQ 35 (18) <LOD <LOD <LOD <LOD <LOD <LOD
AMA 30 (17) 32 (22) <LOD <LOD <LOD <LOD <LOD <LOD
DIKETO <LOQ <LOQ <LOD <LOD <LOD <LOD <LOD <LOD
Notes: LOD= 1.7, 7.1 and 2.0µg/kg for AMO, AMA and DIKETO, respectively, in pig kidney; 3.5, 14.2 and 1.6µg/kg 1489 for AMO, AMA and DIKETO, respectively, in liver; 1.5, 11.1 and 0.9µg/kg for AMO, AMA and DIKETO, respectively, 1490 in muscle; and 1.7, 10.6 and 0.8 for AMO, AMA and DIKETO, respectively, in fat. LOQ at least 25µg/kg for all 1491 components in all tissue matrices. (1) Significant at P= 0.025. (2) Significant at P= 0.0001 1492
Martínez-Larrañaga et al. (2004) performed a study in twelve pigs treated with daily oral doses of 20 1493
mg/kg bw amoxicillin for five days. The mean residue concentration (n=4) of amoxicillin in kidneys was 1494
21.4 μg/kg six days after administration of the last dose and in liver residues were 12.3 μg/kg. No 1495
amoxicillin could be detected in fat or muscle at that time point. The data are shown in Table 17 and 1496
Figure 19. 1497
1498

Reflection paper on dose optimisation of established veterinary antibiotics in the context of SPC harmonisation
EMA/CVMP/849775/2017 Page 51/120
Table 17. Mean (sd) plasma concentrations (µg/ml) and tissue concentrations (µg/kg) of amoxicillin in 1499
four pigs given 20 mg/kg amoxycillin orally for five days (copied from Martinez- Larrañaga et al., 1500
2004) 1501
Tissue Time after last dose (days) Concentration of amoxicillin
Plasma 1
2
4
6
0.048 (0.003)
ND
ND
ND
Muscle 2
4
6
23.6 (2.44)
13.6 (1.34)
ND
Kidney
2
4
6
559.7 (94.9)
149.2 (41.1)
21.4 (1.49)
Liver 2
4
6
49.1 (6.53)
20.7 (2.05)
12.3 (2.15)
Fat 2
4
6
24.7 (4.21)
11.9 (1.41)
ND
Limit of quantification= 0.01µg/g, limit of detection= 0.003µg/g ND Not detectable 1502
1503
Figure 19. Amoxicillin tissue residues (µg/kg) in muscle, liver, kidney and fat from pigs given 1504
amoxicillin at a dose of 20 mg/kg bw orally for 5 consecutive days (Martínez-Larrañaga et al., 2004) 1505
The elimination half-lives shown below have been calculated from the tissue residue depletion data 1506
(mean values, data from Table 17). 1507
Table 18. Elimination half life in pig tissues 1508
Commodity Elimination half-life Comment
Liver 2.7 days low fitting of curve with data
Kidney 0.85 days good fitting of curve with data
Muscle 2 days low fitting of curve with data
Fat 2 days good fitting of curve with data
.000
100.000
200.000
300.000
400.000
500.000
600.000
2d 4d 6d
Muscle
Kidney
Liver
Fat

Reflection paper on dose optimisation of established veterinary antibiotics in the context of SPC harmonisation
EMA/CVMP/849775/2017 Page 52/120
In another residue depletion study, amoxicillin was administered twice daily via drinking water at a 1509
dose of 10 mg/kg bw or once daily at a dose of 20 mg/kg bw for 5 consecutive days (Company B (2)). 1510
Mean residue data shown below in Figure 20 and Figure 21. Amoxicillin residues were detectable in 1511
tissues and organs over a rather long period of time. 1512
1513
Figure 20. Amoxicillin residues (µg/kg) in pigs after oral administration twice daily via drinking water 1514
at a dose of 10 mg/kg bw amoxicillin in 4 animals per group; HPLC method, LOQ: 20 µg/kg 1515
1516
Figure 21. Amoxicillin residues (µg/kg) in pigs after oral administration of 20 mg/kg bw amoxicillin, 1517
once a day in liquid meal for 5 days, 4 animals per group, HPLC method, LOQ: 20 µg/kg 1518
The elimination half-lives shown below have been calculated from the two tissue residue depletion 1519
studies (10 mg/kg bw given twice daily for 5 consecutive days and 20 mg/kg bw given once daily for 5 1520
consecutive days (data from Company B(2)). 1521
1522
0
100
200
300
400
500
600
700
800
900
1000
1d 2d 4d 6d 8d
muscle
kidney
liver
skin/fat
0
500
1000
1500
2000
2500
3000
3500
1d 2d 4d 6d 7d 8d
kidney
liver
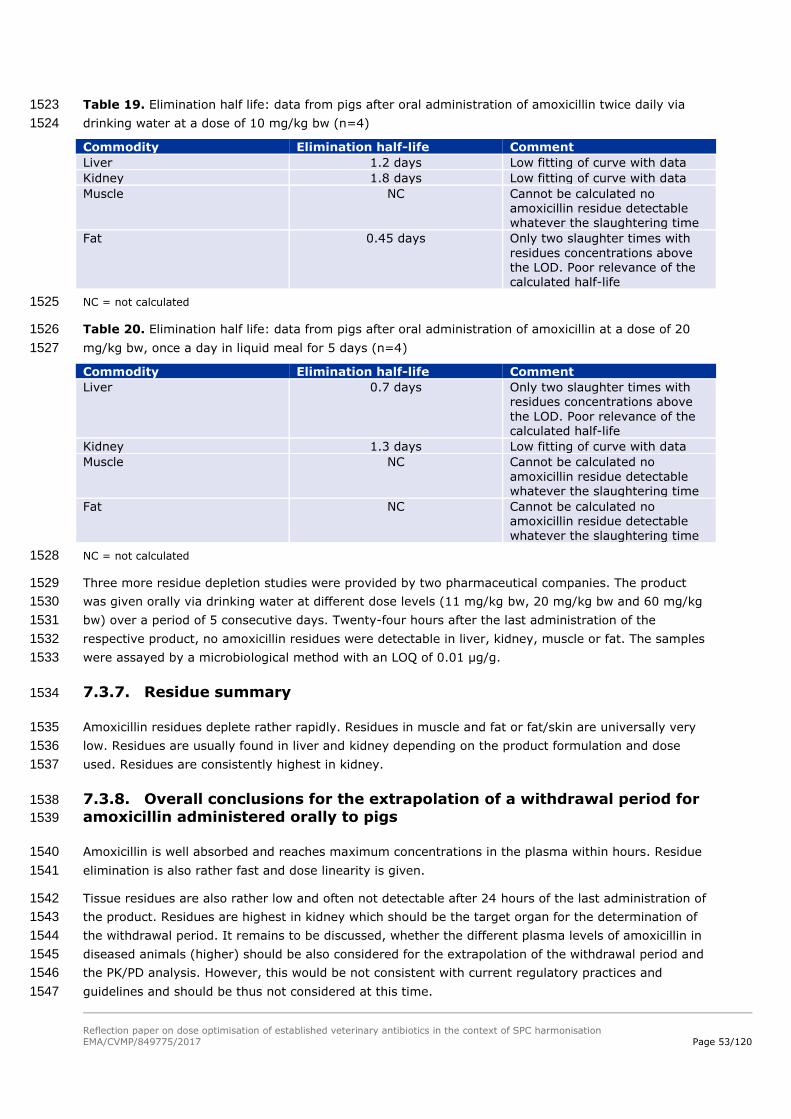
Reflection paper on dose optimisation of established veterinary antibiotics in the context of SPC harmonisation
EMA/CVMP/849775/2017 Page 53/120
Table 19. Elimination half life: data from pigs after oral administration of amoxicillin twice daily via 1523
drinking water at a dose of 10 mg/kg bw (n=4) 1524
Commodity Elimination half-life Comment
Liver 1.2 days Low fitting of curve with data
Kidney 1.8 days Low fitting of curve with data
Muscle NC Cannot be calculated no amoxicillin residue detectable whatever the slaughtering time
Fat 0.45 days Only two slaughter times with
residues concentrations above the LOD. Poor relevance of the calculated half-life
NC = not calculated 1525
Table 20. Elimination half life: data from pigs after oral administration of amoxicillin at a dose of 20 1526
mg/kg bw, once a day in liquid meal for 5 days (n=4) 1527
Commodity Elimination half-life Comment
Liver 0.7 days Only two slaughter times with residues concentrations above
the LOD. Poor relevance of the calculated half-life
Kidney 1.3 days Low fitting of curve with data
Muscle NC Cannot be calculated no
amoxicillin residue detectable whatever the slaughtering time
Fat NC Cannot be calculated no amoxicillin residue detectable whatever the slaughtering time
NC = not calculated 1528
Three more residue depletion studies were provided by two pharmaceutical companies. The product 1529
was given orally via drinking water at different dose levels (11 mg/kg bw, 20 mg/kg bw and 60 mg/kg 1530
bw) over a period of 5 consecutive days. Twenty-four hours after the last administration of the 1531
respective product, no amoxicillin residues were detectable in liver, kidney, muscle or fat. The samples 1532
were assayed by a microbiological method with an LOQ of 0.01 µg/g. 1533
7.3.7. Residue summary 1534
Amoxicillin residues deplete rather rapidly. Residues in muscle and fat or fat/skin are universally very 1535
low. Residues are usually found in liver and kidney depending on the product formulation and dose 1536
used. Residues are consistently highest in kidney. 1537
7.3.8. Overall conclusions for the extrapolation of a withdrawal period for 1538
amoxicillin administered orally to pigs 1539
Amoxicillin is well absorbed and reaches maximum concentrations in the plasma within hours. Residue 1540
elimination is also rather fast and dose linearity is given. 1541
Tissue residues are also rather low and often not detectable after 24 hours of the last administration of 1542
the product. Residues are highest in kidney which should be the target organ for the determination of 1543
the withdrawal period. It remains to be discussed, whether the different plasma levels of amoxicillin in 1544
diseased animals (higher) should be also considered for the extrapolation of the withdrawal period and 1545
the PK/PD analysis. However, this would be not consistent with current regulatory practices and 1546
guidelines and should be thus not considered at this time. 1547

Reflection paper on dose optimisation of established veterinary antibiotics in the context of SPC harmonisation
EMA/CVMP/849775/2017 Page 54/120
For the extrapolation of a new withdrawal period considering a higher dose, tissue residue elimination / 1548
half-life is to be considered which is rather short and below 48 hours. As a worst case approach a half-1549
life of 48 h was used in the extrapolation of the WPs. 1550
7.3.9. Withdrawal time calculation 1551
The new withdrawal periods were calculated using Equation 2. 1552
It has been noted that the current withdrawal periods for the amoxicillin products vary considerably 1553
between products. There is no obvious reason for this. One explanation could be that the products do 1554
differ in their oral bioavailability. However, this may not explain the great differences in all the cases. 1555
However in this pilot project it was agreed to extrapolate from the current WPs of the products (see 1556
2.2. ). 1557
Table 21. Current WPs and the WPs calculated for a dose of 40 mg amoxicillin/kg bw for the products 1558
listed in Table 13 1559
Product Posology (amoxicillin trihydrate)
Current WP (days) Extrapolated WP (days)
A 16 mg/kg bw per day for 5 days 2 5
B 20 mg/kg bw per day for 5 days 6 8
C 20 mg/kg bw per day for 5 days 14 16
D 20 mg/kg bw per day for 5 days 2 4
E 20 mg/kg bw per day for 5 days 2 4
F 13 mg/kg bw per day for 5 days 2 6
7.4. Environmental risk assessment 1560
Because there may be different authorised doses for the same or similar products, as a general rule, 1561
the situation for the product with the highest authorised (total) dose for the same target animals is 1562
used for the comparison, provided that an ERA exists for that product at that dose for the relevant 1563
target species. In the case of amoxicillin products for use in drinking water for pigs, ERAs were 1564
available addressing the risks at a dose of 20 mg/kg bw per day for 5 days. 1565
7.4.1. Step 1: Determine the assessment situation for amoxicillin 1566
For the products containing amoxicillin for use in drinking water for pigs at doses of 20 mg/kg bw per 1567
day for up to 5 days, the existing ERAs went into Phase II because the PECsoil-trigger of Phase I was 1568
exceeded. Considering that the optimised dose of 40 mg/kg bw per day for up to 7 days is higher than 1569
the currently authorised dose, it was concluded that the ERA for the optimised dose would also enter 1570
Phase II. 1571
In the available Phase IIA assessments, fate and effect studies were considered, and the RQs were 1572
determined for the various test species representing the terrestrial and aquatic environments. The RQs 1573
for terrestrial species were in the range of 0.005-0.084, and the RQs for aquatic species were in the 1574
range of 0.012-0.43. 1575
When doubling the dose from 20 to 40 mg/kg bw per day for 5 days (the maximum duration for most 1576
of the products), the RQs will be increased by a factor of 2, resulting in a maximum RQ of 0.86. This 1577
RQ remains below 1. In addition, the dose increase will not result in a (Phase II Tier A) PECgroundwater 1578
higher than 0.1 µg/L. However, when the duration is extended to 7 days (as for some authorised 1579
products), the highest RQ (for aquatic species) would increase to 1.2. While this is only a slight 1580
exceedance of the RQ of 1, it would indicate the need for a Tier B assessment. Within the limited 1581
Reflection paper on dose optimisation of established veterinary antibiotics in the context of SPC harmonisation
EMA/CVMP/849775/2017 Page 55/120
sample of products available for this pilot project, no Tier B data were available. Beyond this pilot 1582
project, it should first be investigated if Tier B data are available from any of the MAHs. However 1583
within the context of this pilot project and in lieu of Tier B data, it was considered that most products 1584
have a treatment duration of 3-5 days, and all products have roughly the same PK when given via the 1585
drinking water at the same dose. Therefore, it was concluded that 3-5 days could be sufficient for all 1586
products concerned and having the same indication,. A limitation to 5 days as the maximum treatment 1587
duration was considered as a possible Risk Mitigation Measure (RMM), which could be applied to all 1588
such products concerned. Overall, it was concluded that the optimised dose does not give rise to 1589
concerns in relation to environmental risks. Further consideration of steps 2-8 of the proposed 1590
approach was not necessary. 1591
7.4.2. Conclusion on the ERA 1592
It was concluded that doubling the dose of amoxicillin from 20 mg/kg bw per day to 40 mg/kg bw per 1593
day for a maximum duration of 5 days will not present a risk for the environment. 1594
7.5. Target animal safety 1595
As noted in the introduction, the approved doses of amoxicillin for administration in drinking water to 1596
pigs vary widely between 10 – 20 mg/kg bw, to be given once or twice daily, for 3-7 consecutive days. 1597
According to the outcomes of the PKPD modelling, it is proposed that the dose should be doubled to 40 1598
mg/kg bw for the given swine respiratory disease indication. 1599
7.5.1. Step 1: Determine the target animal safety profile for the active 1600
substance and establish the MOS for the active substance according to the 1601
revised dose, pharmaceutical form and route of administration 1602
A review of the TAS studies provided by MAHs involved with the pilot project was undertaken. 1603
A GLP TAS study showed that amoxicillin was well tolerated in pigs aged from 12 weeks’ age dosed at 1604
25 mg/kg bw x 10 days (n=3) or 116 mg/kg bw (n=3) or 264 mg/kg bw (n=3) x 5 days; 1605
although this conclusion was based on physical findings, haematology and biochemistry, only. 1606
A further GLP TAS study showed that amoxicillin when administered via drinking water was well 1607
tolerated at doses of 20, 60 or 100 mg/kg bw x 15 days; however, there were some limitations of 1608
the study, e.g. only 4 pigs per dose group, and cardiac lesions in 2 pigs were not followed up. 1609
Reproductive toxicity studies were not available to the pilot project. 1610
Conclusions: A ‘no effect level’ has been shown for a dose of ≥ 116 mg/kg bw x 5 days in 6 animals, 1611
including at 264 mg/kg bw x 5 days in 3 of those animals; although this was based only on clinical 1612
findings and haematology/biochemistry. ‘No effect’ was shown in a further study up to 100 mg/kg bw x 1613
15 days in 4 healthy pigs. 1614
7.5.1.1. Step 1a: Review supplementary data from dossiers, if needed e.g. dose-finding 1615 studies 1616
Data not available to the pilot project. 1617
7.5.2. Step 2: Safety in the target population 1618
Data not available to the pilot project. 1619

Reflection paper on dose optimisation of established veterinary antibiotics in the context of SPC harmonisation
EMA/CVMP/849775/2017 Page 56/120
7.5.3. Step 3: Safety based on post-marketing pharmacovigilance 1620
Data not available to the pilot project. 1621
7.5.4. Step 4: Safety based on published literature and authorisations in 1622
third countries (if needed) 1623
Mrvos, R., Pummer, T.L., & Krenzelok, E.P. (2013). Amoxicillin renal toxicity: how often does it occur?. 1624
Pediatric emergency care, 29(5): 641-643. 1625
Grey literature 1626
CVMP Summary Report Penicillins 1627
Penicillins have a low toxicity in the normal sense of the word; the therapeutic index is more than 1628
100, and toxic effects have only been seen after extremely high doses. No teratogenic effects have 1629
been recorded. 1630
In connection with therapeutic use of penicillins hypersensitivity reactions are by far the most 1631
commonly encountered side-effects. The amount of penicillin haptene necessary to sensitize a subject 1632
is several orders of magnitude higher than the quantity needed to trigger an allergic reaction 1633
Furthermore, it takes a much higher oral dose to induce an allergic reaction than if the product is 1634
administered parenterally. 1635
Information from SPCs of EU-authorised products: 1636
SPC 4.3: Do not use in animals with serious kidney malfunction including anuria and oliguria. 1637
SPC 4.6: Penicillins and cephalosporins may cause hypersensitivity following administration. Allergic 1638
reactions to these substances may occasionally be serious. 1639
Rarely, gastro-intestinal tract signs associated with alteration of the intestinal flora (for example, loose 1640
stools, diarrhoea) may occur. 1641
SPC 4.7: Studies performed in Laboratory animals (rat, rabbit), did not show a teratogenic, 1642
embryotoxic or maternotoxic effect of amoxicillin. Safety of the product in the pregnant and lactating 1643
sows was not demonstrated. Use only accordingly to the benefit/risk assessment by the responsible 1644
veterinarian 1645
SPC 4.10: No side effects were observed after administration at 5 times the recommended dosage. No 1646
problems with overdosage have been reported. Treatment should be symptomatic and no specific 1647
antidote is available. 1648
TOXNET 1649
‘ANIMAL STUDIES: Reproduction studies have been performed in mice and rats at doses up to 2000 1650
mg/kg. There was no evidence of harm to the foetus due to amoxicillin. However, 100 ug/mL 1651
amoxicillin altered rat renal development in vitro. Prolonged use of amoxicillin might have a negative 1652
effect on bone formation around implants.’ 1653
Human toxicity: SIGNS AND SYMPTOMS - Clostridium difficile associated diarrhoea (CDAD) has been 1654
reported with use of nearly all antibacterial agents, including amoxicillin, and may range in severity 1655
from mild diarrhoea to fatal colitis. Treatment with antibacterial agents alters the normal flora of the 1656
colon leading to overgrowth of C. difficile. 1657

Reflection paper on dose optimisation of established veterinary antibiotics in the context of SPC harmonisation
EMA/CVMP/849775/2017 Page 57/120
Toxicological evaluation of certain veterinary drug residues in food (JECFA 75th meeting, 2011) In 1658
laboratory animal toxicological studies, NOAELs were largely based on the highest doses tested and 1659
were from 250 to 2000 mg/kg bw per day. Dogs receiving doses of 500 mg/kg bw showed 1660
gastrointestinal effects due to disturbance of the GI flora. 1661
Human toxicity: Gastro-intestinal, allergic effects and hepatotoxicity are reported. In humans the 1662
incidence of hepatotoxicity is identified at <0.02 to 3 per 100,000 prescriptions. It was concluded that 1663
amoxicillin is unlikely to cause reproductive or developmental toxicity in humans. 1664
Textbooks 1665
Prescott, J.F., & Dowling, P.M. (Eds.). (2013). Antimicrobial therapy in veterinary medicine. John Wiley 1666
& Sons.: ‘Penicilllins and beta-lactam antibiotics are generally remarkably free of toxic effects even 1667
at doses grossly in excess of those recommended. The major adverse effects are acute 1668
anaphylaxis and collapse; milder hypersensitivity reactions…are more common…. Anaphylactic 1669
reactions are less common after oral rather than parenteral administration…Less common adverse 1670
reactions include haemolytic anaemia and thrombocytopenia.’ ‘One hazard with broad-spectrum 1671
penicillins is the potential to disturb the normal intestinal flora.’ 1672
Conclusions: Published studies on the toxicity/safety of amoxicillin in pigs were hard to locate on a 1673
basic internet search (PubMed, Google scholar). According to grey literature and standard texts, 1674
amoxicillin has a wide margin of safety. Hepatotoxicity and renal toxicity may occur rarely. 1675
Gastrointestinal disturbances may occur due to disruption of the microbiota. Amoxicillin is unlikely to 1676
cause reproductive or developmental toxicity. The adverse event of most concern in humans is 1677
anaphylaxis, which is generally regarded as idiosyncratic. Although it takes a higher oral dose to 1678
induce an allergic reaction than if the drug is administered parenterally, it is not clear if increasing the 1679
dose within the therapeutic range would increase the risk of hypersensitivity developing. 1680
7.5.5. Step 5: Conclude on the safety of the increased dose of the active 1681
substance according to the pharmaceutical form and route of 1682
administration 1683
No specific studies are available that would demonstrate a MOS above the approved dose (20 mg/kg 1684
bw per day) consistent with current VICH requirements. However, based on two GLP TAS studies, 1685
despite some limitations in the studies, it has been demonstrated in 10 healthy pigs that doses of 100 1686
mg/kg or higher administered for at least 5 days were well tolerated. 1687
Published literature indicates that amoxicillin is safe in laboratory species at doses well in excess of 1688
those used therapeutically. Hepatotoxicity and renal toxicity may occur rarely. Gastrointestinal 1689
disturbances may occur due to disruption of the microbiota. Amoxicillin is unlikely to cause 1690
reproductive or developmental toxicity. The most common and concerning adverse events are 1691
hypersensitivity reactions – it cannot be concluded if these idiosyncratic reactions would increase in 1692
frequency following an increase to the dose regimen. 1693
Overall it is concluded that the proposed dose of 40 mg amoxicillin/kg bw per day for 5 days 1694
in drinking water is likely to be adequately tolerated in pigs. 1695
7.5.6. Step 6: Further considerations for the conclusion on the safety and 1696
benefit-risk for individual products 1697
Excipients used in different formulations include: 1698
Reflection paper on dose optimisation of established veterinary antibiotics in the context of SPC harmonisation
EMA/CVMP/849775/2017 Page 58/120
Pentasodium triphosphate 1699
Silica Colloidal anhydrous 1700
Trisodium phosphate anhydrous 1701
Na carbonate 1702
Na citrate 1703
Lactose monohydrate – lactose intolerance may be dose-dependent. 1704
Na Glycine carbonate – mildly toxic by ingestion. 1705
Na hexametaphosphate 1706
Mannitol – potential for laxative effect, depending on level of intake. 1707
The above excipients are all commonly used in veterinary medicinal products. It seems unlikely that a 1708
doubling of intake would have implications for target animal safety, but this would be considered on a 1709
product-by-product basis according to the individual composition since some precautions are identified 1710
above. 1711
7.5.7. Step 7: The conclusions above are incorporated into the final 1712
benefit-risk for the dose increase for each individual product 1713
Overall it is concluded that VMPs administered at the proposed dose of 40 mg amoxicillin/kg bw per 1714
day for 5 days in drinking water are likely to be adequately tolerated in pigs for the treatment of the 1715
indication for respiratory disease. 1716
7.6. Overall conclusion and recommendations on amoxicillin 1717
The approaches on dose optimisation, WP, ERA and TAS as described in chapters 3, 4, 5, and 6, 1718
respectively, were tested in the case study on amoxicillin products, orally administered via the drinking 1719
water, for the treatment of respiratory infections in pigs. The most common dose currently authorised 1720
for this indication is 20 mg/kg bw per day for 5 days. 1721
In order to optimise the dose, the following pathogens were considered to be relevant: Actinobacillus 1722
pleuropneumoniae, Bordetella bronchiseptica, Haemophilus parasuis, Pasteurella multocida, and 1723
Streptococcus suis. The optimised dose was determined as 40 mg/kg bw per day. It was noted that, 1724
due to the low susceptibility, it was not possible to establish a dose for B. bronchiseptica, and therefore 1725
pigs infected by this pathogen should not be treated with amoxicillin via the drinking water. 1726
For the establishment of the WP, only a limited number of studies were available for this pilot project. 1727
Since the depletion of residues of amoxicillin after oral administration to pigs is very rapid, most of the 1728
older residue studies confirmed that residues are already below LOD after a few days. However, this 1729
challenge could be overcome, by the use of the hourglass approach. Data and insights from multiple 1730
sources (e.g. FARAD, literature, published thesis’s, registration dossiers) were combined to find the 1731
relevant PK parameters and eventually the terminal half-life of the depletion of residues could be 1732
determined. A “worst-case” and thus rather conservative half-life of 2 days was used for the 1733
extrapolation of WPs, resulting in relatively low increases of the WPs. 1734
For addressing the environmental risks, adequate Phase I and Phase II ERA data were available for the 1735
authorised dose of 20 mg/kg bw per day for 5 days. For the optimised dose, the RQs remained below 1 1736
when the duration is maximally 5 days, and above 1 when the duration is 7 days. It was considered 1737

Reflection paper on dose optimisation of established veterinary antibiotics in the context of SPC harmonisation
EMA/CVMP/849775/2017 Page 59/120
that the duration of 3-5 days may be sufficient for products with the same indication, which would 1738
justify the limitation of the duration to maximally 5 days, in order to limit the exposure to the 1739
environment. Overall, the optimised dose for amoxicillin does not give rise to concerns for the 1740
environment. 1741
In relation to TAS, no specific safety issues were identified after consideration of all provided data from 1742
the registration dossiers and other relevant sources. It was concluded that amoxicillin administered at 1743
the optimised dose is likely to be adequately tolerated in pigs. 1744
8. Case study oxytetracycline 1745
8.1. Introduction 1746
Oxytetracycline (OTC) is a commonly used broad spectrum tetracycline antibiotic in veterinary 1747
medicine. In the EU oxytetracycline is licensed in various formulations (powders, solution for injection, 1748
suspension for spray, premix and tablets), for a variety of animals (food producing and non-food 1749
producing). 1750
This case study will be limited to the solution for injection formulation to be used for respiratory 1751
infections in cattle. 1752
Oxytetracycline is a broad spectrum antibiotic effective against both Gram positive and Gram negative 1753
bacteria with a bacteriostatic effect. OTC binds to 70S and 80S ribosomes blocking the attachment of 1754
aminoacyl-transfer RNA to the ribosomal messenger RNA thereby blocking the ability of bacteria to 1755
produce proteins. This prevents the bacteria from growing and multiplying. 1756
Oxytetracycline is normally available as the dihydrate or hydrochloride salt. 1757
The solution for injection is available in 10% (“short acting”) and 20% (“long acting”) formulations. 1758
The approved doses are: 1759
20% formulations: 20 or 30 mg/kg bw, single injection; in some approved labels: repeated after 1760
48 or 72 hours in severe cases. 1761
10% formulations: between 4 – 20 mg/kg bw per day, daily injection for between 1 and 5 days 1762
Licensed products are indicated for a wide variety of infections primarily septicaemia, respiratory and 1763
gastro-intestinal infections, as well as foot rot, soft tissue infections and furunculosis and enteric 1764
redmouth disease in aquaculture. 1765
This case study will focus on the indication for respiratory disease caused by Pasteurella multocida, 1766
Mannheima haemolytica and Haemophilus somni. 1767
8.2. Dose optimisation 1768
8.2.1. Pharmacokinetics 1769
One of the challenges of the case study for oxytetracycline injectable products is the possibility that 1770
the pharmacokinetics differ between the various formulations. Depending on how much products differ 1771
in their pharmacokinetic profile, there may be a need for a product-by-product PK/PD analysis which 1772
might result in different outcomes for the optimised dose. Therefore, the possible existence of 1773
formulation-specific pharmacokinetics was investigated. 1774

Reflection paper on dose optimisation of established veterinary antibiotics in the context of SPC harmonisation
EMA/CVMP/849775/2017 Page 60/120
First, the composition was considered for a range of products (i.e. the OTC injectables for cattle 1775
authorised in The Netherlands), including 20% (“long acting”; LA) and 10% (“short acting”; SA) 1776
formulations (an overview is given in Annex 5). As it turned out, all formulations have a comparable 1777
composition / similar composition / similar galenics, namely containing water and other solvents, 1778
chelators, complexing agents, preservatives, and substances for adjusting the pH. The organic solvents 1779
and complexing agents in particular, can have the ability to delay / influence the release of the active 1780
ingredient from the site of injection and thus influence the (absorption) pharmacokinetics of the 1781
formulation. These substances were quite similar across formulations. Therefore, it appears that no 1782
major differences in the PK would be expected from the design of the composition of the product. 1783
Indeed, Nouws et al. (1985) tested a range of LA (long acting) and SA (short acting) OTC formulations 1784
in dairy cows and found that the pharmacokinetics were roughly the same. In addition, OTC half-lives 1785
in tissues were similar for LA and SA formulations (see 8.3). 1786
Whereas the compositions of the formulations are similar in terms of the inactive ingredients, it has to 1787
be noted that there is a 2-fold difference in strength between the LA and SA formulations, and that 1788
these products have different patterns of use. Therefore, under field conditions, there will be 1789
differences in the volume and the number of injections, and these differences may influence the 1790
absorption from the injection sites and thus the PK profile. In an unpublished study report provided by 1791
the industry, pharmacokinetic profiles were shown to be different between an LA and SA formulation. 1792
It was considered that the difference in the number of injections given could well explain the difference 1793
in pharmacokinetics. 1794
In view of the above, it was decided to analyse two datasets separately, one representative for an LA 1795
formulation and another one representative for a SA formulation. 1796
In this case study, PK profiles from different sources (Marketing Authorisation Holders) were used for 1797
the computation of a daily dose. The pharmacokinetics for different concentrations of oxytetracycline 1798
formulations (20% and 10%) were determined using old datasets provided by different pharmaceutical 1799
companies for doses ranging from 5 to 20 mg/kg bw administered intramuscularly to calves, young 1800
cattle and cows. The OTC plasma concentrations for different sampling times were analysed using a 1801
non-linear mixed effect model using Monolix® (Lixoft) and simulations of different dosage regimen 1802
were performed in R using mlxR package. The PK model was a mono-compartmental model using an 1803
extravascular administration route. The PK parameters of the two main OTC concentrations present in 1804
the EU market are reported in the following table. 1805
Table 22. Comparison of PK parameters for LA-OTC and SA-OTC for cattle 1806
Parameter Unit 20 % 10 %
Ka pop h-1 0.0303 0.057
V/F_pop L.kg-1 0.263 0.203
Cl_pop L.kg-1.h-1 0.0954 0.13
Omega_Ka h-1 0.252 0.19
Omega_V/F L.kg-1 0.265 0.342
Omega_Cl L.kg-1.h-1 0.269 0.332
1807
The next figure is the graph of observed data and percentiles of distribution of the Population PK model 1808
with the 90th percentiles for the two tested formulations. 1809
1810

Reflection paper on dose optimisation of established veterinary antibiotics in the context of SPC harmonisation
EMA/CVMP/849775/2017 Page 61/120
Formulation 20% – 20 mg/kg bw
Formulation 10% - 20 mg/kg bw single or 2x/48h
1811
Figure 22. Representation of the distribution of plasmatic concentration in function of time obtained 1812
by population PK model for a long acting formulation dose (20 mg/kg bw) and a short acting 1813
formulation dose (11 mg/kg bw) 1814
8.2.2. Target bacteria 1815
The therapeutic indication is the bovine respiratory disease. The targeted pathogens are 1816
Pasteurella multocida 1817
Mannheima haemolytica 1818
Haemophilus somni 1819
1820
Table 23. Merged tetracycline MIC distribution frequencies of bovine respiratory target pathogens 1821
isolates (De Jong et al., 2014; El Garch et al., 2016). 1822
MIC (µg/mL) 0.12 0.25 0.5 1 2 4 8 16 32 64 128
P. multocida (n=239) 3 20 143 24 27 1 5 7 9
M. haemolytica (n=231) 4 65 129 2 3 6 7 13 1 1
H. somni (n=66) 2 33 27 1 1 2
*ECOFF values are determined using the tool ECOFFinder to calculate the 99.9th percentile of ECOFF (Turnidge et 1823 al., 2006). In the context of this pilot project, all the criteria requested by EUCAST may not be fulfilled to use this 1824 tools with confidence, however in order to follow the methodology define in the section 3.3, the ECOFF of the 1825 different target pathogens were calculated. ECOFF value is 1 µg/mL for P. multocida and 2 µg/mL for M. 1826 haemolytica. For H. somni an ECOFF of 1 µg/mL is calculated but the minimal number of strains is not reached and 1827 the value is given only as an example in the context of this pilot project. 1828
8.2.3. PK/PD index 1829
The recommended PDI for tetracyclines is the AUC/MIC as they are time dependent antibiotics acting 1830
on the ribosome with a post antibiotic effect (Barbour et al., 2010). Contrary to the amoxicillin case 1831
study, there is no need to investigate other PDI for OTC. 1832

Reflection paper on dose optimisation of established veterinary antibiotics in the context of SPC harmonisation
EMA/CVMP/849775/2017 Page 62/120
8.2.4. Target value for the PDI (PDT) 1833
Studies on the pharmacodynamic activity of oxytetracycline are limited. One PK/PD integration study 1834
reported the AUC24h/MIC ratios required for four levels of inhibition for a strain of M. haemolytica 1835
(Brentnall et al., 2013) MIC was determined in cation adjusted Mueller Hinton Broth (CAMHB) and 1836
three calf fluids (serum, exudate, transudate). Bacterial time-kill curves were established in vitro in the 1837
same matrices. The MICs of the tested strain were 0.8, 14.8, 12.8, and 11.2 in CMHB, serum, exudate, 1838
and transudate, respectively. The authors proposed different AUC24h/MIC ratios for bacteriostatic 1839
action, 50% reduction in count, bactericidal action and bactericidal eradication. For this pilot study, we 1840
used two PDT values (bacteriostatic action = 42, bactericidal action = 59) determined for CAMHB. The 1841
PDT is based on in vitro data and is not validated on clinical efficacy basis. 1842
8.2.5. Model of the relationship between dose and PDI target attainment 1843
Based on the PK profile of the two tested formulation and the defined PD parameters, the Monte Carlo 1844
Simulation was performed with SimulX implement in R with the package mxlR using 5000 random 1845
values. 1846
Seven different dosage regimens were tested for each formulation (20 % vs 10 %): 1847
4 x IM administration of 10 mg/kg bw 1848
1 x IM administration of 20 mg/kg bw 1849
1 x IM administration of 30 mg/kg bw 1850
1 x IM administration of 80 mg/kg bw 1851
2 x IM administrations of 20 mg/kg bw at a 48 h interval 1852
2 x IM administrations of 30 mg/kg bw at a 48 h interval 1853
2 x IM administrations of 20 mg/kg bw at a 36 h interval 1854
The probability of target attainment for the bacteriostatic and bactericidal activities is estimated for the 1855
different interval period between 0-24 h, 24-48 h, 48-72 h and 72-96 h. The results of the modelling 1856
are provided in Table 24 and Table 25. 1857
1858
Table 24. Probability of target attainment (PTA) in function of AUC/MIC according the dosage regimen 1859
of a 20% formulation for the three bacterial species. Values underlined in grey are below the objective of 90 1860
% for the PTA. 1861
Interval P. multocida M. haemolytica H. somni
Target (bacteriostatic = 42 / bactericidal = 59)
42 59 42 59 42 59
4 doses of 10 mg/kg/24 h 0-24 h
95,9% 90,7% 80,0% 52,1% 99,9% 100,0%
24-48 h 99,8% 97,9% 98,9% 89,0% 100,0% 100,0%
48-72 h 100,0% 99,3% 99,8% 96,4% 100,0% 100,0%
72-96 h 100,0% 99,6% 99,9% 98,1% 100,0% 100,0%
Single dose 20 mg/kg 0-24 h
100,0% 99,4% 99,8% 97,0% 100,0% 100,0%

Reflection paper on dose optimisation of established veterinary antibiotics in the context of SPC harmonisation
EMA/CVMP/849775/2017 Page 63/120
Interval P. multocida M. haemolytica H. somni
24-48 h 97,8% 91,4% 88,9% 61,5% 100,0% 99,3%
48-72 h 69,9% 40,8% 32,8% 15,2% 88,8% 70,2%
72-96 h 18,5% 7,2% 5,8% 1,5% 44,8% 25,0%
Single dose 30 mg/kg 0-24 h
100,0% 100,0% 100,0% 99,9% 100,0% 100,0%
24-48 h 99,9% 98,5% 99,4% 92,4% 100,0% 100,0%
48-72 h 89,6% 74,0% 62,7% 36,6% 97,9% 91,1%
72-96 h 44,7% 21,8% 18,2% 7,1% 69,1% 48,8%
Single dose 80 mg/kg 0-24 h
100,0% 100,0% 100,0% 100,0% 100,0% 100,0%
24-48 h 100,0% 100,0% 100,0% 100,0% 100,0% 100,0%
48-72 h 99,9% 99,2% 99,4% 96,1% 100,0% 100,0%
72-96 h 92,0% 81,5% 77,3% 55,9% 97,5% 93,0%
2 doses of 20 mg/kg at 48 h 0-24 h
100,0% 99,4% 99,8% 97,0% 100,0% 100,0%
24-48 h 97,8% 91,4% 88,9% 61,5% 100,0% 99,3%
48-72 h 100,0% 100,0% 100,0% 99,8% 100,0% 100,0%
72-96 h 99,3% 95,9% 96,6% 80,3% 100,0% 99,9%
2 doses of 30 mg/kg at 48 h 0-24 h
100,0% 100,0% 100,0% 99,9% 100,0% 100,0%
24-48 h 99,9% 98,5% 99,4% 92,4% 100,0% 100,0%
48-72 h 100,0% 100,0% 100,0% 100,0% 100,0% 100,0%
72-96 h 100,0% 99,6% 99,9% 97,9% 100,0% 100,0%
2 doses of 20 mg/kg at 36 h 0-24 h
100,0% 99,4% 99,8% 97,0% 100,0% 100,0%
24-48 h 100,0% 99,8% 100,0% 98,9% 100,0% 100,0%
48-72 h 100,0% 99,8% 100,0% 98,8% 100,0% 100,0%
72-96 h 96,0% 87,2% 81,9% 55,0% 99,7% 97,4%
1862
1863
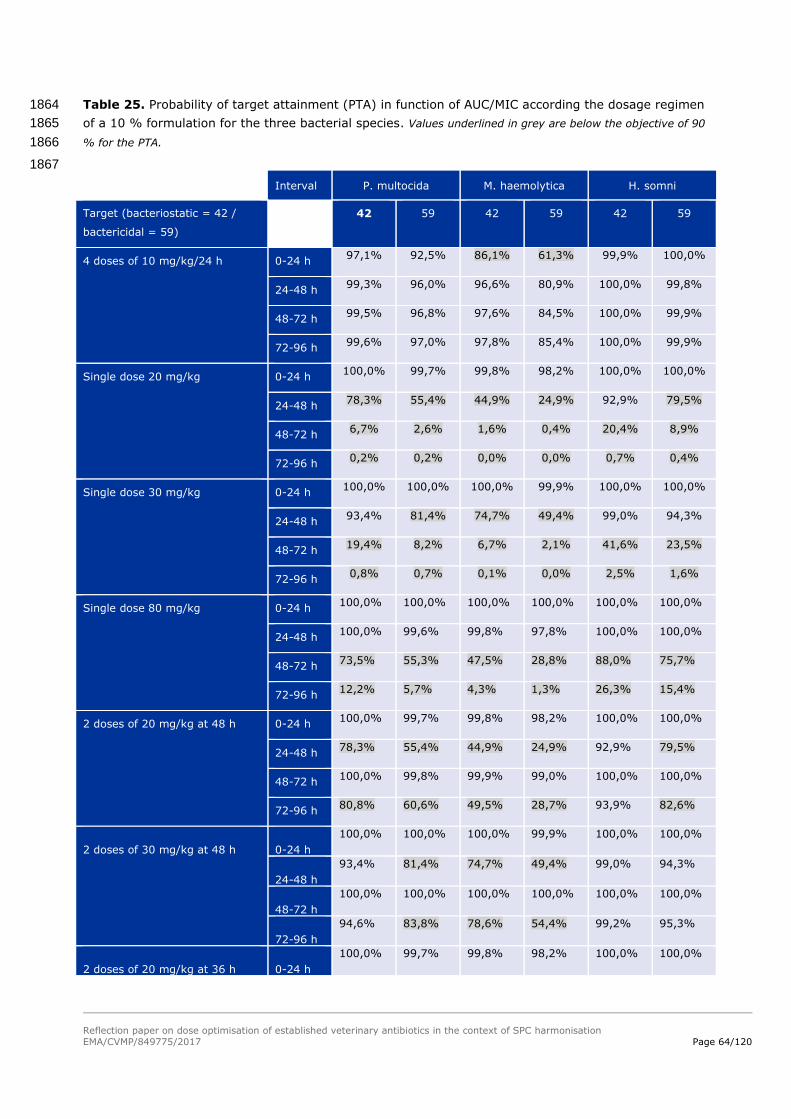
Reflection paper on dose optimisation of established veterinary antibiotics in the context of SPC harmonisation
EMA/CVMP/849775/2017 Page 64/120
Table 25. Probability of target attainment (PTA) in function of AUC/MIC according the dosage regimen 1864
of a 10 % formulation for the three bacterial species. Values underlined in grey are below the objective of 90 1865
% for the PTA. 1866
1867
Interval P. multocida M. haemolytica H. somni
Target (bacteriostatic = 42 /
bactericidal = 59)
42 59 42 59 42 59
4 doses of 10 mg/kg/24 h 0-24 h 97,1% 92,5% 86,1% 61,3% 99,9% 100,0%
24-48 h 99,3% 96,0% 96,6% 80,9% 100,0% 99,8%
48-72 h 99,5% 96,8% 97,6% 84,5% 100,0% 99,9%
72-96 h 99,6% 97,0% 97,8% 85,4% 100,0% 99,9%
Single dose 20 mg/kg 0-24 h 100,0% 99,7% 99,8% 98,2% 100,0% 100,0%
24-48 h 78,3% 55,4% 44,9% 24,9% 92,9% 79,5%
48-72 h 6,7% 2,6% 1,6% 0,4% 20,4% 8,9%
72-96 h 0,2% 0,2% 0,0% 0,0% 0,7% 0,4%
Single dose 30 mg/kg 0-24 h 100,0% 100,0% 100,0% 99,9% 100,0% 100,0%
24-48 h 93,4% 81,4% 74,7% 49,4% 99,0% 94,3%
48-72 h 19,4% 8,2% 6,7% 2,1% 41,6% 23,5%
72-96 h 0,8% 0,7% 0,1% 0,0% 2,5% 1,6%
Single dose 80 mg/kg 0-24 h 100,0% 100,0% 100,0% 100,0% 100,0% 100,0%
24-48 h 100,0% 99,6% 99,8% 97,8% 100,0% 100,0%
48-72 h 73,5% 55,3% 47,5% 28,8% 88,0% 75,7%
72-96 h 12,2% 5,7% 4,3% 1,3% 26,3% 15,4%
2 doses of 20 mg/kg at 48 h 0-24 h 100,0% 99,7% 99,8% 98,2% 100,0% 100,0%
24-48 h 78,3% 55,4% 44,9% 24,9% 92,9% 79,5%
48-72 h 100,0% 99,8% 99,9% 99,0% 100,0% 100,0%
72-96 h 80,8% 60,6% 49,5% 28,7% 93,9% 82,6%
2 doses of 30 mg/kg at 48 h 0-24 h
100,0% 100,0% 100,0% 99,9% 100,0% 100,0%
24-48 h
93,4% 81,4% 74,7% 49,4% 99,0% 94,3%
48-72 h
100,0% 100,0% 100,0% 100,0% 100,0% 100,0%
72-96 h
94,6% 83,8% 78,6% 54,4% 99,2% 95,3%
2 doses of 20 mg/kg at 36 h 0-24 h
100,0% 99,7% 99,8% 98,2% 100,0% 100,0%
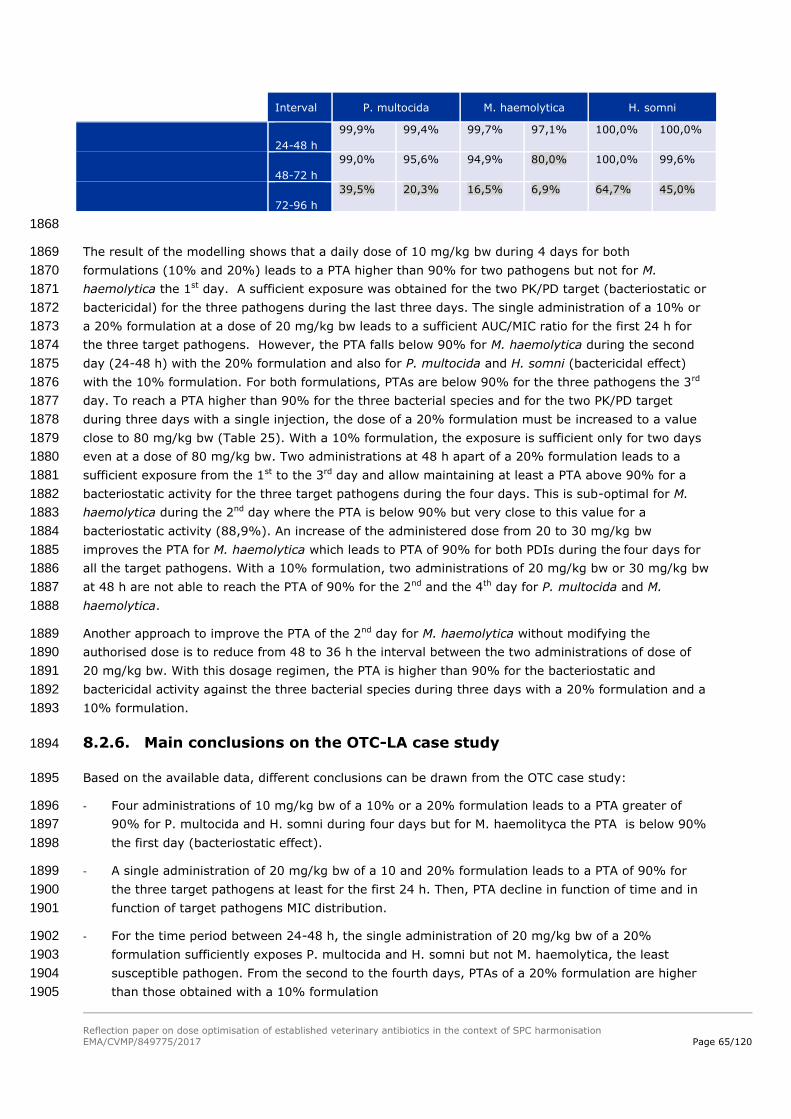
Reflection paper on dose optimisation of established veterinary antibiotics in the context of SPC harmonisation
EMA/CVMP/849775/2017 Page 65/120
Interval P. multocida M. haemolytica H. somni
24-48 h
99,9% 99,4% 99,7% 97,1% 100,0% 100,0%
48-72 h
99,0% 95,6% 94,9% 80,0% 100,0% 99,6%
72-96 h
39,5% 20,3% 16,5% 6,9% 64,7% 45,0%
1868
The result of the modelling shows that a daily dose of 10 mg/kg bw during 4 days for both 1869
formulations (10% and 20%) leads to a PTA higher than 90% for two pathogens but not for M. 1870
haemolytica the 1st day. A sufficient exposure was obtained for the two PK/PD target (bacteriostatic or 1871
bactericidal) for the three pathogens during the last three days. The single administration of a 10% or 1872
a 20% formulation at a dose of 20 mg/kg bw leads to a sufficient AUC/MIC ratio for the first 24 h for 1873
the three target pathogens. However, the PTA falls below 90% for M. haemolytica during the second 1874
day (24-48 h) with the 20% formulation and also for P. multocida and H. somni (bactericidal effect) 1875
with the 10% formulation. For both formulations, PTAs are below 90% for the three pathogens the 3rd 1876
day. To reach a PTA higher than 90% for the three bacterial species and for the two PK/PD target 1877
during three days with a single injection, the dose of a 20% formulation must be increased to a value 1878
close to 80 mg/kg bw (Table 25). With a 10% formulation, the exposure is sufficient only for two days 1879
even at a dose of 80 mg/kg bw. Two administrations at 48 h apart of a 20% formulation leads to a 1880
sufficient exposure from the 1st to the 3rd day and allow maintaining at least a PTA above 90% for a 1881
bacteriostatic activity for the three target pathogens during the four days. This is sub-optimal for M. 1882
haemolytica during the 2nd day where the PTA is below 90% but very close to this value for a 1883
bacteriostatic activity (88,9%). An increase of the administered dose from 20 to 30 mg/kg bw 1884
improves the PTA for M. haemolytica which leads to PTA of 90% for both PDIs during the four days for 1885
all the target pathogens. With a 10% formulation, two administrations of 20 mg/kg bw or 30 mg/kg bw 1886
at 48 h are not able to reach the PTA of 90% for the 2nd and the 4th day for P. multocida and M. 1887
haemolytica. 1888
Another approach to improve the PTA of the 2nd day for M. haemolytica without modifying the 1889
authorised dose is to reduce from 48 to 36 h the interval between the two administrations of dose of 1890
20 mg/kg bw. With this dosage regimen, the PTA is higher than 90% for the bacteriostatic and 1891
bactericidal activity against the three bacterial species during three days with a 20% formulation and a 1892
10% formulation. 1893
8.2.6. Main conclusions on the OTC-LA case study 1894
Based on the available data, different conclusions can be drawn from the OTC case study: 1895
- Four administrations of 10 mg/kg bw of a 10% or a 20% formulation leads to a PTA greater of 1896
90% for P. multocida and H. somni during four days but for M. haemolityca the PTA is below 90% 1897
the first day (bacteriostatic effect). 1898
- A single administration of 20 mg/kg bw of a 10 and 20% formulation leads to a PTA of 90% for 1899
the three target pathogens at least for the first 24 h. Then, PTA decline in function of time and in 1900
function of target pathogens MIC distribution. 1901
- For the time period between 24-48 h, the single administration of 20 mg/kg bw of a 20% 1902
formulation sufficiently exposes P. multocida and H. somni but not M. haemolytica, the least 1903
susceptible pathogen. From the second to the fourth days, PTAs of a 20% formulation are higher 1904
than those obtained with a 10% formulation 1905

Reflection paper on dose optimisation of established veterinary antibiotics in the context of SPC harmonisation
EMA/CVMP/849775/2017 Page 66/120
- After 48 h, the single administration of 20 mg/kg bw of 20% formulation leads to a PTA below 1906
90% for all the target pathogens which justifies the second administration. 1907
- According the PK/PD modelling, PTA can be improved by increasing the administrated dose of a 1908
formulation or by repeating the administration with a shorter time interval. 1909
By defining an optimal frequency of administration (48 h versus 36 h), PTA can also be improved, 1910
especially in this case study for M. haemolytica. For this target pathogen, using an administration of 20 1911
mg/kg bw 36 h apart of a 20% formulation, the PTA is above 90% for 3 days. 1912
8.2.7. Set a PK/PD breakpoint 1913
As for the amoxicillin case study, the next step of the proposed approach to address doses is the 1914
definition of clinical breakpoint, or PK/PD breakpoints when lacking clinical data (cf. chapter 3.3 – step 1915
7). According to the data available for oxytetracycline, in our example, the PK/PD breakpoint can be 1916
set at 2 µg/mL. It is compatible with values of ECOFF of bacterial species targeted. Mannheima 1917
haemolytica has the highest ECOFF and is the less susceptible species. 1918
8.2.8. Define an optimal daily dose 1919
For the oxytetracycline case study, it was decided to analyse two datasets separately, one 1920
representative for a LA formulation (20% formulation) and another one representative for a SA 1921
formulation (10% formulation). According to the chapter 8.3 of this report, no or slight differences 1922
where identified between SA and LA formulation regarding PK profiles. However, the 2-fold difference 1923
in strength between the LA and SA formulations will have an impact on in the volume and the number 1924
of injections, and these differences may influence the absorption from the injection sites and thus the 1925
PK profile. Then this difference in the rate of absorption could influence the daily dose defined by a 1926
PK/PD approach. 1927
= For the SA – 10% formulation, according to the PK/PD modelling with the provided data, the 1928
dose of 10 mg/kg bw administered each 24h allows reaching a PTA of 90% for bacteriostatic 1929
activity for all the target pathogens, except during the first 24h for M. haemolytica where the 1930
PTA is close to this target value (86.1%). 1931
It can then be concluded that, for the SA – 10% formulation, there is no need to 1932
increase the daily dose and that the dosage regimen 10 mg/kg bw each 24h provided 1933
a sufficient exposure for all the target pathogens tested. 1934
= For the LA - 20% formulation, the modelling showed that the exposure is sufficient to reach 1935
the PTA target value only for the two periods 0-24h and 24-48h. According to the SPC of 1936
approved product, the dosage regime of the LA formulation is a single injection with repetition 1937
after 48 or 72 hours in severe cases. Thus, it can be concluded that the current dose of 20 1938
mg/kg bw reach the PTA of 90% only for the two first days. Then, to improve the PTA for the 1939
next days, a second injection should be realised 48h apart or ideally 36h apart for the least 1940
susceptible pathogens and not 72h as suggested. Based on the PK/PD modelling, to reach a 1941
PTA of 90% up to 72h with a single injection, the daily dose should be increased to 80 mg/kg 1942
bw. However, another approach to improve the PTA is to further refine the interval between 1943

Reflection paper on dose optimisation of established veterinary antibiotics in the context of SPC harmonisation
EMA/CVMP/849775/2017 Page 67/120
the two administrations. Indeed, with the approved dose of 20 mg/kg bw, the PTA is higher 1944
than 90% for the bacteriostatic and bactericidal activity against the three bacterial species 1945
during three days with a 20% and a 10% formulation when a second injection is administered 1946
48h or 36h respectively. However, in field conditions, the 20% formulation is more adapted 1947
than the 10% formulation due to the limitation of the volume that needs to be injected. 1948
According to the PK/PD modelling and the rational principles of use of antibiotics, it is not 1949
necessary to increase the dose of the LA formulation (up to 80 mg/kg bw) to artificially 1950
increase the duration of activity and rather refine the interval frequency of administration. 1951
It can then be concluded that, for the LA – 20% formulation, there is no need to 1952
increase the daily dose but further refine the interval between two injection and that 1953
the dosage regimen of 20 mg/kg bw with a second injection between 36 to 48h 1954
provided a sufficient exposure for all the target pathogens tested. 1955
8.3. Withdrawal period 1956
8.3.1. Introduction 1957
After systernic absorption, oxytetracycline (OTC) distributes rapidly into the extracellular spaces of 1958
animal tissues. It also can cross the placental and the blood-brain barriers. OTC undergoes little or no 1959
metabolic degradation in cattle, and is eliminated mainly unchanged in the urine. Tubular secretion and 1960
passive reabsorption mechanisms are reported to be the mechanisms involved (Mevius et al., 1986). 1961
In bovine some (2-10%) epimerisation of OTC into 4-epi-OTC takes place. The marker residue used for 1962
determination of the withdrawal periods is defined as the sum of both compounds. 1963
After parenteral administration the WP determining tissue is known to be the site of injection 1964
Different OTC injectable formulations are authorised in the EU. For example, in the Netherlands there 1965
are some 25 OTC injectables authorised for use in bovine. A number of their particulars are listed in 1966
Table 26. 1967
Table 26 shows that there is hardly a correlation present between withdrawal periods (WPs) for tissues 1968
and offal and the dose of OTC administered. 1969
Possible explanations: 1970
1. The WP for tissues is determined by the depletion rate of residues of OTC from the site of 1971
injection. The amount of OTC deposited per injection site is more or less comparable for the 1972
various products. 1973
2. Relatively large safety factors have been applied (to account for inadequacies in the (older) 1974
residue studies), masking a possible effect between dose and WP. 1975
3. Inadequate sampling of the injection site leading to unspecific spreading of the WPs 1976
4. Influence of injection site location on residual OTC concentrations on the site of injection. 1977
Since the residues on the injection site determine the WP for tissues, increasing the dose (within 1978
limits) by simply increasing the number of injections would have no effect on the WP for tissues. It 1979
should however be noted that the animal welfare situation should be considered, when applying this 1980
method. It could be argued that, in field conditions, 2-3 injections per animal/dosing would be a 1981
maximum. 1982
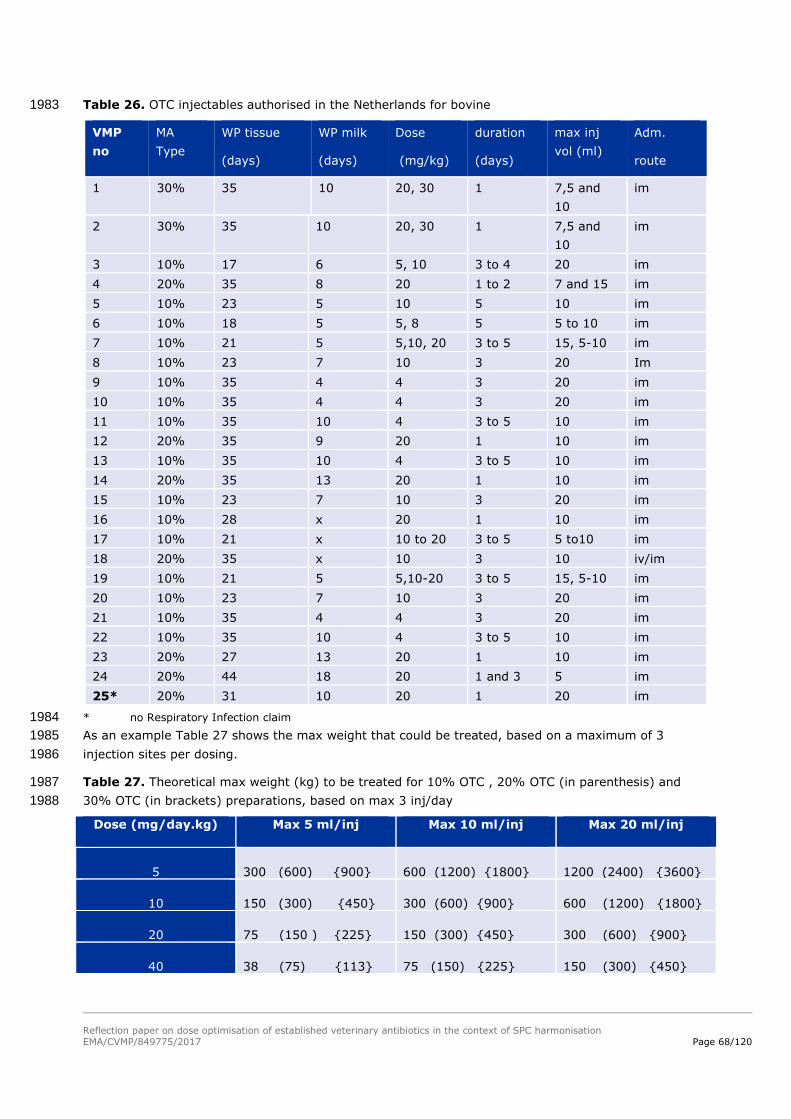
Reflection paper on dose optimisation of established veterinary antibiotics in the context of SPC harmonisation
EMA/CVMP/849775/2017 Page 68/120
Table 26. OTC injectables authorised in the Netherlands for bovine 1983
VMP
no
MA
Type
WP tissue
(days)
WP milk
(days)
Dose
(mg/kg)
duration
(days)
max inj
vol (ml)
Adm.
route
1 30% 35 10 20, 30 1 7,5 and
10
im
2 30% 35 10 20, 30 1 7,5 and
10
im
3 10% 17 6 5, 10 3 to 4 20 im
4 20% 35 8 20 1 to 2 7 and 15 im
5 10% 23 5 10 5 10 im
6 10% 18 5 5, 8 5 5 to 10 im
7 10% 21 5 5,10, 20 3 to 5 15, 5-10 im
8 10% 23 7 10 3 20 Im
9 10% 35 4 4 3 20 im
10 10% 35 4 4 3 20 im
11 10% 35 10 4 3 to 5 10 im
12 20% 35 9 20 1 10 im
13 10% 35 10 4 3 to 5 10 im
14 20% 35 13 20 1 10 im
15 10% 23 7 10 3 20 im
16 10% 28 x 20 1 10 im
17 10% 21 x 10 to 20 3 to 5 5 to10 im
18 20% 35 x 10 3 10 iv/im
19 10% 21 5 5,10-20 3 to 5 15, 5-10 im
20 10% 23 7 10 3 20 im
21 10% 35 4 4 3 20 im
22 10% 35 10 4 3 to 5 10 im
23 20% 27 13 20 1 10 im
24 20% 44 18 20 1 and 3 5 im
25* 20% 31 10 20 1 20 im
* no Respiratory Infection claim 1984
As an example Table 27 shows the max weight that could be treated, based on a maximum of 3 1985
injection sites per dosing. 1986
Table 27. Theoretical max weight (kg) to be treated for 10% OTC , 20% OTC (in parenthesis) and 1987
30% OTC (in brackets) preparations, based on max 3 inj/day 1988
Dose (mg/day.kg) Max 5 ml/inj Max 10 ml/inj Max 20 ml/inj
5 300 (600) 900 600 (1200) 1800 1200 (2400) 3600
10 150 (300) 450 300 (600) 900 600 (1200) 1800
20 75 (150 ) 225 150 (300) 450 300 (600) 900
40 38 (75) 113 75 (150) 225 150 (300) 450

Reflection paper on dose optimisation of established veterinary antibiotics in the context of SPC harmonisation
EMA/CVMP/849775/2017 Page 69/120
8.3.2. Plasma kinetics 1989
In most of the studies reported in public literature (e.g. Nouws et al., 1985, Mevius et al., 1986, 1990
Toutain & Raynaud, 1983) the plasma curve of OTC was followed only for the first 72-120 hours. 1991
Meijer et al. (1993) however, using a sensitive method of analysis, followed the plasma levels of OTC 1992
over approximately 300 hours, after an i.v. dose of 40 mg/kg bw and an i.m. dose of 20 mg/kg bw. 1993
The study revealed a slow terminal elimination phase with a half-life of approximately 95 hours (see 1994
figures and tables below). The authors concluded that, since this phase was present after i.v. as well 1995
as after i.m. administration, it could not be caused by a prolonged absorption from the site of injection. 1996
1997
Figure 23. Measured concentration (mean ± SD) and mean fitted plasma-concentration time curve for 1998
oxytetracycline after single i.v. administration of 40 mg/kg bw to veal calves (n=5); based on Meijer et 1999
al., 1993 2000
2001
Figure 24. Measured concentration (mean ± SD) and mean plasma-concentration time curve for 2002
oxytetracycline after single i.m. administration of 20 mg/kg bw to veal calves (n=5); based on Meijer 2003
et al., 1993 2004

Reflection paper on dose optimisation of established veterinary antibiotics in the context of SPC harmonisation
EMA/CVMP/849775/2017 Page 70/120
Table 28. Individual pharmacokinetic parameters for oxytetracycline after single i.v. administration of 2005
40 mg/kg bw to veal calves (n=5, SD = Standard Deviation) 2006
Calf
86 88 90 92 93 Mean SD
Dose (mg/kg) 39.88 39.92 39.90 39.90 39.90 39.90 0.01
AUC (µg*h/l) 331.36 301.91 247.67 326.01 289.44 299.28 30.04
Cl (ml/h*kg) 120.35 132.22 161.10 122.39 137.85 134.78 14.63
Vd(area)(ml/kg) 17125.48 11072.16 24513.92 21136.37 16872.50 18144.09 4520.96
A (µg/ml) 128.08 100.76 37.09 155.05 135.69 111.33 41.01
T1/2α(h) 0.19 0.16 0.11 0.18 0.16 0.16 0.03
B (µg/ml) 27.51 20.05 13.01 26.27 25.59 22.49 5.38
t1/2β (h) 6.46 7.64 10.44 6.19 5.95 7.34 1.66
C(µg/ml) 0.23 0.64 0.26 0.26 0.28 0.33 0.15
T1/2 (h) 98.61 58.03 105.45 119.68 84.82 93.32 20.92
2007
Table 29. Individual pharmacokinetic parameters for oxytetracycline after single i.v. administration of 2008
20 mg/kg bw to veal calves (n=5, SD = Standard Deviation) 2009
Calf
86 88 90 92 93 Mean SD
Dose (mg/kg) 19.95 19.95 19.95 19.91 19.97 19.95 0.02
Cmax (µg/ml) 5.56 6.61 5.09 5.71 6.64 5.92 0.61
tmax (h) 5.47 5.47 7.43 5.50 7.45 6.26 0.96
AUC (µg*h/ml) 157.98 150.58 142.89 150.23 163.89 153.11 7.20
Cl (ml/(h*kg) 126.28 132.49 139.62 132.53 121.85 130.55 6.06
Vd(area)(ml/kg) 23512.47 24251.18 17076.50 14149.93 13716.48 18541.31 4517.16
A (µg/ml) 11.04 10.89 9.29 13.94 15.51 12.13 2.26
T1/2α(h) 9.88 8.85 10.18 8.86 8.64 9.28 0.62
B (µg/ml) 0.17 0.16 0.29 0.23 0.17 0.20 0.05
t1/2β (h) 129.03 126.85 84.76 73.99 78.01 98.53 24.27
T1/2abc (h) 1.96 1.12 2.29 2.51 1.43 1.86 0.52
F (%) 95.31 99.80 115.38 92.35 113.13 103.19 9.37
2010
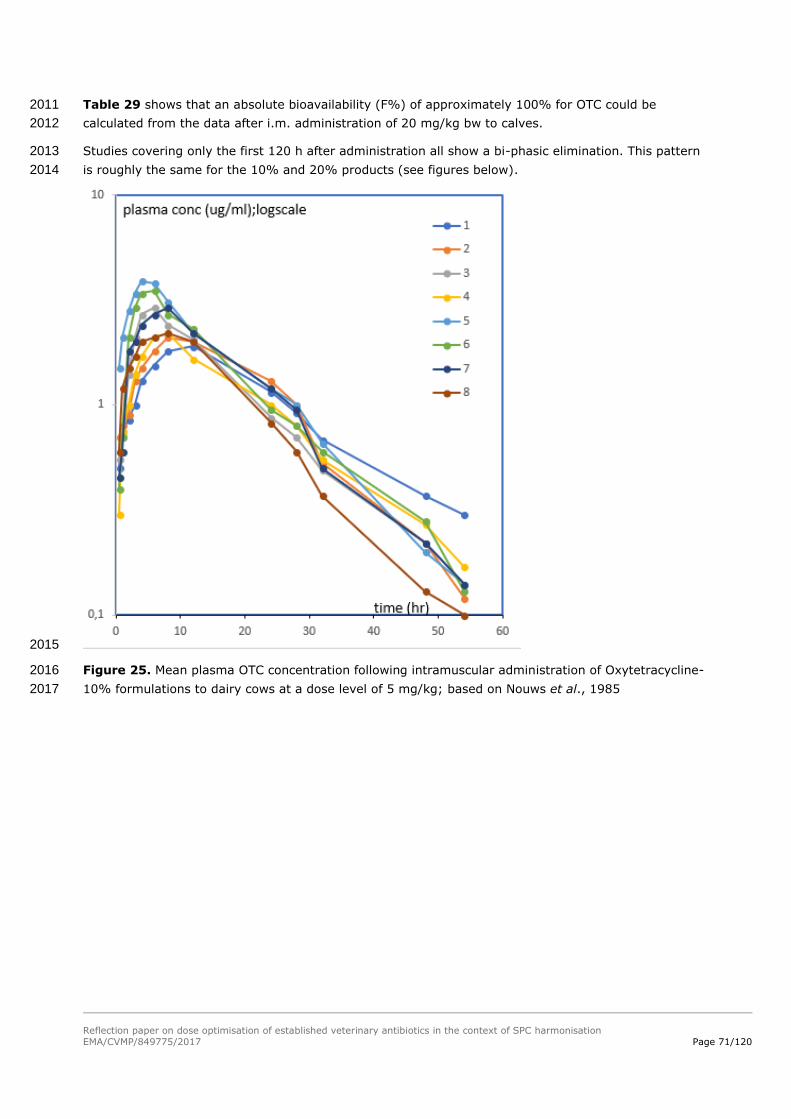
Reflection paper on dose optimisation of established veterinary antibiotics in the context of SPC harmonisation
EMA/CVMP/849775/2017 Page 71/120
Table 29 shows that an absolute bioavailability (F%) of approximately 100% for OTC could be 2011
calculated from the data after i.m. administration of 20 mg/kg bw to calves. 2012
Studies covering only the first 120 h after administration all show a bi-phasic elimination. This pattern 2013
is roughly the same for the 10% and 20% products (see figures below). 2014
2015
Figure 25. Mean plasma OTC concentration following intramuscular administration of Oxytetracycline-2016
10% formulations to dairy cows at a dose level of 5 mg/kg; based on Nouws et al., 1985 2017

Reflection paper on dose optimisation of established veterinary antibiotics in the context of SPC harmonisation
EMA/CVMP/849775/2017 Page 72/120
2018
Figure 26. Mean plasma OTC concentrations following intramuscular administrations of five 2019
Oxytetracycline-20% formulations to dairy cows at a dose level of approximately 11 mg/kg bw; based 2020
on Nouws et al., 1985 2021
For the eight 10% formulations (i.m.) in Figure 25 the T1/2 of first the elimination phase was 9-14 h 2022
during the first 60 h period (Nouws et al., 1985). 2023

Reflection paper on dose optimisation of established veterinary antibiotics in the context of SPC harmonisation
EMA/CVMP/849775/2017 Page 73/120
For the five 20% formulations (i.m.) in 2024
2025
Figure 26 the T1/2 of first elimination phase was 9–12 h when using data points <48 h. When the 2026
plasma concentrations were followed over a longer period of time (up to 120 h), a second phase could 2027
be detected (T1/2= 25-44 h). It was noted that this phase probably was the result of the change-over 2028
situation from the first elimination phase to the final phase of 5-6 days (see Figure 24). 2029
8.3.3. Intramuscular vs Subcutaneous administration 2030
Studies (Clarke et al., 1999; study with product 20) comparing i.m. versus s.c. administration (see 2031
Figure 27 and Figure 28) show that the plasma kinetics for both routes of administration are highly 2032
comparable. 2033

Reflection paper on dose optimisation of established veterinary antibiotics in the context of SPC harmonisation
EMA/CVMP/849775/2017 Page 74/120
2034
2035
Figure 27. Serum concentrations of oxytetracycline after subcutaneous (s.c.) or intramuscular (i.m.) 2036
administration (20 mg/kg bw) of BioMycin 200 (BIO) or OXY shot LA (OXY) formulations to cattle. Data 2037
represent mean concentrations ± SD; based on Clarcke et al., 1990. 2038
2039
2040
Figure 28. Plasma kinetics after s.c. (solid line) and i.m. (dashed line) administration of a 10% 2041
product to calves (study product 20) at a dose of 20 mg/kg bw 2042

Reflection paper on dose optimisation of established veterinary antibiotics in the context of SPC harmonisation
EMA/CVMP/849775/2017 Page 75/120
8.3.4. Dose linearity 2043
One of the limiting conditions for using the extrapolation method is that linear kinetics must apply. 2044
OTC is mainly excreted via the urine. Since the renal clearance shows signs of an active transport 2045
mechanism (tubular secretion) (Mevius et al., 1986) that potentially could lead to non-linear kinetical 2046
behaviour at higher plasma concentrations, the influence of the dose on the total body clearance had 2047
to be investigated (See Table 30). 2048
Table 30. Listing of calculated total body clearances for OTC in the various studies 2049
Dose (mg/kg)
administration CL (ml/kg.hr)
Bovine Mean bw (kg)
reference
40 Iv 135* calve 105 Meijer et al.,
1993
20 Im 130* calve 105 Meijer et al., 1993
20 Iv 66 cattle 212-275 Toutain & Raynaud, 1983
20 Im 78 calve 372-420 Achenbach, 2000
20 Im 83 calve 372-420 Achenbach, 2000
20 Sc 90 calve 372-420 Achenbach,
2000
20 Sc 86 calve 372-420 Achenbach, 2000
5 Iv 43 cow 474-733 Nouws et al.,
1985
5 Iv 76 cow 415-665 Mevius et al., 1986
11 Im 103* calve 203-234 FARAD, 1997b
11 Sc 102* calve 203-234 FARAD, 1997b
20 Im 77 steer 295-377 Clarke et al.,
1999
20 Im 79 steer 295-377 Clarke et al., 1999
20 Sc 84 steer 295-377 Clarke et al.,
1999
20 Sc 87 steer 295-377 Clarke et al., 1999
* From literature (Nouws et al., 1983) it is known that the total body clearance in young calves is significantly 2050 higher than in older animals. 2051
It seems that the total body clearance is relatively constant and independent of dose and route of 2052
administration (mean clearance = 88 ± 23 ml/kg.hr). 2053
It is concluded that the assumption of linear kinetic behaviour appears to be justified, under the 2054
condition that the dose would be moderately (e.g. factor 2-4) increased. 2055
2056

Reflection paper on dose optimisation of established veterinary antibiotics in the context of SPC harmonisation
EMA/CVMP/849775/2017 Page 76/120
8.3.5. Maximum Residue Limits 2057
The following EU MRLs were established for the marker residue oxytetracycline and its 4-epimer: 2058
- Muscle : 100 µg/kg 2059
- Liver: 300 µg/kg 2060
- Kidney: 600 µg/kg 2061
- Milk: 100 µg/kg 2062
8.3.6. Residues in tissues 2063
After first absorption the terminal depletion of residues in tissues runs parallel to the plasma curve. 2064
The highest concentrations of residues (apart from injection site) are found in kidney and liver. 2065
As an example the figure below shows the depletion curves as measured in the residue study of 2066
Product B. Only data points t>5 days are taken into account. 2067
2068
Figure 29. Residue depletion in cattle tissue following the last of 5 i.m. administrations with a 10% 2069
OTC injectable formulation at a dose of 10 mg/kg bw per day 2070
Table 31 shows the estimated terminal T1/2 values in the tissues from the analysed studies. 2071
Table 31. Estimated T1/2 values in the various tissues after administration of OTC for a number of 2072
products. 2073
Product type Adm Total dose (mg/kg)
tissue T1/2 (days) reference
10% i.m. 50 (5x10) liver 10.5 Product B
kidney 7.9
muscle 7.3
fat 7.7
20% i.m. 20 (once) liver 4.5 Product A
kidney 3.9
muscle 4.0

Reflection paper on dose optimisation of established veterinary antibiotics in the context of SPC harmonisation
EMA/CVMP/849775/2017 Page 77/120
Product type Adm Total dose (mg/kg)
tissue T1/2 (days) reference
fat 3.1
20% s.c 20 (once) kidney 5.4 Achenbach, 2000 liver 6.0
20% s.c. 20 (once) kidney 6.9 FARAD, 1997a
liver 6.9
muscle 10.9
20% s.c. 20 (once) liver 4.2 FARAD, 1999
kidney 3.6
20% i.m. 36 (18 on day 1 and 3)
kidney 5.5 Study 4
muscle 4.6
fat 3.5
A mean tissue half-life of 5.9 ± 2.3 days could be calculated. 2074
So if the withdrawal period for tissues would be determined by the depletion of OTC from the regular 2075
tissues and not by the depletion from the injection site, then a terminal half-life of 6 days could be 2076
used in the extrapolation equation (Equation 2). 2077
8.3.7. Residues in the injection site(s) 2078
Figure 30 shows the depletion of OTC from the injection site as measured in one of the studies 2079
(Achenbach, 2000), following the s.c. administration of a 20% product at a single dose of 20 mg/kg bw 2080
and with a maximum injection volume of 10 ml per injection site. 2081
2082
Figure 30. Mean OTC concentration (mg/kg) in injection site following the s.c. administration of a 2083
20% product at a single dose of 20 mg/kg bw; from Achenbach, 2000. 2084
2085
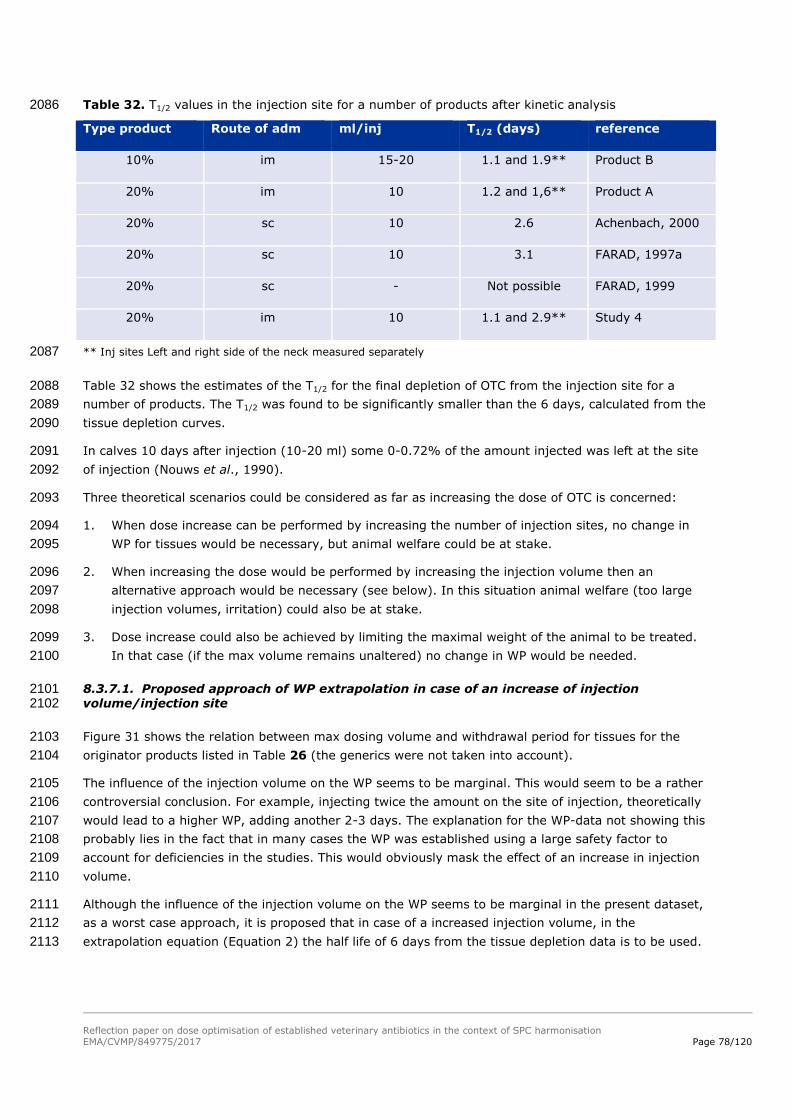
Reflection paper on dose optimisation of established veterinary antibiotics in the context of SPC harmonisation
EMA/CVMP/849775/2017 Page 78/120
Table 32. T1/2 values in the injection site for a number of products after kinetic analysis 2086
Type product Route of adm ml/inj T1/2 (days) reference
10% im 15-20 1.1 and 1.9** Product B
20% im 10 1.2 and 1,6** Product A
20% sc 10 2.6 Achenbach, 2000
20% sc 10 3.1 FARAD, 1997a
20% sc - Not possible FARAD, 1999
20% im 10 1.1 and 2.9** Study 4
** Inj sites Left and right side of the neck measured separately 2087
Table 32 shows the estimates of the T1/2 for the final depletion of OTC from the injection site for a 2088
number of products. The T1/2 was found to be significantly smaller than the 6 days, calculated from the 2089
tissue depletion curves. 2090
In calves 10 days after injection (10-20 ml) some 0-0.72% of the amount injected was left at the site 2091
of injection (Nouws et al., 1990). 2092
Three theoretical scenarios could be considered as far as increasing the dose of OTC is concerned: 2093
1. When dose increase can be performed by increasing the number of injection sites, no change in 2094
WP for tissues would be necessary, but animal welfare could be at stake. 2095
2. When increasing the dose would be performed by increasing the injection volume then an 2096
alternative approach would be necessary (see below). In this situation animal welfare (too large 2097
injection volumes, irritation) could also be at stake. 2098
3. Dose increase could also be achieved by limiting the maximal weight of the animal to be treated. 2099
In that case (if the max volume remains unaltered) no change in WP would be needed. 2100
8.3.7.1. Proposed approach of WP extrapolation in case of an increase of injection 2101 volume/injection site 2102
Figure 31 shows the relation between max dosing volume and withdrawal period for tissues for the 2103
originator products listed in Table 26 (the generics were not taken into account). 2104
The influence of the injection volume on the WP seems to be marginal. This would seem to be a rather 2105
controversial conclusion. For example, injecting twice the amount on the site of injection, theoretically 2106
would lead to a higher WP, adding another 2-3 days. The explanation for the WP-data not showing this 2107
probably lies in the fact that in many cases the WP was established using a large safety factor to 2108
account for deficiencies in the studies. This would obviously mask the effect of an increase in injection 2109
volume. 2110
Although the influence of the injection volume on the WP seems to be marginal in the present dataset, 2111
as a worst case approach, it is proposed that in case of a increased injection volume, in the 2112
extrapolation equation (Equation 2) the half life of 6 days from the tissue depletion data is to be used. 2113

Reflection paper on dose optimisation of established veterinary antibiotics in the context of SPC harmonisation
EMA/CVMP/849775/2017 Page 79/120
2114
Figure 31. The withdrawal period (y-axis, in days) for cattle of various oxytetracycline injectable VMPs 2115
as a function of the injection volume per injection site (x-axis, in ml) 2116
8.3.8. Residues in milk 2117
2118
Figure 32. Oxytetracycline concentrations in plasma and milk (mean and s.d.) following intravenous 2119
administration of Engemycine-10% at a dose of 5 mg/kg bw; based on Nouws et al., 1985 2120
In Figure 32, after an initial rise, the time dependent course of the concentration of OTC in milk 2121
generally seems to mimic the pattern in plasma. This pattern was confirmed by other data from 2122
Nouws (see Figure 33 and Figure 34). The ratio milk/plasma was reported to be in the range of 1 to 2 2123
(Nouws et al., 1985). 2124
y = -0,419x + 35,297R² = 0,0724
0
5
10
15
20
25
30
35
40
45
50
0 5 10 15 20 25
wp vs max volume/inj without generics

Reflection paper on dose optimisation of established veterinary antibiotics in the context of SPC harmonisation
EMA/CVMP/849775/2017 Page 80/120
2125
Figure 33. Mean plasma OTC concentrations following muscular administrations of Oxytetracycline-2126
10% formulations to dairy cows at a dose level of 5 mg/kg bw; based on Nouws et al., 1985 2127
2128
Figure 34. Mean milk OTC concentrations following muscular administrations of Oxytetracycline-10% 2129
formulations to dairy cows at a dose level of 5 mg/kg bw; based on Nouws et al., 1985 2130
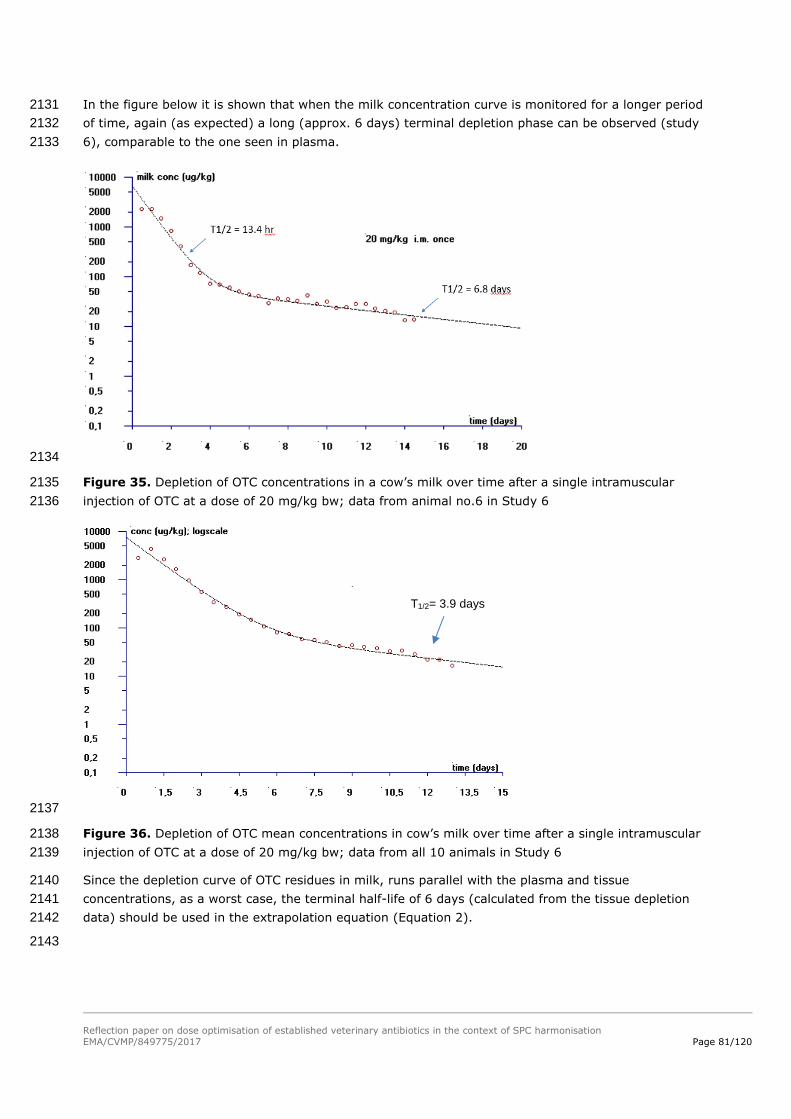
Reflection paper on dose optimisation of established veterinary antibiotics in the context of SPC harmonisation
EMA/CVMP/849775/2017 Page 81/120
In the figure below it is shown that when the milk concentration curve is monitored for a longer period 2131
of time, again (as expected) a long (approx. 6 days) terminal depletion phase can be observed (study 2132
6), comparable to the one seen in plasma. 2133
2134
Figure 35. Depletion of OTC concentrations in a cow’s milk over time after a single intramuscular 2135
injection of OTC at a dose of 20 mg/kg bw; data from animal no.6 in Study 6 2136
2137
Figure 36. Depletion of OTC mean concentrations in cow’s milk over time after a single intramuscular 2138
injection of OTC at a dose of 20 mg/kg bw; data from all 10 animals in Study 6 2139
Since the depletion curve of OTC residues in milk, runs parallel with the plasma and tissue 2140
concentrations, as a worst case, the terminal half-life of 6 days (calculated from the tissue depletion 2141
data) should be used in the extrapolation equation (Equation 2). 2142
2143
T1/2= 3.9 days

Reflection paper on dose optimisation of established veterinary antibiotics in the context of SPC harmonisation
EMA/CVMP/849775/2017 Page 82/120
8.3.9. Withdrawal time calculation 2144
The new withdrawal periods were calculated using Equation 2. 2145
Using PK/PD methods for the 10% formulations an optimised dosing schedule of 10 mg/kg bw daily 2146
during 3-5 days was set, for the treatment of Bovine Respiratory Infection. 2147
For the 20-30% formulations (long acting) an optimised dosing schedule 20 mg/kg bw administered 2148
twice with an interval of 36-48 h was set. Table 33 and Table 34 list the products that need an 2149
adjustment of their current dosing schedule. 2150
Table 33. OTC injectables (10% formulations) authorised in NL for bovine respiratory disease having a 2151
dose below 10 mg/kg bw per day 2152
VMP no MA Type WP tissue (days)
WP milk (days)
Dose (mg/kg)
duration (days)
max inj vol (ml)
Adm, route
6 10% 18 5 8 5 10 im
9 10% 35 4 4 3 20 im
10 10% 35 4 4 3 20 im
11 10% 35 10 4 3 to 5 10 im
13 10% 35 10 4 3 to 5 10 im
21 10% 35 4 4 3 20 im
22 10% 35 10 4 3 to 5 10 im
2153
Table 34. OTC injectables (20%-30% formulations) authorised in NL for bovine respiratory disease 2154
having a single dose schedule that has to be extended to a second dose 36-48 h after first dose 2155
VMP no MA Type WP tissue (days)
WP milk (days)
Dose (mg/kg)
Duration (days)
max inj vol (ml)
Adm, route
1 LA 30% 35 10 20, 30 1 7,5 and 10 im
2 LA 30% 35 10 20, 30 1 7,5 and 10 im
12 LA 30% 35 9 20 1 10 im
14 LA 20% 35 13 20 1 10 im
23 LA 20% 27 13 20 1 10 im
2156
For the 10% formulations, increasing the OTC dose from 4 to 10 mg/kg bw by an increase of the 2157
number of injections would lead to no changes in withdrawal periods for tissues of these products. For 2158
milk a terminal T1/2 of 6 days would be used in Equation 2, leading to an addition of 6 days for each 2159
doubling of the withdrawal period, adding up to an additional 8 days. 2160
The two other possible scenarios for increasing the dose that could be considered are specified below. 2161
The T1/2 final phase value was set to 6 days in case of scenario 1. In both scenarios a maximum of 3 2162
injections per day was used for animal welfare reasons. 2163

Reflection paper on dose optimisation of established veterinary antibiotics in the context of SPC harmonisation
EMA/CVMP/849775/2017 Page 83/120
1. Increasing the dose could be performed by increasing the injection volume. In this situation 2164
animal welfare (too large injection volumes, irritation) could also be at stake, so the maximum 2165
injection volume was set to 20 ml per injection site. The results are listed in Table 35. 2166
2. Dose increase could also be achieved by using a maximum number of injections of 3 and 2167
subsequently limiting the maximal weight of the animal to be treated. In that case (if the max 2168
injection volume would remain unaltered) no change in WP would be needed for tissues as the 2169
injection site will remain the WP determining tissue and residues at the IS unchanged. For milk 2170
equation 2 can be used. The results are listed in Table 36. 2171
Table 35. Extrapolated WPs for the 10% formulations for a dose of 10 mg/kg bw, using a maximum 2172
number injections of 3 and adjusting the maximum injection volume to 20 ml when possible 2173
2174
Table 36. Extrapolated WPs for the 10% formulations for a dose of 10 mg/kg bw, using a maximum 2175
number injections of 3 without altering the maximum injection volume, and the resulting introduction 2176
of a change of maximum bodyweight 2177
VMP No
MA type Dose
(mg/kg)
WP tissue remains(da
ys)
WP milk
old(days)
WP milk new(day
s)
max inj vol (ml)
Max weight
(kg)
6 10% 8 18 5 7 10 300
10 10% 4 35 4 12 20 600
11,13 10% 4 35 10 18 10 300
21,9 10% 4 35 4 12 20 600
22 10% 4 35 10 18 10 300
2178
For the 20-30% formulations the repeated injection would lead to no changes in withdrawal periods for 2179
tissues of these products. For milk a terminal T1/2 of 6 days would be used in Equation 2, leading to an 2180
addition of 6 days for each doubling of the withdrawal period. Taking into account the interval of 36-48 2181
hours between the two doses, where a certain fraction if the first dose is already eliminated at the time 2182
the second dose is given, it could be calculated that as a worst case it still would lead to an increase of 2183
6 days. Table 37 shows the resulting withdrawal periods. 2184
VMP No
MA Type Dose
(mg/kg)
WP tissue old
(days)
WP milk old (days)
WP tissue new (days)
WP milk new (days)
Max, weight (kg)
6 10% 8 18 5 24 7 600
10 10% 4 35 4 35 12 600
11,13 10% 4 35 10 41 18 600
21,9 10% 4 35 4 35 12 600
22 10% 4 35 10 41 18 600

Reflection paper on dose optimisation of established veterinary antibiotics in the context of SPC harmonisation
EMA/CVMP/849775/2017 Page 84/120
Table 37. Extrapolated WPs for the 20%-30% formulations for a dosing schedule that was extended 2185
to a second dose 48 h after first dose 2186
VMP
no
MA
Type
Old WP
tissue
(days)
Old WP
milk
(days)
Dose
(mg/kg)
Old schedule
(days)
New schedule
(days)
New WP
tissues
(days)
New
WP Milk
(days)
max
inj vol
(ml)
1 30% 35 10 20,30 1 1 and 3 35 16 10
2 30% 35 10 20,30 1 1 and 3 35 16 10
12 20% 35 9 20 1 1 and 3 35 15 10
14 20% 35 13 20 1 1 and 3 35 19 10
23 20% 27 13 20 1 1 and 3 27 19 10
8.4. Environmental risk assessment 2187
Because there may be different authorised doses for the same or similar products, as a general rule, 2188
the situation for the product with the highest authorised (total) dose for the same target animals is 2189
used for the comparison, provided that an ERA exists for that product at that dose for the relevant 2190
target species. In the case of oxytetracycline injectable products for cattle, ERAs are available 2191
addressing the risks at a single dose of 20 mg/kg bw. 2192
8.4.1. Step 1: Determine the assessment situation for oxytetracycline 2193
In accordance with the PK/PD modelling (see 8.1. ), the optimised dose for LA oxytetracycline 2194
injectable products for the treatment of respiratory disease in cattle is a single dose of 20 mg/kg bw, 2195
to be repeated after 48 hours. For SA formulations, the optimised dose is 10 mg/kg bw per day for 3-5 2196
days. The SA formulations have the highest total dose (5 times 10 mg/kg bw = 50 mg/kg bw), so the 2197
use of SA formulations would lead to the highest environmental exposure. 2198
In the available Phase IIA assessments (based on a single dose of 20 mg/kg bw), fate and effect 2199
studies were considered, and the RQs were determined for the various test species representing the 2200
terrestrial and aquatic environments. The RQs for terrestrial species were in the range of 0.002-0.17, 2201
and the RQs for aquatic species were in the range of 0.00003-0.01. 2202
In view of the information given above, in was concluded that dose increases up to a total dose of 100 2203
mg/kg bw would still result in RQs lower than 1. In addition, this dose level would not result in a 2204
PECgroundwater higher than 0.1 µg/L. This means that the two optimised dosing regimes of 2 x 20 mg/kg 2205
bw for the LA formulations and of 5 x 10 mg/kg bw for the SA formulations will not give rise to 2206
concerns in relation to environmental risks. Further consideration of steps 2-8 of the proposed 2207
approach was not necessary. 2208
It was concluded that the dose optimisation for oxytetracycline does not lead to additional 2209
environmental risks. 2210
8.4.2. Conclusion on the ERA for oxytetracycline 2211
The dose optimisation for oxytetracycline does not lead to additional environmental risks. 2212

Reflection paper on dose optimisation of established veterinary antibiotics in the context of SPC harmonisation
EMA/CVMP/849775/2017 Page 85/120
8.5. Target animal safety 2213
The dosing regimens for oxytetracycline injections for cattle are variable, with 10% formulations being 2214
administered at lower doses, generally 4 – 20 mg/kg, for 1 to 5 days, and 20% formulations mostly 2215
being administered on a single occasion at a dose of 20 or 30 mg/kg, but with the possibility to repeat 2216
after 48 or 72 h. According to the outcomes of the PKPD modelling, the following dosing regimens are 2217
suggested: 2218
10% formulations: 10 mg/kg, every 24h for 5 days 2219
20% formulations: 20 mg/kg repeated once after 36-48 h 2220
8.5.1. Step 1: Determine the target animal safety profile for the active 2221
substance and establish the MOS for the active substance according to the 2222
revised dose, pharmaceutical form and route of administration 2223
(Review of the TAS studies provided by MAHs) 2224
‘Product OTC1’ is a long acting (LA) formulation containing 200 mg OTC per ml. 2225
Based on studies in laboratory spp, the target organs for OTC toxicity are the liver and kidneys. 2226
Injections cause local tissue reactions. Anaphylaxis has been observed in cattle. 2227
Study reports (n=27) were provided for investigations of local (injection site) tolerance. In the first 2228
series of studies, >2000 cattle received either a control product (immediate release formulation 2229
containing either 50 mg or 100 mg OTC/ml) at 10 mg/kg bw, or Product OTC1 at the recommended 2230
dose of 20 mg/kg bw, except for 25 animals which received OTC 1 at 44 mg/kg bw in error. 2231
Observations related to clinical signs and histopathology of injection site (IS) lesions, only. 2232
The signs observed in 2389 animals treated with either OTC1 or control included: Pain on injection, 2233
injection site swellings that in some cases were still visible at 24 h, but reduced at 48 h; salivation, 2234
trembling (and 2 cases of collapse with immediate recovery). There was no increase in adverse events 2235
in animals administered OTC1 at 44 mg/kg bw. 2236
A second series of studies focused on histopathological findings at the IS 28 days after administration 2237
of ‘Product OTC1’ at the RTD (20 mg/kg bw) to 74 animals in total. Either 10 ml or 20 ml was 2238
administered at each IS. For the 20 ml injection volume, there were 56% of sites that were sub-2239
optimal, whereas for 10 ml volume, only 5% of sites were sub-optimal. The 10 ml volume was also 2240
tolerated by calves (>100 kg weight). 2241
Conclusion: For Product OTC1, the maximum injection volume should be 10 ml per site. 2242
Product OTC2 is a formulation containing 200 mg OTC per ml, administered as a single injection. A 2243
single study was provided for which one of the aims was to investigate injection site safety. 2244
There were local reactions which varied from slight to severe in all 10 animals after injection but had 2245
mostly resolved clinically after 1 week; although it is not clear, these reactions may have caused the 2246
animals to appear lethargic for approximately 2 days after injection. Inflammatory IS reactions were 2247
still present in most animals at necropsy after 2/3 weeks. 2248
Conclusion: Product OTC2 caused marked IS reactions at a maximum injection volume of 10 ml; hence 2249
there is a rationale to restrict the injection volume. 2250
Conclusions: In one proprietary study, OTC was administered in error at a dose of 44 mg/kg bw to 25 2251
animals. Although there was no increase in adverse events, this study evaluated clinical signs only. 2252
Reflection paper on dose optimisation of established veterinary antibiotics in the context of SPC harmonisation
EMA/CVMP/849775/2017 Page 86/120
Multiple proprietary IS safety studies were provided for one 20% formulation (including other OTC 2253
formulations as controls) and a single study investigated IS safety of 2 versions of another 20% 2254
formulation. It is apparent that OTC injections (regardless of strength) are irritating and there is a 2255
rationale to restrict the IS volume. It seems plausible that oxytetracycline itself is an irritant, although 2256
tolerability to individual formulations may be affected by their excipient composition. 2257
8.5.1.1. Step 1a: Review supplementary data from dossiers, if needed e.g. dose-finding 2258 studies 2259
Data not available to the pilot project. 2260
8.5.2. Step 2: Safety in the target population 2261
Data not available to the pilot project. 2262
8.5.3. Step 3: Safety based on post-marketing pharmacovigilance 2263
Data not available to the pilot project. 2264
8.5.4. Step 4: Safety based on published literature and authorisations in 2265
third countries 2266
Literature review – A review was conducted using PubMed and the terms <oxytetracycline> <cattle> 2267
and <toxicity> or <safety>. 2268
In a study from TerHune & Upson (1989), 30 healthy calves were administered OTC LA formulation at 2269
40 mg/kg bw IM. Reactions and toxicosis were limited to anaphylaxis (n=1) and IS swellings (n=2). 2270
Textbooks 2271
Prescott & Dowling (2013) states that tetracyclines are irritants and may cause damage at injection 2272
sites. Calcium-binding may cause acute cardiac toxicity. Anhydrotetracyclines damage plasma 2273
membranes and bind to serum albumin. 2274
Plumb’s Veterinary Drug Handbook (6th Ed) (Plumb, 2008) indicates that tetracyclines are excreted in 2275
milk in a ratio of milk:plasma of 0.25 to 1.5. 2276
Grey literature 2277
Information available from SPCs of EU-authorised products 2278
SPC 4.3 – Contraindications: Several products include contraindications from use in animals suffering 2279
from renal or hepatic damage or with known hypersensitivity to oxytetracycline. 2280
SPC 4.9 – Dosing and administration: Several products include restrictions on the injections volume at 2281
any one site from between 10 to 20 ml. 2282
SPC - warnings for the target spp. 2283
Warnings relate to possible occurrence of gastrointestinal disorders, allergic reactions, photosensitivity, 2284
hepatotoxicity, nephrotoxicity, tooth discolouration and injection site reactions. The incidence of 2285
adverse events is not clear from the SPCs of these long-authorised products. 2286

Reflection paper on dose optimisation of established veterinary antibiotics in the context of SPC harmonisation
EMA/CVMP/849775/2017 Page 87/120
Concerns also relate to use during pregnancy and effects on foetal development. For one product it is 2287
advised that although oxytetracycline is excreted in the milk, concentrations are generally low and the 2288
product ‘can be safely administered to lactating animals’. 2289
OTC is reputed to have ‘low general toxicity’ although the MOS is not available from SPCs. 2290
CVM FOIA reports 2291
In the USA Liquamycin LA-200 is authorised for treatment of pneumonia in cattle at a single dose of 20 2292
mg/kg bw, or for other indications at 6.6 – 11 mg/kg bw for 4 days. 2293
NADA 113-232 Liquamycin LA 200 2294
Study 2532D-60-96-164 investigated the local safety of SC injection at 20 mg/kg bw as part of a 2295
residues depletion study in 26 calves with average weight 253 kg. SC injections resulted in transient 2296
swellings from as early as D1. These peaked at D7 but resolved clinically without intervention. The SC 2297
route resulted in smaller lesions than IM. Histopathological exam revealed that lesions did not 2298
completely resolve within the 28 day WP. 2299
NADA 141-312 Hexasol injection (OTC 300 mg/ml + flunixin meglumine 20 mg/ml) 2300
P-FLO-020 investigated the safety of Hexasol when administered at 0, 1x, 3x and 5x the RTD of 29.9 2301
mg OTC + 2 mg flunixin/kg for 3 administrations at 72 h apart to 24 M/F calves (6/group) aged 3 to 5 2302
months and weighing 100 to 147 kg. There was a dose-dependent increase in AST to 5x ULN until D7; 2303
no evidence of hepatotoxicity was found and this was considered to be related to muscle inflammation. 2304
Creatinine and urea increased in the 5x group and peaked at the high ULN at D4. 2 calves in the 5x 2305
group had much higher levels and were euthanised on D7; examination of the kidneys detected cortical 2306
tubular necrosis consistent with mild renal toxicity. 2307
Conclusion - This study showed that a dose of 90 mg/kg bw (n=6), repeated on 3 occasions at 72 h 2308
apart, was a ‘no effect level’ for renal toxicity; pathology was present at 150 mg/kg bw. A dose of 150 2309
mg/kg bw was a no effect level for liver toxicity. 2310
NADA 141-143, 2003 Tetradure 300 containing oxytetracycline 300 mg/ml 2311
Published data from Griffin et al., 1979, Lairmore et al., 1984, Riond & Riviere, 1989, TerHune & 2312
Upson, 1989, Vaala et al., 1987, were considered. 2313
079/96: A GLP TAS study to investigate the safety of Oxytet 30 following IM injection to cattle. OTC 2314
was administered at 1x, 2x and 4x the RTD of 30 mg/kg bw on 3 occasions at 72 h apart to 24 cattle 2315
aged 6 to 9 months and weighing 214 to 286 kg. A maximum injection volume was 10 ml per IS. 2316
Localised IS reactions were noted in all groups and reflected the total dose administered with the 2317
highest incidence of lameness in the 4x group. 2318
Anorexia was observed in the 4x group after the 3rd injection and lasted 8 days. 2319
The most notable findings were increased urea and creatinine in the 4x group which was accompanied 2320
by histopathological changes indicating renal dysfunction detected at necropsy at D21. No post-2321
mortem changes were noted in the 1x and 2x groups. No hepatic pathology was noted. 2322
Conclusion - This study showed a no effect level for renal toxicity up to 60 mg/kg bw (n=8), repeated 2323
on 3 occasions at 72 h apart; renal pathology was seen at 120 mg/kg bw. 2324
041/95: GLP PK study to support safety of IV and IM administration of Oxytet 30 at 30 mg/kg bw 2325
dose. The study involved 12 cattle weighing from 409 to 441 kg. No evidence of collapse, neurological 2326

Reflection paper on dose optimisation of established veterinary antibiotics in the context of SPC harmonisation
EMA/CVMP/849775/2017 Page 88/120
effects or changes in gait were observed. Hardness and swelling were noted to varying degree at IS for 2327
both routes, but resolved by D 28. 2328
089/96: GLP IS safety study. A dose of 30 mg/kg bw and 60 mg/kg bw was administered IM at a max 2329
of 10 ml/site on 3 occasions at 72 h apart in the neck, rump and leg. IS were monitored and examined 2330
by histopath at 15 days after the final injection. No IS reactions were noted at the neck sites, although 2331
some localised tissue necrosis may still be present at 21 days. 2332
Overall conclusions - Based on the TAS studies available, there appears to be a ‘no effect level’ up to 2333
60 mg oxytetracycline/kg bw after IM injection repeated on 3 occasions at 72h intervals, above which 2334
there may be impacts on renal function. However, it should be considered that this conclusion is based 2335
on findings in small numbers of animals. Lower doses (33 mg/kg bw) administered IV may also result 2336
in toxicity. 2337
8.5.5. Step 5: Conclude on the safety of the increased dose of the active 2338
substance according to the pharmaceutical form and route of 2339
administration 2340
The data available indicate that OTC has renal toxic effects with a NOEL at 60 mg/kg bw by 2341
intramuscular administration and less than 33 mg/kg bw IV. 2342
Irritant effects limit the volume that can be administered at each IS, and this may vary with the 2343
formulation. For some 200 mg/ml formulations, the maximum IS volume is 10 ml. Where this is based 2344
on safety reasons, this should be taken into account if there is a dose increase that might lead to a 2345
need for multiple injections. 2346
8.5.6. Step 6: Further considerations for the conclusion on the safety and 2347
benefit-risk for individual products 2348
The following excipients have been included in different EU-authorised formulations: 2349
2-Pyrrolidone 2350
Benzylalcohol 2351
Citric acid monohydrate 2352
Dimethylacetamide 2353
Disodium Edetate Dihydrate Ethanolamine 2354
Glycerolformal 2355
Hydrochloric Acid 2356
Macrogol 1500 2357
Magnesium Chloride Hexahydrate 2358
Magnesium Oxide 2359
Methyl-4-hydroxybenzoaat (E218) 2360
Monoethanolamine 2361
N-methyl-2-pyrrolidone 2362

Reflection paper on dose optimisation of established veterinary antibiotics in the context of SPC harmonisation
EMA/CVMP/849775/2017 Page 89/120
Polyethylene Glycol 200 2363
Povidone K 17 2364
Propyl-4-hydroxybenzoaat (E216) 2365
Sodium formaldehyde sulphoxylate dihydrate 2366
The excipients may impact on local tolerance and this should be taken into account on a product-by-2367
product basis. 2368
8.5.7. Step 7: The conclusions above are incorporated into the final 2369
benefit-risk for the dose increase for each individual product 2370
For oxytetracycline injections, the optimised doses suggested by the PK/PD modelling for the 2371
treatment of bovine respiratory disease fell within the range of doses already approved for different EU 2372
10% and 20% formulations, with the only modification being a reduction in the interval for repeat 2373
injections of the 20% formulations from 48 - 72 h to 36 – 48 h. 2374
The data available indicate that oxytetracycline has renal toxic effects which manifest above a dose of 2375
60 mg/kg bw (repeated on 3 occasions) – this would impact on the scope for any dose increase. The 2376
suggested dose of 20 mg/kg bw repeated once after 36 h (total 40 mg/kg bw) for 20% formulations is 2377
expected to give a Cmax and overall exposure below this threshold for renal toxicity, and therefore is 2378
likely to be adequately tolerated in cattle for the treatment of the indication for respiratory disease. 2379
In terms of those 10% formulations for which the dose of 10 mg/kg bw represents a dose increase, it 2380
may be of more practical significance that local irritant effects can limit the volume that can be 2381
administered at each injection site. The maximum tolerated injection volume may vary with the 2382
formulation. It is suggested that the maximum dose volume at any site should not exceed that already 2383
stated in the SPC for individual products, or where not stated should be based on a review of the TAS 2384
data for the individual product. The number of injections that can practically be administered would 2385
have to be taken into account and could result in a restriction on the maximum bodyweight of animal 2386
for which a product could be used. 2387
8.6. Overall conclusion on oxytetracycline 2388
The approaches on dose optimisation, WP, ERA and TAS as described in chapters 3, 4, 5, and 6, 2389
respectively, were tested in the case study on oxytetracycline products, administered by injection, for 2390
the treatment of respiratory infections in cattle, including lactating cattle. The solution for injection is 2391
available in 10% (“short acting”) and 20% (“long acting”) formulations. The approved doses are 4 – 20 2392
mg/kg bw per day, daily injection for between 1 and 5 days for the 10% formulations, and 20 or 30 2393
mg/kg bw, single injection, repeated after 48 or 72 hours in severe cases for the 20% formulations. 2394
In order to optimise the dose, the following pathogens were considered to be relevant: Pasteurella 2395
multocida, Mannheima haemolytica and Haemophilus somni. 2396
Because formulation-specific differences in PK may exist, the compositions and the PK of various 2397
products were analysed, revealing no significant differences in PK. However, the difference in strength 2398
will require different injection volumes which may impact on the absorption kinetics. Therefore, the 2399
PK/PD analysis was done for the 10% and 20% formulations separately. 2400
The optimised doses for the 10% and 20% formulations were 10 mg/kg bw and 20 mg/kg bw, 2401
respectively. These doses fell within the range of doses already approved for authorised products in 2402

Reflection paper on dose optimisation of established veterinary antibiotics in the context of SPC harmonisation
EMA/CVMP/849775/2017 Page 90/120
the EU, with the only modification being a reduction in the interval for repeat injections of the 20% 2403
formulations from 48-72 h to 36–48 h. 2404
For the establishment of the WP, a “worst-case” and thus rather conservative half-life of 6 days was 2405
used for the extrapolation of WPs for both tissues and milk, resulting in low to moderate increases of 2406
the WPs. 2407
For addressing the environmental risks, adequate Phase I and Phase II ERA data were available for the 2408
authorised dose of 20 mg/kg bw. For the optimised doses (5x10 mg/kg bw or 2x20 mg/kg bw), the 2409
RQs remained below 1. Therefore, the optimised doses for oxytetracycline do not give rise to any 2410
additional concerns for the environment. 2411
In relation to TAS, The data available indicate that oxytetracycline has renal toxic effects which 2412
manifest above a dose of 60 mg/kg bw (repeated on 3 occasions) – this would impact on the scope for 2413
any dose increase. The suggested dose of 20 mg/kg bw repeated once after 36 h (total 40 mg/kg bw) 2414
for 20% formulations is expected to give a Cmax and overall exposure below this threshold for renal 2415
toxicity, and therefore is likely to be adequately tolerated in cattle for the treatment of the indication 2416
for respiratory disease. 2417
In terms of those 10% formulations for which the dose of 10 mg/kg bw represents a dose increase, it 2418
may be of more practical significance that local irritant effects can limit the volume that can be 2419
administered at each injection site. The maximum tolerated injection volume may vary with the 2420
formulation. It is suggested that the maximum dose volume at any site should not exceed that already 2421
stated in the SPC for individual products, or where not stated should be based on a review of the TAS 2422
data for the individual product. The number of injections that can practically be administered would 2423
have to be taken into account and could result in a restriction on the maximum bodyweight of animal 2424
for which a product could be used. 2425
9. Discussion and conclusions 2426
9.1. Dose optimisation by PK/PD analysis 2427
9.1.1. Cases studies analysis 2428
For the purpose of the pilot study, the PK/PD index AUC24h/MIC is considered for tetracyclines (Andes & 2429
Craig, 2002) and amoxicillin (Lees et al., 2015). To investigate the differences between different PK/PD 2430
indices, T>MIC is also considered for amoxicillin (Rey et al., 2014). This comparison of PK/PD indices in 2431
the application of the methodology will allow review of advantages (such as applicability, feasibility) 2432
and drawbacks (such as data requirements, complexity) of each PK/PD index. 2433
The calculation of AUC/MIC is simple to perform and allows back calculation to set a dose or a 2434
breakpoint. It requires a good pharmacokinetic dataset to estimate AUCs and does not require 2435
extensive pharmacometrics. The calculation of time above MIC requires robust estimates of the 2436
distribution of pharmacokinetic parameters (means and variances) from different experimental studies. 2437
An expertise in pharmacometrics using nonlinear mixed effects is needed for this step. The time to 2438
maintain MIC is not a simple parameter but a variable function of different conditions and depends not 2439
only on the dose but also from the shape of the time concentration curve. Thus, it cannot be derived 2440
from a simple formula and needs to be computed. The use of population pharmacokinetics, allows 2441
simulation of probable product exposures which can be obtained with any dosage regimen. This is 2442
important for a time-dependent antibiotic such as amoxicillin for which the input rate (absorption) is at 2443
least as important as the total administered dose and not dose-proportional. Indeed, the time to 2444

Reflection paper on dose optimisation of established veterinary antibiotics in the context of SPC harmonisation
EMA/CVMP/849775/2017 Page 91/120
maintain MIC will be highly dependent not only on the dose administered but also on the formulation, 2445
the route of administration and the inter-individual PK variability (for example in body weight, sex, 2446
age, social rank). 2447
As an example, for pigs, for oral ad libitum administration, plasma concentrations are related to the 2448
feeding and water intake behaviour. This behaviour can be modified by disease state. The 2449
pharmacokinetic data set used by Rey et al. was obtained with healthy animals as it was submitted for 2450
marketing authorization for a veterinary medicine. Infection could modify the feeding and water intake 2451
behaviour and also product disposition. As discussed in the paper by Rey et al., the effect on 2452
disposition must vary according to the type of disease. Exposure of diseased animals could increase or 2453
decrease in comparison with healthy animals. Both PK/PD indexes AUC/MIC and T>MIC are dependent 2454
on animal status, product bioavailability, disposition and clearance. 2455
The use of a PK/PD approach requires a definition of the PTA to be achieved such as: 2456
- T>MIC: 40% of 24 hours greater than the MIC of 90% of the pig population 2457
- AUC/MIC: Ratio expected for bacteriostatic or bactericidal effect of 90% of the pig population. 2458
The relationship between T>MIC and antibacterial efficacy has been determined in vitro in several 2459
experimental animal studies (Craig, 1998) and retrospective analysis of clinical trials in human 2460
medicine seems to confirm those findings (Ambrose et al., 2007). For AUC/MIC, the targets were 2461
derived from in vitro activity of amoxicillin in serum on a limited set of P. multocida strains (Lees et al., 2462
2015). The choice of this index was justified in the paper because a concentration-dependent killing 2463
profile was observed in vitro in serum and confirmed in ex vivo studies. In addition, it was shown that 2464
for antibiotics like the β-lactams, where efficacy has been found to be correlated to T>MIC, the best 2465
PK/PD index shifts towards AUC/MIC as half-life increases (Nielsen & Friberg, 2013) while for an 2466
AUC/MIC dependent antibiotic a decrease in half-life will lead to a shift into a T>MIC relationship. 2467
When the half-life was increased to 2 h, the AUC/MIC became the most important PK/PD index 2468
(Nielsen et al., 2011). 2469
Mechanisms based on PK/PD modelling based on in vitro studies are also proposed as a flexible and 2470
powerful tool to describe the effect of antibacterial agents. The simulations are based on a model 2471
characterizing in vitro time-kill curve experiments combined with a pharmacokinetic model. The 2472
approach selected the previously PK/PD indices for different classes of antibacterial product. The target 2473
level and optimal dosing regimen should be based on quantitative description of the full time course of 2474
PK as well as PD and tailored to the population to be treated (Nielsen et al., 2011). 2475
9.1.2. PK/PD and prevention of resistance 2476
The ‘mutant selection window’ (MSW) is a concept well described in the scientific literature (Zhao & 2477
Drlica, 2001) for certain classes of antibiotics (e.g. fluoroquinolones). It postulates that an antibiotic 2478
concentration zone exists where resistant mutants, are selectively amplified. The lower limit of the 2479
MSW is the lowest concentration that inhibits the growth of the susceptible cells and is often 2480
approximated by the MIC. The upper limit is the minimum concentration that inhibits growth of the 2481
least-susceptible single-step mutant subpopulation, the mutant prevention concentration (MPC). 2482

Reflection paper on dose optimisation of established veterinary antibiotics in the context of SPC harmonisation
EMA/CVMP/849775/2017 Page 92/120
2483
Figure 37. Concept of mutant selection window (based on Canton & Morosini, 2011) 2484
This MSW also updates the classical concept of "sub-inhibitory" concentrations favouring the 2485
emergence of resistance, although the threshold to be considered is not the MIC of the majority wild 2486
pathogen population but the MIC of the least susceptible pathogenic sub-population, which in fact 2487
corresponds to the MPC. 2488
Then, to clearly take into account the notion of concentration preventing mutation in a PK/PD 2489
modelling, it is necessary first to define MPC distribution values for each molecule/bacterial species 2490
combination. It will allow obtaining three new PK/PD indices by replacing the MIC by the MPC: 2491
- AUC/MIC AUC/MPC 2492
- T>MIC T>MPC 2493
- Cmax/MIC Cmax/MPC 2494
Currently, MIC distribution is well standardised notably for surveillance monitoring programs and the 2495
information is easily accessible. However, applying MPC principles, when available, may serve to 2496
optimise antibiotic therapy and reduce resistance selection. 2497
9.1.3. Limitations of the modelling approach 2498
9.1.3.1. Impact on gut microbiota 2499
One of the main challenges in relation to AMR is to reduce the exposure of intestinal microbiota in 2500
order to control the dissemination of resistance factors in the environment. Dose optimisation should 2501
aim to lower exposure of the treated animals over time. The proposed PK/PD methodology could be a 2502
useful tool for determining doses that are effective against the bacterial populations targeted by the 2503
antibiotic therapy however it is unable to integrate the potential impact on gut microbiota. 2504
9.1.3.2. Use of the MIC as a PD indicator 2505
The PK/PD relationship is based only on the determination of a MIC as an indicator of effectiveness. 2506
However, the MICs are determined in vitro in a standardized environment and are not always 2507
representative of site of infection. It should be noted that those aspects are currently under 2508
Reflection paper on dose optimisation of established veterinary antibiotics in the context of SPC harmonisation
EMA/CVMP/849775/2017 Page 93/120
investigation notably studies comparing in vitro MIC obtained either in a standardized broth medium or 2509
in serum or biological fluid such as transudate/exudate. Evidence suggest that potency of certain 2510
antimicrobials measured in serum (as MIC) differs markedly from MICs determined in artificial broths 2511
and may need also to be considered for the dose optimisation (Dorey and Lees, 2017; Dorey et al., 2512
2017; Lees et al., 2018). In addition, in numerous situations, the MICs are not predictive of in vivo 2513
antibacterial activity as for example for intracellular pathogens or in a biofilm environment (Ferran et 2514
al., 2016). Furthermore, some antibiotics present other modes of action (e.g. anti-inflammatory, 2515
immunomodulatory activities) which MIC does not take into account (Fischer et al., 2011). 2516
9.1.3.3. Host immune response 2517
The PK/PD relationship does not take into account the immune response of the host which will have an 2518
effect on growth of bacteria and its complete clearance from the body or a control of bacterial 2519
population in animal. The efficacy and memory effect of immune response are dependent of several 2520
conditions (inoculum size, immune capacity). A relationship between the bacterial population and the 2521
immune cells population can be described and added in a more complicated model. The dosage 2522
regimen (dose, frequency, duration of treatment) will be in relation with the recovery rate and the risk 2523
of relapse. At this stage of research on PK/PD modelling, the models are still under investigation (Gjini 2524
& Brito, 2016). 2525
9.1.3.4. Duration of treatment 2526
Until now, one of the main limitations of the PK/PD methodology applied to the revision of the dosages 2527
of older antibiotics is that it helps determine a dose but does not give any information on the duration 2528
of treatment. Limiting the durations of antibiotic treatment to the minimum necessary can help reduce 2529
costs and adverse effects, but the main benefit is to reduce the duration of exposure of the commensal 2530
microbiota to antibiotics, which is an essential element in preventing the emergence, amplification and 2531
circulation of bacterial resistance. A number of studies have assessed the impact of the duration of an 2532
antibiotic treatment on the amplification of resistance within the commensal flora. 2533
9.1.3.5. Need for a clinical confirmation 2534
The application of the PK/PD relationship for dose determination is accepted according to the revised 2535
efficacy guideline (EMA/CVMP/627/2001-Rev.1). However, when a PK/PD relationship is used, a clinical 2536
confirmation is always needed to assess the efficacy of the newly defined dose. If the proposed 2537
methodology leads to a substantial increase of the daily dose for old products, it may be necessary to 2538
define a clear regulatory process that should be applied in this context. It is unlikely that, for products 2539
that are now widely used in the field and have proven their clinical benefit, new effectiveness efficacy 2540
studies should be required under the regulations and according to current requirements. Thus, an 2541
important limitation of the approach is the lack of information on reliable PDT and corresponding PTA 2542
for certain type of infections in animals. Mode of administration 2543
The method proposed thus far considers the intake of the medicinal product to be "perfect". For 2544
injection routes, this is hardly a problem, provided that good hygiene measures are followed and 2545
needles and syringes suited to the dosage are used. In contrast, bioavailability studies by the oral 2546
route are all based on the forced drenching of animals. While pets receive their antibiotic by drenching, 2547
oral treatments of livestock food-producing animals are most often collective and based on "voluntary" 2548
intake by the animals, either by a solid medium via medicated feed, or by a liquid medium via drinking 2549
water. 2550
2551

Reflection paper on dose optimisation of established veterinary antibiotics in the context of SPC harmonisation
EMA/CVMP/849775/2017 Page 94/120
- Administration via feed 2552
The main limitation is therefore the feed intake of each animal within the batch. When feeding ad 2553
libitum, the amount of feed consumed is more variable than the amount of water drunk. This leads to a 2554
greater variability of serum concentrations following administration of the same antibiotic (Soraci et 2555
al., 2014). 2556
- Administration via drinking water 2557
Compared to feed, administration via drinking water presented several advantages as for example 2558
treatment durations are usually shorter than via feed which lower the exposure of commensal flora, it 2559
is easier to target a smaller batch of animals and treatment can be started more quickly. However, the 2560
limitations and uncertainties are rather linked to the compliance of the dosage finally administered to 2561
the animals: accuracy of the dosage, quality of the medicated water and homogeneity. 2562
For oral ad libitum administration, plasma concentrations are related to the feeding and water intake 2563
behaviour (depending on e.g. the health status, the animal social rank), meaning that it induces new 2564
individual variabilities that the method presented here cannot take into account. 2565
9.1.4. Data requirements 2566
In order to use the PK/PD analysis approach for the dose optimisation of established veterinary 2567
antibiotics, the following data are considered essential: 2568
PK data 2569
o PK raw data from studies for individual product 2570
o Mean values for each PK parameters (CL, F, f …) 2571
PD data 2572
o MIC distribution for each target bacteria 2573
Furthermore, the following data would be desirable: 2574
Time-kill curves 2575
PK/PD modelling 2576
Literature search 2577
In vivo experiment - correlation between prediction and clinical outcome 2578
9.1.5. Conclusions on the PK/PD analysis 2579
9.1.5.1. The importance of the dose optimisation of established veterinary antibiotics 2580
The importance of revising the dosages is based on a need to optimise the doses of older antibiotics 2581
because repeated exposure to inappropriate concentrations represents a major risk in terms of 2582
antimicrobial resistance in target pathogens. An optimal dosage must be determined to ensure the 2583
efficacy of the treatment, but also to prevent the emergence, selection and/or dissemination of 2584
resistant micro-organisms in a bacterial population. Inter-individual variability, in terms of exposure to 2585
the antibiotic, is certainly one of the risk factors with the greatest influence on the emergence of 2586
antibiotic-resistant organisms. Accordingly, a dosage should be based on a PK/PD approach and should 2587

Reflection paper on dose optimisation of established veterinary antibiotics in the context of SPC harmonisation
EMA/CVMP/849775/2017 Page 95/120
take the inter-individual variability into account, regarding both pharmacokinetics and 2588
pharmacodynamics. 2589
The methodology for revising the dosages of older antibiotics is based on a PK/PD approach that can 2590
integrate both pharmacokinetic (clearance, bioavailability) and pharmacodynamic variability (in terms 2591
of MIC) in the search for the optimal dose. The use of a PK/PD approach in the dose determination 2592
phase prior to a clinical validation phase will therefore make it possible to select a dosage leading to a 2593
sufficient exposure of the target bacterial population to an effective concentration of the antibiotic, in 2594
the majority of animals treated. 2595
The current doses of established antibiotics generally provide a clinical benefit without this being 2596
optimised with regard to the risk of antimicrobial resistance, whether it concerns the pathogenic 2597
bacteria targeted or the commensal microbiota. 2598
9.1.5.2. The feasibility of the PK/PD approach 2599
The PK/PD approach requires consolidated data to be available both on the pharmacokinetics of the 2600
antibiotics in the species considered, and the pathogens’ susceptibility to antibiotics, in the form of MIC 2601
distributions. The effectiveness indices (PK/PD indices) are central to the PK/PD methodology applied 2602
to antibiotics, whether in the area of human or animal antibiotic therapy, because they are required to 2603
be predictive of a high probability of therapeutic success, in potentially varying clinical situations. 2604
Currently, there were few available data however, especially for the issue of older antibiotics. Ideally 2605
these PK/PD indices (and their threshold values) would be confirmed by clinical trials performed in the 2606
target species. For old antibiotics, the PK/PD integration approach is eligible to dose optimisation in the 2607
treatment of acute diseases in animals when the substance belongs to an antimicrobial class with 2608
scientific evidences from experimental and clinical trials supporting the setting of PDI and PDT. 2609
9.2. Withdrawal Period adjustment by PK analysis 2610
9.2.1. Case studies analysis 2611
For the purpose of testing the approach of adjustment of the WP using an algorithm based on PK 2612
modelling (see chapter 4. ), two case studies were performed. The idea was to test a simple case 2613
(amoxicillin products for oral use in pigs) together with a more difficult one (injectable oxytetracycline 2614
products for use in cattle; including dairy cattle). However, as it turned out, both cases each had their 2615
own specific difficulties. 2616
Whilst the problem how to deal with the injection site and the i.m versus s.c. administration had to be 2617
addressed in the oxytetracycline case, the amoxicillin case turned out to be unexpectedly difficult, due 2618
to lack of usable residue data. 2619
Since the depletion of residues of amoxicillin after oral administration to pigs is very rapid, most of the 2620
old residue studies that could be found in registration files, only confirm that the residues are already 2621
below LOD after a few days. 2622
For oxytetracycline, the erratic sampling of the injection site caused some fitting problems as well as 2623
the fact, that increasing the dose could pose a challenge regarding the maximum amount of injections 2624
that would be practical versus the maximum weight of an animal to be treated. 2625
In both cases however, the particular challenges could be overcome, by the use of the ‘hourglass’ 2626
approach. 2627
Using data and insights from multiple sources (FARAD, literature, published thesis’s, registration files, 2628
etcetera) and combining them in order to find the relevant PK parameters and eventually the terminal 2629

Reflection paper on dose optimisation of established veterinary antibiotics in the context of SPC harmonisation
EMA/CVMP/849775/2017 Page 96/120
half-life, in both cases reliable solutions for the extrapolation of the WP could be found. Therefore the 2630
two cases show that it is possible to use the proposed algorithm for extrapolating the Withdrawal 2631
Period. 2632
9.2.2. Concluding remarks on Withdrawal Period extrapolation 2633
Although the WPs in the EU are usually based on residue depletion studies (as the “golden standard”), 2634
it is acknowledged that this approach has some limitations in relation to the predictive value for the 2635
true WP under field conditions, where the products are used in different breeds and different weight 2636
classes of the (diseased) target animals (see 4.1. ). 2637
Therefore, the standard approach may not be scientifically superior per se to the PK modelling 2638
approach using data from literature and all products. In the proposed extrapolation approach, the 2639
pharmacokinetic parameters for the substance are extracted from all available sources, in order to get 2640
the best estimates as the basis for extrapolation. The uses of multiple information sources and 2641
established pharmacokinetic principles ensure the scientific basis of the proposed extrapolation 2642
approach. 2643
So this approach for the adjustment of existing WPs is most probably not inferior to the approach of 2644
the conduct of new residue depletion studies. 2645
As already pointed out, it should be noted that the third step in the proposed extrapolation-process is 2646
to apply the algorithm to each VMP separately. This would mean that the relative differences in the 2647
existing withdrawal periods will remain, not only to ensure minimal disturbance of the market whilst 2648
maintaining consumer protection, but also to take into account the potential effect of the formulation 2649
on the parameters influencing the (absorption) kinetics of the products. 2650
9.3. Addressing environmental risks by a data review approach 2651
9.3.1. Case studies analysis 2652
The environmental risk assessment for the case studies on amoxicillin in pigs and oxytetracycline in 2653
cattle turned out to be fairly easy. For amoxicillin, the doubling of the dose from 20 to 40 mg/kg bw 2654
per day for 5 days did obviously increase the PECs with a factor of 2. The Risk Quotients remained 2655
below 1 when the duration is maximally 5 days, and above 1 when the duration is 7 days. It was 2656
considered that the duration of 3-5 days may be sufficient for products with the same indication, which 2657
would justify the limitation of the duration to maximally 5 days, in order to limit the exposure to the 2658
environment. For oxytetracycline, there was already an ERA for a single dose of 20 mg/kg bw. Dose 2659
optimisation resulted in two regimens: 2 x 20 mg/kg bw for the LA formulations, or 5 x 10 mg/kg bw 2660
for the SA formulations, both of which would increase the environmental exposure as compared to the 2661
existing ERA. However, even with these posologies the Risk Quotients remained below 1, and therefore 2662
there was no trigger crossing and consequently no need to enter another Phase or Tier of the ERA. 2663
9.3.2. Conclusions on the ERA data review 2664
A data review approach was set up and tested in two case studies. The case studies showed that the 2665
data review approach was feasible, and that there were no additional concerns for the environment 2666
with the new optimised doses. This conclusion was reached without the need for additional 2667
experimental studies. 2668

Reflection paper on dose optimisation of established veterinary antibiotics in the context of SPC harmonisation
EMA/CVMP/849775/2017 Page 97/120
It has to be recognised that the case studies were easy in the sense that there was no trigger crossing 2669
when going from the current dose to the optimised dose. Therefore, the data review approach as 2670
outlined in chapter 5. , was not tested to the full extent. There may be other cases where the approach 2671
can be more challenging. Nevertheless, within the limitations of this pilot, the approach was successful. 2672
9.4. Addressing target animal safety by a data review approach 2673
9.4.1. Case study analysis 2674
The data review methodology proposed to address target animal safety was not followed 2675
comprehensively in the two case studies due to the lack of availability of pivotal study data for these 2676
old products from either pharmaceutical companies or regulatory agencies, and the time needed to 2677
perform searches to fill data gaps from publicly available material. Although the methodology could be 2678
time consuming, the expectation is that it would be followed until sufficient evidence is available to 2679
give confidence in the conclusions. 2680
In regards to the amoxicillin case study, only two proprietary TAS studies were available that, although 2681
not to current VICH requirements and performed in only a small number of animals, gave a reasonable 2682
level of evidence to support a margin of safety for the proposed revised dose in the target species. No 2683
specific studies could be found on a basic literature search to support field safety in pigs; however 2684
standard texts and reports representing use of the substance over decades in laboratory species and 2685
humans give reassurance of a wide margin of tolerance. It was possible to fully identify the target 2686
organs and toxic profile of the substance based on the totality of the data available. 2687
For the oxytetracycline case study, the CVM Freedom of Information summary reports provided the 2688
most informative data on systemic tolerance; although it has to be considered that this is only 2689
available in high level summary format. For oxytetracycline, the optimised dose regimens suggested by 2690
PK/PD modelling fell within the range of doses approved in the EU; however, the margin of safety for 2691
renal effects would have to be taken into account for any further dose increase. The proprietary studies 2692
provided to the project by industry related to injection site safety with the focus being on local 2693
tolerance and injection volume, rather than dose. These studies clearly highlighted that local tolerance 2694
is likely in practice to be the key dose-limiting factor for oxytetracycline injectable formulations, with 2695
some variability between different formulations according to excipient composition. 2696
For both the amoxicillin and oxytetracycline studies, no proprietary data were available from either 2697
field safety studies or post-marketing pharmacovigilance. Outside the pilot project scenario, these data 2698
should be sought to give greater confidence in the final conclusions. 2699
9.4.2. Conclusions on the TAS data review 2700
For the amoxicillin formulations, the data review approach can give reasonable confidence that the 2701
proposed dose increase to 40 mg amoxicillin /kg x 5 days in drinking water would be adequately 2702
tolerated in pigs for the treatment of respiratory disease. Amoxicillin is a well-established molecule 2703
with a wide margin of safety in many species and with further probing of dossiers sufficient data are 2704
likely to be available to draw conclusions on the safety of the dose increase in pigs. The oral 2705
formulations are administered as solutions and have relatively simple excipient formulations, and 2706
therefore safety can be extrapolated between them with a degree of confidence. 2707
Although no increase in dose outside of the EU-approved ranges was suggested for oxytetracycline 2708
injections, the possibility of a hypothetical dose increase was explored. As the margin of safety for the 2709
active substance is not large, further supporting data would have been needed beyond what could be 2710

Reflection paper on dose optimisation of established veterinary antibiotics in the context of SPC harmonisation
EMA/CVMP/849775/2017 Page 98/120
provided within the constraints of this pilot project. This may have been available from a wider review 2711
of product dossiers. For this case, the oxytetracycline injectable formulations are more complex than 2712
the oral amoxicillin solutions. The data review methodology identified that local injection site reactions 2713
may be dose-limiting in practice. Local tolerance can vary according to individual product composition 2714
and would have to be considered on a product-by-product basis; therefore proprietary studies would 2715
be required to establish the maximum injection volume where not already stated in a product’s SPC. 2716
Where data are not available, a default value could be established according to the worst case 2717
scenario. If restriction of injection volume would lead to an impractical number of injection sites, a 2718
simple risk management solution would be to limit the maximum bodyweight of animal to be treated. 2719
In conclusion, use of the data review approach would be possible for this case, but the need for 2720
individual product review could be burdensome. 2721
9.5. Regulatory processes to effectuate the harmonisation of the product 2722
literature 2723
The main purpose of the pilot project was to develop and test a novel approach for dose optimisation, 2724
WPs, ERA and TAS, without the need for conducting further experimental studies. This approach may 2725
be useful to review and improve the situation of established veterinary antibiotics where the 2726
authorised dose may not be effective anymore. At the same time, application of this approach will lead 2727
to a certain level of harmonisation between authorised products across the EU. In this respect, this 2728
approach can also be used as part of other regulatory harmonisation exercises (e.g. possibly initiated 2729
by future EU legislation on veterinary medicines). 2730
A number of general principles for the regulatory implementation of this approach and the related 2731
harmonisation of VMPs (discussed below) were defined, but the appropriate regulatory procedures, the 2732
appropriate legal basis, and other related legal issues were not defined or discussed. The latter points 2733
need further discussion. 2734
9.5.1. Selection of candidates 2735
Chapter 2.1. offers a method to select and prioritise (groups of) established veterinary antibiotics for 2736
which dose optimisation may be required. Application of this method allows putting resources where 2737
they are most needed, and provides clarity on the order at which the products will be reviewed, which 2738
would facilitate short and long term planning of related work at the sides of regulators and industry. 2739
9.5.2. Extent of harmonisation 2740
As explained above, the dose optimisation of products or groups of products will lead to a certain 2741
degree of harmonisation. The minimum desired level of harmonisation would be a harmonisation of 2742
individual products with authorisations in different Member States (i.e. at product level). This has been 2743
explained in chapter 2.2. (the hour glass method). However, because of the group-wise analysis, 2744
some aspects such as the optimised dose, may be applied to different products within the same group, 2745
as was done for the case studies with amoxicillin and oxytetracycline. This may in particular apply to 2746
similar products which have been licenses nationally some time ago, resulting in different summaries 2747
of product characteristics, but which are essentially similar. 2748
9.5.2.1. Same-product harmonisation 2749
The same product with authorisations in different Member States can have differences in the 2750
indications (i.e. inclusion of certain diseases), the causal organisms (i.e. inclusion of certain 2751

Reflection paper on dose optimisation of established veterinary antibiotics in the context of SPC harmonisation
EMA/CVMP/849775/2017 Page 99/120
pathogens), the dose, the withdrawal periods, and the special warnings and precautions for use. There 2752
are several possibilities for within-product harmonisation, and the selected level of harmonisation has 2753
consequences for the approaches to address dose, WP, ERA, and TAS, and for the final outcome. For 2754
example, one could calculate an optimised dose for each disease, or even per causal pathogen for 2755
these diseases, resulting in differentiated optimised doses that can be applied to the authorisations 2756
depending on which diseases/pathogens has been already licensed in the various Member States. 2757
However, such an approach would require many calculations for the doses and withdrawal periods, and 2758
may also have different outcomes for ERA and TAS, depending on the highest label dose. Moreover in 2759
practical terms this may not offer advantage since for first line antimicrobials treatment is often started 2760
before the causative pathogen has been identified and many infections (including respiratory disease) 2761
are syndromes with mixed bacterial etiology. In addition, differences of the SPC of the product 2762
between Member States would remain. Another possibility would be to aim for the largest possible 2763
denominator and thus l a full harmonisation per product. That would include the sum of all authorised 2764
indications/pathogens for which a dose optimisation was possible applied to all authorisations of this 2765
product across the EU, irrespective of the current indications authorised in the individual MSs. This 2766
approach is not only easier to apply but would maximise the availability of efficacious veterinary 2767
antibiotics for various diseases at the same time. A full harmonisation per product is preferred, 2768
resulting in identical SPCs in all MSs where the product is authorised. A full harmonisation also implies 2769
a single WP for meat and offal, and a single WPs for milk or eggs, where applicable. It should be noted 2770
that current WPs for the same product can be very different between MSs. Therefore, the 2771
establishment of a single WP will require the selection of a “Reference WP” that can be used as a 2772
starting point for the extrapolation. Is proposed that this Reference WP will be scientifically established 2773
on the basis of available residue data, and not on the shortest or the longest WP by default. 2774
9.5.2.2. Between-product harmonisation 2775
As explained in chapter 2.2. , there are scientific and practical reasons to harmonise at the level of 2776
individual products. Nevertheless, the analysis conducted according to the hour glass method may 2777
reveal that certain products in a group are so similar that for the same indication and the same 2778
species, the same optimised dose could apply. However, as indications can differ between products is 2779
proposed not to harmonise indications across these products. For example, if product A has only 2780
respiratory tract infections on the label, and similar product B has both respiratory tract infections and 2781
urinary tract infections on the label, then the respiratory tract infections could be harmonised between 2782
products when possible (i.e. they will have the same optimised dose), but product A will not get the 2783
urinary tract infections indication. In addition, is proposed that WPs are not harmonised across 2784
(similar) products. Where differences in excipient formulation could have an impact on local tolerance, 2785
this aspect needs to be considered on a product-specific basis. 2786
9.5.3. Level of assessment 2787
Established veterinary antibiotics have been authorised through national, decentralised, or mutual 2788
recognition procedures, and therefore have national marketing authorisations. Therefore, in principle, 2789
any changes to the marketing authorisations fall within the remit of the National Competent Authorities 2790
(NCAs). However, it should be noted that: 2791
the process of dose optimisation, WP, ERA and TAS requires input from National Competent 2792
Authorities through the authorisation dossiers from all MSs; 2793

Reflection paper on dose optimisation of established veterinary antibiotics in the context of SPC harmonisation
EMA/CVMP/849775/2017 Page 100/120
the process of dose optimisation, WP, ERA and TAS will result in a certain degree of harmonisation 2794
across the EU MSs and would be consistent with the well established principle of mutual 2795
recognition within the Community; 2796
the techniques for dose optimisation, WP, ERA and TAS must be applied in a consistent manner for 2797
all relevant (groups of) established veterinary antibiotics throughout the Community; 2798
the regulatory process of dose optimisation must be conducted in a consistent manner for all 2799
relevant (groups of) established veterinary antibiotics throughout the Community; 2800
the implementation of the outcome of the dose optimisation must be consistent across all MSs 2801
concerned. 2802
Therefore, it is advised that the organisation, assessment and decision will be executed at the central 2803
European level. Given the scientific nature of the work, the assessment could be well done in the 2804
CVMP. 2805
9.6. Need for further research 2806
One of the objectives of this project was to explore possibilities for funding under Horizon 2020 or 2807
other funding sources, for studies to fill gaps in data for off-patent veterinary antibiotics related to 2808
optimising dosing with respect to minimising risks from AMR where progress is not possible without 2809
generation of additional data. Non-experimental approaches for dose optimisation, WP, ERA and TAS 2810
were developped. It is envisaged that the data that are needed as input for these approaches will be 2811
available for the vast majority of the established veterinary antibiotics. Indeed, sufficient data was 2812
available to conduct the case studies for amoxicillin and oxytetracycline. The therefore it was 2813
concluded that considerable progress was made without the need for generation of additional data, and 2814
did not further investigate possibilities for funding. 2815
As explained in 9.1.3.5. , a dose derived by PK/PD analysis should ideally be confirmed by clinical data, 2816
however this cannot be expected in the context of improving the situation of the established veterinary 2817
antibiotics, for the reasons mentioned in chapter 1.1. . The same reasoning applies to the WP, ERA and 2818
TAS. In this context, it should be noted that the strength of the hour glass method is in the integration 2819
of data from all authorisation dossiers and other available data, providing a very data-rich basis for the 2820
modelling and review approaches. 2821
Whereas the PK/PD methodology allows for optimising the dose, it will not provide the answer to the 2822
question for how long the PTA should be reached for a clinical cure. Therefore, in principle, the length 2823
of treatment is not optimised using PK/PD modelling. As a result, the treatment duration will not be 2824
changed in principle. However, there may be cases where the PTA is reached only relatively shortly, in 2825
which case the treatment duration may need to be extended, although it is recognised that this 2826
extension can be somewhat arbitrary. In the case study for the LA oxytetracycline formulations, a 2827
second dose was introduced to achieve the PTA to be reached for at least 3 days. In order to 2828
strengthen decisions related to treatment duration, collection and/or generation of scientific data on 2829
this aspect will be helpful. 2830
10. CVMP Recommendations 2831
1. It is recommended that there is a continued dialogue between regulators and industry to discuss 2832
the possible procedures and legal implications in relation to the implementation of the 2833
recommendations of this report. 2834

Reflection paper on dose optimisation of established veterinary antibiotics in the context of SPC harmonisation
EMA/CVMP/849775/2017 Page 101/120
2. It is recommended that the implementation of the recommendations of this report will take place 2835
at the central level, i.e. that CVMP will conduct the scientific assessment. It was noted that the 2836
outcome could result in an e.g. Commission Decision. 2837
3. It is recommended to develop a clear procedure to establish a list of the candidate products for 2838
dose optimisation, with a prioritisation of these candidates, in line with the principles discussed in 2839
chapter 2 of this report. In establishing the actual list, it is recommended that relevant 2840
stakeholders are consulted. For example, the FVE can be consulted to obtain information of 2841
dosages used in the field, and VetCAST can be consulted to obtain information products for which, 2842
according to their knowledge, the current dosing regimens is not in line with PK/PD principles. 2843
4. It is recommended that selected candidate products for dose optimisation are grouped at the 2844
animal-species-disease-route of administration-pharmaceutical form level. 2845
5. It is recommended to follow the hour glass approach (see chapter 2) for collection and integration 2846
of data and for the application of model outputs. 2847
6. It is recommended that procedures for dose optimisation, withdrawal periods, ERA, and TAS, result 2848
in harmonisation at product level and where applicable also between similar products as outlined in 2849
paragraph 9.5.2.2 . 2850
7. It is recommended that the dose optimisation and the consideration of withdrawal period, ERA, and 2851
TAS, are conducted in accordance with the principles presented in chapters 3, 4, 5, and 6 of this 2852
report. 2853
11. Glossary 2854
ADME Absorption, Distribution, Metabolism, Excretion 2855
AE Adverse Event: any observation in animals, whether or not considered to be 2856
product-related, that is unfavourable and unintended and that occurs after any use 2857
of VMP (off-label and on-label uses). Included are events related to a suspected 2858
lack of expected efficacy according to approved labelling or noxious reactions in 2859
humans after being exposed to VMP(s). 2860
AMEG Antimicrobial Advice Ad Hoc Expert Group 2861
AUC Area Under the Curve: the total concentration integrated over a given time interval 2862
AMR Antimicrobial resistance 2863
B/R assessment Benefit-risk assessment: A process of assessing benefits and risks in accordance to 2864
the benefit-risk assessment policy. This assessment includes the mitigation of risks 2865
from a proposal of benefit-risk management options. The benefit-risk balance is 2866
the outcome of the benefit-risk assessment. 2867
CBP Clinical breakpoint: A selected MIC value to distinguish between treatable and 2868
non-treatable organisms 2869
CLSI Clinical and Laboratory Standards Institute 2870
Cmax The maximum (or peak) serum concentration that a product achieves in a 2871
specified compartment or test area of the body after the product has been 2872
administrated 2873

Reflection paper on dose optimisation of established veterinary antibiotics in the context of SPC harmonisation
EMA/CVMP/849775/2017 Page 102/120
CVMP Committee for Medicinal Products for Veterinary Use 2874
DDDvet Defined Daily Doses for Animals; The DDDvet is the assumed average dose per kg 2875
animal per species per day 2876
Dose optimisation A process using established PK/PD modelling techniques that defines a dosing 2877
regimen where an adequate ionised concentration of the antimicrobial active 2878
substance would accumulate at the target site and at a predictable concentration 2879
above modern MIC values for the target pathogen(s). 2880
ECOFF Epidemiological cut-off value: measures of a antibiotic MIC distribution that 2881
separate bacterial populations into those representative of a wild type population, 2882
and those with acquired or mutational resistance to the molecule. 2883
EGGVP European Group for Generic Veterinary Products 2884
EMA European Medicines Agency 2885
ERA Environmental Risk Assessment 2886
EUCAST The European Committee on Antimicrobial Susceptibility Testing 2887
FARAD Food Animal Residue Avoidance Databank. FARAD is part of the Food Animal 2888
Residue Avoidance & Depletion Program in the US, which has served the 2889
veterinary profession for more than 35 years. FARAD is supported by the USDA 2890
National Institute of Food and Agriculture (NIFA). 2891
f free or unbound fraction 2892
GLP Good Laboratory Practice 2893
GRAS list A list of substances that are generally recognised as safe. This list is available on 2894
the website of the US Food and Drug Administration (FDA): 2895
https://www.fda.gov/Food/IngredientsPackagingLabeling/GRAS/ 2896
Horizon 2020 Horizon 2020 is a EU Research and Innovation programme with nearly €80 billion 2897
of funding available over 7 years (2014 to 2020) 2898
LA long acting 2899
MAH Marketing Authorisation Holder: A person or entity who/which holds the 2900
authorisation of a VMP. 2901
MBC Minimum Bactericidal Concentration 2902
MIC Minimum Inhibitory Concentration: the lowest concentration of a chemical which 2903
prevents visible growth of a bacterium. 2904
MOS Margin Of Safety, also called the therapeutic window (or pharmaceutical window) 2905
of a product, is the range of dosages which can treat disease effectively without 2906
having toxic effects. 2907
MRL Maximum Residue Limit. The maximum concentration of residue resulting from the 2908
use of a veterinary medicinal product (expressed in mg/kg or μg/kg on a fresh 2909
weight basis) which may be accepted by the Union to be legally permitted or 2910
recognised as acceptable in or on a food. 2911
MS Member State of the European Union 2912

Reflection paper on dose optimisation of established veterinary antibiotics in the context of SPC harmonisation
EMA/CVMP/849775/2017 Page 103/120
NCA National Competent Authority 2913
OECD Organisation for Economic Co-operation and Development 2914
OIE World Organization for Animal Health 2915
ORTD Original Recommended Treatment Dose 2916
PBT Persistent, Bioaccumulative and Toxic 2917
PEC Predicted Environmental Concentration 2918
PD Pharmacodynamics 2919
PDI PK/PD-index: The quantitative relationship between a pharmacokinetic parameter 2920
(such as AUC, peak level) and a microbiological parameter (such as MIC) 2921
PDT target value of the PK/PD index 2922
PK Pharmacokinetics 2923
PK/PD modelling A technique that combines the two classical pharmacologic disciplines of 2924
pharmacokinetics and pharmacodynamics. It integrates a pharmacokinetic and a 2925
pharmacodynamic model component into one set of mathematical expressions that 2926
allows the description of the time course of effect intensity in response to 2927
administration of a product dose. 2928
PNEC Predicted No Effect Concentration 2929
PSUR Periodic Safety Update Report: A periodical scientific report on adverse events and 2930
other issues within the scope of pharmacovigilance that have been reported to a 2931
MAH during a specific period. 2932
PTA Probability of Target Attainment 2933
QSAR Quantitative Structural Activity Relationship 2934
Read across Read-across is a technique for predicting endpoint information for one substance, 2935
by using data from the same endpoint from (an)other substance(s). 2936
RMM Risk Mitigation Measure 2937
RQ Risk Quotient, i.e. PEC/PNEC ratio 2938
SA short acting 2939
Signal Detection A pharmacovigilance procedure to detect safety signals. A safety signal is 2940
information on a new or known adverse event that may be caused by a medicine 2941
and requires further investigation. 2942
SPC Summary of Product Characteristics 2943
TAS Target Animal Safety 2944
vPvB very Persistent and very Bioaccumulative 2945
VCIA Veterinary Critically Important Antimicrobial Agents 2946
VHIA Veterinary Highly Important Antimicrobial Agents 2947
VIA Veterinary Important Antimicrobial Agents 2948

Reflection paper on dose optimisation of established veterinary antibiotics in the context of SPC harmonisation
EMA/CVMP/849775/2017 Page 104/120
VICH VICH is a trilateral (EU-Japan-USA) programme aimed at harmonising technical 2949
requirements for veterinary product registration. Its full title is the International 2950
Cooperation on Harmonisation of Technical Requirements for Registration of 2951
Veterinary Medicinal Products. 2952
VMP Veterinary Medicinal Product 2953
WFD Directive 2000/60/EC of the European Parliament and of the Council establishing a 2954
framework for the Community action in the field of water policy. In short: EU 2955
Water Framework Directive. 2956
WP Withdrawal Period. The withdrawal period is the time after the last administration 2957
of the veterinary medicinal product during which the animal must not be 2958
slaughtered or during which milk or eggs must not be taken for human 2959
consumption, ensuring that residues will not exceed the MRLs. 2960
WT wild type 2961
2962

Reflection paper on dose optimisation of established veterinary antibiotics in the context of SPC harmonisation
EMA/CVMP/849775/2017 Page 105/120
12. References 2963
Achenbach, T.E. (2000). Physiological and classical pharmacokinetic models of oxytetracycline in 2964
cattle. Thesis, Simon Fraser University. 2965
ANSES Scientific report 2014-SA-0080 (2017). Working Group on the Methodology for revising the 2966
dosages of older antibiotics. 2967
Agersø, H., & Friis, C. (1998a). Bioavailability of amoxycillin in pigs. Journal of Veterinary 2968
Pharmacology and Therapeutics 21: 41-46. 2969
Agersø, H., & Friis, C. (1998b). Penetration of amoxycillin into the respiratory tract tissues and 2970
secretions in pigs. Research in Veterinary Science 64: 245-250. 2971
Ahmad, I., Huang, L., Hao, H., Sanders, P., & Yuan, Z. (2016). Review Article Application of PK/PD 2972
Modeling in Veterinary Field: Dose Optimization and Drug Resistance Prediction. BioMed Research 2973
International Article ID 5465678. 2974
Ambrose, P.G., Bhavnani, S.M., Rubino, C.M., Louie, A., Gumbo, T., Forrest, A., & Drusano, G.L. 2975
(2007). Pharmacokinetics-pharmacodynamics of antimicrobial therapy: It's not just for mice 2976
anymore. Clinical Infectious Diseases 44(1): 79-86. 2977
Andes, A., & Craig, W.A. (2007) Pharmacokinetics and Pharmacodynamics of Tetracyclines. In: 2978
Antimicrobial Pharmacodynamics in Theory and Clinical Practice. Ed: Charles H. Nightingale et al., 2979
2nd edition. 2980
Barbour A., Scaglione F., & Derendorf, H. (2010). Class-dependent relevance of tissue distribution 2981
in the interpretation of anti-infective pharmacokinetic/pharmacodynamic indices. Int J Antimicrob 2982
Agents. 35(5):431-8. 2983
Brentnall, C., Cheng, Z., McKellar, Q.A., & Lees, P. (2013). Pharmacokinetic-pharmacodynamic 2984
integration and modelling of oxytetracycline administered alone and in combination with carprofen 2985
in calves. Res Vet Sci. 94(3):687-94 2986
Burch, D.G.S., & Sperling, D. (2018). Amoxicillin—current use in swine medicine. Journal of 2987
veterinary pharmacology and therapeutics, 1-13 (DOI: 10.1111/jvp.12482) 2988
Cantón, R., & Morosini, M.I. (2011). Emergence and spread of antibiotic resistance following 2989
exposure to antibiotics. FEMS Microbiol Rev. 35(5):977-91. 2990
Clarke, C.R., Wang, Z., Cudd, L., Burrows, G.E., Kirkpatrick, J.G., & Brown, M.D. (1999). 2991
Pharmacokinetics of two long-acting oxytetracycline products administered subcutaneously and 2992
intramuscularly. Journal of veterinary pharmacology and therapeutics, 22(1), 65. 2993
Company A: Determination of the maximum solubility of the product Amoxicillin 80% Oral Powder 2994
in drinking water. 2995
Company B (1): Comparative pharmacokinetic data after oral administration of amoxicillin at 2996
various doses and dosing schedules to pigs. 2997
Company B (2): Residue depletion of amoxicillin in pigs after oral administration at a dose of 10 2998
mg/kg bw and 20 mg/kg bw once for 5 consecutive days. 2999
Craig, W.A. (1998). Pharmacokinetic/pharmacodynamic parameters: rationale for antibacterial 3000
dosing of mice and men. Clin Infet Dis. 26(1):1-10. 3001
Reflection paper on dose optimisation of established veterinary antibiotics in the context of SPC harmonisation
EMA/CVMP/849775/2017 Page 106/120
Dai, C., Zhao, T., Yang, X., Xiao, X., Velkov, T., & Tang, S. (2017). Pharmacokinetics and relative 3002
bioavailability of an oral amoxicillin-apramycin combination in pigs. PloS one, 12(4): e0176149. 3003
De Baere, S., Cherlet, M., Baert, K., & De Backer, P. (2002). Quantitative analysis of amoxycillin 3004
and its major metabolites in animal tissues by liquid chromatography combined with electrospray 3005
ionization tandem mass spectrometry. Analytical Chemistry, 74: 1393–1401. 3006
De Jong, A., Thomas, V., Simjee, S., Moyaert, H., El Garch, F., Maher, K., Morrissey, I. Butty, P., 3007
Klein, U., Marion, H., Rigaut, D., & Vallé, M. (2014). Antimicrobial susceptibility monitoring of 3008
respiratory tract pathogens isolated from diseased cattle and pigs across Europe: the VetPath 3009
study. Veterinary microbiology, 172(1-2), 202-215. 3010
Dorey, L., Hobson, S., & Lees, P., (2017). What is the true in vitro potency of oxytetracycline for 3011
the pig pneumonia pathogens Actinobacillus pleuropneumoniae and Pasteurella multocida? Journal 3012
of Veterinary Pharmacology and Therapeutics, 40: 517-529. 3013
Dorey L., & Lees P., (2017). Impact of growth matrix on pharmacodynamics of antimicrobial drugs 3014
for pig pneumonia pathogens. BMC Veterinary Research, 13:192 3015
Drusano, G.L. (2016). From lead optimization to NDA approval for a new antimicrobial: Use of pre-3016
clinical effect models and pharmacokinetic/pharmacodynamic mathematical modelling. Bioorganic 3017
and Medicinal Chemistry 24(24): 6401-6408. 3018
El Garch, F., de Jong, A., Simjee, S., Moyaert, H., Klein, U., Ludwig, C., Marion, H., Haag-3019
Diergarten, S., Richard-Mazet, A., Thomas, V., & Siegwart, E. (2016). Monitoring of antimicrobial 3020
susceptibility of respiratory tract pathogens isolated from diseased cattle and pigs across Europe, 3021
2009–2012: VetPath results. Veterinary microbiology, 194: 11-22. 3022
EMA/CVMP (1995). Note for guidance: Approach towards harmonisation of withdrawal periods. 3023
Committee for Veterinary Medicinal Products. (EMEA/CVMP/036/95-FINAL) 3024
EMA/CVMP (1996). MRL assessment report for penicillin. Committee for Veterinary Medicinal 3025
Products. 3026
EMA/CVMP (1998). Note for guidance for the determination of withdrawal periods for milk. 3027
Committee for Veterinary Medicinal Products. (EMEA/CVMP/473/98-FINAL) 3028
EMA/CVMP (2016) Guideline for the demonstration of efficacy for veterinary medicinal products 3029
containing antimicrobial substances. (EMA/CVMP/627/2001-Rev.1) 3030
EMA/CVMP (2017). Revised guideline on the conduct of bioequivalence 4 studies for veterinary 3031
medicinal products. (EMA/CVMP/EWP/016/00-Rev.3) 3032
FARAD (1997a). ANADA(1) 113-232. FARAD database 3033
FARAD (1997b). ANADA(3) 097-452. FARAD database 3034
FARAD (1999). ANADA(6) 200-008. FARAD database 3035
Ferran A.A., Liu J., Toutain P.L., & Bousquet-Mélou A. (2016). Comparison of the In vitro Activity of 3036
Five Antimicrobial Drugs against Staphylococcus pseudintermedius and Staphylococcus aureus 3037
Biofilms. Front Microbiol. 7:1187 3038
Fischer, C.D., Beatty, J.K., Zvaigzne, C.G., Morck, D.W., Lucas, M.J., & Buret, A.G. (2011). Anti-3039
Inflammatory benefits of antibiotic-induced neutrophil apoptosis: tulathromycin induces caspase-3-3040
Reflection paper on dose optimisation of established veterinary antibiotics in the context of SPC harmonisation
EMA/CVMP/849775/2017 Page 107/120
dependent neutrophil programmed cell death and inhibits NF-kappaB signaling and CXCL8 3041
transcription. Antimicrobial Agents and Chemotherapy, 55(1):338-48. 3042
Gjini, E. & Brito, P.H. (2016). Integrating Antimicrobial Therapy with Host Immunity to Fight Drug-3043
Resistant Infections: Classical vs. Adaptive Treatment. PLoS Comput Biol. 12(4):e1004857. 3044
Godoy, C., Castells, G., Martí, G., Capece, B.P.S., Colom, H., & Cristòfol, C. (2011). Influence of a 3045
pig respiratory disease on the pharmacokinetic behaviour of amoxicillin after oral ad libitum 3046
administration in medicated feed. Journal of Veterinary Pharmacology and Therapeutics, 34: 235-3047
276. 3048
Griffin, D.D., Morter, R.L., Amstutz, H.E., & Boon, G.D. (1979). Experimental oxytetracycline 3049
toxicity in feedlot heifers. Bovine Pract, 14: 37-41. 3050
Hekman, P., & Schefferlie, G.J. (2011) Kinetic modelling and residue depletion of drugs in eggs. 3051
British Poultry Science, 52(3), 376-380 3052
Hernandez, E., Rey, R., Puig, M., Garcia, M.A., Solans, C., & Bregante, M.A. (2005). 3053
Pharmacokinetics and residues of a new oral amoxicillin formulation in piglets: a preliminary study. 3054
The Veterinary Journal, 170: 237-242. 3055
JECFA (2011). Residue evaluation of certain vetrinary drugs, Joint FAO/WHO Expert Committee on 3056
Food Additives, 75th Meeting. 3057
JECFA (2017). Residue evaluation of certain vetrinary drugs, Joint FAO/WHO Expert Committee on 3058
Food Additives, 85th Meeting. 3059
Krasucka, D., & Kowalski, C.J. (2010). Pharmacokinetic parameters of amoxicillin in pigs and 3060
poultry. Acta Poloniae Pharmaceutica, 6: 729-732. 3061
Kristoffersson, A.N., David-Pierson, P., Parrott, N.J., Kuhlmann, O., Lave, T., Friberg, L.E., & 3062
Nielsen, E.I. (2016). Simulation-Based Evaluation of PK/PD Indices for Meropenem Across Patient 3063
Groups and Experimental Designs. Pharmaceutical Research, 33: 1115-1125. 3064
Lairmore, M.D., Alexander, A.F., Powers, B.E., Milisen, W.B., McChesney, A.E., & Spraker, T.S. 3065
(1984). Oxytetracycline-associated nephrotoxicosis in feedlot calves. Journal of the American 3066
Veterinary Medical Association, 185(7): 793-795. 3067
Lees, P., Potter T., Pelligand L., & Toutain, P.L. (2018). Pharmacokinetic-pharmacodynamic 3068
integration and modelling of oxytetracycline for the calf pathogens Mannheimia haemolytica and 3069
Pasteurella multocida. Journal of Veterinary Pharmacology and Therapeutics, 41: 28-38 3070
Lees, P., Pelligand, L., Illambas, J., Potter, T., Lacroix, M., Rycroft, A., & Toutain, P.-L. (2015). 3071
Pharmacokinetic/pharmacodynamic integration and modelling of amoxicillin for the calf pathogens 3072
Mannheimia haemolytica and Pasteurella multocida. Journal of Veterinary Pharmacology and 3073
Therapeutics 38(5): 457-470. 3074
Lees, P., Concordet, D., Aliabadi F.S., & Toutain, P.-L. (2006). Drug selection and optimization of 3075
dosage schedules to minimize antimicrobial resistance. In: Antimicrobial Resistance in Bacteria of 3076
Animal Origin. Ed. by Frank M. Aarestrup, ASM Press, Washington, D.C. 3077
Liu, Y.N., Pang, M.D., Xie, X., Xie, K.Z., Cui, L.L., Gao, Q., Liu, J.-Y., Wang, B., Zhang, Y.-Y., 3078
Wang, R., Zhang, G.X., Dai, G.-J., & Wang, J.-Y. (2017). Residue depletion of amoxicillin and its 3079
major metabolites in eggs. Journal of veterinary pharmacology and therapeutics, 40(4): 383-391 3080

Reflection paper on dose optimisation of established veterinary antibiotics in the context of SPC harmonisation
EMA/CVMP/849775/2017 Page 108/120
Malreddy, P.R., Coetzee, J.F., KuKanich, B., & Gehring, R. (2013). Pharmacokinetics and milk 3081
secretion of gabapentin and meloxicam co‐administered orally in Holstein‐Friesian cows. Journal of 3082
veterinary pharmacology and therapeutics, 36(1): 14-20 3083
Manning, L., Laman, M., Greenhill, A.R., Michael, A., Siba, P., Mueller, I. & Davis, T.M.E. (2011). 3084
Increasing chloramphenicol resistance in Streptococcus pneumoniae isolates from Papua New 3085
Guinean children with acute bacterial meningitis. Antimicrobial Agents and Chemotherapy, 55: 3086
4454–4456. 3087
Martin-Jimenez, T., Baynes, R.E., Craigmill, A., & Riviere, J.E. (2002). A Quantitative Approach to 3088
Establishing Extra-label Withdrawal Times. Regulatory Toxicology and Pharmacology, 36: 131–137 3089
Martínez-Larrañaga, M.R., Anadón, A., Martínez, M.A., Díaz, M.J., Frejo, M.T., Castellano, V.J., 3090
Isea, G., & de la Cruz, C.O. (2004). Pharmacokinetics of amoxicillin and the rate of depletion of its 3091
residues in pigs. Veterinary Record, 154: 627-632 3092
Meijer, L.A., Ceyssens, K.G.F., de Jong, W., & Greve, B.D. (1993). Three phase elimination of 3093
oxytetracycline in veal calves; the presence of an extended terminal elimination phase. Journal of 3094
veterinary pharmacology and therapeutics, 16(2), 214-222. 3095
Menotta, S., Pini, P., Fedrizzi, G., Bortolazzi, P., Quintavall, F., & Alborali, G. (2012). Bioavailability 3096
of coated amoxicillin in pigs field experiences. Large Animal Review, 18: 253-258. 3097
Mevius, D.J., Nouws, J.F.M., Breukink, H.J., Vree, T.B., Driessens, F., & Verkaik, R. (1986). 3098
Comparative pharmacokinetics, bioavailability and renal clearance of five parenteral 3099
oxytetracycline‐20% formulations in dairy cows. Veterinary Quarterly, 8(4), 285-294. 3100
Moore R.D., Smith C.R., & Lietman P.S. (1984). The association of aminoglycoside plasma levels 3101
with mortality in patients with gram-negative bacteremia. J Infect Dis., 149(3):443-8. 3102
Mouton, J.W., Brown, D.F.J., Apfalter, P., Cantón, R., Giske, C.G., Ivanova, M., MacGowan, A.P., 3103
Rodloff, A., Soussy, C.J., Steinbakk, M., & Kahlmeter G. (2012). The role of 3104
pharmacokinetics/pharmacodynamics in setting clinical MIC breakpoints: The EUCAST approach. 3105
Clinical Microbiology and Infection, 18(3): E37-E45. 3106
Mouton, J.W., Dudley, M.N., Cars, O., Derendorf, H., & Drusano, G.L. (2005). Standardization of 3107
pharmacokinetic/pharmacodynamic (PK/PD) terminology for anti-infective drugs: An update. 3108
Journal of Antimicrobial Chemotherapy, 55(5): 601-607. 3109
MSD Animal Health (1991). Pharmacokinetics of amoxicillin in pigs after oral administration, study 3110
42. 3111
MSD Animal Health (1992). Pharmacokinetics of amoxicillin in pigs after repeated oral 3112
administration, study 47. 3113
Mrvos, R., Pummer, T.L., & Krenzelok, E.P. (2013). Amoxicillin renal toxicity: how often does it 3114
occur?. Pediatric emergency care, 29(5): 641-643. 3115
Nielsen, E.I., Cars, O., & Friberg, L.E. (2011). Pharmacokinetic/pharmacodynamic (PK/PD) indices 3116
of antibiotics predicted by a semimechanistic PKPD model: a step toward model-based dose 3117
optimization. Antimicrobial Agents and Chemotherapy, 55: 4619-4630. 3118
Nielsen E.I., & Friberg L.E. (2013). Pharmacokinetic-pharmacodynamic modelling of antibacterial 3119
drugs. Pharmacol Rev., 65(3):1053-1090. 3120
Reflection paper on dose optimisation of established veterinary antibiotics in the context of SPC harmonisation
EMA/CVMP/849775/2017 Page 109/120
Nouws, J.F.M., Ginneken, C.V., & Ziv, G. (1983). Age‐dependent pharmacokinetics of 3121
oxytetracycline in ruminants. Journal of veterinary pharmacology and therapeutics, 6(1), 59-66. 3122
Nouws, J.F.M., Breukink, H.J., Binkhorse, G.J., Lohuis, J., Van Lith, P., Mevius, D.J., & Vree, T.B. 3123
(1985). Comparative pharmacokinetics and bioavailability of eight parenteral oxytetracycline‐10% 3124
formulations in dairy cows. Veterinary Quarterly, 7(4), 306-314. 3125
Nouws, J.F.M., Smulders, A., & Rappalini, M. (1990). A comparative study on irritation and residue 3126
aspects of five oxytetracycline formulations administered intramuscularly to calves, pigs and 3127
sheep. Veterinary Quarterly, 12(3), 129-138. 3128
Plumb, D.C. (2008). Plumb's veterinary drug handbook. Ames, Iowa: Blackwell Publishing 3129
Prescott, J. F., & Dowling, P. M. (Eds.). (2013). Antimicrobial therapy in veterinary medicine. John 3130
Wiley & Sons. 3131
Rey, J.F., Laffont, C.M., Croubels, S., De Backer, P., Zemirline, C., Bousquet, E., Guyonnet, J., 3132
Ferran, A.A., Bousquet-Melou, A., & Toutain, P.-L. (2014). Use of Monte Carlo simulation to 3133
determine pharmacodynamic cutoffs of amoxicillin to establish a breakpoint for antimicrobial 3134
susceptibility testing in pigs. American Journal of Veterinary Research, 75(2): 124-131. 3135
Reyns, T., De Boever, S., De Baere, S., De Backer, P., & Croubels, S. (2007). Tissue depletion of 3136
amoxicillin and its major metabolites in pigs: influence of the administration route and the 3137
simultaneous dosage of clavulanic acid. Journal of agricultural and food chemistry, 56: 448-454. 3138
Reyns, T., de Boever, S., Schauvliege, S., Gasthuys, F., Meissonnier, G., Oswald, I., de Backer, P., 3139
& Croubels, S. (2008). Influence of administration route on the biotransformation of amoxicillin in 3140
the pig. Journal of Veterinary Pharmacology and Therapeutics, 32: 241-248. 3141
Riond, J.L., & Riviere, J.E. (1989). Effects of tetracyclines on the kidney in cattle and dogs. Journal 3142
of the American Veterinary Medical Association, 195(7): 995. 3143
Schwarz, S., Boettner, A., Goosens, L., Mohamed Hafez, H., Hartmann, K., Kaske, M., Kehrenberg, 3144
C., Kietzmann, M., Klarmann, D., Klein, G., Krabisch, P., Luhofer, G., Richter, A., Schulz, B., Sigge, 3145
C., Waldmann, K.-H., Wallmann, J., & Werckenthin, C. (2008). A proposal of clinical breakpoints 3146
for amoxicillin applicable to porcine respiratory tract pathogens. Veterinary Microbiology, 126: 3147
178-188. 3148
Schentag J.J. (1990). Correlation of pharmacokinetic parameters to efficacy of antibiotics: 3149
relationships between serum concentrations, MIC values, and bacterial eradication in patients with 3150
gram-negative pneumonia. Scand J Infect Dis Suppl. 74:218-34. 3151
Soraci, A.L., Amanto, F., Tapia, M.O., de la Torre, E., & Toutain, P.-L. (2014). Exposure variability 3152
of fosfomycin administered to pigs in food or water: impact of social rank. Res Vet Sci., 96(1):153-3153
9. 3154
TerHune, T.N., & Upson, D.W. (1989). Oxytetracycline pharmacokinetics, tissue depletion, and 3155
toxicity after administration of a long-acting preparation at double the label dosage. Journal of the 3156
American Veterinary Medical Association, 194(7): 911-917. 3157
Toutain, P.-L., & Raynaud, J.P. (1983). Pharmacokinetics of oxytetracycline in young cattle: 3158
comparison of conventional vs long-acting formulations. American journal of veterinary research, 3159
44: 1203-1209. 3160

Reflection paper on dose optimisation of established veterinary antibiotics in the context of SPC harmonisation
EMA/CVMP/849775/2017 Page 110/120
Toutain P.L., & Bousquet-Mélou, A. (2002). Free drug fraction vs free drug concentration: a matter 3161
of frequent confusion. Journal of Veterinary Pharmacology and Therapeutics, 25:460-463. 3162
Toutain P.-L., Bousquet-Mélou, A., Damborg, P., Ferran, A., Mevius, D., Pelligand, L., Veldman, 3163
K.T., & Lees, P. (2017). En Route towards European Clinical Breakpoints for Veterinary 3164
Antimicrobial Susceptibility Testing: A Position Paper Explaining the VetCAST Approach. Front 3165
Microbiol, 8:2344. 3166
Turnidge, J., Kalhmeter, G., & Kronvall, G. (2006). Statistical characterisation of bacterial wild-type 3167
MIC value distributions and the determination of epidemiological cut-off values. Clin Microbiol 3168
Infect, 12:418-25. 3169
Vaala, W.E., Ehnen, S.J., & Divers, T.J. (1987). Acute renal failure associated with administration 3170
of excessive amounts of tetracycline in a cow. Journal of the American Veterinary Medical 3171
Association, 191(12): 1601-1603. 3172
Zhao, X., & Drlica, K. (2001). Restricting the selection of antibiotic-resistant mutants: a general 3173
strategy derived from fluoroquinolone studies. Clin Infect Dis, 33 Suppl 3: S147-S156. 3174

Reflection paper on dose optimisation of established veterinary antibiotics in the context of SPC harmonisation
EMA/CVMP/849775/2017 Page 111/120
13. Annexes 3175
Annex 1 3176
Data available 3177
From MAA applications, extensions, variations
Study type Main objective Design Further objectives
Pharmacodynamic
studies
Mode of action
MIC distribution by
pathogens
Time-kill curves
MIC
MBC
MIC50, MIC90, %R
Pharmacokinetic
studies
*Characterize the
pharmacokinetics of
the active substance
(*products with different
formulations might have
different PK profiles and
therefore might need
specific PK/PD
approaches)
Characterize the
bioavailability of the
active substances
according the route
and mode of
administration and the
drug formulation
Healthy animals
Intravenous route
Route of administration
Final formulation (or
close)
Plasma kinetics
Dose determination
Bioequivalence study Comparison with
reference product
Healthy animals
Cmax, AUC
Post-marketing experience
Data source Content Considerations
Literature search
Antimicrobial
susceptibility survey
MIC distribution By region, period
Sample origin
Method
Time-kill curves Antimicrobial effect
along time
Design
Inoculum size
Culture conditions
(media, O2/C02)
Pharmacokinetic
studies
Animal species
Population
pharmacokinetics
Products may be used at
different doses.
Sampling scheme
Analytical method
PK analysis
PK/PD studies Animal species
Bacterial species
Experimental model
Products may be used at
different doses
Animal characteristics
Reflection paper on dose optimisation of established veterinary antibiotics in the context of SPC harmonisation
EMA/CVMP/849775/2017 Page 112/120
From MAA applications, extensions, variations
Mode of administration
Sampling scheme
Analytical method
PK/PD analysis
3178

Reflection paper on dose optimisation of established veterinary antibiotics in the context of SPC harmonisation
EMA/CVMP/849775/2017 Page 113/120
Annex 2 3179
Definition of important PK, PD and PK/PD indices (from Ahmad et al., 2016) 3180
PK/PD index Definition Unit References
Pharmacodynamics
MIC The minimal inhibitory concentration is
defined as the lowest
concentration of antibiotic that inhibits
completely the growth of the
specific organism being tested.
mg/L or 𝜇g/mL Mouton et al., 2005
[34]
MBC MBC is the lowest concentration at which
99.9% reduction in
bacterial count is achieved
mg/L or 𝜇g/mL Tayler et al., 1983
[44]
MPC MPC (mutant prevention concentration): the
lowest concentration
that prevents the emergence of mutants
after 120 hours of incubation
mg/L or 𝜇g/mL Shimizu et al.,
2013 [45]
PAE Postantibiotic effect is the time of
suppression of bacterial growth
after the bacteria are exposed to
antibacterial for a short time
Time (h) Mouton et al., 2005
[34]
Pharmacokinetics
AUC The area under the concentration time
curve over 24 h at steady state
unless otherwise stated. It is equivalent to a
single dose AUC0−∞
𝜇g⋅h/mL Mouton et al., 2005
[34]
𝑓 Prefix indicating that the pharmacokinetic
parameter values or
PK/PD index values used are unbound (free)
fractions of the drug
𝐶Max The highest concentration of drug reached
or estimated in the
compartment of reference
mg/L or 𝜇g/mL Mouton et al., 2005
[34]
PK/PD integration
𝑇 > MIC The cumulative percentage of 24 h period in
which the drug
concentration exceeds the MIC at steady
state pharmacokinetic
condition
% Mouton et al., 2005
[34]
AUC/MIC The area under the concentration time
curve divided by MIC
No unit Mouton et al., 2005
[34]
𝐶Max/MIC The peak concentration of drug divided by
MIC
No unit Mouton et al., 2005
[34]
3181

Reflection paper on dose optimisation of established veterinary antibiotics in the context of SPC harmonisation
EMA/CVMP/849775/2017 Page 114/120
Annex 3 3182
Withdrawal Periods of various products authorised in the EU Member States 3183
Trade name Country Posology for pigs WP for pigs (days)
Amoxi-Mix 10%-lösliches
Pulver zum Eingebne für Tiere
AT 20 mg amoxicillin/kg day about
5-7 days
14
Suramox 50 % - lösliches
Pulver zum Eingeben für
Schweine XL
AT 20 mg/kg (400mg powder/10
kg)
14
Tamox - Granulat für Tiere XL AT 10 g Tamox-granules / 50 kg =
10 mg Amoxicillin/kg 2 times
per day about 2 - 5 days
14
3184
Trade name Country Posology for pigs WP for pigs (days)
Moxapulvis 15% BE 20 mg amoxicillin/kg, 2 times/day 1
Amoxycilline 70% BE 10-20 mg/kg/d for 4-5 d 2
Dokamox 80%
ecuphar
BE 10 mg/kg 2 times/d or 20 mg /kg
once a day for 3-5 d
5
3185
Trade name Country Posology for pigs WP for pigs (days)
Aciphen DE 2-10 mg/kg KGW über 2-5 Tage 3
Amoxanil 200 F DE 10 mg/kg KGW 2x tgl. über 3-5
Tage
3
Amoxanil 200 F-AMV DE 10 mg/kg KGW 2x tgl. über 3-5
Tage
3
Amoxicillin 2,5
almapharm
DE 2-10 mg 2x tgl. 3
Amoxicillin 10% DE 2x tgl. 10 mg kg KGW mind. 3
Tage
3
Amoxicillin 100% DE 2-10 mg/kg KGW 2 x tgl. über 5-
7 Tage
3
Amoxicillin-Trihydrat DE 2-20 mg kg/KGW 2 x tgl. über 2-
5 Tage
3
Amoxicillin-Trihydrat
10%
DE 10 mg/kg KGW 2x tgl. über 3-5
Tage
3
Amoxicillin C20 GKS DE Masthähnchen: 1 g/Tier u. Tag m.
d. Trinkwasser; Schwein: 100*
mg 2x tgl. m. d. Trinkwasser über
3-5 Tage
4
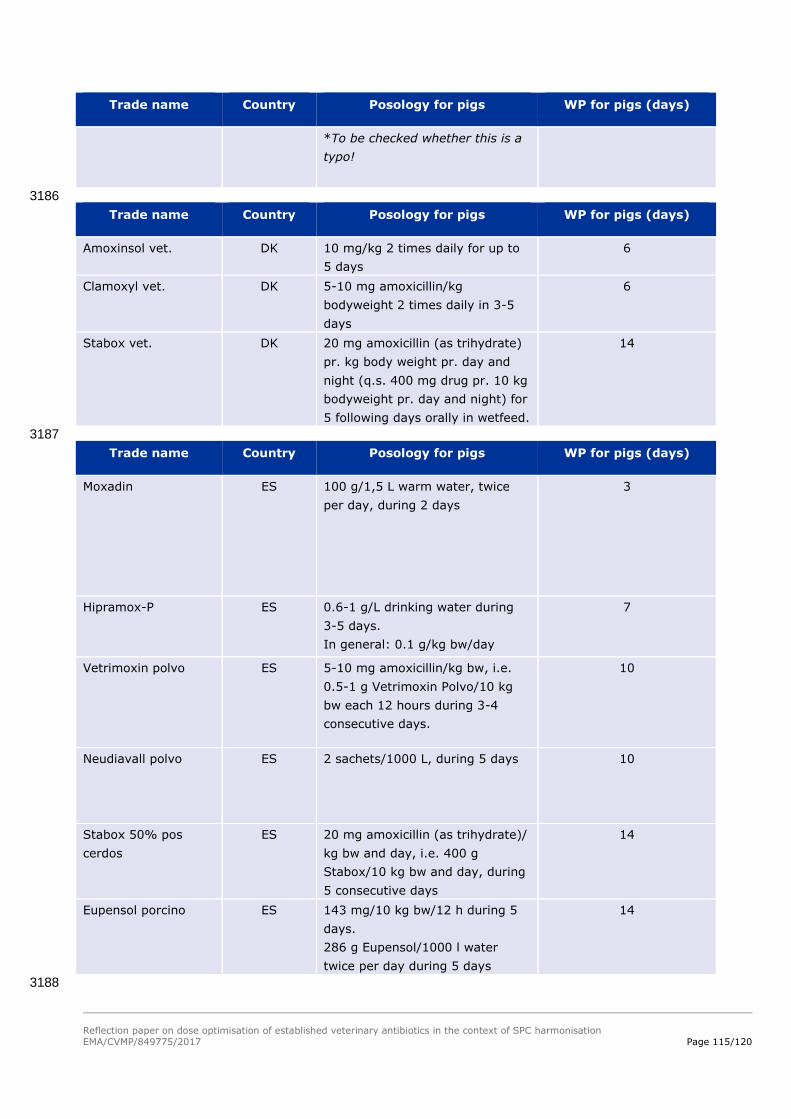
Reflection paper on dose optimisation of established veterinary antibiotics in the context of SPC harmonisation
EMA/CVMP/849775/2017 Page 115/120
Trade name Country Posology for pigs WP for pigs (days)
*To be checked whether this is a
typo!
3186
Trade name Country Posology for pigs WP for pigs (days)
Amoxinsol vet. DK 10 mg/kg 2 times daily for up to
5 days
6
Clamoxyl vet. DK 5-10 mg amoxicillin/kg
bodyweight 2 times daily in 3-5
days
6
Stabox vet. DK 20 mg amoxicillin (as trihydrate)
pr. kg body weight pr. day and
night (q.s. 400 mg drug pr. 10 kg
bodyweight pr. day and night) for
5 following days orally in wetfeed.
14
3187
Trade name Country Posology for pigs WP for pigs (days)
Moxadin ES 100 g/1,5 L warm water, twice
per day, during 2 days
3
Hipramox-P ES 0.6-1 g/L drinking water during
3-5 days.
In general: 0.1 g/kg bw/day
7
Vetrimoxin polvo ES 5-10 mg amoxicillin/kg bw, i.e.
0.5-1 g Vetrimoxin Polvo/10 kg
bw each 12 hours during 3-4
consecutive days.
10
Neudiavall polvo ES 2 sachets/1000 L, during 5 days 10
Stabox 50% pos
cerdos
ES 20 mg amoxicillin (as trihydrate)/
kg bw and day, i.e. 400 g
Stabox/10 kg bw and day, during
5 consecutive days
14
Eupensol porcino ES 143 mg/10 kg bw/12 h during 5
days.
286 g Eupensol/1000 l water
twice per day during 5 days
14
3188

Reflection paper on dose optimisation of established veterinary antibiotics in the context of SPC harmonisation
EMA/CVMP/849775/2017 Page 116/120
Trade name Country Posology for pigs WP for pigs (days)
AMOXIVAL 10 FR 10 mg amoxy / kg b.w.x 5 days
if necessary: 20 mg / kg.
2
BIOTORNIS FR 10 mg amoxy /
kg b.w x 5 days
if necessary :
20 mg / kg
2
COFAMOX 10 FR 10 mg amoxy / kg b.w.x 5 days
if necessary:
20 mg / kg.
2
SURAMOX 10 Poudre
Orale
FR 10 mg amoxy /
kg b.w.x 5 days if necessary:
20 mg / kg.
2
VETRIMOXIN P.O. FR 10 mg amoxy /
kg b.w.x5 days if necessary:
20 mg / kg.
2
AXILLIN Poudre Orale FR 10 mg amoxy / kg b.w.x 5 days
if necessary:
20 mg / kg.
2
SURAMOX 50 Poudre
Orale Porc
FR 20 mg amoxy /
kg b.w. x 5 days.
14
3189
Trade name Country Posology for pigs WP for pigs (days)
Tadamox granulate GR 10 mg amoxicillin/kg BW (10 g
Tadamox per 50 kg BW), twice
daily for 2-5 days
3
Amoxicillin 15% GR younger than 6 months old): 250
g/100 lt drinking water for 3-5
consecutive days (i.e. 40 mg
amoxicillin/kg BW/24 h),
older than 6 months old): 500
g/100 lt drinking water for 3-5
consecutive days (i.e. 40 mg
amoxicillin/kg BW/24 h)
28
Bremamox GR suckling piglets: 2 g powder twice
daily, weaned piglets (20-40 kg
BW): 2-4 g powder twice daily,
pigs (60-200 kg BW): 6-20 g
powder twice daily
28

Reflection paper on dose optimisation of established veterinary antibiotics in the context of SPC harmonisation
EMA/CVMP/849775/2017 Page 117/120
Trade name Country Posology for pigs WP for pigs (days)
Trade name Country Posology for pigs WP for pigs (days)
OCTACILLINE NL Pigs less than 6 months: 10-20
g/100 l drinking water (5.6-11.2
mg amoxicillin/kg bw) per day,
during 3-5 days.
Pigs more than 6 months: 15-30
g/100 l drinking water (5.6-11.2
mg amoxycillin/kg bw) per day,
during 3-5 days. P
2
3190
Trade name Country Posology for pigs WP for pigs (days)
Amoxindox 50 IT 40 mg product/kg b.w./day
(corresponding to 20 mg
amoxycillin trihydrate/kg
b.w./day) for 5 days.
1
Amoxid IT 20-30 mg amoxicillin/kg bw 2
Supramox S.P. IT 0.1-0.2 g/10 kg bw/day
(corresponding to 8-16 mg
amoxicillin/kg bw)
for 3-5 days
2
Vet-Cillin 80 IT 0.25 g of product/10 kg bw
(corresponding to 10.5 mg
amoxicillin/kg bw)
in severe cases the dose can
be doubled
3
Amoxicillina Triidrato 80%
Ascor Chimici
IT 1.72-2.87 g of Amoxicillin
Tridrate 80%/100 kg bw
(corresponding to 12-20 mg
amoxicillin/kg bw)
7
Amossicillina Triidrato 25%
Adisseo Filozoo
IT 6 - 12 g of product/100 kg
b.w./day (corresponding to
1.5 - 3 g amoxycillin
trihydrate/ 100 kg b.w./day)
for 6 days.
14
3191
Trade name Country Posology for pigs WP for pigs (days)
STABOX 50% PT 20 mg/kg b.w. during 5
consecutive days
14
3192 3193 3194

Reflection paper on dose optimisation of established veterinary antibiotics in the context of SPC harmonisation
EMA/CVMP/849775/2017 Page 118/120
Annex 4 3195
Overview of the data available regarding target animal safety 3196
From MA applications, extensions, variations
Study type Main objective Design Further objectives
Target Animal Safety
studies preferably
according to principles
of VICH GL 43
Characterise toxicity
syndrome, target
organs
Identify the margin of
safety (MOS)
Healthy animals
Final formulation (or
close)
0, 1x, 3x, 5x ORTD, for
3x dose duration
Clinical observations,
clinical pathology,
necropsy, histopathology
Local tolerance: injection
site safety (1xORTD)
Local tolerance
Formulation-specific
AEs
Palatability issues at
higher dose
Reproductive TAS
studies preferably
according to principles
of VICH GL 43
Identify safety effects
on male or female
reproduction and
viability of offspring
Healthy animals
Males: 0 & 3x ORTD x
one spermatogenic cycle
Females: 0 & 3x ORTD
from pre-breeding to end
of post-natal period
Dose-determination
studies
(Dose confirmation
studies)
To determine the
optimal dose by
investigating efficacy in
a range of doses.
Limited numbers of
uniform animals, often in
challenge model,
controlled conditions.
Final formulation (or
close)
Variable dose range, e.g.
0x, 0.5x, 1x, 2x ORTD
Efficacy endpoints
Dose confirmation
studies: usually 1x
ORTD, possibly natural
disease outbreak, larger
animal numbers
May also report safety
outcomes
Clinical field
preferably according to
principles of GCP
Identify safety issues
in the target (diseased)
population at the RTD
Final formulation
1x ORTD for proposed
duration
Target/diseased
population
AEs reported as:
serious/non-serious
causality
incidence
reversibility
Relationship of AEs to
dose, evidence for
safety in sensitive sub-
populations
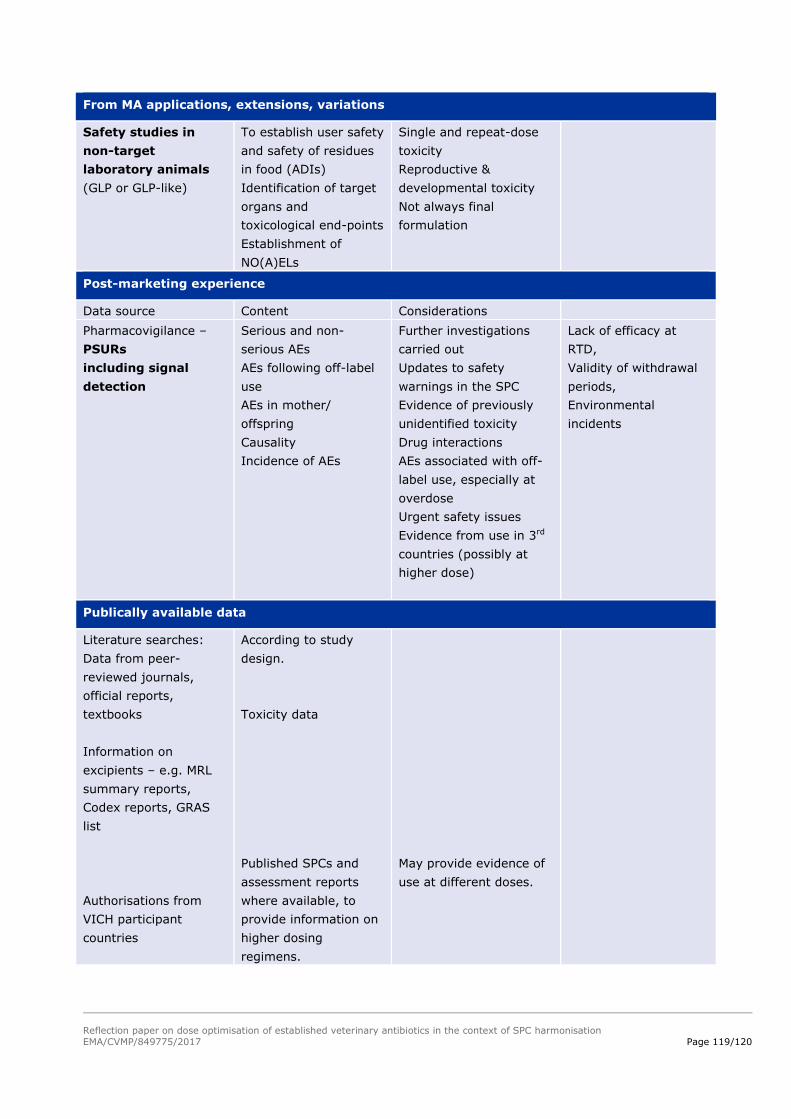
Reflection paper on dose optimisation of established veterinary antibiotics in the context of SPC harmonisation
EMA/CVMP/849775/2017 Page 119/120
From MA applications, extensions, variations
Safety studies in
non-target
laboratory animals
(GLP or GLP-like)
To establish user safety
and safety of residues
in food (ADIs)
Identification of target
organs and
toxicological end-points
Establishment of
NO(A)ELs
Single and repeat-dose
toxicity
Reproductive &
developmental toxicity
Not always final
formulation
Post-marketing experience
Data source Content Considerations
Pharmacovigilance –
PSURs
including signal
detection
Serious and non-
serious AEs
AEs following off-label
use
AEs in mother/
offspring
Causality
Incidence of AEs
Further investigations
carried out
Updates to safety
warnings in the SPC
Evidence of previously
unidentified toxicity
Drug interactions
AEs associated with off-
label use, especially at
overdose
Urgent safety issues
Evidence from use in 3rd
countries (possibly at
higher dose)
Lack of efficacy at
RTD,
Validity of withdrawal
periods,
Environmental
incidents
Publically available data
Literature searches:
Data from peer-
reviewed journals,
official reports,
textbooks
Information on
excipients – e.g. MRL
summary reports,
Codex reports, GRAS
list
Authorisations from
VICH participant
countries
According to study
design.
Toxicity data
Published SPCs and
assessment reports
where available, to
provide information on
higher dosing
regimens.
May provide evidence of
use at different doses.
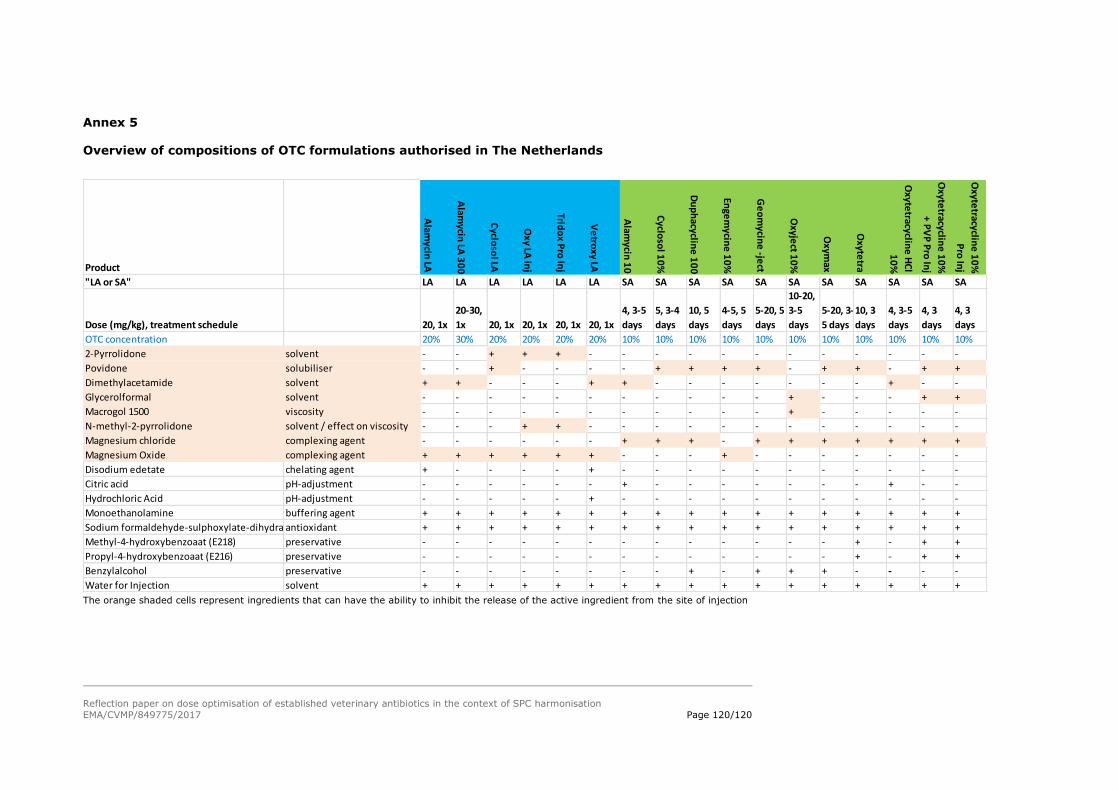
Reflection paper on dose optimisation of established veterinary antibiotics in the context of SPC harmonisation
EMA/CVMP/849775/2017 Page 120/120
Annex 5
Overview of compositions of OTC formulations authorised in The Netherlands
The orange shaded cells represent ingredients that can have the ability to inhibit the release of the active ingredient from the site of injection
Product
Alam
ycin LA
Alam
ycin LA
30
0
Cyclo
sol LA
Oxy LA
inj
Trido
x Pro
Inj
Ve
troxy LA
Alam
ycin 1
0
Cyclo
sol 1
0%
Du
ph
acycline
10
0
Enge
mycin
e 1
0%
Ge
om
ycine
-ject
Oxyje
ct 10
%
Oxym
ax
Oxyte
tra
Oxyte
tracycline
HC
l
10
%
Oxyte
tracycline
10
%
+ P
VP
Pro
Inj
Oxyte
tracycline
10
%
Pro
Inj
"LA or SA" LA LA LA LA LA LA SA SA SA SA SA SA SA SA SA SA SA
Dose (mg/kg), treatment schedule 20, 1x
20-30,
1x 20, 1x 20, 1x 20, 1x 20, 1x
4, 3-5
days
5, 3-4
days
10, 5
days
4-5, 5
days
5-20, 5
days
10-20,
3-5
days
5-20, 3-
5 days
10, 3
days
4, 3-5
days
4, 3
days
4, 3
days
OTC concentration 20% 30% 20% 20% 20% 20% 10% 10% 10% 10% 10% 10% 10% 10% 10% 10% 10%
2-Pyrrolidone solvent - - + + + - - - - - - - - - - - -
Povidone solubiliser - - + - - - - + + + + - + + - + +
Dimethylacetamide solvent + + - - - + + - - - - - - - + - -
Glycerolformal solvent - - - - - - - - - - - + - - - + +
Macrogol 1500 viscosity - - - - - - - - - - - + - - - - -
N-methyl-2-pyrrolidone solvent / effect on viscosity - - - + + - - - - - - - - - - - -
Magnesium chloride complexing agent - - - - - - + + + - + + + + + + +
Magnesium Oxide complexing agent + + + + + + - - - + - - - - - - -
Disodium edetate chelating agent + - - - - + - - - - - - - - - - -
Citric acid pH-adjustment - - - - - - + - - - - - - - + - -
Hydrochloric Acid pH-adjustment - - - - - + - - - - - - - - - - -
Monoethanolamine buffering agent + + + + + + + + + + + + + + + + +
Sodium formaldehyde-sulphoxylate-dihydrateantioxidant + + + + + + + + + + + + + + + + +
Methyl-4-hydroxybenzoaat (E218) preservative - - - - - - - - - - - - - + - + +
Propyl-4-hydroxybenzoaat (E216) preservative - - - - - - - - - - - - - + - + +
Benzylalcohol preservative - - - - - - - - + - + + + - - - -
Water for Injection solvent + + + + + + + + + + + + + + + + +