Embed Size (px)
Citation preview
REDWOOD GROUP LTD
紅木集團有限公司
www.redwoodgroup.co
Stock Code:8426

Agenda
Company Profile Overview
Market & Industry Overview
Operational Performance
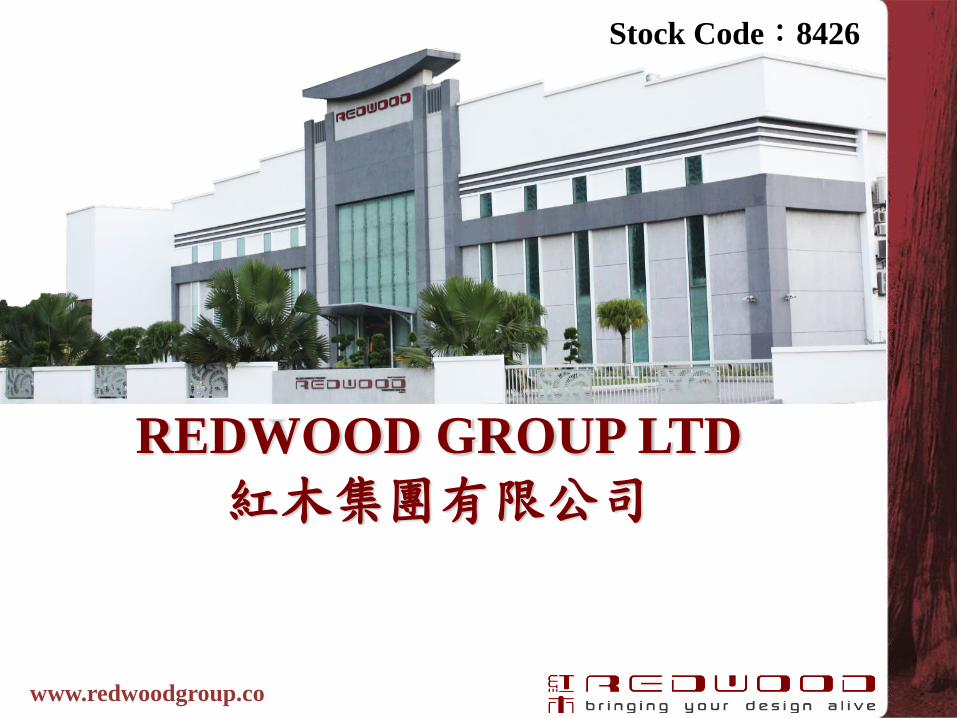
Date of Establishment:
Chairman:Michael Soh
General Manager:Peter Lee
Capital:NTD 46 Million Dollars
Number of Employees:1218 (As at 31 Dec 2013 )
Major Business:Contract manufacturer of high-quality
interior fittings for the world’s luxury brands(Boutique make up
artist for world’s top luxury brands)
About Us
Company Name Country Date of Establishment
Redwood Interior Pte Ltd Singapore July 1992
Redwood Furniture Sdn Bhd Malaysia Feb 1999
Redwood Group Ltd Cayman Islands August 2010
Redwood (Shanghai) Pte Ltd China Nov 2011
Redwood Europe Ltd United Kingdom Feb 2012
Redwood (HK) Ltd Hong Kong Feb 2012
Redwood Projects Sdn Bhd Malaysia Nov 2012

Group Structure
Redwood Group Ltd
(Cayman)
Redwood Interior
Pte Ltd
(Singapore)
Redwood
(Shanghai) Pte
Ltd
(China)
Redwood
Europe Ltd (United Kingdom)
Redwood Interior
Taiwan Branch
(Taiwan)
Redwood (HK)
Ltd (Hong Kong)
Redwood
Furniture
Sdn Bhd
(Malaysia)
Redwood
Projects Sdn Bhd (Malaysia)

Half hour driving time
from Singapore Causeway Customs
Two Main Operations Base in
Malaysia & Singapore

Core Business
Façade
Interior Fittings
General Construction

Competency
Drafting Contract
Management
Project
Management Purchasing
Quality
Control Logistics
Customized & Dedicated
Project Management (Singapore)
Metal
Painting/
Vanishing
Fabric/
Leather Electrical Glass
PVD Veneer Solid
Surface Millworks
Acrylic
Modular Manufacturing
(Malaysia)

Competitive Advantages
Transforming traditional craftsmanship to integrated modern production technology.
Modular Manufacturing Customized Project
Management
High Efficiency of
Project Completion Factory Assembly

Our Clients
Gucci Ermenegildo
Zegna
Bvlgari
Jimmy Choo Hermes
Coach
Chloe Cartier Bally
Leica Loewe Louis Vuitton Michael Kors
Dior
Salvatore
Ferragamo Tiffany & Co. Tory Burch
Yves Saint
Laurent

Redwood serves its clients in 40 countries and regions worldwide.
Geographic Distribution

The worldwide personal luxury goods market is expected to
reach 245-260billion euros in 2016.
Industry Overview
The CAGR of worldwide personal luxury goods market from Year 2013 to Year 2016 is 3-5%.
Source: Altagamma, Bain & Company forecasts, Worldwide Luxury Markets Monitor, Oct 2013
77
84
93
97
10
9
12
9
13
4
13
3
12
9
13
6
14
7
16
0
17
0
16
6
15
3
17
3
19
2
21
2
21
7
24
5-2
60
0
50
100
150
200
250
300
1995
1996
1997
1998
1999
2000
2001
2002
2003
2004
2005
2006
2007
2008
2009
2010
2011
2012
2013E
2016F
Luxury Goods Market (Euro bn)
+11% +13%
CAGR
3-5%
+10%
911 SARS 金融海嘯 歐債危機&
日本地震
中國禁奢
+2%
911 SARS Subprime & Financial
Crisis
Socio-Economic Turbulence

Industry Overview
By 2014, Asian market is the key growth in the luxury goods
market.
37% 37% 34% 34% 32%
30% 30% 31% 32% 27%
10% 9% 9% 8%
8%
17% 19% 20% 21% 27%
5% 5% 5% 5% 5%
0%
20%
40%
60%
80%
100%
2010 2011 2012 2013E 2014F
ROW Asia Japan Americas Europe
Source: Altagamma, Bain & Company forecasts, Worldwide Luxury Markets Monitor, Oct 2013 & 7th May 2012 (compile)

Revenue ( Geographic Distrubution)
68%
22%
6% 3% 1%
2011
Asia Americas Europe Middle East RoW
NTD 1,412,021
Unit: NTD Thousand Dollars
52%
36%
7% 5%
2012
NTD 1,657,068
71%
23%
5% 1%
2013
NTD 1,918,128

China is the Major Growth Area in the Asia’s
Luxury Goods Market
56,762
153,564
440,594
4.02%
9.26%
22.97%
0.00%
4.00%
8.00%
12.00%
16.00%
20.00%
24.00%
28.00%
-
50,000
100,000
150,000
200,000
250,000
300,000
350,000
400,000
450,000
500,000
2011 2012 2013
Total Revenue from China Percentage Accounted for Redwood Revenue
(單位: 新台幣仟元) (Unit: NTD Thousand Dollars)

Year 2013 Top 10 Most Value Luxury Brands &
Percentage Accounted for Redwood Revenue
0%
10%
20%
30%
Y2011 Y2012 Y2013
Source: Millward Brown Optimor’s 2013 (May) BrandZ study

Operational Performance
Y2011 Y2012 YoY(%)
Y2012 Q1-3
Y2012 Q1-3 (IFRS)
Y2013 Q1-3 (IFRS)
YoY(%)
Operating Income 1,412,021 1,657,771 17.40 1,133,499 1,213,258 1,282,971 5.75
Operating Margin 445,114 525,185 17.99 356,900 372,558 409,393 9.89
Gross Margin 31.52% 31.68% - 31.49% 30.17% 31.90% -
Net Profit 153,009 169,907 11.04 127,472 143,130 165,695 15.77
Net Profit Margin 10.84% 10.20% - 11.25% 11.80% 12.91% -
EPS 4.38 ** 4.05 ** - 2.42 2.79 3.21 -
(Unit:NTD Thousand Dollars ; EPS in NTD Dollars)
(**): Number of shares outstanding are 36,000 thousand shares and 42,000 thousand shares
for 31th December 2011 and 31th December 2012 respectively.
Revenue from Y2012 is NTD 1,657,771 Thousand Dollars , 17.40% growth
compared to Y2011.

Thank You !