Embed Size (px)
Citation preview

Reducing Postharvest Losses in the OIC Member Countries
COMCEC COORDINATION OFFICE September 2016
Standing Committee for Economic and Commercial Cooperation of the Organization of Islamic Cooperation (COMCEC)

Reducing Postharvest Losses in the OIC Member Countries
COMCEC COORDINATION OFFICE September 2016
Standing Committee for Economic and Commercial Cooperation of the Organization of Islamic Cooperation (COMCEC)

This report has been commissioned by the COMCEC Coordination Office to the Natural Resources Institute (NRI) of the University of Greenwich (UoG), UK. The authors of the report are Keith Tomlins, Ben Bennett, Tanya Stathers, John Linton, Gideon E Onumah, Claire Coote, Uli Kleih, Jan Priebe and Aurélie Bechoff. Views and opinions expressed in the report are solely those of the authors and do not represent the official views of the COMCEC Coordination Office or the Member Countries of the Organization of Islamic Cooperation. Excerpts from the report can be made as long as references are provided. All intellectual and industrial property rights for the report belong to the COMCEC Coordination Office. This report is for individual use and it shall not be used for commercial purposes. Except for purposes of individual use, this report shall not be reproduced in any form or by any means, electronic or mechanical, including printing, photocopying, CD recording, or by any physical or electronic reproduction system, or translated and provided to the access of any subscriber through electronic means for commercial purposes without the permission of the COMCEC Coordination Office. For further information please contact: COMCEC Coordination Office Necatibey Caddesi No:110/A 06100 Yücetepe Ankara/TURKEY Phone: 90 312 294 57 10 Fax: 90 312 294 57 77 Web: www.comcec.org


i
Table of Contents
List of Abbreviations ......................................................................................................................................... iv
List of Tables .......................................................................................................................................................... v
List of Figures ..................................................................................................................................................... vii
EXECUTIVE SUMMARY .............................................................................................................................. 1
INTRODUCTION ........................................................................................................................................... 8
CONCEPTUAL FRAMEWORK FOR POSTHARVEST LOSSES ............................................... 13 1.
OVERVIEW OF POSTHARVEST LOSSES IN THE OIC MEMBER 2.COUNTRIES................................................................................................................................................. 15
2.1. Overview of Postharvest Food Losses Globally 15 2.2. Overview of Postharvest Losses in OIC Member Countries 18
2.2.1. Cereals 18 2.2.2. Roots and Tubers 30 2.2.3. Oilseeds and Pulses 34 2.2.4. Fruits and Vegetables 37 2.2.5. Meat and Meat Products 42 2.2.6. Milk and Dairy Products 44 2.2.7. Fish and Seafood Products 49
ONLINE SURVEY OF POSTHARVEST LOSSES IN THE OIC .................................................. 57 3.
3.1. Introduction 57 3.2. Results 57 3.3. Cereals 59 3.4. Roots and Tubers 65 3.5. Oilseed and Pulses 68 3.6. Fruits and Vegetables 69 3.7. Meat and Meat Products 75 3.8. Milk and Dairy Products 76 3.9. Fish and Seafood Products 76 3.10. Conclusions 77
CASE STUDIES .................................................................................................................................. 79 4.
4.1. Cereals in Egypt 79 4.1.1. Status and Importance 79 4.1.2. Assessment of Postharvest Losses and Economic Burden 80 4.1.3. Causes of Postharvest Losses 84 4.1.4. Measures and Strategies Implemented for Postharvest Loss Reduction
in Uganda 88 4.1.5. Lessons Learned from the Case Study 89
4.2. Cassava in Nigeria 91 4.2.1. Status and Importance 91 4.2.2. Assessment of Postharvest Physical Losses and Economic Burden 93 4.2.3. Causes of Postharvest Losses 95 4.2.4. Measures and Strategies Implemented for Postharvest Loss Reduction 97

ii
4.2.5. Lessons Learned from the Case Study 98 4.3. Oilseeds and Pulses in Senegal 98
4.3.1. Status and Importance 98 4.3.2. Assessment of Postharvest Losses and Economic Burden 99 4.3.3. Causes of Postharvest Losses 102 4.3.4. Measures and Strategies Implemented for Postharvest Loss Reduction 102 4.3.5. Lessons Learned from the Case Study 103
4.4. Tomatoes in Bangladesh 103 4.4.1. Status and Importance 103 4.4.2. Assessment of Postharvest Losses & Economic Burden 105 4.4.3. Causes of Postharvest Losses 107 4.4.4. Measures and Strategies Implemented for Postharvest Loss Reduction 107 4.4.5. Lessons Learned from the Case Study 109
4.5. Meat and Meat Products in Oman 109 4.5.1. Status and Importance 109 4.5.2. Assessment of Postharvest Losses and Economic Burden 110 4.5.3. Causes of Postharvest Losses 113 4.5.4. Measures and Strategies Implemented for Postharvest Loss Reduction 114 4.5.5. Lessons Learned from the Case Study 114
4.6. Milk and Dairy Products in Uganda 116 4.6.1. Status and Importance 116 4.6.2. Assessment of Postharvest Losses and Economic Burden 119 4.6.3. Causes of Postharvest Losses 122 4.6.4. Measures and Strategies Implemented for Postharvest Loss Reduction 122 4.6.5. Lessons Learned from the Case Studies 123
4.7. Fish and Seafood Products in Indonesia 124 4.7.1. Status and Importance 124 4.7.2. Assessment of Postharvest Losses and Economic Burden 126 4.7.3. Causes of Postharvest Food Losses 126 4.7.4. Measures and Strategies Implemented for Postharvest Loss Reduction 127 4.7.5. Lessons Learned from the Case Study 130
4.8. Summary of the Case Study Findings 131
5. CAUSES AND CONSEQUENCES OF POSTHARVEST LOSSES.............................................. 133
5.1. Comparison of Postharvest Losses Identified in the Literature Review, Online
Survey and Case/Field Studies. 133 5.1.1. Physical Losses Identified in the Literature Review, Online Survey and
Case/Field Studies 133 5.1.2. Economic Losses Identified in the Literature Review, Online Survey and
Case/Field Studies 137 5.1.3. Quality and Nutrition Losses Identified in the Literature Review, Online
Survey and Case/Field Studies 139 5.1.4. Summary of Comparison of Postharvest Losses Identified in the
Literature Review, Online Survey and Case/Field Studies. 141 5.2. Generic Causes of Postharvest Losses 141 5.3. Consequences of Postharvest Losses in the OIC Member Country 143
5.3.1. Effects on Production 143 5.3.2. Effects on the Value Chain 144

iii
5.3.3. Effects on Food Security 144 5.3.4. Effects on the Environment 144 5.3.5. Effects on Food Safety 144
5.4. Current Resource Assessment of OIC Member Countries for Reducing
Postharvest Losses 144 5.4.1. Global and Regional Resources 145 5.4.2. International Projects and Programs 145 5.4.3. Suggestions from Participants of the Online Survey for Reducing
Postharvest Food Losses 147 5.4.4. Institutional Support 149
6. POLICY RECOMMENDATIONS ................................................................................................... 150
6.1. General Recommendations 150 6.2. Towards a Policy Framework for Reducing Postharvest Losses at the National
Level in OIC Member Countries 152
CONCLUSION ............................................................................................................................................ 154
REFERENCES ............................................................................................................................................ 155
ANNEXES ................................................................................................................................................... 177

iv
List of Abbreviations
AT Appropriate Technology CARE Co-operative for Relief Everywhere, NGO CIF Cost, insurance and freight COP Cost of Production DAO District Agricultural Officer DANIDA Danish International Development Agency DCO District Commercial Officer DDA Dairy Development Authority DFID Department for International Development ECM Energy Corrected Milk FAO Food and Agriculture Organisation FCE Farmer controlled enterprises FOB Free on board GoU Government of Uganda IDEA Investment in Developing Export Agriculture, USAID funded IITA International Institute for Tropical Agriculture ILRI International Livestock Research Institute MAAIF Ministry of Agriculture, Animal Industry and Fisheries MFPED Ministry of Finance, Planning and Economic Development MIS Market information services NAADS National Agricultural Advisory Services NARO National Agricultural Research Organisation NGO Non-Governmental Organisation NRI Natural Resources Institute, University of Greenwich PMA Plan for Modernisation of Agriculture SSA Sub Saharan Africa TOR Terms of Reference UNDATA Uganda National Dairy Traders Associations UNDFA Uganda National Dairy Farmers Association UNDP United Nations Development Programme UNFA Uganda National Farmers’ Association USAID United States Agency for International Development
v
List of Tables
Table 1: Commodity, OIC Member Country and regional coverage of field visits and desk studies .......................... 12 Table 2: APHLIS data on postharvest losses for focal African OIC Member Countries .................................................... 19 Table 3: Rice total postharvest losses across several countries in central and south-eastern Asia .......................... 22 Table 4: Postharvest losses along the rice chain in Bangladesh .................................................................................................. 24 Table 5: Overview of study findings on wheat postharvest weight losses in Pakistan .................................................... 26 Table 6: Levels of losses along the maize postharvest supply chain in Kaduna state, Nigeria and Eastern region, Uganda ..................................................................................................................................................................................................................... 28 Table 7: Sorghum and millet storage losses in traditional granaries in tropical Africa ................................................... 29 Table 8: Postharvest losses reported for main root and tuber crop produced OIC Member Countries .................. 31 Table 9: Causes of postharvest losses of pulses at different stages ........................................................................................... 36 Table 10: Summary table for fruit and vegetables ............................................................................................................................ 37 Table 11: Summary of postharvest losses in livestock and meat .............................................................................................. 44 Table 12: Overview of loss assessments in the milk and dairy value chains in selected countries. .......................... 46 Table 13: Milk produced, marketed and lost in East Africa ........................................................................................................... 47 Table 14: Estimated monetary value of annual quantitative PHL in dairy value chains in OIC countries (in current US$) 1 ....................................................................................................................................................................................................... 48 Table 15: Stages in the milk and dairy value chain, and causes of losses ............................................................................... 49 Table 16: World Fisheries and Aquaculture Production and Utilization ................................................................................ 50 Table 17: Main causes of postharvest losses in the fisheries and aquaculture value chains ........................................ 52 Table 18: Key fisheries statistics for study countries (FAO Statistics 2013) ........................................................................ 55 Table 19 Details of the fisheries in countries where fisheries and aquaculture is of some importance or more 56 Table 20: Type of organisation respondents are from ..................................................................................................................... 59 Table 21: Weight of postharvest losses in cereals per country and step of postharvest value chain ....................... 60 Table 22: Causes of PHLs reported for cereals and per postharvest step of the value chain ........................................ 61 Table 23: Mitigation of PHLs reported for cereals and per step of postharvest .................................................................. 62 Table 24: Constraints to reducing PHLs reported for cereals and per step of postharvest ........................................... 64 Table 25: Weight of postharvest losses in roots and tubers per country and step of postharvest value chain ... 65 Table 26: Causes of PHLs reported for roots and tubers and per step of postharvest. .................................................... 66 Table 27: Mitigation of PHLs reported for roots and tubers and per step of postharvest .............................................. 66 Table 28: Constraints to reducing PHLs reported for roots and tubers and per step of postharvest ....................... 67 Table 29: Weight postharvest losses in oilseed and pulses per country and step of postharvest .............................. 68 Table 30: Causes of PHLs reported for oilseed and pulses and per step of processing ................................................... 68 Table 31: Mitigation of PHLs reported for oilseed and pulses and per step of postharvest .......................................... 69 Table 32: Constraints to reducing PHLs reported for oilseed and pulses and per step of Postharvest ................... 69 Table 33: Weight postharvest losses in fruits and vegetables per country and step of postharvest ........................ 70 Table 34: Causes of PHLs reported for fruits and vegetables and per step of processing .............................................. 71 Table 35: Mitigation of PHLs reported for fruits and vegetables and per step of processing. ...................................... 73 Table 36: Constraints to reducing PHLs reported for fruits and vegetables and per step of postharvest.............. 74 Table 37: Weight postharvest losses in meat and meat products .............................................................................................. 75 Table 38: Causes, mitigation of PHLs, and constraints to reducing them (beef) ................................................................. 75 Table 39: Weight and economic postharvest losses in milk and dairy products ................................................................ 76 Table 40: Causes, mitigation of PHLs, and constraints to reducing PHLs reported for milk and dairy products (Goat cheese, yoghurt, qurut from Afghanistan) ................................................................................................................................. 76 Table 41: Causes of PHLs reported for fish and seafood and per step of Postharvest ..................................................... 77 Table 42: Mitigation of PHLs reported for fish and seafood and per step of Postharvest .............................................. 77 Table 43: Estimated impact of 10-30% Egyptian cereal postharvest losses ......................................................................... 82 Table 44: Causes of postharvest loss in Egyptian cereal supply chains, supply chain actors involved, and loss reduction options ............................................................................................................................................................................................... 86 Table 45: Utilization of cassava roots for different products in South West Nigeria ........................................................ 93 Table 46: Main causes, mitigation measures and extent of postharvest losses occurring along the different sub-value chains ........................................................................................................................................................................................................... 96 Table 47: Tomato production, yields and imports, Bangladesh 2009-2013 .......................................................................104 Table 48: Summary of percentage volume and value of tomato losses, 2008 – 2014, Bangladesh .........................106 Table 49: Improved postharvest projects and practices for tomatoes in Bangladesh ...................................................108 Table 50: Oman live animal stock 2010-14 .........................................................................................................................................110

vi
Table 51: Summary of volume and value of losses by country ..................................................................................................112 Table 52: Production of dairy products in Uganda ..........................................................................................................................116 Table 53: Uganda dairy herd indicators ................................................................................................................................................117 Table 54: Estimated monetary value of annual quantitative PHL in Uganda’s dairy value chain (in US$) ..........120 Table 55: Postharvest practices in Uganda’s dairy sector ............................................................................................................121 Table 56: Causes of losses in the Ugandan dairy value chain .....................................................................................................122 Table 57: Animal protein production in Indonesia, 2010 ............................................................................................................124 Table 58: Fish production for food, Indonesia, 2014 ......................................................................................................................124 Table 59: Reasons for losses for fisheries in Indonesia .................................................................................................................129 Table 60: Summary of causes and mitigation for the cases studies .......................................................................................131 Table 61: Physical losses for cereals compared to the global situation, literature review, online survey and case/field survey ..............................................................................................................................................................................................134 Table 62: Physical losses for root and tuber crops compared to the global situation, literature review, online survey and case/field survey ......................................................................................................................................................................134 Table 63: Physical losses for oilseeds and pulses compared to the global situation, literature review, online survey and case/field survey ......................................................................................................................................................................135 Table 64: Physical losses for fruit and vegetables compared to the global situation, literature review, online survey and case/field survey ......................................................................................................................................................................135 Table 65: Physical losses for meat and meat products compared to the global situation, literature review, online survey and case/field survey .......................................................................................................................................................136 Table 66: Physical losses for dairy and dairy products compared to the global situation, literature review, online survey and case/field survey .......................................................................................................................................................136 Table 67 Physical losses for fish and seafood products compared to the global situation, literature review, online survey and case/field survey .......................................................................................................................................................137 Table 68: Economic losses for cereals reported in the literature and case/field study .................................................138 Table 69: Economic losses for fruit and vegetables reported in the literature and case/field study .....................138 Table 70: Economic losses for meat and meat products reported in the literature and case/field study ............139 Table 71: Economic losses for milk and dairy products reported in the literature and case/field study ............139 Table 72. Quality and nutrition losses for cereals reported in the literature and case/field study .........................140 Table 73: Summary of physical, economic and quality losses for the seven OIC commodity groups .....................142 Table 74: Projects on cereals ......................................................................................................................................................................145 Table 75: Projects on root and tuber crops .........................................................................................................................................146 Table 76: Projects on fruit and vegetables ..........................................................................................................................................147 Table 77: Generic suggestions....................................................................................................................................................................148 Table 78: Specific suggestions related to the commodity groups ............................................................................................148

vii
List of Figures
Figure 1: Postharvest losses by commodity group and region of the world ......................................................................... 16 Figure 2: On-farm losses, postharvest losses and consumer waste for commodity group by region ...................... 17 Figure 3: Percentage of postharvest weight losses of maize in Senegal (with inset showing provincial level maize postharvest losses in 2012) ............................................................................................................................................................. 20 Figure 4: Percentage of postharvest weight losses of rice in Sierra Leone (with inset showing provincial level rice postharvest losses in 2012) ................................................................................................................................................................. 20 Figure 5: Percentage of postharvest weight losses of sorghum in Somalia and Senegal (with inset showing provincial level sorghum postharvest losses in 2012) .................................................................................................................... 21 Figure 6: Comparison of the proportion of rice postharvest losses occurring at different activity stages ............ 23 Figure 7: Relative importance of fisheries and aquaculture in study countries ................................................................. 54 Figure 8: Countries respondents have experience with postharvest value chain activities (67 respondents) ... 58 Figure 9: Crop group respondents (68) that the respondent have experience ................................................................... 58 Figure 10: Production trends of main cereal crops in Egypt......................................................................................................... 79 Figure 11: A postharvest agricultural innovation system .............................................................................................................. 89 Figure 12: Trends in cassava production in Nigeria and other top producing country from 1960 to 2013. ........ 92 Figure 13: Relationship between trends in cassava production and yield in Nigeria between 2000 and 2013. 92 Figure 14: Typical groundnuts value chain in African producer country .............................................................................100 Figure 15: Artisanal processors ................................................................................................................................................................101 Figure 16 The Oman red meat value chain and postharvest practices ..................................................................................111 Figure 17: Meat sector in Oman ................................................................................................................................................................115 Figure 18: Milk value chain..........................................................................................................................................................................119 Figure 19: Basic value chain for fish and seafood............................................................................................................................125 Figure 20: System for identifying & addressing PHL in Indonesia’s fisheries sector .....................................................126 Figure 21: Suggested Policy decision tree for selecting priority value chains when postharvest losses can have the greatest impact ..........................................................................................................................................................................................153


Reducing Postharvest Losses In the OIC Member Countries
1
EXECUTIVE SUMMARY
This analysis of postharvest losses in the OIC Member Countries was conducted by a team from the Natural Resources Institute (NRI), University of Greenwich between January and July 2016. The report aims to provide analysis that can contribute to reduce postharvest losses in OIC Member Countries. It does this through review of the current situation, identification of approaches and practices, and policy recommendation for future investments.
The analysis is on postharvest losses, defined by COMCEC as food damage or degradation of food during different stages of the food supply chain. We interpret this as those losses that are incurred between the farm-gate and prior to retail and consumption.
The method used was a combination of brief literature review, an on-line survey of key informants in OIC Member Countries, and a series of commodity specific case studies that included three field visits.
The scope of the study included all OIC Member Countries, all three official Regional Groups of OIC Member Countries (African, Asian and Arab), and commodity representation from seven commodity groups. Field visits were conducted in Indonesia, Bangladesh and Oman.
In Chapter 1 a conceptual framework is developed from our knowledge of the literature and the challenges and complexities of measuring postharvest losses considered.
Chapter 2 summarises the literature available on the commodities under study and the 57 OIC Member Countries. The commonly cited overall postharvest loss figure (which includes on-farm and consumer levels not considered here) is 32% (FAO), with higher assessment for perishables such as fruit & vegetables (40-50%), and lower losses for durables (e.g. 20-30% for cereals). This section highlights the wide range literature and its depth of analysis. Some commodities and countries are well covered (e.g. maize in Sub-Saharan Africa), but most are poorly analysed in existing research, with some serious knowledge gaps identified (e.g., some countries with little or no literature, other commodities under researched).
The results of the on-line survey and the case studies are discussed in Chapters 3 and 4 and the causes and consequences of postharvest losses emerging from the analysis reviewed in Chapter 5. The summary of global physical and economic losses vs OIC Member Country losses are summarised in the tables below.
Summary of physical losses for commodity groups in the world and OIC Member Countries
Postharvest loss Global Literature review
Online survey
Case/Field study
Cereals 12-15% 9-31% 10-25% 16-48% Root and Tuber crops
22-34% 7-50% 12-40% 7-25%
Oilseeds and Pulses 10-18% no data no data 14%
Fruit and Vegetables
15-38% 10-60% 5-65% 3-40%
Meat and Meat products
11-12% 6% no data 25-40%
Milk and Dairy products
2-19% 2-27% 30% 6-21%
Fish and 16-25% no data 50% 3-50% Source: Authors own analysis.

Reducing Postharvest Losses In the OIC Member Countries
2
Summary of global economic losses and those in OIC Member Countries from the Overview, Online Survey and Case Studies for the commodity groups
Postharvest loss Global Literature review Online survey
Case/Field study
Cereals NA At least US$4 billion per year (sub-Saharan Africa).
USD$ 1.16 billion / annum (Egypt)
Root and Tuber crops
USD20 million (South-West Nigeria) to Euro686 million (whole of Nigeria)
Oilseeds and Pulses
US$80 million per year (Senegal)
Fruit and Vegetables
25% loss in value of plantain (Uganda)
US$7.7 to US$20.6 million per annum (Bangladesh)
Meat and Meat products
6% (Turkey) US$31 million per annum or 49% (Oman)
Milk and Dairy products
US$ 2.54 billion (Sub-Saharan Africa)
US$56 million (Kenya + Uganda + Tanzania), US$ 23 (Uganda) US$1.7 billion (Pakistan)
US$25 to US$44 million per annum (Uganda)
Fish and Seafood Products
US$4.8 billion per year (Indonesia)
Bringing together the estimates for physical, economic and quality/nutrition losses in the OIC Member Countries along with comparisons with the global situation has highlighted a few lessons and gaps. The bulk of the information obtained from the literature review, online survey and case/desk studies concerned the physical losses. This is probably because physical losses are easier to estimate either by direct measurement or by visual inspection. In general, the reported information we found suggests that physical losses for all of the commodity groups were similar to that known for the global situation. It should be noted however, that all are estimates and few studies are quantitative. Much less was reported concerning the economic losses and the amounts will differ markedly from one value chain for another, even for the same product and commodity. This therefore is an area of research that would require more inputs and due to the high cost of undertaking such work, the target value chains would need to be selected according to economic contribution to the OIC Member Country. In all cases the monetary cost of the losses was significant but it was not always known how the costs were estimated. If the monetary losses could be captured, this will lead to benefits for the consumer and actors in the value chain along with potential benefits to national balance of payments. The least known was regarding the quality/nutrition losses. It is quite possible that

Reducing Postharvest Losses In the OIC Member Countries
3
this will be critical for countries suffering from nutrition deficiency, particularly calories and vitamins.
Selected key finding
Key findings are summarised below. We have clustered these into findings related to postharvest research and findings that are specific to the commodities studied. We also consider some of the over-arching themes that emerged from the analysis and highlight some solutions and best practice.
Postharvest research specific
Research on postharvest losses is sparse and geographically scattered. Some commodities have a greater coverage than others (e.g. artisanal fisheries and maize are far more researched that cattle or bananas). Some OIC Member Countries and regions have seen much more postharvest loss research and practice than others (e.g., Africa Group has seen a good amount of activities in some commodities, Asian and Arab Groups, with some notable exceptions, has seen very little research and analysis). Perversely, it would seem that more research is available in lower income countries than in higher income countries. This may indicate that donors have been driving postharvest loss research in these countries.
The range of losses experience across the literature varies substantially. Irshad and Baloch (1985) for example, found storage losses of weight for wheat in Pakistan varied from 3.5% to 25%. If all postharvest stages have the same degree of variability, this explains the high level of uncertainty and scepticism about total postharvest loss statistics.
Commodity specific
Grains Particular challenges with drying and storage, especially related to pests in store. Small grains (e.g., sorghum and millet) often have lower postharvest losses than larger grains (e.g., wheat and maize). Drying and storage were considered to be the most likely postharvest loss points in the value chains for grains.
Examples of innovations that seem to be having some impact included: improved dryers, mechanised threshing and shelling, training, improved on-farm stores and use of hermetic storage bags and sell as collective marketing by farmers.
Roots and tubers
Very little is known about postharvest losses in the growing Irish potato sector, but losses seem to be high, particularly in Africa. Cassava, which is highly perishable, has very high losses, particularly in countries where infrastructure to get product from field to factory is inadequate (e.g., Nigeria). Losses seem to be high for other root crops such as sweet potato and yams, but research is very limited.
Peeling (cassava), storage (yams) and marketing (sweet potato) were the highest postharvest loss elements reported by experts. Starch degradation during storage and transport is known to be high for cassava, but was not reported in the survey.
Improved infrastructure, more efficient delivery of roots and tubers to processing points, as well as simpler small scale drying were all innovations that were considered good practice examples for roots and tubers.

Reducing Postharvest Losses In the OIC Member Countries
4
Oilseeds and pulses
Research into postharvest losses for oilseed and pulses is very patchy, particularly where the commodity does not get processed or enter export markets (e.g., common beans and cowpeas in Africa).
For most pulses and grain legumes, all the recommendations that apply to grains are common to this commodity group.
The highest reported losses for oilseeds and pulses are in storage (30-60%), largely due to the impact of storage pests. Project to improve stores and storage for this commodity group are not common, but are clearly needed.
Quality and contamination issues are particularly important in the oilseed sector. Application of standards, training, collective marketing and incentives for quality can help address these issues, especially where production is predominately by small-holder farmers.
Fruit and vegetables
High perishability and ease of damage means that postharvest losses in this commodity group can be high. However, the emergence of new types of markets (e.g., supermarkets) and relatively high value mitigates these losses to some extent.
It was noticeable that some groups of fruit and vegetables have received much more research attention on postharvest losses than others. For example, tomatoes and mangoes are well researched, whereas many fruit and vegetables in the Arab Group of countries have not been well researched, e.g., dates.
Where formal markets with high quality standards exists (e.g. Turkey for green beans, Albania for watermelons) postharvest losses are reduced by standard and high quality postharvest practices.
Fruit and vegetables were reported by survey respondents to be particularly susceptible to storage and transport damage. Improved handling and packaging as well as investment in cold chain infrastructure can have an important impact on this postharvest loss.
Processed tomatoes in Bangladesh are a good example of using price incentives to improve quality and reduce postharvest losses and targeting medium to large sized fruit and vegetable processing firms as drivers of improved practice.
Meat and meat products
To date, the focus of research into postharvest losses for meat and meat products has been on the external or environmental impacts. Very little research exists in any livestock sub-sector on postharvest losses, especially in the small-holder sectors.
Strategies to address meat by-products such as offal, skins and blood, are commonly absent across OIC Member Countries. A high proportion of postharvest loss in this sector could be addressed with strategic investment in these areas.
High transport losses for live animals are often a factor of distance to market or slaughter. Post-slaughter, the absence of infrastructure including adequate cold chains was consider to be the crucial factor in reducing postharvest losses, after under-utilisation of by-products is taken into account.
The meat sector case study highlighted some special postharvest issues, especially the lack of standard sale terms in the sector (whole animals are sold), the common sale of under-weight

Reducing Postharvest Losses In the OIC Member Countries
5
animals, the high transaction costs of animal sale and the under-utilisation of slaughter by-products. In OIC Member Countries where home slaughter is common, high postharvest losses and public hygiene are related and serious concerns.
Milk and dairy
Reported postharvest losses in the dairy sector are high. Milk and dairy products are perishable. This is exacerbated in many OIC Member Countries by the relatively high incidence of small holder engagement in milk production (e.g., farms with 8-10 dairy animals).
A mixture of public and private infrastructure is needed to upgrade the milk and dairy value chains, particularly setting standards (e.g., Uganda) organising farmers (e.g., Kenya) and supporting the emergence of cool-chains. This finding was supported by survey respondents who identified storage of dairy products as a major factor causing postharvest losses.
The milk and dairy case study in Uganda highlighted the challenges of adulteration in this sector, a postharvest loss largely borne by the consumer.
Fish and Seafood Products
Postharvest losses in capture fisheries have, to a large extent, been addressed in recent years. This reflects the scarcity and value of this resource. A more important emerging issue is postharvest losses in aquaculture.
Since much fish is processed by small scale producers, many of the preservation methods and recommendations that apply to durable crops also apply to processed fish products.
For fresh fish and seafood, investments in cold chains and improved postharvest handling could substantially reduce postharvest losses and food safety concerns.
Common challenges/problems identified by the research
The issue of rodent losses in the postharvest chain is probably under-estimated (Singleton et al., 2010). This seems to be particularly detrimental for grains, but, where durables are stored, rodent damage and loss is an issue that has not received sufficient attention.
For all value chains, actions taken on farm (and therefore outside the purview of this study) strongly impact on postharvest loss. Thus, cleaning (e.g., maize), drying (e.g., rice), sorting (e.g. fish), packing (e.g., vegetables) and preserving (e.g., meat) before product leave the farm profoundly impacts postharvest losses down-stream. A focus on improving upstream practices and investments is essential to reduce later losses.
Aflatoxin is a growing threat to the viability of small holder value chains, largely because of increased awareness by agribusinesses and consumers across OIC Member Countries. Measure to manage mycotoxin contamination exist, but have a cost implication that threatens to create a dual economy in may place of aflatoxin free (mainly commercial agriculture) and contaminated (mainly small holder). Where contamination was common, it was found that losses were not as high as a market is usually found. The knock-on impact on public health of this phenomena should be a concern for policy makers in OIC Member Countries.
Many of the chains reviewed would benefit from development of cold-chain infrastructure (meat, fish, dairy, vegetables and fruit), and this is an area where OIC Member Countries can make strategic investments to reduce postharvest losses.
The existence of policies supporting strategic crops has, in some cases, led to a history of under-investment in postharvest management by the private sector, but has also ensured

Reducing Postharvest Losses In the OIC Member Countries
6
supply of these foods for many years (e.g. wheat in Egypt). The evidence would suggest that high subsidy is often associated with fraudulent activity, price inflation and inefficiencies.
With only very limited exception, we found that research and practice in the postharvest field in OIC Member Countries had not been gendered.
Common solutions identified during the research
Some solutions mentioned in the literature and by respondents to the survey and case studies include:
On-farm. Breeding for postharvest qualities (e.g., storability) Early quality differentiation (e.g., sorting for different uses/markets) Improved harvesting (e.g., use of standard in-field practices and clean containers) Collective drying/processing prior to sale
In chain.
Incentives for better drying/sorting/cleaning Improved containers Improved collective and in-chain storage Awareness raising of loss causes Greater access to and use of mobile phone technologies Micro finance directed at promoting market efficiency (e.g., warehouse receipt
systems) Systemic
Clear and understood rules and standards Easily available and locally adapted capacity building and training tools. Traditional focus on productivity has overlooked how to address postharvest aspects
of food production. Examples of best practice
Supplying specific sensitive food chains e.g., the brewing sector often results in high quality management along a chain and reduced overall postharvest losses. This shows that ownership of postharvest losses by key private sector actors in value chains can drive loss reduction.
The degree to which new integrated computer technology (ICTs) can be used to reduce postharvest losses of all kinds is, at present uncertain. Ideas identified include: give warning about impending postharvest losses of stored vegetables through chemical changes in store, sharing information about postharvest solutions using mobile applications, using sensors to detect when household or village stores are full and need emptying and identifying storage pests.
In many cases, the analysis found that sectoral strategic investments or application of seed grants can have a big impact on up-grading value chains and reducing postharvest losses. Investment in cold-chain infrastructure is a good example of this as is support to agribusinesses and supermarkets to improve the practices among their suppliers. Uganda’s sector wide approach to small holder dairy upgrading with its associated code of practice is an example of good approach.

Reducing Postharvest Losses In the OIC Member Countries
7
New industries can emerge from postharvest losses. A good example of this is the utilisation cassava peel waste for various different down-stream industries such as animal feed, starch recovery and mushroom media in Ghana and Nigeria. The same could also be said of bioenergy recovery, and upgrading of slaughter-house by-products.
The Indonesian artisanal fisheries sector is a good example of multi-actor collaboration to reduce postharvest losses. Here, a coordinated development of capacity (through government), improvement to the enabling environment through strategic investment (e.g., landings and ice machines), upgrading of key aspects of the value chain (e.g., better roads and more reliable electricity) and innovative approaches (a zero loss programme in fish processing factories) have contributed to a significant reduction in postharvest losses.
There are a few examples of national loss reporting systems identified by this analysis (e.g. APHLIS and the Indonesia fisheries sector). Where these systems exist and are used by policy makers, emerging evidence suggests that investment and policy measures that target postharvest loss reduction become normative.

Reducing Postharvest Losses In the OIC Member Countries
8
INTRODUCTION
Background
Agriculture is an important, often crucial, economic driver for livelihoods in many of the Organization of Islamic Cooperation (OIC) Member Countries, contributing 9% of GDP in 2013 and employing over 20% of the workforce (OIC, 2015). Therefore, the OIC Member Countries, through its Standing Committee for Economic and Commercial Cooperation (COMCEC), aim to maximise the contribution of agriculture to socio-economic development. One key area for concern is, in the face of rising populations, increased urbanisation, climate variability and other long-term global trends, to address the aspect of overall food availability through reducing food loss and waste. Failure of all the food produced in the world to be consumed and to provide its full potential for nutrition has long been recognized as an important brake on global food efficiency and productivity1 (Hodges et al, 2011, World Bank, 2011). More recently, concerns about population growth and the impact on the planet of unconstrained food losses and waste have been heightened by the Sustainable Development Goals (UN, 2015). The SDGs call for the world to reduce per capita food waste by 50% by 2030. Several recent studies have attempted to estimate the volume of food lost in the global supply chain. The figure that is most pervasive tends to be that used by the Food and Agricultural Organisation of the United Nations of one third of all food not reaching the final consumer (Gustavsson et al., 2011). Whilst the method of measuring and valuing this loss can be disputed, the factor cost in terms of nutrition, energy, water, labour, and capital of food being produced and then not consumed is clearly vast. Consuming unsafe food could also be included in this calculation and this would surely provide additional impetus for action by policy makers. Postharvest loss reduction offers the particular advantage of increasing food availability without requiring additional land, water, labour and agricultural inputs for additional production. Better postharvest management and the associated loss reduction will also help to build resilience against current and future climate-related shocks, and reduce the need for compensatory agricultural extensification, land use change and damage to environmental services, including carbon sequestration. There have been many different definition of postharvest food loss and waste and ways of locating it within agricultural commodity value chains. One commonly adopted is that of the World Resources Institute (WRI) which considers food loss to occur before products reach consumers and food waste to be a near consumer issue of under-utilisation. COMCEC has adopted the following definitions: On-Farm losses: all losses during the agricultural production stage until completion of harvesting. Postharvest losses: food damage or degradation of food during different stages of the food supply chain (both quantitative and qualitative); and,
1 Kissinger speech to the World Food Conference in Rome, 1974, quoted in Bourne, 1977:2

Reducing Postharvest Losses In the OIC Member Countries
9
Food Waste: food losses at the near consumer stages of the supply chain. In this study, the focus in on those losses that occur between the farm-gate (on-farm losses) and at or near the consumer. This intermediate stage includes numerous different sub-stages and functions such as handling, storage, processing, packaging, transportation, distribution and marketing.
The objectives of the report
This report aims to provide analysis that can contribute to food security in OIC Member Countries by reducing postharvest losses and thereby increasing productivity and efficiency of the agricultural sectors. The purpose of the report is to present an overview of the current situation with regards to postharvest losses as defined by the OIC Member Countries, understand the main reasons and consequences of these losses, and demonstrate approaches and practices that can contribute to their reduction. The report will provide policy guidance and recommendations for OIC Member Countries which can lead to collaboration to effectively address postharvest losses. The audience for this study is, in the first instance, OIC Member Country policy makers. Other stakeholders both within and external to the OIC Member Countries may find it a useful contribution to the emerging debate on global food loss and waste. As we shall see, the study engaged many stakeholders and interest in efforts to address postharvest losses was universal among this population.
Structure of the report
The report comprises an introduction which gives the background, objectives, and the framework. Chapter 1 comprised the conceptual framework for postharvest losses and Chapter 2 gives on overview of postharvest losses from a global perspective. The following chapters explore the postharvest losses with respect to the OIC Member Countries. Chapter 3 gives the result and interpretation from an online survey of postharvest loss experts worldwide. In Chapter 4, case studies explore losses in more detail for specific commodities and countries spanning the OIC Member Countries. Chapter 5 explores the causes and consequences of postharvest losses with an initial bringing together of that found in the preceding chapters on the review, online survey and case studies. Chapter 6 gives policy recommendations and this is followed by the conclusions, references and annexes.
Methodology
This analytical study of postharvest losses in OIC Member Countries was completed using three methods; literature review and syntheses, a survey of key informants and case studies where key informants were interviewed. By adopting three different methods it was hoped that a range of postharvest losses and important efforts to address these losses would be discovered.
Literature review
The study reviewed available literature on postharvest losses in general and specific to the target commodities and OIC Member Countries (see conceptual framework below). The

Reducing Postharvest Losses In the OIC Member Countries
10
approach adopted was to ask individual commodity experts to review losses globally and in OIC Member Countries from the perspective of the commodity cluster they were responsible for. The literature review revealed wide-ranging deficiencies in the information available and quality of postharvest loss data. For postharvest losses in general and for all commodity groups studied, with the possible exception of grains, data on losses largely was founded on secondary sources (e.g. not through actual measurement but by asking experts and aggregating the results by known measures of agricultural output). The literature review also demonstrated that the existing research and grey literature is patchy. By this we mean that some OIC Member Countries have more literature available than others. For example, there is nothing openly available on postharvest losses for any commodity from Azerbaijan, but much for Uganda. The picture for literature by commodity is similar: information on postharvest losses in the meat sector was very limited globally, but much research is available on cereals. A lot of literature is unpublished or not available publically (e.g. “grey”). Where case studies were conducted with in-country visits, this demonstrated that more in-depth research could reveal grey literature not available to a desk study. It is also possible that some literature was over-looked because it has not been published in English.
On-line survey of key informants
An online survey for collecting data on postharvest losses was conducted. The aim of this survey was to identify and gather information/opinion from known expert at the country and commodity levels. NRI (Natural Resources Institute) selected a sample of 400 key informants across the 57 OIC Member States and globally across the range of commodities being studied. These key informants were identified through a range of sources, including the FAO Save Food members, recent attendants at the 1st Global Postharvest Losses Congress in Rome, and through NRI’s extensive historical contacts in the field through the NRI Postharvest Loss Reduction Centre.
Experts were identified at national, regional and international levels. In some cases experts covered more than one commodity group. Every effort was made to find experts from a range of backgrounds including: researchers, non-government representatives, international organisations, the private sector and Government.
The survey instrument was applied on-line using “Survey Monkey” and consisted of a range of questions and requests for estimates of losses and where these might occur in the chain of supply (a summary of the survey instrument is at Annex 1). The questionnaire contained 182 individual response fields grouped into a number of areas as follows:
Group 1: Country and commodity focus and expertise of the respondent. These questions located the country coverage of the respondent and the specific commodities where they have expertise or opinion.
Group 2: Commodity value chain stages and typology of products. These questions clarified the different stages of the commodity value chain and the typology of transformation occurring postharvest.
Group 3: Estimates (%) of volume and value loss by commodity and stage of transformation. These questions asked experts to provide estimates of the amount and kind of losses at each transformation stage and aimed to highlight areas where losses are high. Respondents were

Reducing Postharvest Losses In the OIC Member Countries
11
also asked to say what the main causes of losses are at each stage and to prioritise these for intervention. Since transformation postharvest results in creation of by-products, and these differ from chain to chain, respondents were asked to consider losses and possible solutions along these sub-chains as well. The NRI Team used information from the literature review and in-house expert knowledge of the commodities to provide specific detailed transformation stages for each of the commodities being studied.
Group 4: Identification of innovation and best practice in mitigating postharvest losses. Respondents were asked to provide information about their experience of successful activities, project and policies to address postharvest losses in their field of expertise.
Group 5: Information about the respondents. The respondents were asked to describe themselves, their affiliations and their level of experience in the field of postharvest losses.
The number of questions each respondent was asked to answer was limited to the range of commodity expertise they declared (e.g., not all respondents had to answer all 182 questions).
Note that the survey instrument and approach was conformed to the Natural Resources Institute Code of Practice on working with People as approved by the University of Greenwich Research Ethics Committee.
Case studies
Depth and detail were added to the analysis of literature and expert survey by using a country and commodity case study approach. This consisted of identifying focus commodities for each commodity group based on our understanding of the likelihood of there being postharvest loss information available, and then identifying countries and regional groupings were field work might be possible. The countries, commodity groups and individual crops selected for more in-depth analysis were then approved by COMCEC. In total we were requested to identify 7 countries for case studies which would provide reasonable coverage of the OIC Member Countries, three Regional Groups of Member Countries (Arab, Asian and African Groups – see Annex 2).
In the cereal group, the NRI Team chose to work on cereals because of the high dependence on this commodity in many OIC Member Countries and selected Egypt where it was known that maize is a strategically important crop.
For roots & tubers group, cassava was selected because in this group it is by far the most important with the highest number of small farmers undertaking its production. Nigeria was selected as the focal country because of the known existence of a larger body of research and current researchers.
In the fruit & vegetables group, we selected tomatoes because of its universality as an important crop and consumer item across all OIC Member Countries. The importance of tomato production in Bangladesh suggested this country as a suitable case study candidate.
The meat and meat products group identified sheep and goats as being animals almost ubiquitous across Member Countries of OIC and were both small and large-scale farmers are known to exist. The high important of small stock production in and around the Gulf of Arabia suggested that Oman would be a good candidate for a case study.
Milk was selected in the milk and dairy group, as cheese (and other dairy products) are not universal. Recent growth and developments in the East African smallholder dairy sector suggested that this would be a good location for a case study.

Reducing Postharvest Losses In the OIC Member Countries
12
For the fish and seafood group, the wide range of different species prompted the NRI team to select a method of fishery, artisanal coastal, rather than a specific species. A good amount of recent research and activity in postharvest losses in Indonesia suggested this country as a focus.
Table 1: Commodity, OIC Member Country and regional coverage of field visits and desk studies
Commodity group Commodity focus Country and Regional Grouping Asian Arab African
Cereals Maize Egypt Roots & tubers Cassava Nigeria Oilseeds & Pulses Groundnuts Senegal Fruit & Vegetables Tomato Bangladesh Meat & Meat products Sheep and goats Oman Milk & Dairy Milk Uganda Fish & Seafood Artisanal coastal fishery Indonesia No. of field case studies 2 1 0 No. of desk case studies 0 1 3 Region coverage 2 2 3
With limited resources, it was agreed to undertake short visits to interview key informants in three of the target case study countries/commodity groups. These were spread across the OIC Member Country Regional Groups as follows: Bangladesh – Asian – Tomatoes, Oman – Arab – sheep and goats, and, Indonesia – Asian - Artisanal coastal fishery. A case study check list was developed to ensure a consistent approach across the countries visited and in the outputs received from different experts (Annex 3). The check list was applied as an interview guide only, with each individual interview allowed to follow the most relevant line of enquiry appropriate. The check list explained the ethical approach of the survey, gathered respondent details, asked generic questions about the make-up and actors in the target value chain, losses and how these are currently or might be addressed through investment and policy. For each case study a standard reporting method was agreed including the status and important of the commodity in that country, an assessment of the losses with causes, and, identified actions and strategies for reducing losses.

Reducing Postharvest Losses In the OIC Member Countries
13
CONCEPTUAL FRAMEWORK FOR POSTHARVEST LOSSES 1.
Postharvest losses, as defined by the OIC Member Countries, consist of food damage or degradation of food during different stages of the food supply chain (both quantitative and qualitative). A wide range of different definitions exist and are well reviewed in the COMCEC companion piece to this analysis (OIC, 2015:7). Three key recent attempts at defining food loss and waste include Gustavsson (2013), the World Resources Institute (Lipinski et al, 2013, WRI 2015) and the FAO (2014a). A key element of these definitions is their attempt to address the differences between physical/quantitative losses (e.g., weight loss of grain in store through consumption by rats), where the food is completely removed from the chain, and qualitative losses (e.g. insect damage during grain storage that lowers the eventual sales price), where the food is still available, but its cumulative total value is reduced. In addition, many definitions of postharvest losses consider the issue of lost opportunity (e.g., when, for a range of reason, food fails to sell at its optimum possible value). These ‘economic’ or ‘market’ losses are hard to locate and measure, and so have not been the subject of extensive empirical enquiry. The location of the loss within the value chain is a further complexity to analysis. For example, several analyses show that there is asymmetry between food loss and waste between developing and develop countries (e.g., Hodges et al, 2011). In developing countries losses tend to be greater at the earlier stages of the chain (e.g., production, storage, and handling) and lower at the consumer level. This, it is believed, reflect the income level of consumers and the likelihood that they will consume all food available because its replacement has a high cost proportionate to income. In more developed economies, where incomes are higher and more food preservation equipment is available, the incentive to consume is marginally lower, and this is reflected by high losses between the retailer and final consumption. Many postharvest loss assessments cumulate the losses along the different stages of the chain to reach a total loss figure. Thus, losses of, say, 10%, at production, storage, processing, distribution and consumption stages quickly become 50% overall cumulative loss. The risk of cumulative losses is that any error is amplified in the final figure. With all food losses, the ability to generalise from empirical evidence (e.g. actual physical weighting or data relating real prices to possible values) to the overall production of that commodity in a given geography is fraught with difficulty. At the level of commodities, countries and policies, information gathered is normally qualitative (e.g. by asking expert opinions of percentage loss). Even when it is quantitative, the high cost of surveys usually means that sample sizes are small, and under-representative. These nominal postharvest loss assessment methods are then applied to national production statistics to get aggregate loss figures. If the statistics are suspect, a high degree of inaccuracy can creep in. The location of the loss within the postharvest chain is also important. Most commodity value chains have evolved to clear the market (e.g., provide a balance between supply and price) and to mitigate risk. Risk in itself is a factor of market efficiency, but also inherently related to the perishability of the commodity. Fish, meat, fruit and vegetables and root and tuber crops, for example, are self-evidently more risky to produce and trade because of the higher likelihood of losses due to deterioration and the capital costs associated with mitigating these risks (e.g., processing to stability or investing in preservation such as refrigeration). Many commodity

Reducing Postharvest Losses In the OIC Member Countries
14
value chains in developing countries have evolved to mitigate these risks of losses. A good example is the widespread development across the humid tropics of fermentation, which costs household labour but returns food that can be kept safe against future need. In general, the imbalance in power along value chain, with farmers having less power over price than, say traders or wholesalers, means that these risks and costs of mitigating losses are usually driven down the primary producer and subsumed in the form of low farm-gate prices and high in-chain margins (see for example Naziri and Bennett, 2014). The location of loss within the postharvest chain also impacts upon its overall valuation and can lead to some anomalous loss statistics. For example, a 10% physical loss that occurs at the retail level can be valued differently from a similar scale of loss at the farm-gate. Price increases along the chain so the cost of losses goes up. Theoretically, all kinds of loss costs are built up along the chain, so policies that prevent losses at the consumption end will have greater overall value than those reducing losses at the production end. Beyond locating postharvest losses within and across value chains, the issue of who incurs the loss remains largely unanswered. Very few food loss assessments have been gendered, though considerable evidence supports the proposition that women bear the cost of them disproportionately and that changes and innovations to the way losses are utilised can lead to a transfer of value from one person to another (Abdulsalam-Saghir et al, 2015). Two final, over-arching, issues need to be considered in any definition of postharvest losses. Firstly, we now know that food losses are an important element of environmental costs. The resources (e.g., fertilizer, labour, capital, seeds, energy and water) used in production, transporting, processing and preservation of food are lost. It seems likely, although there is not much empirical evidence to support it, that over-production is necessary to meet target food and income needs. Secondly, we know that wasted food means less nutrition, and this could be measured by simply multiplying the nutritional element by the total loss volume. However, it is also likely that in-chain postharvest nutritional changes occur. Food that perishes or becomes unsafe can, indeed, have a nutritional cost, particularly if it is consumed by somebody who is already under-nourished or unwell. Some foods lose vitamins (e.g., processed and cooked flours of grains and legumes) or gain harmful ingredients (e.g., histamine in certain fish species and mycotoxins). These nutritional postharvest losses are, to date, almost unmeasured. For this study of postharvest losses we have chosen the following range and scope of definition of postharvest losses:
Quantitative and qualitative losses between the farm-gate and prior to retailing to the consumer.
Physical and economic losses measured by volume and value against the benchmark of the highest likely opportunity cost relevant to the chain and circumstances of the commodity.
We have, where possible, tried to elicit information on location, gender, poverty impact, environmental costs and nutritional loss, but these are currently largely anecdotal.

Reducing Postharvest Losses In the OIC Member Countries
15
OVERVIEW OF POSTHARVEST LOSSES IN THE OIC MEMBER 2.COUNTRIES
In this section the postharvest losses in the global context is explored first and secondly losses in OIC Member Countries are explored.
2.1. Overview of Postharvest Food Losses Globally
The proportion of postharvest food losses and waste of food and drink products in the different commodity groups (cereals, roots and tubers, oilseeds and pulses, fruits and vegetables, meat, dairy products, fish and seafood products) will differ according to a number of factors. These factors will include the various regions world and within each region, there will be large variations between specific value chains. This will be compounded by a number of additional factors for example being whether the loss is physical, economic or nutritional, whether the loss refers to the whole value chain or part of it and the method of estimation of losses. Currently, the absence of quantitative data on losses in OIC Member Countries, or globally, does not enable a valid comparison between the OIC Member Countries and the information that exists for rest of the world. The Food and Agriculture Organization of the United Nations (FAO) estimates that 32% of the food produced in the world for human consumption every year (approximately 1.3 billion tonnes) gets lost or wasted. In terms of economic value, food losses and waste amounts to roughly US$680 billion in industrialized countries and US$310 billion in developing countries. In terms of physical losses, industrialized and developing countries dissipate about the same quantities of food being 670 and 630 million tonnes per annum respectively. The extent of the global quantitative physical food losses and waste per year differ according to the food groups. Fruits and vegetables, and roots and tubers have the highest wastage rates of any food at 40-50%. For fish it is 35%, cereals 30% and 20% for oil seeds and pulses, meat and dairy products. The amount of food lost or wasted every year is equivalent to more than half of the world's annual cereals crop (2.3 billion tonnes in 2009/2010) (http://www.fao.org/save-food/resources/keyfindings/en/). The waste also varies per capita by consumers; 95-115 kg a year in Europe and North America, and 6-11 kg per year for consumers in sub-Saharan Africa, south and south-eastern Asia. Gustavsson et al., 2011 estimates of percentages of food losses at five different stages in the food supply chain being agriculture, postharvest, processing, distribution and consumption. Using this date, Figure 1 below indicates the postharvest losses using the OIC Member Countries criteria of postharvest losses from farm gate to consumer for the commodity groups and regions of the world.

Reducing Postharvest Losses In the OIC Member Countries
16
Figure 1: Postharvest losses by commodity group and region of the world
Source: Authors own analysis of FAO data. The estimates of postharvest food losses for the seven commodity groups and regions of the world show varying trends. Cereals and Oilseeds and Pulses had the lowest overall losses in the range of 9% to 18% and with only minor lower losses in this industrialised countries (Europe, Industrialised Asia and North America and Oceania) compared to the LMICs (Low to Middle Income Countries) being Northern Africa, West and Central Asia, Latin America, Sub-Saharan Africa and South and Southeast Asia. For Fruit and Vegetables, Fish and Seafood Products and Dairy there postharvest losses were generally higher but more markedly so for the LMICs and this was most noticeable for Dairy products. For Root and Tuber Crops, losses were overall higher but the difference between Industrialised and LMICs was less district. The information in Figure 1 does not yet exist for the OIC Member Countries, they are among these country groups and postharvest losses there will be discussing in later sections of this report. Considering the relative importance of postharvest losses globally with respect to on-farm and consumer losses, Figure 2 shows the losses by commodity and region to illustrate the relative differences. This illustrates that postharvest losses can for some commodities and regions represent most of the losses while in other cases it is minor. For all commodity groups postharvest losses represent the major area of losses in LMICs while for industrialised countries it is mixed. For example, postharvest losses in industrialised countries are generally minor compared to on-farm and consumer losses for cereals and dairy and dairy products.
0%
10%
20%
30%
40%
50%
60%
Cereals R&T Oilseeds F&V Meat Fish Dairy
Po
sth
arv
est
loss
es (
%)
Europe North America and Oceania
Industrialised Asia Sub-Saharan Africa
North Africa, West and Central Asia South and Southeast Asia
Latin America

Reducing Postharvest Losses In the OIC Member Countries
17
Figure 2: On-farm losses, postharvest losses and consumer waste for commodity group by region a) Cereals b) Root and Tubers
c) Oilseeds and Pulses
d) Fruit and Vegetables
e) Meat and Meat Products
f) Dairy and Dairy Products
0%
10%
20%
30%
40%
50%
60%
Po
sth
arv
est
loss
(%
)
Farm Postharvest Consumer
0%
10%
20%
30%
40%
50%
60%
Po
sth
arv
est
loss
(%
) Farm Postharvest Consumer
0%
10%
20%
30%
40%
50%
60%
Po
sth
arv
est
loss
(%
)
Farm Postharvest Consumer
0%
10%
20%
30%
40%
50%
60%
Po
sth
arv
est
loss
(%
)
Farm Postharvest Consumer
0%
10%
20%
30%
40%
50%
60%
Po
sth
arv
est
loss
(%
)
Farm Postharvest Consumer
0%
10%
20%
30%
40%
50%
60%
Po
sth
arv
est
loss
(%
)
Farm Postharvest Consumer

Reducing Postharvest Losses In the OIC Member Countries
18
g) Fish and Seafood Products
Source: Authors own analysis of FAO data.
2.2. Overview of Postharvest Losses in OIC Member Countries
Literature reviews for each commodity group discuss the known information relating to postharvest losses and causes in the OIC Member Countries where this information is known. Where information is not known, general information relating to losses of that commodity are given using situations that are similar where possible. 2.2.1. Cereals Introduction
The following is a brief summary of the literature relevant to cereal postharvest losses (PHL) in the 57 OIC Member Countries. Postharvest loss may be described quantitatively or qualitatively, in terms of nutritive or economic value of the produce but can also include loss of: agricultural inputs, seed or grain viability and brewing potential, opportunity cost and goodwill. Most postharvest work has focused on quantitative loss, e.g. reduction in weight or volume which is relatively easy to measure and less subjective in its nature. However, postharvest loss levels are affected by numerous factors including the climate and decisions and resources that different individuals make and can access at different postharvest stages. Postharvest losses are therefore highly contextual and average loss figures are simply an indicator of the scale of the problem, albeit one that is important for informed targeting and evaluation of loss reduction programmes and for estimating food availability. The only information system focused on PHL levels is APHLIS – the African Postharvest Losses Information System2, an online freely accessible resource which provides estimates of cumulative weight losses incurred during harvesting, drying, handling operations, farm storage, transport and market storage for nine different cereal crops across 39 sub-Saharan African. The loss values for each link in the postharvest chain are taken from a thorough review of the scientific literature and are modified by several seasonal factors (e.g. rain at harvest or during crop drying, presence of the large grain borer (LGB, Prostephanus truncatus)) that vary from year to year and are submitted by the APHLIS network members
2 www.aphlis.net
0%
10%
20%
30%
40%
50%
60%
Po
sth
arv
est
loss
(%
)
Farm Postharvest Consumer

Reducing Postharvest Losses In the OIC Member Countries
19
based in each country. The data for each crop can be looked at by year and down to the provincial level in each country.
Data extracted from APHLIS has been used to summarise cereal postharvest loss levels and quantities for 19 of the African Member Countries of the OIC in Table. In these 19 African OIC Member Countries alone, postharvest losses of 6,655,727 tonnes of five cereal grains occurred in 2012. This is food that could have been used to feed citizens and drive economic activity, it is a waste of the valuable resources (land, water, labour and inputs) used to produce it. The ‘Missing Food’ study estimated that 13.5% of the grain produced across sub-Saharan Africa is then lost postharvest, this is equivalent to US$4 billion per year or the annual caloric requirement of 48 million people (World Bank, NRI, FAO, 2011). Climatic changes (CC) in temperature, rainfall, humidity, extreme events plus natural and human responses to CC and variability will affect postharvest systems and are likely to increase PHL unless changes are made (Stathers et al., 2013). Table 2: APHLIS data on postharvest losses for focal African OIC Member Countries
Country % postharvest loss - estimates of % cumulative weight loss (a)
Quantity (tonnes) of annual postharvest loss
Mai
ze
Ric
e
Wh
eat
Sorg
hu
m
Mil
let
Mai
ze
Ric
e
Wh
eat
Sorg
hu
m
Mil
let
Benin 25 24 24 14 - 235,516 26,794 26,794 23,034 - Burkina Faso
18 14 14 12 10 273,550 44,553 44,553 230,687 111,057
Cameroon 22 11** 12** 350,779 17,153** 6,229** Chad 17 12 12 12 9. 52,279 20,381 20,381 79,754 30,070 Côte d'Ivoire 18*** 12*** 12*** 11*** 95,700*** 72,236*** 4,265*** 4,233*** Gambia 18*** 12* 12* 12* 11* 3,550*** 4,680* 4,680* 2,435* 5,019* Guinea 16 11 11 11 102,559 220,837 220,837 28,099 Guinea-Bissau
18 12 12 12 11 1,475 23,653 23,653 2,983 1,947
Mali 18 11 11 12 8 241,910 105,870 100,809 138,512 138,180 Mauritania 17 11 11 12 9 1,395 20,324 20,324 3,268 155 Mozambique 19 12*** 13*** 11*** 296,199 23,170*** 43,897*** 4,879*** Niger 17 11 11 12 9 1,496 10,080 10,080 167,922 332,889 Nigeria 18 12 12 12 10**** 131,815 43,575 43,575 183,788 187,579**** Senegal 20 14 14 13 14 24,648 60,542 60,542 11,512 69,531 Sierra Leone 24 21 21 13,401 295,530 295,530 Somalia 24 11 11 12 11,952 153 153 10,580 South Sudan 17 10,054 Sudan 12*** 9*** 84,736*** 1,512*** Togo 31 23 23 23 11 253,718 37,496 37,496 57,330 2,889 Uganda 20 15 15 13 13* 507,541 30,497 27,617 47,095 35,576* Mean % PHL 20 14 14 13 10.3 Annual PHL (t)
2,609,537 944,965 1,049,583 1,126,126 925,516
Notes: Data from the year 2012, with the exception of cells marked ****= 2006, ***= 2007, **= 2010, *= 2011 “-“ = no data (a) Losses incurred during harvesting, drying, handling operations, farm storage, transport and market storage Source: APHLIS, 2016 www.aphlis.net

Reducing Postharvest Losses In the OIC Member Countries
20
Figure 3: Percentage of postharvest weight losses of maize in Senegal (with inset showing provincial level maize postharvest losses in 2012)
Source: APHLIS 2016
Figure 4: Percentage of postharvest weight losses of rice in Sierra Leone (with inset showing provincial level rice postharvest losses in 2012)
Source: APHLIS 2016

Reducing Postharvest Losses In the OIC Member Countries
21
Figure 5: Percentage of postharvest weight losses of sorghum in Somalia and Senegal (with inset showing provincial level sorghum postharvest losses in 2012)
Source: APHLIS 2016
In addition to the PHL of the cereals produced by each country, PHL of imported cereal grains will also be occurring during storage, transport and marketing although this has not been the topic of detailed research to date. However, given the importance of cereal imports in many OIC Member Countries and the likely increased import dependency in the future due to high population growth, urbanisation and severe water shortages for crop production in some of the focal countries, it is clearly important to deepen understanding of the postharvest systems, losses and opportunities for reducing the losses of the growing quantities of imported cereals as well as home-grown cereals in these countries.
The total human population in these 57 OIC Member Countries was <1.2 billion in 1995, 1.7 billion in 2015, and is projected to reach 2.16 billion by 2030, and 2.77 billion by 2050. Estimates suggest that globally, sustainable food production will need to increase by at least 70% by 2050 (FAO, 2006; Bruinsma, 2009; Davies et al., 2009; Tilman et al., 2011). Alongside this increased demand for food, climate change and increased variability are making rain-fed agriculture yet more challenging. While attention focuses on increasing yields and productivity, an unacceptably high amount of the food produced is then lost after harvest. Urbanisation varies between the OIC Member Countries, but is increasing in all of them, 55% of the population are currently urban-based and this will increase to 60% by 2030. However, in many of the Arab and North African member countries urbanisation is already at levels of 75% or above. Food choices and food supply chains change with urbanisation, and all of these factors influence and change the postharvest elements of the food supply chains. Therefore, while it is important to review the literature regards the level of and points at which postharvest losses occur, it is also crucial to recognise that the food systems are rapidly changing to feed many more people in more urban situations, whose food choices are changing

Reducing Postharvest Losses In the OIC Member Countries
22
including a trend towards increased purchasing as opposed to self-production and home storage of their food. These factors all affect the postharvest food systems and the types of losses occurring, and opportunities for reducing them. Highlighting the need for studies to better understand contemporary postharvest food systems and losses and future trends.
The following text summarises some of the relevant literature on cereal postharvest losses amongst OIC Member Countries on a crop-by-crop basis. Most of the published PHL studies focus on storage losses, due to them being easier to monitor, estimate and measure and because the storage stage typically lasts for at least 3 months. The very limited data on food losses and waste in the Gulf countries, and the lack of related evidence-based strategic plans and policies was noted at an experts consultation meeting on ‘food losses and waste reduction in the near east region’ in 2012 (FAO, 2013).
Rice postharvest losses
Rice is a staple food for more than half the world’s people. Globally, the biggest rice producers are China, India, Indonesia and Pakistan. A regional rice PHL assessment covering 11 projects across several countries in central and south-eastern Asia in the 1990s, estimated that on average rice PHL accounted for a weight loss of ~13% of the final crop, with most losses occurring during milling, storage and drying (Table).
Table 3: Rice total postharvest losses across several countries in central and south-eastern Asia
Rice activity
stage
Average estimated % weight
loss
Notes
Harvesting 0.89 Harvest timing – over-maturity leads to breakages: 0.8% (Sri Lanka), 2.1% (Myanmar). Sickle reaping: 0.5-0.7% (Indonesia), 0.43% (China*). Traditional hand-cutting: 9.3% (Thailand), 1.9% (Myanmar). Mechanised: 1.1-5.2% (Thailand), 2.1-5.4 (Myanmar), 3.38% (China*). Field stacking and bundling: 0.3-9% (from 2 to 8 days).
Threshing 0.98 *In China, pedal threshing 0.8%, motor threshing 1.52%
Drying 3.10 Paddy drying: 2.2% (Bangladesh), 3.2% (Indonesia), 1.6% (Nepal), 0.5% (Pakistan). *In China, sun-drying on bamboo (3.35%), on cement (4.10%), with a screen (2.9%).
Storage 3.55 *In China of the 5.46% loss, 2.72% was due to rodents, 1.15% to insects, 1.59% to moulds
Milling 4.37
Total 12.89
Source: Adapted from Calverley, 1994, Grolleaud, IDRC China study
The proportional losses occurring at the different rice PH stages in the different study countries are compared below. Together the drying, storage and milling stages account for >80% of the total PHL (Figure 6).

Reducing Postharvest Losses In the OIC Member Countries
23
5.818.85
23.43
38.86
6.55
18.5Harvesting
Threshing
Drying
Storage
Transport
Milling
6.90
7.60
24.05
27.54
33.90
Harvesting
Threshing
Drying
Storage
Transport
Milling
Central and south-eastern Asia Estimated % postharvest weight loss = 13%
China Estimated % postharvest weight loss = 14.8%
Figure 6: Comparison of the proportion of rice postharvest losses occurring at different activity stages
Sources: Calverley (1994) cited in Grolleaud (2002); IDRC (1987-1989)
Opinions differ regards whether mechanising processes would reduce the quantity of rice lost PH, although it is recognised that mechanisation usually brings time and labour savings, but can be financially costly to access, with insufficient skills for operating equipment PHL could increase (Grolleaud, 2002). In Indonesia rice is still traditionally threshed using the slow and labour intensive method of beating the rice stems with bamboo sticks which leads to high losses (Riady et al., 2015). Although rice threshing machines are available, they are typically expensive, rarely work optimally with power supply often a problem. For example, milling losses in Indonesia reduced when milling machinery was introduced, but as the machinery aged this gain declined (e.g. mechanised rice-milling ratio for paddy declined from 70% to 60% as machines aged) (Simatupang & Timmer, 2008). IRRI researchers’ estimates of comparative losses in traditional and mechanised PH rice chains suggest a wide range of loss can occur with both traditional and mechanised process.
Two comprehensive studies of paddy losses in Indonesia in 1986/7 and 1994/5 suggested total harvest and postharvest losses were ~21%, with 15% occurring during harvesting and threshing (Maksum, 2002 cited in Simatupang and Timmer, 2008). Earlier work in Indonesia highlighted the links between the labour organisation system used and harvesting losses, and the technology for threshing losses. The largest losses (18.6%) occurred with open-access harvesting and the slapping paddy threshing system, and the lowest (5.9%) with labour-group (or trader-harvester) harvesting and mechanical threshing (Hasanuddin et al., 2002). A much earlier Indonesian study reported the harvest loss with the open-access system reaching a massive 42.5% of total yield loss, owing to stamping-down, dropping and left-over losses, as well as transportation losses between field and home (Utami and Ihalauw, 1973).
In Bangladesh, two studies thirty years apart compared PHL along the rice chain and between different stakeholders. The 2010 farmer level data came from a survey of 944 marginal, small, medium and large farmers. In contrast to the Indonesian study, these studies (as did the Central and south-east Asian studies) found the largest rice PHL occurred by farmers are during storage and drying. Although, in Bangladesh rice is often produced in 3 seasons each year with PHL differing by season and location. Processors incur more rice PHL during milling than drying or parboiling, and wholesaler and retailer rice PHL occur mainly during storage and transport (Table).

Reducing Postharvest Losses In the OIC Member Countries
24
In Pakistan, a survey in the late 1970s suggested that aggregate PHL were 17.1% in paddy rice (Chaudhary, 1980).
In Niger, most producers store their paddy rice for only 2-3 months and consider storage pest losses as a low to moderate problem (Baoua et al., 2015). In Benin, paddy rice weight losses of 1.6% were found after 7 months storage (Togola et al., 2013). Farmers typically store their rice as paddy as the husk adds protection against storage pest attack.
Table 4: Postharvest losses along the rice chain in Bangladesh Action Description Rice Wheat Maize Rice
Farmer level PHL
Processor level PHL
Wholesale level PHL
Retail level PHL
PHL PHL Global PHL
Harvesting Mainly done manually with a hand sickle, losses occur if harvesting is delayed
1.6-1.9%
#N/A #N/A #N/A #N/A #N/A 1.06-6.50
Transportation Mainly as bundles of panicles on the head or on carrying poles over their shoulders, or animal power, or boats or mechanised
0.9%-1.1%
#N/A #N/A #N/A #N/A #N/A 0.63-6
Drying Typically harvested at 24-26% mc, sun dried to 14% mc by women or children
2.2-2.4%
#N/A #N/A #N/A #N/A #N/A 1.56-5
Threshing Done by trampling on the harvested rice panicles by humans, animals or tractors, or beating panicles on a tub, threshing board or rack or with a stick. Some pedal or mechanical threshing
1.1-1.8%
#N/A #N/A #N/A #N/A #N/A 1.65-2
Storage Either in milled or paddy form, at farm homestead in woven cylindrical containers
3.4-4.1%
#N/A #N/A #N/A 1.5% 2.5% 3.0-7.5
Total 9.2-11.3%
1.13-1.3%
0.17-0.19 0.27-0.31% 3.6% 4.07% 7.9-27%
Note: PHLs at the processor, wholesaler, and retail levels were not found at different levels. Also PHLs for wheat and maize were not recorded only in storage. Source: Bala et al, 2010

Reducing Postharvest Losses In the OIC Member Countries
25
Wheat postharvest losses
Wheat is grown under diverse climatic conditions across much of the world and has been the staple food of the major civilisations in Europe, Asia and North Africa for 8,000 years. Wheat is used to produce a wide variety of food products, and animal feeds, starch and ethanol. In Pakistan, significant international development attention (e.g. by the World Bank, CIDA) was focused on large-scale public sector grain storage of wheat and rice during the late 1970s-1990s. During the 1980s, ~70% of the grain produced in Pakistan was retained at the farm and market level, while the Government procured about 30% which was then stored in Provincial Food Departments, PASSCO (Pakistan Agricultural Services and Supplies Corporation) and RECP (Rice Export Corporation of Pakistan) (Alam & Ahmed, 1989). The dry climate during the procurement season in Pakistan, means wheat was delivered by farmers to buying centres sufficiently dry enough for safe storage (e.g. 8-9% moisture content) (Agroprocess, 1985). Insect pest management in the large-scale stores typically used the fumigant aluminium phosphide, with some residual spraying of contact insecticides such as Malathion or Actellic. However, Alam and Ahmed (1989) confirmed the suspected widespread resistance to phosphine, Malathion, fenitrothion and Actellic in Pakistan amongst the key storage insect pest species Tribolium castaneum and Rhyzopertha dominica. The study recommended that urgent improvements (e.g. use of fumigation sheets or non-leaky go-downs, correct dosage of phosphine, fumigation to be conducted only by trained staff, monitoring of insect resistance, improved hygiene in warehouses, research into insecticidal admixtures for use as an alternative control strategy) were required in the phosphine fumigation practices to prevent further resistance developing and phosphine becoming a non-toxic gas to major insect pests of stored grain, as few alternative treatments existed. Chaudhary (1980) carried out comprehensive studies on postharvest losses of food grain in all the four provinces of Pakistan. PHL included losses incurred during harvesting, threshing, cleaning, drying, milling, storage, processing, cooking and consumption. That study found through guestimates that the aggregate PHL in Pakistan were 15.3% in wheat. Laboratory screening of botanicals such as Azadirachta indica and Ricinus communis leaves applied at 5-8% ratio (w/w) slowed grain weight loss during storage with insect pests, and prevented Tribolium castaneum from multiplying as rapidly as in the control (Haq et al., 2005). Wheat varieties have been screened for their resistance to Angoumois grain moth, Sitotroga cerealella (Shafique et al., 2006). Other unquantified PHL are linked to millers washing grain before milling, and then not re-drying it down to the required moisture content, which enables the miller to ship out the ‘required content of flour’, but due to the high moisture content the keeping qualities of the flour are reduced (CIDA, 1980). The various Pakistan wheat PHL studies report overall weight losses of 1-25%, and are presented in Table 5.

Reducing Postharvest Losses In the OIC Member Countries
26
Table 5: Overview of study findings on wheat postharvest weight losses in Pakistan Postharvest losses (%)
Storage losses
(%)
Comments Authors
15.3 - Aggregate weight loss during the postharvest operations; Threshing and winnowing losses of 1.5-1.7%; farmer level PHL 1.10-1.69%; market level PHL4.6-7.3%; public sector 3.6-6.2%; terminal level 1.9%
Chaudhary, 1980
22.7 9.5 13.2% loss during harvesting and threshing, 9.5% loss during storage
Ahmad & Afzal, 1984
2.7% loss during harvesting when ears are left in the field in Punjab, but this varies by variety 2.19% loss left on threshing floors from tractor Phalla type of threshing, 2.1% from bullock threshing, 1.4% from mechanical threshing. Mean threshing loss 1.5% in Punjab.
Grain Storage Research Laboratory (GSRL), 1994
- 3.5-25 Storage losses country-wide survey Irshad & Baloch, 1985
- 1.4-8.2 Storage losses during 4 months storage in house type godowns
Mohammad, 1986
- 2-9 Storage weight losses during 6-7 months storage Khan, 1986 - 4 and 7 Storage weight losses at farm-level (4%) and in the public
sector (7%) Baloch, 1986
- 20 Storage weight loss during 6 months lab storage with Khapra beetle
Ahmedani et al., 2011
- 2-2.5 Storage weight losses in public sector stores GSRL, 1994 - 4-20 Public sector storage losses due to rodents Hafiz and Hussain,
1961; Hussain, 1966 - 0.2-1 Public sector storage losses due to rodents Roberts, 1981;
Ahmed and Brook, 1986a, b; Ahmed et al., 1995
- 23 Losses due to rodents in go-down warehouses Micas, 1976 - 1-5 Losses due to rodents in go-downs Shafi, 1986
Rodents are also a major source of postharvest grain loss at household level, in small grain markets and in public and private sector grain stores. A study of godowns at TPX (~3km from Karachi Kemari Port) analysing the stomach contents of the different rodent species trapped in the godowns found that insects were a main food item along with rice and a preferred source of protein (Lathiya et al., 2008). Another study of rodents in grain shops in wholesale markets in Punjab, estimated an average year-round population of 40 rats per grain shop (Ahmed et al., 1995). These rats cause annual losses of 740 kg/shop/year, with 185 kg/shop/year due to rat consumption, and 555 kg/shop/year due to spillage and contamination. Given there are 5,500 shops in the major and minor markets throughout Punjab, the aggregate losses in them due to rodents in the Province reach ~4,000mt annually, or 0.3% of the 1.225 million MT of grain moved through the markets each year. Pakistan has a grading system for wheat based on fair average quality (FAQ) which includes specific tolerance for the presence of non-edible matter, other food grains, damaged kernels, and weevils (CIDA, 1980). Issues with wheat grain needing to be washed before milling, but not then being re-dried down to the required moisture content, which enables the miller to ship out the ‘required content of flour,’ but due to the high moisture content the keeping qualities of the flour are reduced. Due to the massive trade in wheat, supplies and losses in one country can affect other countries. Pakistan exports several hundred thousand tonnes of wheat flour to Afghanistan

Reducing Postharvest Losses In the OIC Member Countries
27
formally and informally each year (Ahmad, 2009). While in neighbouring India, there have been several studies of wheat damage and weight loss during storage, Rahman et al., (1945) reported 6-73% of wheat kernels damaged during a storage season, Prasad et al., (1977) found 15% damaged kernels during a few months storage, equating to a weight loss of 2.6%, and seed viability loss of 24%. Khan and Kulachi, (2002) found weight losses of 3.4-6.5% within 5 months storage, and high levels of discoloured and shrivelled grains and foreign matter. Maize postharvest losses
Maize (also commonly known as corn) is also widely grown throughout the world, its high genetic variability enables it to be produced in tropical, sub-tropical and temperate climates. More maize is produced than any of the cereals. It is an important staple food in many countries as well as being used in animal feed and various industrial applications. When grown by smallholder farming households, a very small proportion of the maize is harvested as green maize, for boiling and consumption or small sales, the rest is harvested once mature and following a short period of drying on the standing plant. The maize cobs are then transported home (by head-load, cart, bicycle, motorbike), dried either in their husks or de-husked, on platforms or a mat on the ground or on the bare ground (although this increases the risk of contamination). Once dry the cobs will be shelled, and the shelled grain usually further dried on mats or cow-dung plastered ground, and then treated to help protect it against insect attack during storage, prior to loading it into the storage container (maize grain is now commonly stored in sacks which are then kept indoors, as opposed to in granaries). Much of the smallholder maize marketing occurs within a few months of harvesting, with traders or aggregators typically moving through the villages and purchasing it. Households tend to regularly take some maize grain to the local mill for grinding into flour which is then often used in producing staple stiff porridges. In urban areas, maize is milled and often packed before retailing. Some of the purchased maize grain is also made into livestock feed. Many studies have focused on maize PHL particularly in sub-Saharan Africa. Much of that data has been used to create the APHLIS data set. In APHLIS the PHL figure can be further analysed to provide a rough comparison of what loss is occurring at each stage in the PH chain. As an example data from Kaduna state, Nigeria (2013) and for Eastern region, Uganda (2012) is shown in Table 6. This data shows the heaviest maize PHL occurring during harvesting and field drying, and storage. The studies which the estimates are partially based on are shown in the final column.
However, it must be remembered that due to the complexity such a long-term multi-spatial multi-actor study, few, if any, studies have quantitatively assessed and compared losses all along the different stages of a maize (or other cereal) value chain. It should also be remembered that such figures would be both highly contextual and relatively subjective in nature. Whilst such figures might be used to target loss reduction investments, some types of loss may be easier than others to reduce. Given the various investments (e.g. time, financial, natural resources) that farming households need to make to reduce PHL, it is important to consider what incentives would help drive these changes and these are explored (see Hodges & Stathers, 2013 for discussion).

Reducing Postharvest Losses In the OIC Member Countries
28
Table 6: Levels of losses along the maize postharvest supply chain in Kaduna state, Nigeria and Eastern region, Uganda
Postharvest stage % losses incurred postharvest by
smallholder maize farmers storing
maize for 6 months
References used to determine figures
Nigeria (2013)*
Uganda (2012)**
Harvesting/ field drying 6.4 6.4 Egyir et al., 2011; Vervroegen & Yehwola, 1990; Singano, 2008; Boxall, 1998; Grolleaud, 1997; Mvumi et al., 1995; Odogola & Henrikkson, 1991
Further drying 3.7 4 Odogola & Henrikkson, 1991; Jonsson & Kashweka 1987
Threshing and shelling 1.2 1.3 Odogola & Henrikkson, 1991; Egyir et al., 2011; Boxall, 1998; Grolleaud, 1997; Mvumi et al., 1995
Winnowing - -
Transport to farm 2.1 2.4 Odogola, 1991; Vervroegen & Yehwola, 1990; Singano, 2008; Egyir et al., 2011; Boxall, 1998
Farm storage 4.6 10.5 SSEAD, 1997; De Lima, 1979; Giles, 1986; Nyambo, 1993
Transport to market 0 1.7 Odogola, 1991; Egyir et al., 2011
Market storage 0 2.7 Egyir et al., 2011; Boxall, 1998
Cumulative PHL 18 19.3 % marketed within 3 months of harvest - 60
Total maize lost in Province that year (t)
56,900 230,841
Notes: * = Kaduna Province, ** = Eastern Region, “-“ = no data Source: data taken from APHLIS www.aphlis.net (2016), illustrations from Hodges & Stathers, (2012).
In Pakistan, a survey in the late 1970s suggested that aggregate PHL were 12.6% in maize (Chaudhary, 1980).
A recent study in Nigeria focused on the guestimates of PHL for two maize products: green maize and animal feed, found that farmers reported their biggest losses were due to pre-harvest pests and diseases, followed by PHL during harvesting (estimated at 4.03% of the total harvest), while shelling, storage of dry maize cobs and dry maize grain and transport of fresh maize to the market entailed losses of 1.53-2.27% (GIZ, 2013a). Maize marketers’ felt significant losses occurred during the marketing stages, mostly due to handling and storage problems (weevils (Sitophilus zeamais) (8.5%), rodents (6%), spillage (5.9%), and moisture (2.5%)), and to a lesser extent during transportation (3.7%). The feed millers reported that their most significant problems occurred during transportation of the maize from the market to the feed mill (2%), spoilage during storage of maize grain prior to milling by rodents (2.8%) and weevils (1%), and during storage of the animal feed product due to weevils after 3 months storage (2%), spillage of feed (2%), and transport of feed (3%). The study estimated that the total value of maize (green and grain) and feed lost between harvest and marketing was ~120 billion Naira, which corresponded to approximately EUR 576 million. A small related study, which used the lifecycle assessment to estimate the environmental impacts of losses calculated that 1t of maize feed had a footprint of 0.73 t CO2eq (GIZ, 2013b). Agriculture was the main contributor, with maize processing contributing 10% of the footprint. Production of 1t of

Reducing Postharvest Losses In the OIC Member Countries
29
maize feed caused water deprivation of 0.3m3, and the associated PHL account for 21% of the area under maize.
Sorghum and millet postharvest losses
Sorghums and millets are often collectively referred to as the ‘small grain crops’. Most sorghum varieties are heat and drought tolerant and thus important foods in arid areas within Africa, Central America and South Asia. Sorghum is also used to produce alcoholic and non-alcoholic beverages and biofuel. The millets refer to a number of small-seeded annual grasses that are cultivated as grain crops, primarily on marginal lands in dry areas of temperature, sub-tropical and tropics regions. They are grown as food and feed, and globally the largest producers are India and Nigeria.
These small grains are typically harvested after the rainy season, and therefore by the time they reach maturity there is less danger from humidity than from birds and other field pests (e.g. rodents or wild or domesticated animals), especially for broken stalks and fallen ears or panicles, plus damage from natural dehusking and theft (INPhO, 1999). However, when the harvest is gathered during the rainy season, fast drying is necessary. Millet and sorghum grains are traditionally stored still on the ears or panicles by smallholder farmers as this is thought to better preserve their quality. They are typically then beaten with sticks to obtain the grains as required by the household, the small grains are easily lost in the soil during threshing. Data in Grolleaud (2002) suggests mechanical threshing of millet caused higher losses (19.3% losses) than manual (6.3%) in Gambia, due to breakages and grains remaining on the ears and panicles. A study by the African Studies Centre in 1987 found storage losses alone ranged from 2-10% in millet, and 4-12% in sorghum across 6 West African countries (Table). Smallholder farmers in many parts of SSA consider millet a crop that can be stored for 2 years without protection as few insects tend to attack it, by contrast they view maize and some sorghum varieties as being far much more likely to be damaged during storage. APHLIS 2012 PHL estimates range from 8.5-13% for millet across 14 SSA countries, and 11.2-23% in sorghum across 18 SSA countries. The APHLIS data for Niger suggests for sorghum and millet the losses are occurring during harvesting/ field drying (4.6%/ 3.5%), threshing (3.6%/ 2%), transport to farm (2.2%/ 2.5%), farm storage (2.5%/ 1.1%), transport to market (1%/ 1%), and market storage (2.7%/ 2.7%). A very recent survey of 1293 farmers and traders in southern Niger, found the most commonly stored commodities in Niger were millet and sorghum, typically stored for about 6 months by 53% and 80% of respondents respectively (Baoua et al., 2015). Most respondents took no measure to control insect pests in their stored grains. Some traders were found to store millet and sorghum for up to 60 months, with some of them keeping up to 400 tons of millet or 500 tons of sorghum. The researchers collected samples during their survey and kept them in jars in the laboratory for 7 months, finding weight losses then reached 17.1% (millet) and 10.9% (sorghum), although insects were prevented from escaping or entering, unlike in the field where insects typically disperse once the grain becomes depleted.
Table 7: Sorghum and millet storage losses in traditional granaries in tropical Africa Country/area Sorghum Millet
form % loss form % loss Burkina Faso ears 6 ears 10 Northern Nigeria ears 4 Senegal grain + sand 10 ears 2 Northern Ivory Coast ears 11 -12 Mali - - ears 2 – 4 Niger - - ears 3 - 10 Source: African Studies Centre, EHESS, Paris, 1987

Reducing Postharvest Losses In the OIC Member Countries
30
Early work to control minimise mycotoxins in the sorghum chain, found that treatment of sorghum grain with sodium metabisulphite inhibited 95% of internal grain fungi, but also significantly reduced germinability (Magan & Aldred, 2007; Raghunathan et al., 1969). The biology and management of millet and sorghum insect pests has been the focus of several research studies including Mvumi (2001), Sharma et al., (2007), Pushpamma et al., (1985), FAO and INPhO, (1998). Barley postharvest losses
Barley postharvest losses in industrialised countries are generally considered to be very low (0.07-2.81%), (Smil, 2004a cited in Parfitt et al., 2010). Although the principle growing areas are Europe and Russia, it is also a valuable and resilient crop in arid and semi-arid areas of Asia, the Middle East and North Africa. Mainly used as flour for human consumption, in animal feed and as malt in alcoholic beverages. Work in Turkey highlights concerns related to PH grain protectant pesticides (such as Malathion and fenitrothion) metabolites entering the beer chain through the malted barley (Uygun et al., 2007). Some of the metabolites are more toxic than the parent pesticide compounds. The malting process was found to reduce the pesticide residue levels of barley extensively. The only OIC Member Country that APHLIS has data on barley PHL for is Uganda. In 2012, it was estimated that barley PHL losses were 12.5% (~630 tonnes). For Eastern region, these losses occurred mainly during harvesting/field drying (3.5%), threshing (3.5%), transport to farm (2.5%), farm storage (0.3%), transport to market (1%), and market storage (2.7%). 2.2.2. Roots and Tubers Introduction
Root and tuber crops (RTC), including cassava, sweet potato and yams are important to the agriculture and food security of many countries and overall are a component of the diet for 2.2 billion people as well as contributing to animal feeds and industry. The annual world production of root and tuber crops is about 765 million tonnes (MT) (FAOSTAT) consisting of potatoes (333mt), cassava (237mt), sweet potatoes (130mt), yams (53mt), and taro and other aroids (12mt). The global consumption of tropical root and tuber crops is around 110kg/capita/year. As such tropical root and tuber crops compare very favourably with the main staple grain crops such as wheat and rice. Most of the potato production is consumed in the developed countries whereas most of the cassava, sweet potatoes, yam, taro and other aroids are consumed in the low to middle income countries (LMICs). Despite their importance, however, investment in RTC has been much lower than in the cereal crops. Root and Tuber Crops are important because they meet local food preferences, providing an important part of the diet as they produce more edible energy per hectare per day than any other crop groups, they play an important role in food security, nutrition and climate change adaptation, they provide important sources of income through direct sale and value-addition via processing for food and non-food uses. In this respect, the productivity of root and tuber crops is often affected by the accumulation of pests and diseases which are passed on through vegetative propagation. A further challenge is that compared to crops such as wheat, rice and maize, root and tuber crops are bulky, have a high water content and a

Reducing Postharvest Losses In the OIC Member Countries
31
relatively short shelf-life. This constrains value chain development and the expansion of production and delivery at scale to processors and markets. This also adds to the challenge of minimizing postharvest losses. For example, the FAO SAVE FOOD: Global Initiative on Food Loss and Waste Reduction key findings indicate that root and tuber crops, along with fruit and vegetables, have higher levels of waste than other foods (http://www.fao.org/save-food/resources/keyfindings/en/) states that root and tuber crops. The working paper (http://www.fao.org/3/a-au870e.pdf ) gives suggestions for mitigation of losses of root and tuber crops in Ghana. Postharvest losses (physical and economic) in OIC Member Countries
OIC Member Countries ranked in order of production and main root and tuber crop along with reported information about the extent of physical and economic losses (Table). Table 8: Postharvest losses reported for main root and tuber crop produced OIC Member Countries
Country Main Roots and Tuber Crop
Production (MT)
Physical loss (%)
Bangladesh
Potatoes
8,603,000 23-28% (Hossain and Miah, 2009)
5.2% in the harvest period 6.4% in the off-season
Egypt 4,800,000 18% (Blond 1984)
Algeria 4,400,000 10-40% (Yahia 2005)
Kazakhstan
3,343,600 10-20% Agricultural production (Shortan 2014) 10-30% postharvest handling and storage (Shortan 2014) 3-5% processing and packaging (Shortan 2014) 10-15% distribution and packaging (Shortan 2014) 5-15% consumption at the household level (Shortan 2014)
Azerbaijan 992,800 10-40% (Yahia 2005)
Bahrain 180 10-40% (Yahia 2005)
Nigeria Cassava
54,000,000 7%, 1% on farm (Naziri 2015)
25% for Gari 8.5% on farm (Oguntade 2013)
Mozambique
10,000,000 43% Agricultural Production (Jones et al., 2015) 14% Postharvest Handling and Storage (Jones et al., 2015) 18% Processing and Packaging 15% Distribution (Jones et al., 2015) 5% Householder and consumers (Jones et al., 2015)
Cameroon 4,596,383 30% (Market Insider 2015)
Benin 3,695,514 13.6% Harvesting 8.5% Handling (Mutungi and Affognon 2013) 40–50% Storage cassava Chips (Mutungi and Affognon 2013) 23.2% Processing 3
Côte d'Ivoire
Yams
5,800,000 N/A
Mali Sweet potatoes 250,000 N/A
Note: Economic loss (Value) was only given for Nigeria: US$50 million (South West only) (Naziri 2015) EUR 686 million (Oguntade 2013)
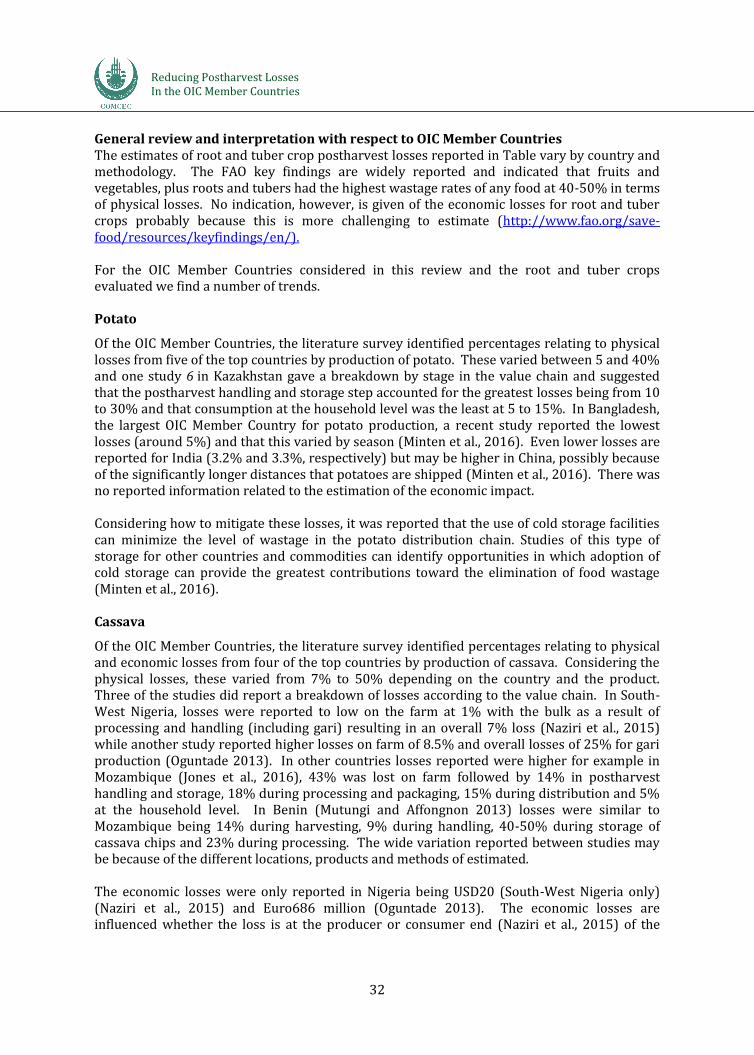
Reducing Postharvest Losses In the OIC Member Countries
32
General review and interpretation with respect to OIC Member Countries The estimates of root and tuber crop postharvest losses reported in Table vary by country and methodology. The FAO key findings are widely reported and indicated that fruits and vegetables, plus roots and tubers had the highest wastage rates of any food at 40-50% in terms of physical losses. No indication, however, is given of the economic losses for root and tuber crops probably because this is more challenging to estimate (http://www.fao.org/save-food/resources/keyfindings/en/). For the OIC Member Countries considered in this review and the root and tuber crops evaluated we find a number of trends. Potato
Of the OIC Member Countries, the literature survey identified percentages relating to physical losses from five of the top countries by production of potato. These varied between 5 and 40% and one study 6 in Kazakhstan gave a breakdown by stage in the value chain and suggested that the postharvest handling and storage step accounted for the greatest losses being from 10 to 30% and that consumption at the household level was the least at 5 to 15%. In Bangladesh, the largest OIC Member Country for potato production, a recent study reported the lowest losses (around 5%) and that this varied by season (Minten et al., 2016). Even lower losses are reported for India (3.2% and 3.3%, respectively) but may be higher in China, possibly because of the significantly longer distances that potatoes are shipped (Minten et al., 2016). There was no reported information related to the estimation of the economic impact. Considering how to mitigate these losses, it was reported that the use of cold storage facilities can minimize the level of wastage in the potato distribution chain. Studies of this type of storage for other countries and commodities can identify opportunities in which adoption of cold storage can provide the greatest contributions toward the elimination of food wastage (Minten et al., 2016). Cassava
Of the OIC Member Countries, the literature survey identified percentages relating to physical and economic losses from four of the top countries by production of cassava. Considering the physical losses, these varied from 7% to 50% depending on the country and the product. Three of the studies did report a breakdown of losses according to the value chain. In South-West Nigeria, losses were reported to low on the farm at 1% with the bulk as a result of processing and handling (including gari) resulting in an overall 7% loss (Naziri et al., 2015) while another study reported higher losses on farm of 8.5% and overall losses of 25% for gari production (Oguntade 2013). In other countries losses reported were higher for example in Mozambique (Jones et al., 2016), 43% was lost on farm followed by 14% in postharvest handling and storage, 18% during processing and packaging, 15% during distribution and 5% at the household level. In Benin (Mutungi and Affongnon 2013) losses were similar to Mozambique being 14% during harvesting, 9% during handling, 40-50% during storage of cassava chips and 23% during processing. The wide variation reported between studies may be because of the different locations, products and methods of estimated. The economic losses were only reported in Nigeria being USD20 (South-West Nigeria only) (Naziri et al., 2015) and Euro686 million (Oguntade 2013). The economic losses are influenced whether the loss is at the producer or consumer end (Naziri et al., 2015) of the

Reducing Postharvest Losses In the OIC Member Countries
33
value chain. For example in Ghana physical losses were slightly greater than in Nigeria at 12% but economic losses were much higher at USD500 million because the physical losses occurred at the consumer end whereby the roots had significantly increased in value. Economic losses in West African countries were also reported to be much higher than in Asian countries such as Thailand and Vietnam were cassava is considered to be a cash crop rather than a food crop (Naziri et al., 2015). Yam
In the OIC Member Countries considered, postharvest losses of yams vary due to susceptibility in rotting and the duration of dormancy but were not included in Table because yams were not the major crop. Although the estimates of yam postharvest loss vary, they are all high (10 to 50%). Losses occur at all stages in the value chain. Research undertaken in Ghana, Côte d’lvoire and Nigeria has estimated that 10 – 50% of yams produced and harvested are lost in storage (Amusa et al., 2003; Rees and Bancroft, 2003), while yams at the retail stage in the markets have been found with 3-40% rotting tubers. Very few reports have been found that quantify the level of losses at different stages of handling (Kleih et al., 1994).
In Nigeria, Dossou et al. 2010 state that although the level of postharvest losses (quantity and quality) varies with region, approximately 5-10% tubers are lost in transit/storage. A yam farmer survey in Ghana found that about 97% of households during the last cropping year reported losses at the end of storage, on average, of about 17% of their yam from rotting (Mignouna et al., 2014a). About 88% of households had 20% of their yam sprouting; only 10% of households reported they had lost 4% of yam through other causes, such as rodents and theft. A survey by the same authors (Mignouna et al., 2014b) in Nigeria also showed that 97% of households reported losses at the end of storage, with 14% of their tubers lost to rot and 94% had them sprouted. About 23% of the respondents lost 2% through other causes such as rodents and theft
Sweetpotato
In the OIC Member Countries considered, postharvest losses of sweetpotato varies due to susceptibility in handling, rotting and storage and processing but were not included in Table because sweetpotato was not the major root crop. The estimates of postharvest losses according to FAO are in the order of 40-50%. Economic losses in Tanzania of 10 to 30% were reported due to handling (Ndunguru et al 1998) but this is lower than the FAO figure.
Nutrition losses due to the loss of vitamin A in sweet potato flour and chips (Bechoff et al 2010). The losses steadily increase with storage time and after 2 to 3 months can be as high as 70%.
Conclusion
For many OIC Member Countries who are significant producers of root and tuber crops, there is no information available regarding the extent of physical, economic and nutrition/quality losses. Where information was available, the potential for quality, quantity, economic and nutrition losses at each stage in the value chain for root and tubers has been assessed to a limited extent and not for a specific root and tuber crop or location. Issues highlighted include non-reporting of methodologies used to estimate loss, possible variation in losses between countries and location, variation in product type and seasonal variations. It appears that more recent publications are indicating that losses in some root and tuber crops (specifically cassava) are less than the FAO figure of 40-50% often mentioned. Economic losses will be lower where physical and quality losses occur at the farm end when they will very significant
Reducing Postharvest Losses In the OIC Member Countries
34
(USD500 million) if they happen at the consumer end of the value chain. One study explored nutrition losses relating to vitamin A in sweetpotatoes and reported a figure of 70% in stored chips. This nutrition loss in critical because it is not a weight loss and the only measurable quality loss is a change in colour. Hence this may not translate into an economic loss through discounting but the impact on health will be significantly reduced. 2.2.3. Oilseeds and Pulses
Introduction
Global production and consumption of oilseeds and pulses continue to grow as their relative importance as sources of energy and proteins in the diets most of the world’s population and as industrial crops continues to grow. Postharvest losses in these subsectors, therefore, represent critical challenges in, especially developing countries including members of IOC, in terms of household food and nutrition security, household farm income, sustained growth in agro-based industry, and capacity to respond to climate change through exploiting alternative plant-based renewable energy sources. This desk-based review examines the scale of postharvest losses in oilseeds and pulses. It covers the following:
The relative importance of oilseeds and pulses. Overview of postharvest losses in the subsectors, including evidence from selected
countries. Some of the underlying causes of postharvest losses in the subsectors. Potential options to reduce postharvest losses in the oilseeds and pulses subsectors.
Global production and consumption of oilseeds and pulses
The bulk of the oil extracted from oilseeds is utilised as food (cooking oil and other processed food products as well as for manufacturing cosmetics, detergents and oleo-chemical products (e.g. paints and lubricants). A sizeable and growing proportion is into producing biofuels. For instance, in Argentina about 64 percent of domestic vegetable oil consumption goes into producing biodiesel, about 50 percent of which is exported. In the European Union about 40 percent of domestic vegetable oil consumption goes into biodiesel production and into direct generation of electricity3. By volume, the dominant oilseeds are soybeans and oil palms. According to M Boersch (2015), soybeans and oil palm will continue to dominate global oilseed supply beyond 2025. The US and Brazil dominate soybean production whilst Malaysia and Indonesia lead in the supply of palm oil. China is by far the lead importer of oilseeds. Production in the major-producing countries is dominated by commercial farmers whilst processing is concentrated in large-scale processing facilities. In most developing countries, especially in Africa, smallholder farmers lead in production whilst significant share of the processing occurs at small to medium-scale enterprises using basic processing equipment.
Pulses: These are edible legume crops, which are rich in protein, lysine and starch. They include dry peas, beans, lentils and chick peas which have high levels of dietary fibre and low glycemic index (and therefore important for people with diabetes). Despite these benefits, it is reported that consumption of pulses has seen a slow but steady decline in both developed and developing countries even as consumption of dairy products and meat has increased. Citing data from FAO, Maredia (2012) notes that it is only in Sub Saharan Africa (SSA) that the contribution of pulses to total protein intake is slightly above 10%. In South East Asia the contribution is just under 4% whilst in most developed countries the contribution of pulses to
3 Source: OECD/FAO Agricultural Outlook, 2015: Oilseed and oilseed products.

Reducing Postharvest Losses In the OIC Member Countries
35
total protein intake is only 2.5%. Pulses constitute a commodity group which is describe by promoters of Feed the Future as being “uniquely positioned to contribute towards sustainably reducing hunger and poverty whilst simultaneously enhancing nutrition, health and the environment”. Global output of these crops has been around 40 million tonnes per year for the past 10 years and is led by India followed by Canada. Postharvest losses in oilseeds and pulses
There is a dearth of information and data on the level of postharvest losses in oilseeds and pulses. For instance, the African Postharvest Losses Information System (APHLIS)4 provides a breadth of data on cereal grains but does not include oilseeds or pulses. A study by the Central Institute of Postharvest Engineering and Technology (CIPHET) in India reported in 2015 that cumulative postharvest losses for oilseeds in general ranges between 3 to 10%5. There is every likelihood that the overall figures for SSA will be higher considering that the estimates are lower than for cereal grains – 5 to 6% in India in contrast with about 13% for SSA (Hodges et al. 2011). For pulses, Jeswani and Baldev (1990) estimate postharvest losses at very high levels of between 25-50%.
It has to be noted that even the scant data available tends to focus on one form of postharvest losses – that is quantitative or physical losses which can occur as a result of rodent or insect attack or biochemical changes which make the crop hard to cook or process. The losses can also be qualitative – making it difficult to market the commodities unless there is a steep discount reflecting the quality of the grain. A survey of literature on postharvest losses in SSA found that 139 out of 213 (i.e. over 65%) documents reported only losses in the form of edible mass lost or discarded6. Only 13.1 percent of the documents reviewed during the study reported quality losses. This is despite that fact that there is considerable evidence suggesting that quality losses due, for instance, to infestation by mycotoxins can cause sharp decline in output market prices and may sometimes even lead to loss of access to lucrative export markets for important oilseeds (Nakhumwa C, 2015).
Access to the evidence generated from studies on postharvest losses can also be difficult. Affognon et al. (2014) report that over 57% of the research documents they reviewed were unpublished grey literature held in universities, national research institutions and NGOs in the form of dissertations, conference proceedings and working papers. Incidentally, the reviewers considered only 32.7 percent of the reports as being of good or excellent quality – raising concerns about the quality of evidence generated.
Factors contributing to postharvest losses in oilseeds and pulses
Factors contributing to postharvest losses in the two commodity groups include those listed in Table 9 below.
4 APHLIS website (http://www.aphlis.net/?form=home) 5 Jha SN et al. (2015) “Assessment of quantitative harvest and postharvest losses major crops and commodities in India”, CIPHET, India. 6 Affognon et al. (2014) “Unpacking postharvest losses in Sub Saharan Africa: a meta-analysis” World Development Vol. 66 pp.49-68.

Reducing Postharvest Losses In the OIC Member Countries
36
Table 9: Causes of postharvest losses of pulses at different stages Activity/stage Type of loss Contribution to
postharvest loss (%)
Harvesting Losses due to shattering and/or attack by rodents, birds and other pests
4
Threshing Improper threshing and field handling 6
Drying Improper drying leading to moulds 4
Transporting Quantitative losses due late or inefficient transportation 2
Primary processing Poor handling, sorting and packaging 4
Storage Inefficient storage leading to quantitative and quality losses 20
Secondary processing Poor processing practices 60
Source: based on information from Jeswani and Baldev (1990)
Innovations can make a difference in postharvest losses. As indicated above, Affagnon et al. (2014) reviewed 213 postharvest studies in SSA. The countries covered were: Benin, Ghana, Kenya, Malawi, Mozambique and Tanzania. The main oilseed covered was groundnuts and the pulses were cowpeas and common beans. The estimated physical quantitative losses – without and with adoption of loss-reduction technologies are summarised below:
Oilseeds (e.g. groundnuts): the estimated average annual postharvest loss is 10%. This estimate does not take account of potential quality-related economic losses. For instance, the level of Aflatoxin infestation in groundnuts in Ghana is estimated by Anim-Somuah et al. (2013) to be over 70%. However, owing the fact that groundnuts produced in Ghana is largely marketed locally this does not affect the crop. However, as reported by Nakhumwa (2015) Malawi lost access to lucrative European markets largely because of high levels of Aflatoxin infestation.
Pulses (e.g. cowpeas and dry beans): estimated postharvest losses ranges between 14 and 24% by volume. However, this can potentially be reduced to between 2 to 3% if appropriate mitigation strategies are adopted. Coincidentally, postharvest losses for cereals in SSA which can be as high as 26% can be reduced to about 6% with appropriate postharvest handling and technologies.
Loss-reducing pre- and postharvest handling techniques and technologies
Evidence from various sources indicate that adoption of the practices and technologies outlined below can significantly reduce postharvest losses in oilseeds and pulses: Pre-harvest practices include planting suitable varieties and at the recommended seed
rates per hectare. For instance, there is evidence from Malawi indicating that most smallholder groundnuts farmers plant at rates of about 47 kilograms per hectare instead of the recommended rate of 80 kilograms per hectare. Consequently, the lower plant population limits natural ground cover by the leaves and therefore increases vulnerability to pests such as Aphids and diseases like Rosette virus disease which lead to losses (Simtowe et al. 2010).
Harvesting: timing is crucial, especially where unanticipated rainfall during the harvest season makes field drying of crops difficult. The harvesting technology can also affect level of losses in the field. It can also affect the speed of harvest and therefore the level of losses due to attack by rodents, insects and birds.
Postharvest drying allows crops to store better. It is important that storage occurs in the right environment – for instance in well-aerated cribs or on clean surfaces from which livestock are excluded. This will not only reduce quantitative losses but also minimise

Reducing Postharvest Losses In the OIC Member Countries
37
quality losses due to contamination with foreign matter. The recommended moisture content prior to storage for major pulses are as follows: Peas = 16% Green lentils = 14% Chickpeas = 14% Beans = 14% Soybeans = 14%
Where the crop is taken into storage at the moisture levels indicated above, the shelf life can range between 31 to 55 weeks if stored under cool and dry conditions with temperatures around 26oC. Appropriate ventilation is necessary to minimise the risk of quality deterioration during storage. Fumigation may also be necessary to minimise losses due to pest damage. 2.2.4. Fruits and Vegetables
Introduction
This section looks at postharvest losses and research in 13 fruit and vegetable product groups, for the 57 OIC Member Countries. The fruit commodities investigated are: bananas; dates; fruit, fresh nes; grapes; mangoes, mangosteens and guavas; watermelons and the vegetables covered are: beans (green); cucumbers and gherkins; onion, dry; tomatoes and vegetables, fresh nes. Issues relating to postharvest losses of tomatoes predominate (Table 10).
Table 10: Summary table for fruit and vegetables Crop OIC Member Countries
Bananas Comoros, Indonesia, Maldives, Mozambique, Suriname
Beans, green Guyana
Cucumbers and gherkins
Oman
Dates Bahrain, Mauritania, Pakistan, Qatar, Saudi Arabia, United Arab Emirates
Fruit, fresh nes Somalia
Grapes Afghanistan
Mangoes, mangosteens, guavas
Palestine, Occupied Tr., Yemen
Onions, dry Niger, Senegal, Sudan
Pineapples Benin
Plantains Cameroon, Côte d'Ivoire, Gabon, Guinea, Guinea-Bissau, Uganda
Tomatoes Azerbaijan, Bangladesh, Brunei Darussalam, Burkina Faso, Chad, Djibouti, Egypt, Gambia, Iran (Islamic Rep. of), Iraq, Jordan, Kuwait, Kyrgyzstan, Lebanon, Malaysia, Morocco, Nigeria, Syrian Arab Republic, Togo, Tunisia, Turkey, Turkmenistan, Uzbekistan
Vegetables, fresh nes
Sierra Leone
Watermelons Albania, Algeria, Kazakhstan, Libya, Mali, Tajikistan
Source: OIC

Reducing Postharvest Losses In the OIC Member Countries
38
The FAO and AfDB’s Framework Paper on Postharvest Loss Reduction in Africa (2009 ) highlights three types of generic issues relating to fruit and vegetable postharvest losses, caused by their soft texture and high moisture content, which makes them susceptible to postharvest losses which are categorised as follows:
• Mechanical injury, which can occur at any stage from the field to market, including during harvesting, packing, storage and transporting;
• Pathological damage caused by invasion of bacteria and fungi, often associated with physical injuries;
• Physiological deterioration due to natural ripening and senescence processes which are influenced by temperature and humidity, so that produce that is packed or transported without cooling or adequate ventilation will quickly become unusable.
Such injury and damage generally leads to economic losses as the produce reduces in value and nutritional content. However, some market uses may be found for such produce and some revenue obtained. The short natural ripening period frequently leads to physical and financial losses when gluts of produce occur due to farmers planting the same varieties of crop that mature at the same period without having investigated and ensured markets for their produce.
In the OIC Member Countries traditional marketing systems, including urban wholesale markets, continue to play a dominant role in fresh fruit and vegetable marketing. Trading tends to be done through informal trading systems and farmers tend to have limited knowledge of prices and quantities and qualities demanded.
In some countries, particularly in big cities, supermarket chains are increasingly important as buyers of fresh produce and opt for direct procurement systems via contract farming or use category managers - buying companies that supply supermarkets with particular product categories.
Physical losses can occur throughout the supply chain arising from inherent difficulty of collecting and transporting small quantities of produce from numerous small farms, and trying to assemble them into a large enough quantity for efficient domestic marketing; lack of knowledge, equipment and appropriate technologies; lack of integrated management systems, poor supply chain infrastructure; access to service providers and advisory support from the public sector; and weak communication between producers, traders and receivers (FAO and AfDB, 2009).
Key causes of postharvest losses include inappropriate harvesting periods, lack of appropriate harvesting containers, excessive field heat and lack of on-farm storage facilities and inappropriate packaging materials.
In all the publications investigated there was virtually no information on actual produce losses. However, considerable research is undertaken in the 58 countries into ways to reduce postharvest losses, such as through plant breeding, use of controlled atmosphere storage trials, improved packaging and so on.
Methodological issues
The FAO and AfDB (2009) report highlights that though the causes of losses may be readily apparent, the complexity and heterogeneity within the marketing systems for fruit and vegetables makes it difficult to quantify the postharvest losses (PHL). Some estimates given include an average range of 15 to 44%. Courtbaoui and Ngadi (2016), based on their

Reducing Postharvest Losses In the OIC Member Countries
39
experience of research in Guyana, highlight the fact that “current literature does not offer integrated and reliable approaches for evaluating postharvest losses of fresh produce”.
Fruit and vegetables investigated – key postharvest loss research and findings
Bananas (Comoros, Indonesia, Maldives, Mozambique, Suriname) No postharvest loss data or information found in the target countries. Dates (Bahrain, Mauritania, Pakistan, Qatar, Saudi Arabia, United Arab Emirates) The limited literature (Kader and Hussein, 2009) indicates that this crop suffers from high postharvest losses due to fermentation, insect infestation, birds, and mechanical damage. Insect infestation and damage caused by insect feeding on the dates is one of the primary causes of postharvest losses in quality and quantity. Dates can be infested with some of the stored-products insects (such as Oryzaephilus surinamensis, Oryzaephilus mercator, Tribolium confusum, Plodia interpunctella, Cryptolestes ferrugineus, and Cadra spp.). Ectomyelois ceratoniae Zeller (date carob-moth) is widely distributed in date production areas, and causes significant postharvest losses in stored dates. (Yahia, et al., 2011). Fungi (Aspergillus, Alternaria, and Penicillium spp) may grow on dates with high-moisture, especially when harvested following rain or high humidity. Growth of Aspergillus flavus on dates can result in aflatoxin contamination and cause economic loss.
No research was found on quantities, proportions or values of postharvest losses of dates. Grapes (Afghanistan) Farmers transport grapes to market in locally-produced bags and woven baskets, leaving the buyer to sort fruit by size or quality. Fruit at the bottom of the container ends up bruised or crushed (US Department of State, 2013). Poor harvest techniques and postharvest handling are considered responsible for an estimated 15% to 25% postharvest loss annually (USDA, 2011). One of the major constraints facing the industry is the drying process which predominately occurs in unsanitary conditions and produces raisins which are not suitable for export to developed countries’ markets.
Mangoes (Palestine, Occupied Tr., Yemen) Postharvest horticultural produce losses considered to be high but not quantified in these countries.
Pineapples (Benin) Fassinou Hotegni et al. (2014) highlight the economic losses from pineapples grown for export markets not meeting external standards. Each time producers want to export fresh pineapple to Europe more than 50% of what is delivered to be exported is rejected because it does not meet European import criteria. In 2010, from 220,800 Mg of pineapple produced, only 82 Mg (0.037%) was exported. The remaining pineapples were sold on the local and regional markets with lower quality demands and lower prices.
Watermelons (Albania, Algeria, Kazakhstan, Libya, Mali, Tajikistan) The USAID Albania Agriculture Competitiveness program held its 3rd Regional Watermelon Round Table in 2011 at which 62 watermelon value chain actors - input suppliers, consolidators, representatives of farmers’ associations, specialists from the Lushnjë Technology Transfer Center, and financial institutions - attended. Presentations were given on lessons learned, season selection for harvesting and selling watermelon, market demands, and quality issues. Growth in investments, in new greenhouses and fruit plantations, postharvest investment, mainly cold storage for fruits supported by national schemes and donors, was

Reducing Postharvest Losses In the OIC Member Countries
40
viewed as beneficial. Enhancement of experience of traders was said to positively affect sector development.
In Tajikistan losses lead to higher food prices. The people primarily impacted by postharvest loss are the "dehkan" farms (small and medium-sized peasant farms) which lose revenue on product spoiled during pre-market transit, processing and storage, as well as consumers, who find the supply of local produce significantly reduced in winter months due to lack of proper long-term storage facilities. Lack of reliable government-collected and maintained data remains a significant challenge. The first step to addressing any deficit is to analyse data and make recommendations to policy makers and private sector players. Reliable postharvest loss data was not found (US Department of State, 2013).
Beans, green (string) (Guyana) Courtbaoui and Ngadi (2016) used two different approaches to characterise the postharvest practices and losses of tomato, string beans, eggplant, okra and cucumber for Guyana and St. Kitts-Nevis: (1) producer household surveys and (2) modified count and weight. Farmers sell most of their harvested crops to local markets, keeping the remaining crops for household consumption. In Guyana, the majority of farmers (97%) reported selling their crops at harvest, while in St. Kitts-Nevis, 61% of farmers stored their produces before selling. Farmers in St. Kitts-Nevis reported 30% postharvest losses of crops due to spoilage, while those in Guyana reported considerably less. Results from modified count and weight method revealed that small producers experienced greater postharvest loss compared to large ones due to spoilage and lack of market access. A reasonable explanation to this is the degree of knowledge in high-value crop production between the two types of farmers. As the produce travelled throughout the supply chain, it started to lose significantly (P < 0.05) its freshness and its marketable value as well. At the marketing level, small and large retailers in both countries experienced substantial postharvest quantitative and qualitative losses. These losses were due to inappropriate handling and exposure to undesirable environmental conditions. Full text not available.
Cucumbers and gherkins (Oman) Research has been undertaken (Al-Sadi et al., 2011) to characterise and manage pathogens associated with fruit rot of immature cucumber fruits in greenhouses. Fruit rot of cucumber was found to be prevalent in 92% of greenhouses, resulting in losses of 10 to 60% (average loss of 33%) of immature fruits per plant
Onions, dry (Niger, Senegal, Sudan) The onion sector is one of Niger’s most profitable agricultural activities and considered a lucrative income-generating activity for rural and urban women (Yachaou and Zhihong, undated). However, lack of access to suitable storage facilities means that producers have to sell their produce straight after harvest and this can contribute to crop and income losses from dramatic price falls. The harvesting and packaging techniques are highlighted as being unsuitable with 100 to 120 kilogrammes packed in one jute bag that results in produce damage and loss. The poor status of the roads make market access more difficult and raises the transport element of the selling cost.
Plantains (Cameroon, Côte d'Ivoire, Gabon, Guinea, Guinea-Bissau, Uganda) Plantains are popular and versatile staple, providing a significant portion of the calories and nutrition in West Africa. Cauthen et al. (2013) identified rough handling, unprotected storage conditions, and poor transportation as leading to postproduction losses of 30-40% in West Africa plantain trading. The use of plastic containers and cooler storage conditions can increase the shelf life of crops to 14-27 days.

Reducing Postharvest Losses In the OIC Member Countries
41
In Côte d'Ivoire research is reported on the use different thicknesses of polyethylene bags to prolong postharvest shelf-life of plantain (Yao et al., 2014).
In Uganda, postharvest losses are higher in the high production season than in the low production season. The major causes of physical losses at farm level are theft and ripening, while causes of economic losses are mainly selling of immature bananas, followed by poor harvesting methods and ripening. Selling immature bananas is attributed to the high demand in the market that cannot be met by the available farm production during scarcity. The postharvest losses across the value chain are high and thus require various interventions to considerably reduce them. At times of scarcity, physical losses affect about 3.3% and economic losses 5.4% of bananas. The average residual value is estimated at about UGSh 7,500 - a bunch that would have been sold at UGX 10,000 is sold at UG shillings 7,500 due to quality deterioration. During the surplus season, physical losses were estimated at 9.6%, while economic losses affect approximately 8.1% of banana with a residual value of about UGSh 2,300 per bunch (Nalunga et al., 2015).
Tomatoes (Azerbaijan, Bangladesh, Brunei Darussalam, Burkina Faso, Chad, Djibouti, Egypt, Gambia, Iran (Islamic Rep. of), Iraq, Jordan, Kuwait, Kyrgyzstan, Lebanon, Malaysia, Morocco, Nigeria, Syrian Arab Republic, Togo, Tunisia, Turkey, Turkmenistan, Uzbekistan)
Tomatoes (along with fresh beans) are a significant vegetables for the Turkish domestic market because of their use in traditional Turkish dishes, and for export. Poor harvest and postharvest practices result in losses due to spoiling of the product before reaching the market, as well as quality losses such as deterioration in appearance, taste and nutritional value. A survey of 92 tomato farmers in Tokat province, Turkey (Buyukbay et al., 2011) indicated that advanced techniques in tomato harvesting and marketing were not known by the farmers nor were they aware of to what degree a difference could be made using the currently used and alternative techniques. They were found to be uninformed and equipped about how they could do it. Development of special projects including training for especially harvest and postharvest operations were recommended.
A survey conducted in Malaysia to identify postharvest handling activities that were practised, the potential postharvest activities that can be carried out, and the factors contributing to postharvest losses found that packaging (24%) had the highest potential of reducing postharvest losses. A majority of farmers did not perform potential postharvest handling activities mainly due to insufficient knowledge.
In Azerbaijan, the fruit and vegetable sector is considered to lack fundamental expertise in regards to postharvest handling of their crops though growing affluence of the domestic population is considered likely to increase demand for safe and quality products (Bledsoe and Dan Cruz-DePaula, 2009).
In Brunei Darussalam, tomatoes are largely imported. In Burkina Faso there is a huge trade in tomatoes with Ghana. Improvements in packaging and transport systems are needed to reduce losses (van Wesenbeeck et al., 2014).
In Uzbekistan, people impacted by postharvest loss are producers and processors. Governments generally do not collect this sort of data. Private enterprises involved in the cold chain for perishable commodities collect data but only on their own operations. Minimal sharing is practiced unless a dispute arises on the origin of damage. Time series and cross-section data (i.e. panel data) on temperatures and relative humidity for produce and products by control point could be collected, trends analysed, weak links identified and corrected, and results shared to reduce spoilage and loss all along the cold chain.

Reducing Postharvest Losses In the OIC Member Countries
42
Tomatoes are one of the most important and popular vegetables in Bangladesh, ranking fourth in respect of production and third in respect of area (Hossain and Abdulla, 2015). Tomato postharvest losses are considered the highest of any fruit or vegetable by the Hortex Foundation (government organisation responsible for promotion and development of high value fresh and processed agricultural products). The impact of this loss is summarised by USAID (2014:123) as “reducing returns to actors at all levels of the value chain as well as detracting from overall value and pushing all actors in the value chain to adjust prices downward in anticipation of losses”. It also means that consumer prices are higher than they could be. Research studies do not consider what happens to the ‘lost’ produce and that some of the wastage may actually have an economic use. Farmers are often unaware of their costs of production and may refuse to sell their produce if the price falls below a certain level rather than maximise their profits by selling as much as they can, even at a lower price. A key challenge to overcome is the lack of concern about postharvest losses and awareness of improved postharvest technologies. Farmers and traders are either unaware of the causes of losses or have no economic incentive to upgrade their practices.
2.2.5. Meat and Meat Products
Introduction
World consumption of meat and livestock products is growing rapidly. This trend is sometimes called the ‘livestock revolution’ (Delgado, Rosegrant et al. 1999) and responds to the evidence that rapid economic growth is strongly correlated with higher demand for livestock and livestock products.
Postharvest losses in the livestock sector are not well understood and are the subject of scant research to date (Affogon et al, 2015, NRI, 2009). Most studies reviewed focus on the possible locations of potential losses, but fail to quantify them (UNECA 2009:159). Unlike some other commodity groups (for example grains) there has been very limited discussion on the definition of postharvest losses in livestock. Much global livestock does not enter trade. Livestock, particularly large animals and smallstock, play important part in the social capital stock of many households (Riethmuller, 2003), so sale at sub-optimal conditions (and value) is normative. Livestock value chains are numerous and often fractured with many sub-value chains. Livestock and its products are, after mortality, highly perishable and decline in value sharply post-mortem unless preserved.
Broadly speaking, meat sector losses are either physical (reduced value through spoilage), economic (loss of value forgone) or external (loss of environmental benefits) (NRI, 2009). A debate rages on the environmental externalities associated with livestock production (Keirs et al, 2008 and Steinfeld et al, 2006). A further, and largely unmeasured loss is associated with food safety and nutrition, though these losses may be incurred by consumers rather than producers or other value chain agents.
The total value of livestock is a composite of its many saleable parts. For some animals, the skin is worth more than the meat (e.g. ostrich). The value of different animal parts varies substantially globally. In informal markets meat products have very limited differentiation and are often sold at a single uniform price. In other markets, a great deal of additional value is developed in-chain by differentiating meat cuts and trading different animal parts to their optimal buyers.
Reducing Postharvest Losses In the OIC Member Countries
43
There are important differences between the degree and impact of postharvest losses between the formal and informal livestock sectors. In general, formal livestock production losses are far lower than those in the informal sector.
Postharvest losses in OIC Member Countries
A literature review found no specific published information concerning postharvest losses for meat and meat products that was specific to any of the OIC Member Countries included in Annex 2.
Since there is no specific literature available for each country, this report therefore gives a more general review taking literature from elsewhere on for related commodities.
General review
Gustavsson et al (2011), suggest an overall ‘production or waste’ loss for meat products as varying between 20% and 28%. They suggest that, where livestock systems are small scale and extensive (e.g. sub-Saharan Africa), losses due to mortality (mainly disease) on farm are a much more substantial element of the total accumulated loss than in systems that are intensive. Were a high proportion of the available harvested product reaches the consumer in an edible condition (e.g., in developed economies), waste tends to be maximised at the consumer level. These figures only speak of physical losses and not of the true economic cost. Where high losses occur at the level of the consumer, the accumulated economic cost along the chain is magnified (Hodges, et al, 2011). Actual physical quantification or valuation of postharvest losses in livestock and meat value chain are very scarce. Some examples include:
In Turkey a study of live weight shrinkage and mortality of broilers during transport found 5.9% average losses, of which 0.4% was mortality and the rest live weight loss (Aral et al, 2014). Similar studies in China (Liu, 2014) and Jordan (Al-Sharafat et al, 2013) support similar levels of loss for chicken.
A pilot study in Ghana estimated postharvest losses for poultry as 1.8% by volume and 28% for cattle (Egyir, 2011). The research returned a zero loss for goats postharvest from a sample of 10 farms.
A review of the goat value chain in Kenya (Roba, 2013) identified key causes of postharvest losses as: lack of market information, poor market coordination and insufficient infrastructure (e.g. roads, cold chain, butchery equipment). A quantitative study using willing-to-pay methods suggested a loss level for small ruminants at 3% (Juma, 2007).
A discussion paper on postharvest losses for the US State Department (US Dept of State, 2013) found the potential for high losses in the small scale poultry sectors of the Philippines and Ghana, but no supporting data whatsoever.
No data was found on meat and meat products in FAOSTATstat 2012. In the absence of and significant body of research on postharvest losses in the livestock and meat field, NRI (2009) suggest a possible framework for analysis. This points towards a detailed deconstruction of each individual livestock value chain, formal, informal, live, pre-slaughter, post-slaughter, processing and value addition stages. The potential for quality, quantity losses at each stage can then be assessed. Issues highlighted are: the availability of scale-economies and their impact on reducing postharvest losses, the importance of social and environmental

Reducing Postharvest Losses In the OIC Member Countries
44
externalities, especially for pastoralists; market access issues for meat and meat products reducing opportunities (e.g. absence of a disease free status in a particular geography); and, the potential, but unmeasured role of food safety as a cause of down-stream costs as yet unmeasured. This is summarised in Table. The information is scant but suggests a wide variation in losses from 0 to 28%. A variety of methods to estimate the losses were reported from interviews, willingness to pay and general estimates. The causes of the losses was generally not reported apart for Kenya where losses were not specifically attributed to any part of the value chain.
Table 11: Summary of postharvest losses in livestock and meat Country Cattle Poultry Smallstock Notes
(quality of data)
Causes of loss
China 8-9.9%(1) Estimate by interview
Suggests highest losses in storage, but does not specify causes
Jordan - 5%(2) - Mortality only - Guess
Dis-economies of scale
Turkey - 5.9%(3) 1.5%(4) (3) Economic loss (4) Guess – no evidence provided
High live-weight and mortality losses during transport (4)
Ghana 28% 1.8% 0% (5) Estimate by interview
Transport inefficiency and underdeveloped cold chain
Philippines - - No data (5) Estimate by interview
Not reported
Kenya - 3%(6) - Willingness to pay method
Lack of market information, poor market coordination and insufficient infrastructure (e.g. roads, cold chain, butchery equipment).
Range 28% 1.8 – 9.9%
0 – 1.5% - -
Sources: (1) Liu (2014), (2) Al-Sharafat et al (2013), (3) Aral et al (2014), (4) Tathdil et al (2013), (5) USSD (2013), (6) Juma (2007).
2.2.6. Milk and Dairy Products
Introduction
There is a range of surveys and literature reviews which have covered postharvest losses in the milk and dairy value chains in different countries. Whilst the main causes and consequences of the losses appear to be well understood, the figures relating to the extent of the losses seem to be relatively fragmented. The latter is likely to be due to several reasons, including difficulties to measure postharvest losses (in particular if resources are limited), and the fact that in a few countries in-depth postharvest loss surveys have been undertaken, whilst in others there have been only limited or no such surveys. As a consequence, postharvest loss figures in the milk and dairy value chain are only available for some countries.
The following section provides: some key facts of the milk and dairy value chain in OIC countries; an overview of postharvest loss figures found in the literature for the milk and dairy
value chain in selected countries; the causes and consequences of postharvest losses in the milk and dairy value chain; suggestions and recommendations on how to improve the situation.

Reducing Postharvest Losses In the OIC Member Countries
45
The milk and dairy value chains in OIC countries
Milk and dairy products are a vital source of nutrition for billions of people worldwide, and also provide livelihoods opportunities for farmers, processors, traders, and other stakeholders in the value chain (FAO, 2013).
According to FAO Statistics, whole fresh cow milk is the principal product produced by the dairy industries in OIC countries. Only in a few exceptions are buffalo milk (Pakistan, Brunei Darussalam), camel milk (Somalia), or goats milk (Bangladesh, Oman, UAE) the principal products. In the case of Malaysia, whole condensed milk is the principal product. As for the second and third most important dairy products, fresh goat and sheep milk are the main products, followed by dairy products such as butter from cow’s milk.
According to FAOSTAT (quoted in COMCEC, 2015, Page 41), fresh cow milk is the second most important agricultural and livestock product produced in OIC Member Countries (after paddy rice, and before yams, wheat, chicken meat, and palm oil). Its total production value for the 2004 – 2006 period is indicated as roughly USD 22 billion per annum.
The bulk of the milk produced in the majority of OIC countries is produced by smallholder farmers owning less than 10 cows. For example, in Egypt family farms with 1 - 8 cattle constitute the majority of dairy farmers and are estimated to be responsible for about 80% of the milk produced (Al-Amaiem, 2014, in COMCEC 2015). Most of the milk produced (about 85%) is marketed as raw milk (e.g. sold loosely on the street or through vendors that go from door to door), or processed into home-made butter and cheese and sold in small shops (Oxford Business Group, 2012b, in COMCEC 2015). Figures in other countries are similar. For example, in Uganda 75% of all milk sold originates from the smallholder sector with women playing an important role in household milk production, processing and marketing.
Only about 10% to 25% of the milk produced is processed by the modern sector. For example, in Egypt only about 10% to 15%t of the milk produced is processed by the modern commercial sector due to the dominance of the informal milk sector, the lack of contract farming and weak relationships between producers and processors (El Lateif Aita et al., 2012, in COMCEC 2015). Although most of the modern factories use fresh milk as main input for processing, companies often also import milk powder to increase processing activities and make use of their capacities.
Particularly smallholder farmers in rural areas rely on middlemen to collect and market their milk through informal channels, as they do not have access to formal marketing channels. The involvement of middlemen is considered to reduce prices for farmers, as gains are not passed onto farmers. At the same time, in many cases middlemen provide access to support services, such as credit and health care, in order to strengthen their position within the value chain (El-Amaiem, 2014; in COMCEC 2015).
Overview of postharvest loss figures found in the literature for the milk and dairy value chains in selected countries;
According to Lipinski et al (2013), 18% of milk was lost or wasted (in 2009, percent of kcal). In terms of loss and waste by weight, milk constitutes 8% of total food lost and wasted, whilst it is 4% of loss and waste in Kcal. An overview and tally of key informants is given in Table 12.

Reducing Postharvest Losses In the OIC Member Countries
46
Table 12: Overview of loss assessments in the milk and dairy value chains in selected countries.
Country Extent of losses Sources
Global 18%; Share of milk lost or wasted, 2009 (percent of kcal)
Lipinski et al, 2013; World Resources Institute
Africa 16%; Indicative minimum quantitative postharvest losses
FAO and AfDB, 2009
Egypt Description of qualitative losses in dairy value chain; e.g. “Lacking cold chains and refrigerated transport systems, combined with poor knowledge on hygienic handling of raw milk from farm to factory, lead to high milk spoilage rates.”
Egypt case study; COMCEC Coordination Office, 2015
Ethiopia Losses of up to 20 – 35% have been reported in Ethiopia for milk and dairy products between milking and consumption.
FAO (2003a)
1.5% of total value of milk produced ILRI, 2005
Kenya 7%; percentage of marketed milk http://www.fao.org/ag/ags/postharvest-management/milk-dairy/
3% of total value of milk produced ILRI, 2005
Pakistan
Milk worth Pakistani Rupees 169 billion lost per annum post-production, corresponding to 19.4% of value of first two dairy products quoted in FAOSTAT 2012.
Newspaper and online articles in August 2012:The Express Tribune 5/8/2012.www.pakistantoday.com.pk
Syria Postharvest milk losses in the small-scale dairy sector are in the range of 10% to 15% in summer, and 2% to 5% in other seasons; losses of the public sector do not exceed 1% in summer.
FAO (2003b)
Tanzania
21.9% of marketed milk http://www.fao.org/ag/ags/postharvest-management/milk-dairy/
5.6% of total value of milk produced ILRI, 2005
Turkey The bulk of the milk losses occur at the production level (10%), followed by postharvest handling and storage (1%), processing and packaging (1.5%), distribution (6%), and consumption at household level (1.5%). Total losses are 20%.
FAO (2013b)
Uganda 21% of marketed milk; or http://www.fao.org/ag/ags/postharvest-management/milk-dairy/
27% of all milk produced is lost, i.e. 6% is wasted at the farm level, whilst 11% and 10% of production is either lost due to spillage or spoilage during transport or marketing.
(FAO and AfDB, 2009)
A framework paper on postharvest loss reduction in Africa (FAO and AfDB, 2009) estimates that the minimum quantitative postharvest losses in the milk and dairy value chain are 16%, which, in turn, would mean 5.629 million tonnes of milk lost, representing annual losses of the order of US$ 2.54 billion.

Reducing Postharvest Losses In the OIC Member Countries
47
According to FAO estimates, global quantitative food losses and waste per year are roughly 20% for dairy (FAO, 2013b). In the case of Turkey, the bulk of the milk losses occur at the production level (10%), followed by postharvest handling and storage (1%), processing and packaging (1.5%), distribution (6%), and consumption at household level (1.5%) (FAO, ibid). Studies by FAO show that economic losses in the dairy sector in East Africa and the Near East due to spoilage and waste could average as much as US$90 million per annum.
As for individual countries, data collected during an FAO project reveal that annual losses of milk in Kenya, Uganda and Tanzania alone amount to about US$56 million. The data showed that in Uganda about 27% of all milk produced is lost, namely that 6% is wasted at the farm level, whilst 11% and 10% of production is either lost due to spillage or spoilage during transport or marketing, respectively (FAO and AfDB, 2009). FAO calculated the value of these losses in the Ugandan dairy sector at US$ 23 million per annum. It is also indicated that Ugandan milk production is 900 million litres per annum, of which 585 million litres are marketed and 123 million litres are lost (21% of marketed milk).
As for Kenya, the same FAO source indicates that 2,550 million litres of milk are produced per annum, of which 1,350 million litres are marketed, and about 95 million litres are lost, representing 7% of the marketed milk or US$ 22.4 million. In an earlier study, it was estimated that losses amounted to about 67 million litres of milk annually due to waste and spoilage, which was equivalent to about US$ 18 million (Smallholder Dairy Project Policy Brief 8, 2005; www.smallholderdairy.org). For example, according to a study by this project milk losses due to spoilage accounted for 26% of the variable cost of cooling in the small-scale centre compared to zero in the larger centres.
Regarding Tanzania, FAO studies show that cumulative losses in the dairy sector amount to approximately 59.5 million litres of milk each year, for annual losses of around US$ 14.3 million. The aforementioned website indicates that milk production in Tanzania is 1000 million litres, of which 271 million litres are marketed and 59.5 million litres of the marketed quantity are lost (worth US$11 million) (Table 13)
Table 13: Milk produced, marketed and lost in East Africa Country Production
(million litres)
Marketed (million litres)
Loss (million litres)
Milk marketed
(%)
Value of loss (USD million)
Kenya 2,550 1,350 95 7 22.4 Tanzania 1,000 271 59.5 21.9 11 Uganda 900 585 123 21 23
Source: http://www.fao.org/ag/ags/postharvest-management/milk-dairy/milk-and-dairy-products-postharvest-losses-and-food-safety-in-sub-saharan-africa-and-the-near-east-pfl/en/ (accessed, 21-04-2016).
ILRI (2005), indicate the following total percentage values of postharvest milk losses compared to the total milk produced in Ethiopia (1.5%), Kenya (3%), and Tanzania (5.6%), representing the quantified losses in value through spillage, spoilage and forced consumption of liquid milk. Results for Uganda were incomplete because information was lacking on the quantities of milk available at the major levels of the milk chain. Data from Syria was unavailable.
It is estimated (FAO, 2003b) that in Syria overall postharvest milk losses in the small-scale dairy sector lie in the range of 10% to 15% in summer, and 2% to 5% in other seasons, whereas the losses of the public sector do not exceed 1% in summer.

Reducing Postharvest Losses In the OIC Member Countries
48
According to UNDP/MOA (1993) quoted in an FAO report (2003a), losses of up to 20–35% have been reported in Ethiopia for milk and dairy products between milking and consumption. It is argued that due to the highly perishable nature of milk and mishandling practices the amount produced is subjected to high postharvest losses. Direct spoilage losses of 2% to 5% due to improper milking equipment have been reported in Ethiopia. Also, the amount of milk available for human consumption (by household or through marketing of products) is affected by the use of milk replacer as calf feed. The study estimates that about 17.5% to 30% of milk is left for the calf which otherwise could have been used for human consumption if complete milking was practiced.
Table provides an estimate of the value of milk and dairy products lost in the dairy value chains of OIC countries and the values of these losses. The data show that total production of the three main dairy products was 124 million tonnes in 2012 in the OIC Member Countries. Assuming 16% losses the quantitative losses amount to 19.8 million tonnes worth about US$ billion 8.9.
Table 14: Estimated monetary value of annual quantitative PHL in dairy value chains in OIC countries (in current US$) 1
Commodity Annual production
(tonnes)
PHL (%)
Quantitative PHL (tonnes)
Unit Value (US$/ tonne)
Value of Annual Losses (billion
US$)
Dairy OIC, 1st Product
95,098,932 16% 15,215,829 437 6.649
Dairy OIC 2nd Product
24,447,803 16% 3,911,648 411 1.608
Dairy OIC 3rd Product
4,471,017 16% 715,363 950 0.680
Total 124,017,752 19,842,840 8.937
Source: http://FAOSTAT.fao.org/site/569/default.aspx#ancor NB. The values have been calculated using information available for the countries and products available (FAOSTAT 2012). While gross value data was available for 30 countries in the case of the 1st dairy product produced in OIC countries (i.e. mainly fresh cow milk), only 13 and 10 countries had values indicated for 2nd and 3rd dairy products respectively (e.g. goat or sheep milk). Interestingly, the unit values indicated for the 3rd product were quite high although quantities and overall values were low. As for postharvest losses (i.e. 16%), the same value was taken as indicated in the aforementioned framework paper on Postharvest Loss Reduction in Africa, FAO and AfDB 2009.
Causes and consequences of the postharvest losses in the milk and dairy value chain
The causes and consequences of postharvest losses in the milk and dairy value chains of the countries studied appear well understood (e.g. results of survey in OIC countries presented in Annex 3). Losses in the dairy sector lead to reduced quantities of food available for human consumption. Products the quality of which has been affected between production and consumption may pose a health risk for consumers. Table 15 provides an overview of the causes of losses at different stages of the value chain, namely:
Pre-harvest (only covering the main elements) Milking Processing Marketing Consumption.

Reducing Postharvest Losses In the OIC Member Countries
49
Table 15: Stages in the milk and dairy value chain, and causes of losses Stage in the value chain
Causes of loss
Pre-harvest Breed of dairy herd Lack of feed Diseases Lack of water Lack of veterinary and other services
Milking Inappropriate equipment and milking methods (e.g. unhygienic practices) Animal diseases affecting milk yields (e.g. mastitis) Adulteration of milk Lack of storing and cooling facilities at farm level
Aggregation Operation of cooling centres fraught by challenges such as high cost of equipment or irregular power supply; Collection of chilled milk (e.g. during rainy season, or if distances are long) Lack of chilled milk price premium.
Processing Difficulties to collect milk from small-holder farmers Disruption of cold chain (e.g. due to power cuts) Some dairy processing factories (e.g. cheese factories) lack cooling facilities and do not apply pasteurisation SME processors face challenges such as capacity, infrastructure, etc.
Marketing Lack of means of preservation Lack of appropriate transport Large proportion of milk and dairy products is marketed through informal channels
Consumption Spoilage of milk due to lack of preservation methods Health risks due to unhygienic processing and storage of milk
Recommendations
The following provides an overview of the main measures required to improve the functioning of the dairy value chains, and reduce the losses that take place at various stages in the chain. The integration of smallholder dairy farmers into formal processing and marketing channels (e.g. through farmer organisations or collection centres) is important for the development of the dairy sector in OIC countries (COMCEC, 2015). This requires adequate support of smallholder farmers such as training, technical services, feedstock supply, in order to assist them raise both quantity and quality of milk. At the same time, considerable investments are required into upgrading and modernising the existing processing and product handling infrastructure. Further public support is needed in order to meet international quality standards if milk and dairy products are to be exported (COMCEC, 2015). Strategies to reduce postharvest losses (PHL) include investments in cold chain infrastructure, training of chain participants in hygienic methods of handling products, and processing into products with longer shelf life (FAO and AfDB, 2009, Page viii). At the same time, while cooling is the preferred method of bulk milk preservation, this is sometimes not feasible due to cost or irregular or absent power supply. In such areas an alternative method of preservation using the internationally approved lactoperoxidase system (LPS) is possible for groups of farmers linked to dairy processors (Smallholder Dairy Project Policy Brief 8). 2.2.7. Fish and Seafood Products Introduction
Global consumption of fish and other aquatic is increasing both in absolute terms and in terms of per capita consumption. This is shown in Table 16, below.

Reducing Postharvest Losses In the OIC Member Countries
50
Table 16: World Fisheries and Aquaculture Production and Utilization Production (Million tonnes) 2007 2008 2009 2010 2011 2012
Capture
Inland 10.1 10.3 10.5 11.3 11.1 11.6
Marine 80.7 79.9 79.6 77.8 8.26 79.7
Total capture 90.8 90.2 90.1 89.1 93.7 91.3
Aquaculture
Inland 29.9 32.4 34.3 36.8 38.7 41.9
Marine 20 20.5 21.4 22.3 23.3 24.7
Total Aquaculture 49.9 52.9 88.7 59.1 62 66.6
Total World Fisheries 140.7 143.1 145.8 148.2 155.7 157.9
Utilization
Human consumption 117.3 120.9 123.7 128.2 131.2 136.2
Non-food uses 23.4 22.2 22.1 20 24.5 21.7
Population (billions) 6.7 6.9 6.8 6.9 7 7.1
Per capital food fish supply (kg) 17.5 17.8 18.2 18.6 18.7 19.2
State of the World Fisheries, FAO, 2014 Fish and other aquatic products are produced, either through capture or through aquaculture. Food production through capture has remained stable and is not expected to grow. However, fish produced through aquaculture has grown rapidly over the last decades and will continue to do so. Postharvest Losses in Fish
Postharvest loss refers to the quantitative and qualitative reduction of produce occurring from the time the fish is caught, through all stages of the supply chain that precede consumption. The literature identifies four types of losses in the fish supply chain: physical, quality, market force and nutritional (Cheke and Ward, 1998; Ward and Jeffries, 2000; Kumolu-Johnson and Ndimele, 2011). These are generally defined as follows.
Physical losses refer to the loss of fish that occurs because the produce is thrown away, spoiled, or consumed by insects or animals during processing and storage. The loss can happen at different stages, for example at the fishing stage due to discarding of unwanted catch or bycatch (typically associated with shrimp trawling), or due to market mechanisms (such as oversupply or lack of market). Physical loss is expressed both in terms of decreases in weight and/or monetary value of the produce.
Quality losses are expressed mostly in monetary terms as this represents the difference between the potential values of fish at best quality and its current value after quality degradation. Quality-deteriorated fish can be sold at a lower price as a downgraded product in the same or in a different market for other purposes.
Market force losses refer to different types of losses attributable to market behaviour or management. These forces may lead to a decrease of the price below an optimum price or a monetary loss because of high marketing and production costs. These losses are considered pure market losses to distinguish them from the monetary losses due to

Reducing Postharvest Losses In the OIC Member Countries
51
physical or quality deterioration. Market losses happen when the fish supply is larger than demand or when the sale occurs at a local/rural market instead of a high value central/city market. Both quality and market force losses can sometimes be expressed as reduced price losses.
Nutritional losses refer to specific biochemical changes within fish flesh as a result of spoilage or processing. Some losses occur for example where losses of vitamin and/or proteins during heat processing. Also nutrients are also lost when the head, bones, and part of the viscera are removed during preparation.
The combined monetary values of physical, quality and market force losses are presented as the total financial losses, which are used to quantify and summarize the overall missing revenue from a value-chain or activity. However, the elimination of financial losses may have unexpected consequences for the overall socio-economic system. Poor quality fish sold for a reduced price often means financial losses to the seller while representing a source of cheap protein for poor people unable to afford the higher prices of better quality products. Therefore, removing financial losses would eliminate cheap protein for poorer people’s diet representing a threat to food security (Ward and Jeffries, 2000). An emerging issue is the as yet little understood or defined occurrence and implications of postharvest losses in aquaculture. For example pre-harvest losses due to mortality of fish could be classed as a physical loss. Due to the growth and future dependency on aquaculture, assessing losses in aquaculture value-chains should be a priority for future research and intervention. Expert consultations identify quality as the main postharvest loss (PHL) in small-scale African fishery supply chains. Fish degradation reduces its potential in terms of value addition and raises food safety concerns. It has been estimated that quality losses alone may sum up to more than 70% of total losses for small scale fisheries in lower income countries while physical losses are assessed around 5% (Akande and Diei-Ouadi, 2010). Physical losses, especially from capture fisheries, are becoming less important, especially for the future, as the quantity of fish caught is decreasing while at the same time demographic pressure remains high, leaving few reasons to eliminate edible but less marketable fish from the value chain. Whilst shrimp trawl bycatch and discards of fish (unwanted catch) was a major issue from the 1970s to mid-2000s, fisheries management measures, dwindling shrimp catches, a reduction in trawling, increasing demand for fishmeal has led to greater utilization and less bycatch and less wastage of fish that was once lost from the value-chain has greatly reduced the incidence of bycatch. Although data on the true extent of this decrease is lacking. In a major shift in policy, the EU is now phasing in legislation banning discards of fish so any fish caught must now be landed and used for direct human or non-direct human or non-human uses (EU undated). Nutritional losses are likely to occur during the processing of fish, such as drying, salting and smoking; they arise also when fish spoils that, however, becomes highly unattractive before reaching the stage of being seriously nutritionally damaged (Ames el al., 1991). Nutritional losses have been, however, only partially investigated and reported in literature. People working in the postharvest sector are usually aware of losses. Some take these as a normal part of business, uninformed of existing techniques to reduce them or too poor to invest in such measures, while others try to cope with losses using financial and technical resources (Akande and Diei-Ouadi, 2010).

Reducing Postharvest Losses In the OIC Member Countries
52
A number of general factors increase the likelihood of occurrence of the all types of postharvest losses in small-scale fisheries. Sources of concern are times of fish supply excess/glut, inadequate preservation techniques and processing and storage methods, adverse weather conditions, unskilled labour, and general market conditions not strictly related to the fish sector. Others include poor transportation due to inadequate infrastructure, non-refrigerated trucks, and long distances between land sites and markets. Table 17 presents a summary describing the main losses in the fisheries and aquaculture value chains. Table 17: Main causes of postharvest losses in the fisheries and aquaculture value chains Fish chain
stage Cause of Losses
Main type of losses
Geographical areas
Losses reduction strategy
Fishing Discards of fish; Fish falling from net during hauling; Improper handling causing bruising; Fish spending too much time in nets and spoiling; Absence of chilling on board; Glut catches; Scarce law enforcement and governance; Harmful fishing techniques (dynamite, chemicals, etc.) Damage to fish in nets by predators (otters, sharks, seals, crabs, crayfish etc.)
Physical, Quality
Worldwide (discards); Developing countries, especially in Sub-Saharan Africa (spoilage due to scarce in board facilities).
Trawl gear modifications such as discard exclusion devices Use of ice /chilled or refrigerated sea water/brine; Freezing at sea; Use of fish boxes on-board Landing fish as fast as possible; Covering fish with sacking or clothes to avoid direct sun heating/pouring water on it (evaporative cooling); Law enforcement; Promotion of consumption towards less valued fish species (utilization of discards/bycatch).
Landing Lack of infrastructure and services conducive to good handling and storage; Lack of ice/chilling Delays in selling/price negotiation Fish thrown or drops from containers during unloading and transport; Bird depredation; Fish on ground exposed to dirt and high ambient temperatures
Physical, Quality
Developing countries, especially in Sub-Saharan Africa.
Proper landing site facilities and management of the same Use of ice on shore; Insulated boxes/cold room Implementation of food safety legislation
Processing Low processing capacity to absorb fish landed; Traditional processing techniques (i.e. open air and sun-drying); Adverse weather conditions (rainy/cloudy season, as well as climate variations) making drying difficult; Poor water quality for washing fish; Bird depredation/insect infestation; Unskilled workforce; Scarce or absent packing system Poor quality raw material for processing
Physical, Quality, Nutritional
Developing countries, especially in Sub-Saharan Africa.
Drying on raised racks, mats or concrete surface; Using more modern drying techniques (i.e. Chorkor oven, FAO-Thiaroye improved smoking and mechanical drying); Salting before drying; Screens to prevent insect infestation (especially blowflies); Controlled use of insecticides and fumigants; Good hygienic conditions; Use of clean water Use of good quality raw material (fresh fish)

Reducing Postharvest Losses In the OIC Member Countries
53
Fish chain stage
Cause of Losses
Main type of losses
Geographical areas
Losses reduction strategy
Transport and distribution
Delays in packing, loading, transport causing spoilage; Careless handling resulting in physical damage and fragmentation of smoked fish; Poor road and transport logistics; Inappropriate vehicles Remoteness of fishing villages
Physical, Quality
Developing countries, especially in Sub-Saharan Africa
Use of ice/insulated boxed for fresh fish; Appropriate packaging such as rigid containers; Proper packing before transport
Storage Absence of or poor storage facilities/cold rooms leading to spoilage; Insect infestation; Mould growth
Physical, Quality, Nutritional
Developing countries, especially in Sub-Saharan Africa.
Properly designed stores Good hygienic practice Pest prevention Store management and product rotation (first in first out)
Marketing Oversupply of fish Lack of buyers Insect infestation Under-utilization of some species for fish meal; Mismanagement of fish products imports.
Quality, Economic
Worldwide Developing countries, especially in Sub-Saharan Africa (insect infestation).
Proper market infrastructure and management Implementation of food safety legislation Use of ice/insulated boxes or other preservation techniques; Exploiting the economic potential of sustainable by-catch; Promotion of value added products from low value fish species; Raising public awareness on fish quality and food waste; Access to market information; Access to more rewarding markets; Local and better data collection for just-in-time production and marketing.
Fisheries in the OIC Countries
The study covers 57 countries ranging from Guyana in the west to Indonesia in the east. As a first step, the relative importance of the fisheries sector in each country was assessed. This was based on the following:
a) Gross volume of fish landed b) Economic importance: This was assessed on the fish produced per head of population. c) Importance to food security: This was assessed on the basis of fish consumption per head
of population per year. Using the above, the importance of fisheries was ranked as follows: a) Very important: The country is a leading producer or the sector is a major contributor to
livelihoods b) Important: The sector plays a significant role in the country’s economy or livelihoods. c) Neither important nor unimportant: the sector exists but is not leading economic or social
driver. d) Fairly unimportant: Fisheries and aquaculture is comparatively marginal in the national
economy e) Completely unimportant: The fisheries sector is virtually non-existent.
The purpose is to undertake a rapid segmentation to focus further study. This is shown graphically in Figure, below.

Reducing Postharvest Losses In the OIC Member Countries
54
Figure 7: Relative importance of fisheries and aquaculture in study countries
The Study Countries – Relative Importance of Fisheries and Aquaculture
Very important
Important
Neither important nor unimportant
Fairly unimportant
Unimportant
Key
Source: Prepared from FAO data. Details are presented in Table.

Reducing Postharvest Losses In the OIC Member Countries
55
Table 18: Key fisheries statistics for study countries (FAO Statistics 2013) Country Fish consumption (kg
/person) Classification
Bangladesh, Egypt, Indonesia, Malaysia, Maldives, Morocco, Nigeria
12.5 – 164.0 Very important
Brunei Darussalam, Comoros Côte d'Ivoire Gabon Gambia Guyana Mauritania Mozambique Oman Senegal Sierra Leone Suriname Tunisia Uganda United Arab Emirates Yemen
2.6 - 34.2
Important
Somalia 3.1 Important (but faces challenges) Bahrain Benin Cameroon Chad Guinea Iran (Islamic Rep. of) Libya Mali Pakistan Qatar Saudi Arabia Turkey
2.0 – 22.5
Neither important nor unimportant
Albania Algeria Burkina Faso Guinea-Bissau Iraq Jordan Kazakhstan Kuwait Lebanon Niger Sudan Togo Turkmenistan
1.2 – 15.1
Fairly unimportant
Syrian Arab Republic 0.5 -3.1 Fairly unimportant (but faces challenges)
Afghanistan Azerbaijan Djibouti Kyrgyzstan Tajikistan Uzbekistan
0.1 2.2 1.9 2.4 0.5 0.7
Unimportant Unimportant Unimportant Unimportant Unimportant Unimportant
Palestine, Occupied Tr. 1.8 Unimportant (but faces challenges)
TOTAL 18.9 -

Reducing Postharvest Losses In the OIC Member Countries
56
Table 19 presents further details of the fisheries in countries where fisheries and aquaculture is of some importance is and is useful for giving a wider overview of the sector. Table 19: Details of the fisheries in countries where fisheries and aquaculture is of some importance or more
Country Total production
(tonnes)
Main fishery PHL publications
Bangladesh 2,475,699 Important inland fishing nation; Main species caught is carp. Aquaculture is rapidly expanding. Shrimps and prawns are main exports.
Key reference: Alam (2010). Postharvest Loss reduction in Fisheries in Bangladesh: A Way Forward to Food Security, USAID (http://www.nfpcsp.org/agridrupal/sites/default/files/Nowsad_Alam-PR5-08.pdf)
Egypt 1,440,443 Vibrant inland and marine capture sector. Africa’s largest aquaculture producer and globally second largest tilapia farmer.
Key reference: Mcfadyen, Nasr-Allah and Dickson (2012), WorldFish, (http://pubs.iclarm.net/resource_centre/WF_3559.pdf)
Indonesia 9,952,509 95% of capture fisheries from artisanal fishers, with associated PH challenge. Largest producer by far in study area. Recent studies indicate improving situation with PHL.
Key reference: Wibowo, Utomo, Syamdidi & Kusumawati (2014), Proceeding of The 3rd International Seminar of Fisheries and Marine Science, (http://repository.unri.ac.id/xmlui/bitstream/handle/123456789/8120/8.%20SINGGIH%20W%2c%20BAGUS%20S%2c%20SYAMDIDI%2c%20RINTA%20K.pdf?sequence=1)
Maldives 129,842 Fish and tourism are the mainstays of Maldives economy. Capture fishery revolves around tuna species for canning and fresh consumption.
Key reference: Subasinghe (2005), Assessment of rehabilitation and reconstruction needs in the Tsunami affected postharvest fisheries sector- Maldives, FAO. (ftp://ftp.fao.org/fi/document/tsunamis_05/maldives/cons_miss_rep/Subasinghe_Apr_05.pdf)
Nigeria 1,000,061 Traditional fish processing technologies vary widely in terms of equipment type, size and processing efficiency in Nigeria’s coastal states.
Key Reference: George, Ogbolu, Olaoya, Idowu & Odulate (2016); Fish Processing Technologies in Nigeria: A Case Study of Ibeju-Lekki Local Government Area, Lagos State; Science Alert (http://scialert.net/fulltext/?doi=ajft.2014.302.310&org=10)

Reducing Postharvest Losses In the OIC Member Countries
57
ONLINE SURVEY OF POSTHARVEST LOSSES IN THE OIC 3.
A questionnaire (survey monkey) was developed with spans questions relating to OIC Member Country and commodity experience (7 food commodities including cereals, fish and seafood products, fruits and vegetables, meat and meat products, milk and dairy products, and roots and tubers), to questions about physical and economic losses in the value chains to how to mitigate them. The questionnaire was sent to 400 experts globally who were selected from contact lists and google searches. A total of 68 responded which was a good response for a survey monkey questionnaire but not all completed the questionnaire in full. Data analysis was conducted on the limited data collected. While the number of responses (59) is not statistically valid for the crops and countries and there is no means to validating or verifying the figures we have received, we identified the following: firstly new information about physical and economic losses in the value chains has been gained. A qualitative understanding of the causes of losses, mitigation of these losses, and constraints has been developed for each of the groups of commodities. However, here are large gaps in knowledge for many countries and products where no responses have been received. We have excluded the reported economic losses which were requested as a percentage. The reason is that the majority of the respondents reported economic losses that mirrored the physical losses. However, we know from other work (Naziri et al., 2014) that economic losses are often different from physical losses; for example a 10% physical loss of a product at the consumer end of the value chain results in a much higher economic loss than an equivalent loss at the farm end of the value chain where the product has a much lower value.
3.1. Introduction
The survey was sent to nearly 400 experts who we perceived would have experience of postharvest issues in the OIC countries. The methodology is given in the introduction.
3.2. Results
The analysis is as follows and is by responses to asked in the questionnaire Countries respondents had experience with postharvest value chain activities
Figure indicates that the majority of respondents had experience of postharvest work in the following top ten countries being Uganda, Nigeria, Benin, Mozambique, Bangladesh, Indonesia, Senegal, Togo, Burkina Faso and Egypt. There were 22 countries where no experience was reported and this suggests a potential gap is general expertise.

Reducing Postharvest Losses In the OIC Member Countries
58
Figure 8: Countries respondents have experience with postharvest value chain activities (67 respondents)
Crop groups that the respondents have the most experience in
Of the commodity groups, most respondents had experience in cereals, roots and tubers, fruit and vegetables. The least experience was reports in fish and seafood products, meat and meat products, and milk and dairy products (Figure). Figure 9: Crop group respondents (68) that the respondent have experience
0%
5%
10%
15%
20%
25%
30%
35%
40%
Uga
nd
aN
iger
iaB
enin
Mo
zam
biq
ue
Ban
glad
esh
Ind
on
esia
Sen
egal
To
goB
urk
ina
Fas
oE
gyp
tP
akis
tan
No
ne
of
the
abo
ve
Afg
han
ista
nC
amer
oo
nM
ali
Taj
ikis
tan
Sier
ra L
eon
eA
zerb
aija
nC
had
Cô
te d
'Iv
oir
eG
amb
iaIr
aqL
eban
on
Nig
erSu
dan
Yem
enB
ahra
inG
abo
nK
azak
hst
anK
yrg
yzs
tan
Mal
aysi
aM
ald
ives
Mo
rocc
oO
man
Tu
rkey
Uzb
ekis
tan
Alb
ania
Alg
eria
Bru
nei
Dar
uss
alam
Co
mo
ros
Dji
bo
uti
Gu
inea
Gu
inea
-Bis
sau
Gu
yan
aIr
an (
Isla
mic
Rep
. of)
Jord
anK
uw
ait
Lib
yaM
auri
tan
iaP
ales
tin
e, O
ccu
pie
d T
r.Q
atar
Sau
di
Ara
bia
Som
alia
Suri
nam
eSy
rian
Ara
b R
epu
bli
cT
un
isia
Tu
rkm
enis
tan
Un
ited
Ara
b E
mir
ates
Cereals, 27%
Roots and Tubers, 21%
Oilseeds and Pulses, 10%
Fruit & Vegetables,
17%
Meat & Meat products, 8%
Milk & Diary products, 8%
Fish & Seafood
products, 8%

Reducing Postharvest Losses In the OIC Member Countries
59
Characteristics of the respondents
Not all the respondents gave information about their identity and projects. Out of 68 who responded, half of them (34) did not answer about their gender or organisation. Among the 34 who answered, there were 7 women and 27 men. Most had more than 10 years’ experience working in postharvest activities. Table describes the organisations respondents belonged to. Table 20: Type of organisation respondents are from
Organisation Count of responses
Farmers organisation (confederation) 1
International organisation 10
NGO 1
Private consultant 1
Private sector 2
Public body 4
University 13
PhD student in postharvest management and reduction 2
Grand Total 34
A majority were from universities followed by international organisations. Most described that they had been involved in postharvest research projects on several food commodities. Out of the 68 respondents, only 59 answered questions. The final number of respondents is 59 and was split as follows: Cereals (22); Fish and Seafood products (3); Fruits and Vegetables (19); Meat and Meat products (2); Milk and Dairy products (1); Oilseeds and Pulses (2); Roots and Tubers (10). PHL’s are considered important by international organisation and academics, but not by government, farmers and NGO’s. More awareness raising is needed to change this balance and drive demand for new knowledge and solutions. Expertise is strongly clustered around specific commodities: noticeably food grains, where long-term storage is a particular interest to donors providing food aid assistance, and cassava, where recent concerns about high losses and perishability has driven new research. Geographical concentration of interest in PHL’s may reflect the focus of specific aid donors (e.g. in Uganda) or particular commodities (e.g., cassava in Nigeria). The absence of returns from the Middle Eastern and Asian clusters of OIC Members shows somewhat limited interest within these countries in PHLs. This in turn suggests that much progress could be made in those countries/regions by raising awareness and promoting new research to reveal the country specific losses and engage the research and policy communities.
3.3. Cereals
Respondents (22) selected ‘cereals’ as a commodity they have experience in and answered questions. Flour was the main processed product from cereals (maize, rice, sorghum and wheat) although some of the products can also be sold as whole grain (i.e. rice). By-products

Reducing Postharvest Losses In the OIC Member Countries
60
such as stems and grains can be used for feed; stems, husks and cobs for fuel. The percentage of final product lost by weight in the postharvest value chain for Cereals is presented in Table.
Table 21: Weight of postharvest losses in cereals per country and step of postharvest value chain
Cereal/ Country
No. Postharvest losses (%) (min-max)
Har
ves
tin
g
Fie
ld d
ryin
g
Tra
nsp
ort
Fu
rth
er d
ryin
g
Th
resh
ing/
sh
elli
ng
Sort
ing/
gra
din
g
Sto
rage
Mar
ket
ing
Seco
nd
ary
pro
cess
ing
(e
.g. m
illi
ng,
oil
ext
ract
ion
)
Uti
lisa
tio
n/
con
sum
pti
on
MAIZE 14 21 (6-40) 7 11 2 3 5 3 11 3 3 9
Benin 1 15 2 1 5 5 2
Burkina Faso
3 11 4 0 1 1 1 6 0 4 0
Mozambique 2 30 9 9 3 6 9 4 20 3 2 1
Nigeria 3 35 12 18 4 8 10 14 5 7 29
Togo 1 10 10
Uganda 4 16.5 4 2 1 2 2 1 8 3 2 0
RICE 5 21 (12-35) 5 1 2 3 4 2 2 1 3 1
Bangladesh 2 12 1 1 1 1 2 1 3 1 3 1
Cameroon 1 -
Indonesia 1 15 3 2 3 3 1 1 2
Sierra Leone 1 35 10 5 4 7 3 2 4
SORGHUM 2 10 (no range) 4 0 1 1 1 3 1 0
Mali 1 10 4 0 1 1 1 3 1 0
Senegal 1 -
WHEAT 1 20 (no range) 7 1 2 2 1 1 1
Afghanistan 1 20 7 1 2 2 1 1 1
Grand Total 23 21 (6-40) 6 8 2 3 4 3 9 2 3 7
On average losses in cereals were 21% and ranged from 6 to 40%. Global losses reported on maize, wheat, and rice were of the same order but losses were lower with sorghum but there were only one respondent for sorghum and wheat and therefore interpretations of the results have to be made with caution. Field drying and storage were the stages where the most losses occur with maize. With rice harvesting and threshing/shelling were critical stages. Most respondents gave figures for maize (15) and the least for sorghum (1). A common trend was that losses were estimated to be highest during harvesting for all crops and for maize losses were also high during field drying and storage. Causes of PHLs were reported for cereals per step of the value chain (Table 22).

Reducing Postharvest Losses In the OIC Member Countries
61
Table 22: Causes of PHLs reported for cereals and per postharvest step of the value chain Postharvest
step Maize Rice Sorghum
Harvest Contamination through use of old sacks/containers: cobs are often left on the ground for picking later, which can cause contamination by fungus Harvesting method; some crop left in field Late harvesting; grain shattering, insect infestation in field: harvesting method to improve Rain during harvest; rotting or sprouting grains
Harvesting method; some crop left in field Late harvesting; grain shattering, insect infestation in field
Harvesting method; some crop left in field
Field drying Placement on ground; contamination by fungi or insect damage Rain during drying; rotting, sprouting or mycotoxin contamination Theft by humans, birds, livestock or wild animals
Placement on ground; contamination by fungi or insect damage, mice and other rodents Rain during drying; rotting, sprouting or mycotoxin contamination
Theft by birds, livestock or wild animals
Transport Delays due to poor infrastructure High number of bribe payments required Insect infestation due to use of contaminated container Spillage through use of unsuitable containers Theft by humans
Spillage through use of unsuitable containers
Spillage through use of unsuitable containers
Further drying
Contaminating grain by placing it directly on ground Inadequate drying practice Possible insect infestation Lack of wind and high humidity during drying Rain during drying
Contaminating grain by placing it directly on ground Feeding by livestock and pests Rain during drying
-
Threshing/ shelling
Contamination with foreign matter (e.g. small stones, dust) Rough shelling/threshing methods; broken, cracked grains Scattering of grains
Rough shelling/threshing methods; broken, cracked grains Scattering of grains
Scattering of grains
Sorting/ grading
Labour intensive manual sorting methods No price premium for high quality maize, so no incentive for sorting
Labour intensive manual sorting methods No price premium for high quality rice, so no incentive for sorting
No price premium for high quality sorghum, so no incentive for sorting
Storage Ineffective grain protection: Insect damage Rodents damage, ineffective grain protection methods used and storage hygiene Poor monitoring of stored products Too high moisture content; mould growth and increased risk of aflatoxin contamination All of the above apply, as a consequence of poor monitoring
Insect damage, Rodent damage, Weevil infestation too high moisture content Poor monitoring of stored products
Insect damage
Marketing Cartel behaviour among traders No financial incentive for farmers to produce and sell high quality maize Sales after harvest at low prices, due to urgent need for cash Weak marketing knowledge and limited collective selling arrangements of farmers
No financial incentive for farmers to produce and sell high quality grain Sales after harvest at low prices, due to urgent need for cash
Sales after harvest at low prices, due to urgent need for cash

Reducing Postharvest Losses In the OIC Member Countries
62
Postharvest step
Maize Rice Sorghum
Secondary processing (e.g. milling, oil extraction)
Poor hygiene at and maintenance of processing unit results in cross-infestation and contamination Poor maintenance of equipment resulting in low percentage out-turn and/or contamination Power outages can affect operations Removal of bran leads to reduced nutritional value of grain
Poor maintenance of equipment resulting in low percentage out-turn and/or contamination
-
Utilisation/ consumption
Unauthorised sales or use by an individual in the household Weak food safety knowledge leading to consumption of contaminated food
Poor stacking and closing of containers leading to spillages, dampness, rancidity, infestation etc.
-
Other causes Weak food safety knowledge Weak food safety knowledge
Weak food safety knowledge
Postharvest losses in cereals were reported to be caused by a variety of factors. At different steps of the value chains there are different causes but the general causes of loss are similar for maize, rice, and sorghum. Some major factors of losses are cited consistently throughout the value chain: these are contamination of grains – either by insects, rodents, extraneous matter such as small stones, humidity too high in the grains (due to problems of drying and maintenance under dry conditions during transport and storage), and management issues. A lack of food safety knowledge is also reported and would be responsible for a lack of management of the commodity in the value chain and also quality problems (contamination, humidity) in the cereal products. Some ways suggested to mitigate PHLs were reported in Table 23. Table 23: Mitigation of PHLs reported for cereals and per step of postharvest
Postharvest step
Maize Rice Sorghum
Harvest
Training on technical harvesting; i.e. the products should not put directly on the ground while harvesting (use appropriate cover foil) Use of simple harvesting equipment as well as strict supervision to ensure that the quantity of crop lost in the field is reduced
Availability of non-shattering rice varieties; organization of workers for manual harvesting improved mechanisation
-
Drying
Biomass dryers, Solarisation, Drying on stabilised ground and tarpaulins Research usability of wind dryers from coastal regions, which could be used to prevent damage due to unseasonal rains in dry zones Use of plastic sheets so drying grains not in contact with soil, greater understanding of importance of dry grains for long term storage and food safety
improved mechanisation
-
Threshing/ shelling
Hand shelling tools Lack of investment in threshing equipment Mechanised threshers and shellers Promotion of simple manual techniques for shelling, and awareness raising about the risk of storing any damaged grains, so that farmers sort grain and remove damaged grains. Simple threshing apparatus (e.g. hand shellers, cheap motorised shellers for cooperatives) Use of shelling machine
Improved mechanisation Mechanization of harvesting and threshing operations
Adoption of improved threshers by small groups

Reducing Postharvest Losses In the OIC Member Countries
63
Postharvest step
Maize Rice Sorghum
Sorting/ grading
Donal-type sieves Training and implementation of differential prices Use of shelling machine that can blow grains for cleaning
-
Creation of incentives to produce a better product
Storage
Hermetic storage bags, application of pesticide (Sofagrain and Actellic super) High quality warehouse or storage silo; trainings on technical drying and technical storage Improved clay granary, triple PICS bag, ZeroFly Bag, metal silo, collective storage in village store houses Improved granaries, silos and metal silos Metal silos, hermetic bags. traditional storage Thorough cleaning of store rooms and sacks prior to grain loading, better extn and farmer understanding of effective grain protection methods Training: for appropriate storage structures and solutions, effective and regular monitoring, safe and effective pest control. Use of PICS bags, metal silos, pesticides to control insects and rodents
Use of plant based insect repellents like pepper, and cats for rodent (mice and rats) Use scientifically designed storage facilities and adopt systematic storage practices (good practices)
-
Marketing
Farmers group marketing Farmers should market their maize in groups and pack maize in clean and strong bags Less informal sales to traders
-
Creation of more demand at specified quality standards
Secondary processing (e.g. milling, oil extraction)
Remove not all the coats since this decreases nutrients during processing
Adopt multistage milling process
-
Other solutions
-
Use of improved low cost parboiler for cooking rice
-
In order to reduce postharvest losses, respondents suggested that better equipment (i.e. dryers), mechanisation, and storage facilities (including adapted bags, silos etc.) should be required. Training of the actors at the various steps of the value chain to better handle and market products was also mentioned and there should be incentives to produce a better product i.e. have specified quality standards. With rice, it was suggested that improved varieties (non-shattering rice) should be available to decrease losses in the value chain. A number of constraints to reducing postharvest losses (PHLs) were identified by the respondents (Table).

Reducing Postharvest Losses In the OIC Member Countries
64
Table 24: Constraints to reducing PHLs reported for cereals and per step of postharvest Postharvest step Maize Rice Sorghum
Harvest Inadequate knowledge about technology and of postharvest among farmers Difficulties in the extension system Inadequate knowledge on postharvest management and poor harvesting methods. Pressure for money makes farmers harvest the crop when it still has high moisture content Lack of training in postharvest for agricultural extension officers Poor training materials (trainers, equipment, etc.)
Insufficient co-operation between farmers Predominance of small scale upland mixed cropping makes it impossible to adopt even the simplest mechanical harvesting device.
-
Field drying Lack of training in postharvest for agricultural extension officers
- -
Further drying Climatic changes, lack of knowledge by farmers and extension Lack of local technical solutions for drying when rains are late Lack of training in postharvest for agricultural extension officers Reliance on mother nature (Sunshine)
- -
Threshing/ shelling
Cost is too high for farmers Cost of processing equipment Lack of availability of cheap, locally made, technologies Lack of training in postharvest for agricultural extension officers Lack of understanding of the danger of storing damaged grain by farmers and extensionists Low use of technology Poor practices, use of hired labour
Lack of capital Lack of awareness on good practices inadequate infrastructure facilities (energy)
Cost and organisation
Sorting/ grading Labour intensive Cost is too high for farmers Lack of price differential that does not give incentive Lack of training in postharvest for agricultural extension officers
- Training and improved marketing arrangements
Storage Availability and accessibility (up-front costs) of improved storage options and knowledge of how to properly store Cost is too high for farmers Lack of information and non-availability of hermetic storage bags, ineffective storage structures Low investment in storage and not being aware of storage structures which can reduce losses Low volumes More space needed Proper training is not widely available, proper structures are needed Weak understanding of insect life cycles and how insects can decimate a new crop Lack of knowledge by farmers and extension on effective grain storage methods
Lack of capital, lack of awareness on good practices, inadequate infrastructure facilities (roads) Most farmers store their rice grains in their homes among other household items.
-
Marketing At the start of the marketing season there is a glut on the market due to oversupply. This takes farmers a long time to dispose of their grain. Meanwhile grain losses are incurred Commodity staying long at the markets Lack of market information
- Need an industrial champion for commercial sorghum consumption
Secondary processing (e.g. milling, oil extraction)
Lack of education Lack of training or awareness of food safety issues such as mycotoxins
Lack of capital Lack of awareness on good practices Inadequate infrastructure facilities (energy)
-

Reducing Postharvest Losses In the OIC Member Countries
65
Postharvest step Maize Rice Sorghum
Other - Lack of resources to acquire improved parboiling equipment
-
In spite of the mitigation strategies, there are still a number of constraints that can explain the high postharvest losses encountered with cereals. High cost of processing equipment and technologies for stakeholders in the value chain of cereals that have a limited capital and limited understanding of the deterioration factors of the crops (e.g. insect shelf life) are major constraints to reducing postharvest losses in OIC countries.
3.4. Roots and Tubers
Respondents (9) selected ‘roots and tubers’ as a commodity they have experience in and answered questions. Cassava, potato, and sweet potato were the main roots and tubers reported. Cassava was processed into flour and gari, potato consumed as fresh, and sweet potato as fresh in Uganda and as sweet potato chips in Indonesia. By-products were animal feed and peels for cassava, biofuel for potato, and animal feed for sweet potato. The percentage of final product lost by weight in the postharvest value chain for Roots and tubers is presented in Table. Table 25: Weight of postharvest losses in roots and tubers per country and step of postharvest value chain
Country
N
We
igh
t lo
ss (
%)
(min
-m
ax
)
So
rtin
g
Tra
nsp
ort
ati
on
Wa
shin
g
Pe
eli
ng
Gra
tin
g/R
asp
ing
/C
hip
pin
g/C
rush
ing
So
ak
ing
& F
erm
en
tati
on
De
wa
teri
ng
/pre
ssin
g
Sie
vin
g
Po
un
din
g/P
ulv
eri
sin
g
Fry
ing
/ a
rifi
cati
on
Dry
ing
Mil
lin
g/G
rin
din
g
Pa
cka
gin
g
Sto
rag
e
Ma
rke
tin
g
Uti
lisa
tio
n/C
on
sum
pti
on
Cassava/ Nigeria 5 26 (12-40)
2 1 12 2 1 2 1 2 1 2 1 1 2 3 1
Sweetpotatos/ Uganda
1 20 (no
range)
5 2 1 4 4 4
Note: Number of respondents (N).
Out of 10 respondents, only 6 of them answered the questions on the estimate of PHLs (Table). Three respondents did not report figures for losses being Uganda/sweet potato, Indonesia/sweet potato and Azerbaijan/potatoes. On average losses in roots and tubers were 25% and ranged from 12 to 40%. Global losses reported on cassava and sweet potato were of slightly lower for sweet potato. Most losses occur during peeling for cassava and during sorting and consumption for sweet potato. Processing of cassava into flour and gari requires many steps and small losses that occur at the different steps of the value chain accumulated to increase the PHL figures. Fresh sweet potato on the other hand did not require extensive processing since it was sold without processing but losses were reported during storage, marketing and utilisation.

Reducing Postharvest Losses In the OIC Member Countries
66
Table 26: Causes of PHLs reported for roots and tubers and per step of postharvest. Postharvest step Cassava Sweet potato
Sorting Discount for Broken roots Rejection of Rotten roots Theft
Rejection of Rotten roots
Transportation Breakage Breakdown of vehicle; poor road infrastructure Broken roots Pilferage (theft) Weight/quality loss
Damage due to moving Moulding due to humidity
Washing Discarded pulp Discarded pulp
Peeling Discarded peels Over peeling
Inefficient hand peeling
Discarded peels
Grating/Rasping/Chipping/Crushing
Waste liquid from grating/rasping/crushing Inefficient rasping
Centrifuging Waste Liquid from centrifuging
Soaking & Fermentation Waste starch washed away or over-soaking Mouldy cassava from fermentation Over fermentation (too many days) reduces starch content
Dewatering/pressing Waste liquid from pressing containing Starch residue
Sieving Waste of fibre
Blanching/Steaming/Boiling Loss in nutrients Loss in nutrients
Drying Loss as dust Inefficient drying (taking too long)
Loss as dust Loss in nutrients
Milling/Grinding Loss as dust
Packaging Poor packaging material Quality deterioration
Storage Loss due to moisture Loss in value from Insect infestation
Loss due to moisture
Note: No comments were reported for potato
Broken and rotten roots at sorting have to be discounted. During transportation, a number of uncertainties due to the poor road infrastructure may delay supply and cause physical damage. During processing, peeling are a main loss and over peeling can cause unnecessary losses. Inefficiency of processing operations (peeling, grating, dewatering, and drying) can cause additional losses in quantities but also in nutrients. Packaging and storage are also key operations where losses occur due to quality deterioration of the roots and tubers. In order to mitigate those losses, suggestions were made by the respondents (Table). Table 27: Mitigation of PHLs reported for roots and tubers and per step of postharvest
Postharvest step Cassava Sweet potato
Transportation Policies to support improvement in road infrastructures Reduce sack sizes, better roads
Better packaging. Proper cover to prevent roots from rain. Better roads.
Peeling Improved peeling technologies be promoted Peeling machine Select cassava with white thin skin
More efficient peeling practice. Awareness raising in the improved procedures.
Grating/Rasping/Chipping/Crushing
Mechanised systems
Dewatering/pressing Better and more even pressing Improved technologies for dewatering

Reducing Postharvest Losses In the OIC Member Countries
67
Frying/Garification Better temperature control
Drying Sun drying is very inefficient. More collective mechanical drying would be better
Packaging Improved package material and techniques be promoted
Storage Better storage facilities. Technologies such as ambient storage.
Marketing Improve packaging Linking processors to markets for cassava products
Note: No comments were reported for potato
Improved technologies for processing and packaging during transport and storage were suggested. These included mechanisation e.g. drying equipment. In addition a supportive policy environment to improve road structures (Nigeria) and better linkages between actors of the value chain (processors to markets) were proposed. Constraints to reducing PHLs are presented in Table. Table 28: Constraints to reducing PHLs reported for roots and tubers and per step of postharvest
Postharvest step Cassava Sweet potato
Transportation Distance and road conditions Poor road infrastructures from farm to processing centres
Lack of funding.
Washing - -
Peeling labour intensive manual peeling method lack of target final products for selection Unimproved manual peeling methods
Lack of capacities in developing and promoting the more efficient practices.
Grating/Rasping/Chipping/Crushing
Cost
Dewatering/pressing
Cost Poor dewatering process
Frying/Garification
Cost
Drying Collective processing is constrained by the challenges of organising a consistent cassava supply
Packaging Poor packaging materials and techniques
Storage Lack of funding
Marketing Cost Lack of access to markets
Note: No comments were reported for potato
These constraints relate to the current situation with the road infrastructure, the fact that cassava processing is very labour intensive and new equipment require investment and capitals.

Reducing Postharvest Losses In the OIC Member Countries
68
3.5. Oilseed and Pulses
Respondents (2) selected ‘oilseed and pulses’ as a commodity they have experience in and answered questions. Respondents selected cowpea grains in Burkina Faso and Sesame seed in Sudan. Processed products from Sesame seeds were oil. By-products from sesame were animal feed presented as cake or grains. The percentage of final product lost by weight in the postharvest value chain for Oilseed and pulses is presented in Table.
Table 29: Weight postharvest losses in oilseed and pulses per country and step of postharvest
Oilseed and Pulses
Weight loss (%)
Ha
rve
stin
g
Fie
ld d
ryin
g
Tra
nsp
ort
Fu
rth
er
dry
ing
Th
resh
ing
/
she
llin
g
So
rtin
g/
gra
din
g
Sto
rag
e
Ma
rke
tin
g
Se
con
da
ry
pro
cess
ing
(e
.g.
mil
lin
g, o
il
ex
tra
ctio
n)
Uti
lisa
tio
n/
co
nsu
mp
tio
n
Cowpeas 50 10 - 2 1 5 30 2 - -
Sesame seed 25 15 - - - - 10 - - - -
On average losses reported in cowpea and sesame seed were 50% and 25% respectively. The small sample size makes analysis of trends subjective but this indicated that the for sesame seeds the main losses were during harvesting and sorting/grading whereas for cowpeas the losses were during harvesting and storage. The causes for these PHLs in the cowpea and sesame seed value chains were reported in Table.
Table 30: Causes of PHLs reported for oilseed and pulses and per step of processing Postharvest step Cowpeas Sesame seed
Harvesting Harvesting method; some crop left in field
Late harvesting; grain shattering, insect infestation in field
Field drying Placement on ground; contamination by fungi or insect damage
-
Transport unsuitable containers and handling
Over-filling sacks resulting in them splitting
Further drying Inadequate drying practices
Rain during drying
Threshing/ shelling Rough shelling/threshing methods; broken, cracked grains
Rough shelling/threshing methods; broken, cracked grains
Storage Insect damage, ineffective grain protection
Poor storage hygiene and cleaning of store and container
Marketing Weak marketing knowledge and limited collective selling arrangements of farmers, unsuitable handling by traders
Sales after harvest at low prices, due to urgent need for cash
Utilisation/ consumption - Poor stacking and closing of containers leading to spillages, dampness, rancidity, infestation etc.
Incomplete harvest of the crop was noted for cowpeas. Late harvesting, grain shattering and insect infestation were major causes of PHLs observed for both cowpeas and sesame seed. Inadequate transport and storage (i.e. hygiene, insect damage) as well as poor drying practices that would reduce the quality of the produce (humidity) were reported. Some of the causes were similar as those described with cereals that are processed and stored in similar ways.

Reducing Postharvest Losses In the OIC Member Countries
69
With crops that have high fatty acid content such as sesame, another problem that can occur is rancidity of the crop. Ways to mitigate those losses were listed in Table. Table 31: Mitigation of PHLs reported for oilseed and pulses and per step of postharvest
Postharvest step Cowpeas Sesame seed
Harvesting Improvement of harvest techniques Mechanical harvest
Threshing/ shelling Development and extension of appropriate shelling technologies
-
Storage Extension and development of appropriate storage technologies
-
Improved technologies (harvesting, shelling, and storage) and mechanisation were suggested as the ways to reduce PHLs in oilseed and pulses. Some constraints were however stated (Table). Table 32: Constraints to reducing PHLs reported for oilseed and pulses and per step of Postharvest
Postharvest step Cowpeas Sesame seed
Harvesting Availability and accessibility of appropriate technologies- Use of mechanic harvest by low income farmers
Early harvest before shattering
Threshing/ shelling Availability and accessibility of appropriate technologies- Use of traditional threshing
-
Storage Availability and accessibility of appropriate technologies
-
The availability and accessibility of the technologies is a main constraint and this would be related to the lack of capital of farmers in these countries (Sudan and Burkina Faso). Investment would be needed to reduce PHLs in oilseed and pulses according to the respondents.
3.6. Fruits and Vegetables
Respondents (19) selected ‘fruits and vegetables’ as a commodity they have experience in and answered questions. The respondents had experience in various OIC countries: Africa (Egypt, Nigeria, Uganda, and Cameroon), Asia (Pakistan, Tajikistan), Middle-East (Lebanon, Bahrain). The commodities quoted were also diverse: banana, dates, grapes, mangoes, tomatoes, berries, apricot etc. Main products were fresh vegetables and fruits, fruit juice and dried fruits (mango, apricot). By-products reported were apple vinegar, pulp, seed/pip/husks, and skins. The percentage of final product lost by weight in the postharvest value chain for Fruits and vegetables is presented in Table.

Reducing Postharvest Losses In the OIC Member Countries
70
Table 33: Weight postharvest losses in fruits and vegetables per country and step of postharvest
Fruit & veg./ country
N Weight Postharvest losses (PHLs) (%) (min-max) H
arv
est
ing
Sto
rag
e
Ma
rke
tin
g
Tra
de
rs
ha
nd
lin
g a
nd
so
rtin
g
Tra
nsp
ort
ing
Wh
ole
sale
r a
nd
re
tail
er
ha
nd
lin
g
Pro
cess
ing
Oth
er
(ple
ase
sp
eci
fy)
Grapes 1 32 (no range) 3 5 - 6 8 10 - -
Uzbekistan 1 32 3 5 - 6 8 10 - -
Mangoes, mangosteens, guavas
3 49 (35-65) 6 8 8 5 4 8 16 10
Nigeria 1 65 10 15 10 10 5 15 - -
Pakistan 2 41 4 5 6 3 4 4 16 10
Onions 1 5 (no range) - - - 7 6 4 0 -
Tajikistan 1 5 - - - 7 6 4 0 -
Tomatoes 5 37 (25-50) 11 29 10 11 19 13 10 -
Cameroon 1 25 2 10 15 15 20 15 - -
Indonesia 1 30 10 5 5 0 10 - -
Nigeria 3 43 15 35 10 13 25 15 10 -
Watermelons 1 30 (no range) - - - 55 - - - -
Nigeria 1 30 - - - 55 - - - -
Other fruits 5 42 (20-50) 14 11 10 6 7 13 15 -
Lebanon 1 40 10 5 5 5 5 5 5 -
Nigeria 2 50 20 20 20 7 9 18 10 -
Tajikistan 2 35 5 9 5 - 5 10 23 -
Total 16 38 (5-65) 10 16 10 11 11 11 13 10
Note: Number of respondents (N).
Three respondents did not complete the estimate PHLs in terms of weight and value. As a result only 16/19 respondents commented on fruits and vegetables PHL estimate. On average losses were 38% ranging between 5 and 65%. This large variability can be explained by the variety of fruits and vegetable cited in the survey. A minimal loss was reported for onions (5%) whilst more important losses were reported with more fragile fruits such as mangoes, tomatoes and other fruits. Losses were spread almost equally at each step of the value chain: harvesting, storage, marketing, handling, transporting and processing and shows that a close-look at each step is required for fruits and vegetables that are easily susceptible to damage. Causes for the PHLs in fruits and vegetables are presented in Table.

Reducing Postharvest Losses In the OIC Member Countries
71
Table 34: Causes of PHLs reported for fruits and vegetables and per step of processing Postharvest
step Grapes Mangoes,
mangosteens, guavas
Onions Tomatoes Watermelons Other fruits
Harvesting High product temperature at harvest; physical damage
Harvesting timing; leading to over or under-ripe fruits Poor harvesting techniques and/or planting of fragile varieties; high physical damage
Poor harvesting techniques and/or planting of fragile varieties; high physical damage
Harvesting timing; leading to over or under-ripe fruits Lack of temperature regulation, poor storage facilities Poor harvesting techniques and/or planting of fragile varieties; high physical damage
Lack of sorting to remove poor quality/damaged produce
Harvesting timing; leading to over or under-ripe fruits Poor harvesting techniques and/or planting of fragile varieties; high physical damage And handling during harvesting
Storage No appropriate storage facilities accessible to manage trader and price opportunities (if buyer does not arrive or offers a very poor price)
No appropriate storage facilities accessible to manage trader and price opportunities (if buyer does not arrive or offers a very poor price) No appropriate storage system without considering fundamentals of refrigeration
No appropriate storage facilities accessible to manage trader and price opportunities (if buyer does not arrive or offers a very poor price
No appropriate storage facilities accessible to manage trader and price opportunities (if buyer does not arrive or offers a very poor price
- No appropriate storage facilities accessible to manage trader and price opportunities (if buyer does not arrive or offers a very poor price
Marketing Simultaneous overproduction leading to fresh product market gluts, and few value addition or processing options
Poor market information or options leading to farmer selling at a low price: Especially in export marketing Simultaneous overproduction leading to fresh product market gluts, and few value addition or processing options
Poor market information or options leading to farmer selling at a low price
Lack of awareness of quality standards by farmers Simultaneous overproduction leading to fresh product market gluts, and few value addition or processing options
Lack of awareness of quality standards by farmers
Lack of awareness of quality standards by farmers Poor market information or options leading to farmer selling at a low price Simultaneous overproduction leading to fresh product market gluts, and few value addition or processing options
Traders handling and sorting
Poor packing, handling or sorting of produce in field and at traders premises
Poor packing, handling or sorting of produce in field and at traders premises: non skilled system Poor quality produce from the farmers such as damaged, diseased, over or under-ripe produce
Poor quality produce from the farmers such as damaged, diseased, over or under-ripe produce
Lack of appropriate storage facilities Poor packing, handling or sorting of produce in field and at traders premises
Poor packing, handling or sorting of produce in field and at traders premises
Lack of appropriate storage facilities Poor packing, handling or sorting of produce in field and at traders premises Poor quality produce from the farmers such as damaged, diseased, over or under-ripe produce

Reducing Postharvest Losses In the OIC Member Countries
72
Postharvest step
Grapes Mangoes, mangosteens,
guavas
Onions Tomatoes Watermelons Other fruits
Transporting Poor infrastructure (roads), heat and transport breakdowns; physical damage: lack of refrigerated transport, poor packaging, and infrastructure
Poor infrastructure (roads), heat and transport breakdowns; physical damage Senescence accelerated ripening No referred transportation
Payments at police and customs checkpoints (Tajikistan)
Poor infrastructure (roads), heat and transport breakdowns; physical damage Poor packaging method coupled with overloading of produce and use of unappropriated vehicles such as fuel takers
Poor infrastructure (roads), heat and transport breakdowns; physical damage
Growing of highly perishable varieties; physical damage Poor infrastructure (roads), heat and transport breakdowns; physical damage Poor packaging and/or overfilling of containers; physical damage
Wholesaler and retailer handling
No access to cool storage leads to shorter shelf-life improper handling even with cold storage Poor retail packaging from bulk pack
No access to cool storage leads to shorter shelf-life
No access to cool storage leads to shorter shelf-life
No access to cool storage leads to shorter shelf-life
No access to cool storage leads to shorter shelf-life
No access to cool storage leads to shorter shelf-life
Processing Too high temperature prior to, during and after processing
Inadequate processing (e.g. drying) producing low quality products Lack of constant supply of fresh fruit or vegetable to optimise equipment use Non-professional approach and inadequate facilities
Lack of constant supply of fresh fruit or vegetable to optimise equipment use
Inadequate processing (e.g. drying) producing low quality products Lack of constant supply of fresh fruit or vegetable to optimise equipment use
Lack of constant supply of fresh fruit or vegetable to optimise equipment use
High pesticide residual levels and other contaminants on products leading to possible market bans Inadequate processing (e.g. drying) producing low quality products No processing facilities
Physical damage during handing (shocks), inadequate temperature (too high) during transportation or storage were cited as the main causes for losses independently of the fruit or vegetable commodity. With regards to the processing step, the lack of constant supply of fresh fruit and vegetable is a hindrance and also inadequate processing that produces products of too low quality and hence reduces the marketability of those. Ways of mitigate losses were reported by the respondents in Tabl.

Reducing Postharvest Losses In the OIC Member Countries
73
Table 35: Mitigation of PHLs reported for fruits and vegetables and per step of processing. Postharvest
step Grapes Mangoes,
mangosteens, guavas
Tomatoes Other fruits
Harvesting - Instrument to determine maturity level and harvesting aids
Use of proper maturity indices Clean/sharp cutting tools Gentle handling Improved field containers Processing to secondary and tertiary products
Training on optimal harvesting practices, i.e. harvest before ripening, handling - moving to shade immediately Training on harvesting techniques and follow up
Storage Basic removal of field heat Proper packaging for storage and transport
Low temperature storage
Use of zero energy cooling chambers for primary storage
Low-cost passive cooling such as evaporative coolers Good storage facility with temperature/humidity control
Traders handling and sorting
Domestic, by air and by ship transport require different techniques of handling and packaging
Farmers can form cooperatives for loading tomatoes in trucks from the north to the south of the country (Nigeria)
Sorting required before storage
Transporting Need to use clean refrigerated trucks
Use crop friendly transport system
- -
Wholesaler and retailer handling
need facilities to receive, store and distribute product that will maintain the cold chain
- Gentle handling and providing shade required
Moving product from farm-gate to market requires cold chain refrigerated transport
Processing - Lack of facilities we have developed dried processing of natural/organic unripened/ripened mango with certification (Pakistan)
Training farmers on small scale production of tomato paste/puree is required because the dried tomato is not well accepted
-
Note: No comments were reported for banana, date, onion, watermelon, and pineapple commodities
In order to reduce PHLs, solutions proposed are better ways to measure maturity indices, training on harvesting practices (handling). During transport and storage, appropriate packaging to reduce physical damage and cooling/refrigeration structures would help preserve quality and reduced PHLs. Constraints to reducing PHLs for Fruits and vegetables in OIC countries are reported in Tabl.

Reducing Postharvest Losses In the OIC Member Countries
74
Table 36: Constraints to reducing PHLs reported for fruits and vegetables and per step of postharvest. Postharvest
step Grapes Mangoes, mangosteens,
guavas Tomatoes Other fruits
Harvesting - Harvest at appropriate level of maturity with respect to market
Lack of education and access to training Poor timing and facilities
Knowledge of techniques and maturity indices Lack of knowledge Lack of fruit varieties that are handier for transport.
Storage Storage facilities and temperature management
Proper cold storage infrastructure with basics of refrigeration
Lack of access to appropriate storage facilities and inadequate storage facility: farmers are resource poor cannot afford to get storage facility, bad/poor electricity generation to power such storage facility, poor adoption of low cost technology such as the zero energy cooling chamber
Lack of financial resources Lack of affordable technologies, services and maintenance
Marketing - - Packaging and storage facilities -
Traders handling and sorting
- Use of skilled people and appropriate system for each type of marketing
- -
Transporting Need for more refrigerated transport and better temperature management
Provide proper transport available for farmers and traders
Farmers are resource poor cannot afford to buy trucks with cooling cabins, Inadequate funds for farmer to procure replaceable plastic crates during transportation of tomato
-
Wholesaler and retailer handling
Need for trained personal and basic refrigerated infrastructure to maintain the cold chain
- Education and access to training
Cost and availability
Processing - Develop infrastructure adapted to the area (climate) Develop dried processing lines/innovative processing sheets/packaging/ storage/exports/dried value addition of natural/organic processing (Pakistan)
Poor electricity supply within the country coupled with high cost of fuel, low acceptability of dried/processed tomato products except for tomato paste and puree (Nigeria)
-
Note: No comments were reported for banana, date, onion, watermelon, and pineapple commodities

Reducing Postharvest Losses In the OIC Member Countries
75
Lack of knowledge for example to harvest at appropriate level of maturity, and lack of training are major constraints in OIC Member Countries with fruits and vegetables. In additional the lack of financial resources to buy equipment for appropriate transport and storage are main hindrances. In Nigeria the inconsistent electricity supply was cited as a main constraint to process good quality tomato paste and puree.
3.7. Meat and Meat Products
Two respondents selected ‘meat’ as a commodity and answered questions related to loss estimates. Beef was the only meat product reported. By-products were feet, skin and leather. The percentage of final product lost by weight in the postharvest value chain for Meat and Meat products is presented in Table.
Table 37: Weight postharvest losses in meat and meat products
Weight loss (%)
Se
llin
g o
n
farm
Tra
nsp
or
t to
m
ark
et
Bu
tch
er/
Ab
att
oir
Sto
re a
t p
roce
ssin
g p
oin
t
Pro
cess
ing
Sto
re a
t se
llin
g
po
int
Ma
rke
tin
g/
reta
ilin
g
Uti
lisa
tio
n/
Co
nsu
mp
tio
n
Beef 20 0 12 2 - 1 2 3 -
Estimate of PHLs was accounted only for one respondent. Global losses were 20% and transport to the market was the major step where losses occur. Causes of those PHLs were described for beef meat; ways to mitigate those losses were proposed, constraints to reducing PHLs were expressed in Table.
Table 38: Causes, mitigation of PHLs, and constraints to reducing them (beef) Postharvest step Causes Mitigation Constraints
Transport to market Weight/quality loss due to trekking: lack of feed and watering facilities en- route when transported by truck
i) provision for feeding and watering en route ii) slaughtering in production zone and transporting to market (raises cold chain issues though)
Un-customised cattle transport trucks, long distance between main production and marketing zones
Butcher/Abattoir poor hygiene in the abattoir resulting in faecal contamination of meat some of which is discarded
upgrade slaughter slabs - provide water and ensure slab is good concrete quality
Low investment in infrastructure
Store at processing point
Quality deterioration "showcase" meat under fly screen; refrigeration but faces power cut problems
Lack of electricity or frequent cuts in supply
Processing Quality deterioration. E,g. burning to remove hair could be excessive
- -
Store at selling point Quality deterioration. E.g. deterioration of unsold parts
- -
Marketing/retailing Quality deterioration - -
High losses reported during the transport to the market were attributed to a lack of feed for the animals and poor transportation conditions (animals dehydrated and losing weight). It was proposed to provide watering and feeding. A suggestion was to conduct slaughtering in production zone and transport the meat however this option would require cold-chain transportation and additional costs. Constraints were the long distances between productions, slaughtering and marketing zones that reduced the quality and increased PHLs.

Reducing Postharvest Losses In the OIC Member Countries
76
3.8. Milk and Dairy Products
Only one respondent selected ‘milk and dairy products’ as a commodity they had experience in and answered questions. Cheese, yoghurt and qurut (dried traditional yogurt popular in Afghanistan, Iran, Kazakhstan, Kyrgyzstan, Tajikistan, Armenia, Azerbaijan, Georgia, Turkey) were the main by-products of goat milk. The percentage of final product lost by weight in the postharvest value chain for Milk and dairy products is presented in Table.
Table 39: Weight and economic postharvest losses in milk and dairy products Weight loss (%) Economic losses (%)
Products Global Processing of milk
Storage and distribution of other dairy products
Consumption of milk or other dairy products
Global Processing of milk
Storage and distribution of other dairy products
Consumption of milk or other dairy products
Goat cheese, yoghurt, qurut (Afghanistan)
30 10 15 5 40 20 15 5
On average weight losses and economic losses reported were 30% and 40%, respectively. The main step where losses occur was during the storage and distribution of the products (15%). During the processing of the milk 10% of losses were reported and 5% during the consumption. Causes and ways to reduce those losses in goat milk and dairy products from Afghanistan, and constraints to achieve this were reported in Table. Table 40: Causes, mitigation of PHLs, and constraints to reducing PHLs reported for milk and dairy products (Goat cheese, yoghurt, qurut from Afghanistan)
Postharvest step Causes Mitigation Constraints
Milking Hygiene Cow mastitis
- -
On-farm storage and cooling of milk
Lack of equipment - -
Processing of milk Lack of knowledge of dairy processing
capacity building, equipment
poor knowledge of processing and packaging
Storage and distribution of milk
Inadequate storage facilities
- -
Storage and distribution of other dairy products
Inadequate storage facilities
Storage facilities no facilities of storage and distribution
Consumption of milk or other dairy products
Poor packaging - -
Cow mastitis (infection of the cow mammary gland) was reported and can be caused by a lack of hygiene. Lack of equipment and knowledge in dairy processing as well as poor storage facilities and packaging were also cited. Capacity building and better storage facilities were proposed to reduce losses. Current constraints are lack in knowledge of processing and packaging of dairy products and inadequate facilities for storage and distribution of the products.
3.9. Fish and Seafood Products
A limited number of respondents (3) selected ‘fish and seafood’ as a commodity they have experience in. Smoked/dried fish and fresh fish were the products from inland or marine

Reducing Postharvest Losses In the OIC Member Countries
77
capture from three countries (Cote d’Ivoire and Mali in Africa and Indonesia). By-products were fish sauce, fish skin or leather, fish oil and offal’s for inland capture. Only one respondent gave an estimate of weight losses which was for Mali. Weight losses in fish and sea food were estimated to 50% overall and the key-steps were processing at landing and utilisation (30% loss) and consumption (50% loss). Global economic losses were estimated higher than weight losses (70%) and the same critical steps were reported. Causes of weight and economic losses were reported in Table.
Table 41: Causes of PHLs reported for fish and seafood and per step of Postharvest Postharvest step Inland capture
Selling from boat/shore/pond side Weight/quality loss
Processing at landing Quality deterioration
Transport to market/process point Quality deterioration
Sale fresh/chilled Inadequate ice/chilling capacity
Store at processing point Quality deterioration
Processing/freezing Quality deterioration
Transport to final market Quality deterioration
Store at selling point Quality deterioration
Marketing/retailing Quality deterioration
Transport to home Quality deterioration
Storage at home Quality deterioration
Utilisation/Consumption -
Losses were reported for inland capture only. However these comments can be extrapolated to marine capture. Whilst selling fish or seafood, loss in weight and quality were cited whilst for the other steps, quality deterioration (fish is extremely sensitive to temperature and microbiological degradation) was highlighted as major. Inadequate ice/chilling capacity during sale of fish was also cited. Table reports ways to mitigate losses in fish and sea food and constraints.
Table 42: Mitigation of PHLs reported for fish and seafood and per step of Postharvest Postharvest step Inland capture
Selling from boat/shore/pond side
Processing at landing: constraints: ice storage capacity, availability of dryers for rainy seasons for processing at landing
Processing at landing Hygiene practices
Hygiene practices whilst processing at landing were cited. In addition, whilst processing at landing and selling fresh fish, constraints are the ice storage capacity and the availability of dryers if fish is smoked or dried.
3.10. Conclusions
The number of responses (59) is not statistically valid for comparison of the crops and countries. There is no means to validating or verifying the figures we have received but can cross reference against other published data.

Reducing Postharvest Losses In the OIC Member Countries
78
On average weight losses reported were 21% on Cereals, 50% on Fish and Seafood products, 38% on Fruits and Vegetables, 20% on Meat and Meat products, 30% on Milk and Dairy products, 37.5% on Oilseeds and Pulses, and 25% on Roots and Tubers. The wetter the product the more difficult to transport and maintain, the more it required specific refrigeration and cooling conditions. The drier the easier to maintain for longer periods; however contamination (e.g. insects, extraneous matter) can cause major losses on dried commodities such as cereals, oilseeds and pulses.
Qualitative data on the causes, mitigation and constraints gave some insight on the way forward to further reduce postharvest losses in OIC countries: postharvest handling and processing of food commodities requires knowledge and hence training according to the respondents of the survey. Investment in more advanced equipment (processing or storage) was also mentioned. Good road infrastructure is a major factor for the limitation of PHLs.
There are large gaps in knowledge for many countries and products. In order to conduct a more quantitative analysis, more respondents would have been needed to complete the online survey. Determining the level of PHL in terms of quantitative loss (weight) and value loss (economic) requires an in-depth study and in-countries value chain field observations are necessary since the values reported by respondents can easily be biased without access to field measurement.

Reducing Postharvest Losses In the OIC Member Countries
79
0
1,000,000
2,000,000
3,000,000
4,000,000
5,000,000
6,000,000
7,000,000
8,000,000
9,000,000
10,000,000
Wheat Maize Rice, paddy Sorghum Barley RyeAn
nu
al p
rod
uct
ion
(to
nn
es)
1961 1970 1980 1990 2000 2010 2014
CASE STUDIES 4.
The approach for the case studies has been discussed in the introduction. These were a combination of desk based studies for four commodity groups (cereals, root and tuber crops, oilseeds and pulses and milk and dairy products) and field trips (fruit and vegetables, meat and meat products and fish and seafood products). Each case study is reported below.
4.1. Cereals in Egypt
This was a desk based study and is based on available published literature. 4.1.1. Status and Importance
The main cereal grains grown in Egypt are wheat, maize, rice, sorghum, and small quantities of barley and rye (Figure). Production of wheat, maize and rice have increased significantly since 1980. Figure 10: Production trends of main cereal crops in Egypt
Source: FAOSTAT 2016
However, since the 1990s Egypt has also had to import about 50% of its wheat and maize requirements. The population has also increased rapidly, and there are now over 91 million people in Egypt, of whom 43% are urban-based. Egypt had a per capita GDP of USD$3,366 in 2014, with 2.2% GDP growth in 2014 and 10.4% inflation in 2015 (World Bank, 2016) Wheat is the key staple food crop in Egypt, it is consumed mainly as bread and provides, on average, about one-third of the daily caloric intake of consumers and 34% of their daily protein consumption. Because it is such an important component of the daily diet, particularly for the poor, and because Egypt is only 51% self-sufficient in wheat production it follows that wheat policy is central to food security in Egypt (Siam and Croppenstedt, 2007). The import-related high exposure to international markets implies an unacceptably high risk to the country’s wheat supply, and clearly acts as an incentive for the Government to support domestic

Reducing Postharvest Losses In the OIC Member Countries
80
production of wheat. However, water resources are limiting. The market was liberalised in 1987, and guaranteed floor prices are announced for wheat and rice at planting time. Egypt has a history of elaborate food subsidies which reflect its efforts to promote social equity and political stability. Wheat is the backbone of the food security policy in Egypt, about half the total consumption of wheat is baladi bread subject to subsidy, with the baladi bread subsidy amounting to ~0.8% of Egypt’s GDP in 2010/11 (FAO, 2015). Subsidised baladi bread is symbolic of the broader social contract between the Egyptian government and the population (Ahmed et al., 2001). Wheat flour as well as baladi bread (based on wheat), and oil and sugar are the four remaining subsidy items and a major component of the social safety net (which also includes water, energy, housing, education, health and transportation) for the poor. However, analyses show the poor benefit slightly less than the rich from this subsidy, and the lack of bakeries in rural locations mean the urban poor receive more. In such an import dependent country, upward fluctuations of international wheat prices highlight the need for safety nets. Strategic stocks are able to help isolate the country from such an effect, and given the magnitude of the income effects might even be justified (Siam and Croppenstedt, 2007).
In 1960, Egypt was essentially self-sufficient in food (Ministry of Supply and Home Trade - Egypt, 1988). Traditionally the staple Egyptian bread was made of maize (corn) mixed with wheat in a roughly 60/40 or 70/30 ration, or corn alone with a small admixture of fenugreek. By 1980, the gap between agricultural production and food consumption had reached about nine million tons in all the key food commodities combined. The heavy economic burden of food imports led to major investments in the agricultural sector beginning in the early 1980s (Galal, 2002).
Bread is the only food commodity heavily subsidised now. Data from food balance sheets show there were two major shifts in the Egyptian food supply from the mid-1950s to the mid-1990s. One was an increase in per capita grain availability and a shift from a dependence on mixed grains (wheat, corn, rice and sorghum) to a more nearly total dependence on wheat (Galal, 2002).
The maize grown in Egypt is mainly white maize, although the planting of yellow maize intended for animal feed is increasing. The only grain that is exported in any volume from Egypt is rice, which is considered high-quality and fetches a high price. However, due to it being a heavy consumer of water, the government is trying to discourage farmers from planting rice. Geographical bans on planting areas and controls (and occasional bans) on rice exports are in place, but not always effective (Wally, 2016; FAO, 2015). 4.1.2. Assessment of Postharvest Losses and Economic Burden
There is very limited published literature on the level and causes of cereal postharvest losses in Egypt, and much of that which exists is rather dated and heavily focused on the storage stage of the postharvest system. Studies in the 1970s on the level of typical storage weight losses in warehouses due to insect pests recorded 24.2-47.8% for wheat, 16.2-27.9% for maize and 26.3-46.9% for sorghum by the summer (Koura and El-Halfaway, 1973). A later study concluded that external insect infestation, grain weight loss, insect fragment content in milled
Baladi bread

Reducing Postharvest Losses In the OIC Member Countries
81
grain and the rate of increase in grain moisture content could all be used as valid criteria for rapid assessment of the grade of damage in stored grain (Omar and Kamel, 1984). However, no further publications can be located on whether these findings were then used to provide rapid estimates of the storage losses of cereal grain in Egyptian warehouses. A 1984 study by El-Lakwah identified rodents, insects7 and birds were the main causes of postharvest loss at farmer level in Egypt. Rodents alone were found to cause annual weight losses of 4-10% of stored grains, with 10-26% of bags being damaged (El-Lakwah, 1984). Very limited data on losses incurred in the open-air flat storage sites (shounas) is available and inventory control is based on counting of the bags without regard to quality or quantity changes (El-Lakwah, 1995). One 1993/4 study found losses varied between shounas, generally ranging from 2-12.4%, with the insect Trogoderma granarium attack on wheat and rodents causing high losses (El-Lakwah & Laborius, 1995). The wheat storage period is typically between 4-8 months. Handling and transport losses were ~0.21% on shounas. Storage losses of cereal grains in the Lakyubia region were 0.03-0.77% and for pulses, 1.41-2.81% in 1989/91 (El-Lakwah et al., 1993). Later stored product entomological research included laboratory work on the role of botanicals, such as Neemazal (a 10% neem powder) in protecting stored grain against insect damage (El-Lakwah and El-Kashlan, 1999), and studies assessing whether differential resistance of sorghum varieties to attack during storage by the angoumois grain moth, Sitotroga cerealella could be incorporated into effective stored pest management (Hassan et al., 2014). Laboratory studies on stored product pest management occur, but very few large scale applied studies follow (El-Lakwah, 1995). The few studies that have looked at aflatoxin contamination of food products have found that a high proportion of cereal grains (maize, wheat and rice) and groundnuts in Egyptian markets contained aflatoxins B1 or G1 at levels well beyond the WHO and FDA safe limit for human consumption (El-Shanshoury et al., 2014). Unfortunately the African Postharvest Losses Information Systems (APHLIS) does not cover North Africa and therefore cereal postharvest loss estimates equivalent to those available for Sub-Saharan Africa do not exist. However, in a recent global food loss and waste assessment, the ‘North Africa, West and Central Asia’ group of countries which includes Egypt were calculated to have a per capita food loss of 180 kg/year during the production to retailing stages, and a 30 kg/year per capita food waste by consumers figure (Gustavsson et al., 2011). This same study calculated the part of the initial cereal production lost or wasted at different food supply chain stages. For North Africa, West and Central Asia, 31% of cereal production was wasted; 6% loss during production, 8% loss during postharvest handling and storage, 4% loss during processing, 3.4% loss during distribution, and 9.5% wasted at consumer level. Given the relative absence of published studies on cereal postharvest losses in Egypt, no data exists on their overall scale or cost to the country’s economy. Thus to estimate what a 10-30% postharvest loss would hypothetically mean in terms of grain quantity and value Table 43 has been created.
7 Main insect pests of stored cereal grains in Egypt: Sitophilus spp., Rhyzopertha dominica, Trogoderman granarium, Tribolium sp., Sitotroga cerealella, Corcyra cephalonica, Oryzaephilus surinamensis. Rodent species causing stored product damage are: field rat, Norway rat, Black rat, Alexandrius rat, Roof rat, Spiny mouse, House mouse. Birds such as sparrows became a serious pest following the reduction in the population of birds of prey, pigeons also feed on the grain during threshing and storage.

Reducing Postharvest Losses In the OIC Member Countries
82
Table 43: Estimated impact of 10-30% Egyptian cereal postharvest losses Item 2013 (t) Hypothetical quantity and value of postharvest losses of
10% 20% 30% t USD t USD t USD
Wheat produced
9,460,200 946,020 370,839,840 1,892,040 741,679,680 2,838,060 1,112,519,520
Wheat imported
10,288,434 1,028,843 316,883,767 2,057,687 633,767,534 3,086,530 950,651,302
Maize produced
7,956,593 795,659 210,054,055 1,591,319 420,108,110 2,386,978 630,162,166
Maize imported
5,771,770 577,177 115,435,400 1,154, 354 230,870,800 1,731,531 346,306,200
Rice produced
5,724,106 572,411 144,819,882 1,144,821 289,639,764 1,717,232 434,459,645
Total 39,201,103 3,920,110 1,158,032,944 7,840,221 2,316,065,888 11,760,331 3,474,098,833
Note: The above calculations use the domestic wheat procurement price of USD$392/t; and the imported wheat price of USD308/t; (FAO, 2015); the domestic maize and rice procurement prices of USD$264/t and USD253/t (Hamza & Beillard, 2014); and the international maize price of USD$200/t (USDA, 2016)
These rough calculations highlight the huge losses occurring if postharvest cereal grain loss levels are even just 10%, let alone closer to 20 or 30%. A 10% postharvest loss of all Egypt’s domestically produced and imported wheat, maize and rice would equate to the loss of 3.9 million tons of cereal grains per annum, equivalent to USD$ 1.16 billion/ annum, or the annual caloric requirements of at least 15 million people (at 2,500 kcal per person per day)8. The high subsidised output prices for locally-grown wheat and maize in Egypt, might suggest it would make more economic sense to focus postharvest loss reduction attention on the postharvest stages of domestically produced wheat. However only between 3 and 5 million tons of this domestically grown wheat is ever purchased at that price, with the larger proportion ~63% of the domestically produced wheat being stored at the homesteads of the farmers producing it. In Egypt, farmers grow wheat as a winter crop planted in Oct/Nov, harvested in Apr/May. The government announces its wheat procurement price prior to the planting season (currently $357/ton (Wally, 2016)), and if farmers are dissatisfied with it this affects the wheat acreage planted. The General Authority for Supply Commodities (GASC) sets annual targets of the amount of locally produced wheat it wishes to purchase, but often fails to meet these targets as the private sector traders offer farmers higher prices (Mansour & Iglesias, 2011). Farming families9 will keep their own stocks of cereals10 to mill at the village mill and then produce bread from, and some also feed livestock with cereal grains. Most farmers use sickles and scythes to harvest their cereal crops, a few larger farmers using reaping machines (El-Lakwah, 1995). The crop is then transported from the field to the threshing place or homesteads by camel, animal carts, donkeys, although larger-scale farmers may vehicles. The crop is placed on the ground at the threshing place and dried using the sun and air. Most Egyptians use
8 Assuming 3,500 kcal per kg of average grain (Rosen et al., 2016) 9 Wheat was grown on 4.3 million farms in Egypt in 2012, 89% of farms are smaller than 1.3 ha (FAO, 2015). 10 63% of the domestically produced wheat in Egypt is kept and consumed on farm for food, seeds, feed etc., only 37% is bought by the Government.

Reducing Postharvest Losses In the OIC Member Countries
83
threshing machines, and then winnow the crop using the wind. On-farm storage involves sun-drying of the cereals and moisture content at start of storage is rarely a problem, but contamination with impurities and losses from pests is serious. At farmer level grain may be stored in mudded granary bins in or outside the house for 3-12 months, often after admixing the grain with oven ash, salt or chilli pepper. Or in jute or plastic bags or heaps in a room in their houses – due to poor hygiene, rodents and insects attack the stored products. Maize cobs are stored in the eaves of the house’s roof and often suffer from insect or rodent attack. In the villages near the desert and in the oases, grains are sometimes stored underground - using conical pits that can be up to 3 metres deep – the CO2 produced by the crop accumulates in the pit and insects die, but the pits are laborious to construct, monitor and remove grain from. The wheat grain is usually washed before milling and drying it on mats in the sun. The Egyptian government has been negotiating with the governments of Uganda, Sudan and Ethiopia to plant wheat and other crops in their countries to help meet Egyptian consumer demands and increase control over the country’s food security. The government stores both the wheat it buys locally and the wheat it imports in shounas mainly (Wally, 2016). Shounas11 are a system of traditional open flat storage where sacks are simply stacked on top of each other usually under a roof with no walls. The shounas range in capacity from 6,000 to 8,000 tonnes. The shounas can only accept wheat during a fixed period (~3 months) set by the MALR. Theoretically there are three quality grades, but most wheat receives the lowest price, payment is supposed to be within 48 hours. The poor quality of this storage is estimated to cause 5-10% losses from exposure to weather and pests, there are also reports of fumigation failures. Some small producers struggle to arrange transport of their surplus grain to the shouna, and so many sell to local traders who purchase it volumetrically using an ‘ardab’, and then sell it on to the shouna by weight. The shounas are supposed to be emptied within a 6 month period, to ensure they can be cleaned before loading of the next year’s harvest, but storage increasingly exceeds 6 months (FAO, 2015). Of the 364 shounas, 264 shonas are in disrepair and need to be upgraded. Only 88 have concrete floors (FAO, 2015). A large project is currently underway to refurbish 93 shounas which will include modernized warehouses with screening, drying, and grading capabilities and state-of-the-art stock and quality management systems. The project is being undertaken by the Ministry of Defense’s Engineering Authority which is building the warehousing and a U.S. company, Blumberg Grain, which is equipping this new storage. Recently, Egypt also received Italian, UAE and Saudi funds to replace some of the shounas with modern silos. Public sector mills represent about 73% of the total milling capacity in Egypt, the Government is expected to retain control of the milling industry given the strategic nature of wheat in Egypt (Mansour & Iglesias, 2011). There are 126 public sector mills associated with Food Industries Holding Company, mostly small or medium in size producing 82% flour for subsidized bread, 76% flour for semi-subsidised bread (tabaki) and 72% flour for white high quality flat bread, European bread, biscuits, pastries and pasta. There are about 36 private sector commercial mills with a total capacity of 9,000 tons per day (2.8 million tons annually), they are only supposed to mill imported wheat and to produce 72% flour, but many mill locally produced wheat. Bread is produced in 19,000 bakeries, and 75% of the bread produced is subsidised baladi bread made from 82% wheat flour.
11 Shouna’s are open spaces ranging in size from 2,000 – 20,000 m2. They are typically enclosed by a simple wire fence, and may have a floor and a roof under which grain in jute bags is stacked and stored. Some shounas also have warehouses.

Reducing Postharvest Losses In the OIC Member Countries
84
There are losses during harvesting, transportation, storage, milling, distribution of wheat and flour, baking, and consumption of bread. Theft is also a factor, as is the low quality of the subsidised bread which leads to higher consumer wastage of it. The subsidised flour is also sold on the black-market to beef and dairy producers, leftover bread is also collected and sold by the kilo to livestock farmers to use as feed. A study referred to (but not cited) in Mansour & Iglesias, 2011, suggested that 13-15% of the total wheat consumed in Egypt was lost during the harvesting to baking stages. The Egyptian Ministry of Trade and Industry (MFTI) tries to maintain a 5-6 months’ supply of strategic wheat stocks. However, storage capacity is limited and as a result the stock figure includes wheat import purchases which are still in the pipeline (e.g. on-board vessels, and recently tendered) and may account for ~2-3 months of the annual consumption amounts. Wheat storage capacity is ~5.2 million metric tons (MMT) (Whalley, 2016). Wheat imported by the private sector moves directly from port storage to the mills. Public mills have 700,000 tons storage capacity, and the private sector ~1 MMT, the Egyptian Holding Company for Silos and Storage has 1.5 MMT (some inland and some port-based), including 25 newly constructed silos. The Principal Bank for Development and Agricultural Credit has 364 shounas with a storage capacity of 2 MMT used for the local harvest. Over-time the Egyptian wheat import standard specifications have become increasingly strict12. GASC tender requirements have an option for Egyptian Ministry of Agriculture inspectors to travel to the exporting country and inspect the wheat before it is shipped to Egypt, this happens in France and Russia although it is also inspected again on arrival. The Egyptian MFTI has banned countries from exporting to Egypt where the wheat was found to be low quality. US Wheat Associates provide trade servicing and quality seminars to Egyptian millers, wheat buyers and traders. Over the coming years a gradual decline in the planted area of wheat, rice and corn in Egypt is expected due to more limited Nile water availability, heat stress and salinity issues, and limited drought tolerant varietal development (Wally, 2016).
4.1.3. Causes of Postharvest Losses
Many of the causes of cereal postharvest losses in Egypt commonly occur across the world (e.g. poor handling techniques, storage pests, weak monitoring, theft etc.). In addition Egypt faces a number of other less common causes of cereal loss due in part to the various subsidies associated with the cereal (particularly wheat) supply chains. These loss causing factors are summarised in Table. The Egyptian Government is heavily involved in the wheat supply chains on a number of levels:
i) Producer input and output support – including subsidised fertiliser prices, and domestic procurement prices at higher than the import parity price
12 Minimum specifications. = ≤13% moisture content; falling number of 200, impurities ≤0.5%; protein content ≥10-12%; specific weight ≤ 76kg/ hectolitre; safe to eat and free of unpleasant odours/ tastes; meets international limits on pesticide residues ≤0.1%, mycotoxins and heavy metals (cadmium and lead ≤0.2%). Defects ≤ 5% of weight; specifically ≤1.5% by weight of grain admixture; <1% by weight dead insects; < 4% damaged grain by weight; 20 poisonous or harmful seeds/kg; free of live insects and dead rodents; fumigation is necessary if 2 insects found within 1kg sample; organic materials < 5% of weight (GASC in FAO, 2015)

Reducing Postharvest Losses In the OIC Member Countries
85
ii) Consumer support – heavily subsidised price of baladi bread (accessed using smart-card system since 2015), and government ownership of 12% of bread baking capacity
iii) Public investment in improved grain storage facilities and state trading iv) Public support to general services (crop breeding research, phytosanitary control
etc.) (FAO, 2015) Whilst these government interventions aim to secure national food security, political stability and act as a vital social safety net for the 25% of Egyptians living below the poverty line (World Bank, 2011), there are unintended outcomes. These include:
the high subsidised procurement price to encourage wheat production in Egypt13 also encourages fraud as cheaper imported wheat is sold on as or blended with domestically produced wheat (Wally, 2016)
large volumes of flour being resold on the black market (FAO, 2015) significant extra costs/inefficiencies due to government involvement in cereal
procurement, storage and milling compared to if the process was liberalised14 increasingly complex tender documents, import requirements and processes15 poor quality of many of the shouna storage open bag-stack arrangements cause
qualitative and quantitative losses due to exposure to weather and pests, plus labour, bag and handling costs are high due to large number of employees, complex procurement system and security guarding; failed fumigations are reported (El-Lakwah, 1995)
Inefficient management of government storage facilities at the ports lead to long turnaround and loading times, delays in port and increased demurrage costs (FAO, 2015).
13 In 2014, the government spent ~USD$357 on subsidising the price of domestic wheat 14 Some suppliers suggest imported wheat prices are higher for the government than for private companies by roughly USD 6-7/tonne, plus a further USD 0.50-0.75/tonne for government inspections at the port of loading compared to using private inspection services at a cost of about USD 0.25/tonne. Additionally, the “freedom from ambrosia seeds” rules in force mean that if a shipment is declared to include ambrosia, additional costs of USD 12-15/tonne are incurred. This risk converts into higher prices for Egypt’s wheat imports. 15 Including the strict and subject-to-change-without-notice import specifications (e.g. ergot tolerance), and short notice GASC tenders, e.g. 7 weeks from tender originating to delivery of the wheat – which leads to suppliers incurring additional costs and some potential supply origins being unable to participate (FAO, 2015).

Reducing Postharvest Losses In the OIC Member Countries
86
Table 44: Causes of postharvest loss in Egyptian cereal supply chains, supply chain actors involved, and loss reduction options Postharvest
stage Causes of postharvest loss Actor who could reduce loss (and grain
origin)
Loss reduction options
Farmer produced
and home-stored
local grain
Govt. procured, stored &
milled local grain
Govt. procured imported
grain
Private trader
procured imported
grain
Pre-harvest factors affecting PH
Varietal choice, as some are less drought tolerant and more susceptible to storage pests
X - Cereal breeding for drought tolerance and PH characteristics (e.g. storage pest susceptibility) - Awareness of timely planting, soil management
Timing of planting, and soil-water management
X
Harvesting Late harvesting, grain shattering, insect infestation in field
X - Awareness of optimal harvest timing, field infestation risk - Better advanced planning for PH activities
Poor harvesting/ labour management – some grain left in field
X
Field drying
Theft by birds, livestock, wild-animals, humans
X - Stooking and/or quick removal of mature crop from field - Use of clean sheets/ containers to protect crop
Contamination by fungi, insects, foreign matter if on ground
X
Transport from field
Spillage through use of unsuitable containers/ carelessness
X - Better advanced planning & monitoring of PH activities. - Awareness on cross-contamination risks
Theft by humans X
Contamination through use of old sacks/ dirty containers
X
Further drying
Rain during drying X - Supervise grain drying so it can be quickly covered, tether or fence livestock - Awareness on risks of drying on ground and need for safe moisture content, use sheets/tarps or raised crib, thin layer
Inadequate drying practices/ knowledge
X
Theft/ damage by domestic or wild animals
X
Contamination by fungi, insects, foreign matter if on ground
X
Threshing/ shelling
Rough threshing/ shelling leading to damaged/ broken grains
X - Erect sides around threshing/shelling platforms and sheets underneath, gentler beating to prevent breakage, timely harvesting before crop over matures, maintenance/ knowledge of threshing machine to minimise breakage
Scattering and loss of grains X Contamination with foreign matter (e.g. small stones, dust)
X
Sorting No price premium for high quality, so no incentive for sorting
X X - Awareness: removing broken grains reduce pest damage. Support development of quality sensitive markets
Transport to market or govt. store
Contamination through use of dirty containers and vehicles
X X X X - Awareness re loss risks of over-filling and use of dirty/contaminated containers - Awareness on need to cover food grain during transport - Improved roads and barge routes to reduce delays, theft and deterioration. Anti-corruption actions
Theft/ corruption by humans X X X X
Over-filling sacks resulting in them splitting
X X
Uncovered transport leading to contamination and damage
X X X X
Poor road quality, and insufficient barge routes increase costs
X X X X
Unauthorised payments required X X X X
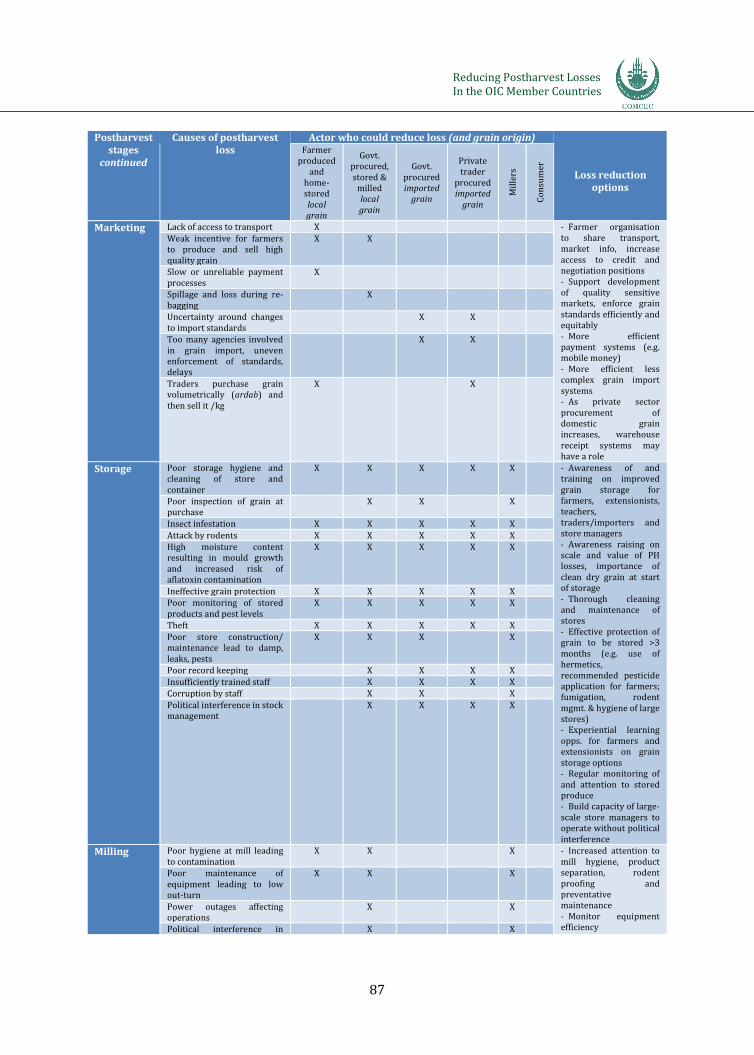
Reducing Postharvest Losses In the OIC Member Countries
87
Postharvest stages
continued
Causes of postharvest loss
Actor who could reduce loss (and grain origin)
Loss reduction options
Farmer produced
and home-stored local grain
Govt. procured, stored &
milled local grain
Govt. procured imported
grain
Private trader
procured imported
grain
Mil
lers
Co
nsu
mer
Marketing Lack of access to transport X - Farmer organisation to share transport, market info, increase access to credit and negotiation positions - Support development of quality sensitive markets, enforce grain standards efficiently and equitably - More efficient payment systems (e.g. mobile money) - More efficient less complex grain import systems - As private sector procurement of domestic grain increases, warehouse receipt systems may have a role
Weak incentive for farmers to produce and sell high quality grain
X X
Slow or unreliable payment processes
X
Spillage and loss during re-bagging
X
Uncertainty around changes to import standards
X X
Too many agencies involved in grain import, uneven enforcement of standards, delays
X X
Traders purchase grain volumetrically (ardab) and then sell it /kg
X X
Storage Poor storage hygiene and cleaning of store and container
X X X X X - Awareness of and training on improved grain storage for farmers, extensionists, teachers, traders/importers and store managers - Awareness raising on scale and value of PH losses, importance of clean dry grain at start of storage - Thorough cleaning and maintenance of stores - Effective protection of grain to be stored >3 months (e.g. use of hermetics, recommended pesticide application for farmers; fumigation, rodent mgmt. & hygiene of large stores) - Experiential learning opps. for farmers and extensionists on grain storage options - Regular monitoring of and attention to stored produce - Build capacity of large-scale store managers to operate without political interference
Poor inspection of grain at purchase
X X X
Insect infestation X X X X X
Attack by rodents X X X X X High moisture content resulting in mould growth and increased risk of aflatoxin contamination
X X X X X
Ineffective grain protection X X X X X Poor monitoring of stored products and pest levels
X X X X X
Theft X X X X X
Poor store construction/ maintenance lead to damp, leaks, pests
X X X X
Poor record keeping X X X X
Insufficiently trained staff X X X X Corruption by staff X X X
Political interference in stock management
X X X X
Milling Poor hygiene at mill leading to contamination
X X X - Increased attention to mill hygiene, product separation, rodent proofing and preventative maintenance - Monitor equipment efficiency
Poor maintenance of equipment leading to low out-turn
X X X
Power outages affecting operations
X X
Political interference in X X

Reducing Postharvest Losses In the OIC Member Countries
88
operations - Investment in diesel or alternative energy run machines
Utilisation Poor quality products (e.g. bread) lead to high wastage
X - Awareness raising on food safety issues - Increase autonomy of food choices and availability
Poor stacking and closing of containers leading to spillages, dampness, rancidity, infestation etc.
X
4.1.4. Measures and Strategies Implemented for Postharvest Loss Reduction in Uganda
Many of the causes of postharvest cereal losses in Egypt can be addressed through raising greater awareness of the level of losses and situations where they occur, the causes of the losses, well-known options and actions for addressing and reducing these losses and changes to the enabling environment. Postharvest innovation systems are complex and dynamic, bringing many different activities, actors, sectors and goals together (Figure). Using an innovation systems perspective can help to examine technological and institutional change as a complex process of interactions among diverse actors engaged in generating, exchanging, and using knowledge, and the social and economic institutions that condition their actions and interactions (Spielman et al., 2008; Larsen et al., 2009). The innovation systems concept extends beyond the creation of knowledge to encompass factors affecting demand for and use of new and existing knowledge (Hall et al., 2004).

Reducing Postharvest Losses In the OIC Member Countries
89
Figure 11: A postharvest agricultural innovation system
Source: Stathers et al., 2013
4.1.5. Lessons Learned from the Case Study
Sufficient focus on cereal postharvest loss reduction is unlikely to happen unless combined into a well-resourced, recognised and supported ‘improved cereal postharvest management’ programme. To be effective this programme needs to be long-term and contain the following elements:
Metrics and postharvest system – clearer understanding of what amount of postharvest losses are occurring at the different activity stages along the different and rapidly evolving cereal supply chains in Egypt, and why and which actors (farmers, transporters, traders, millers, government offices, gender etc.) and enabling factors (e.g. regulations, policies) need to drive changes in order to reduce losses, and what incentives need to exist for them to do so. Capacity strengthening of key actors in the cereal postharvest systems – this will involve:
Information – targeted awareness raising about the levels, points of and reasons for cereal postharvest losses, and opportunities for different actors and institutions to address them,
Enterprise domain (users of codified knowledge, producers of mainly tacit knowledge) e.g. farmers; small, medium & large agro-processors; commodity traders; input supply agents; companies and industries related to agriculture, particularly agro-processing eg equipment fabrication, sales and repair, product packaging and labelling materials; transporters; exporters
Research domain (mainly or sometimes producing codified knowledge) e.g. national and international agricultural research organisations; universities and technical colleges; private research foundations; private companies; NGOs
Intermediary domain: NGOs/ CBOs; extension services; consultants; private companies and other entrepreneurs; farmer and trade associations; media; information networks; donors
Enabling structures: banking and financial system; transport and marketing infrastructure; consumer protection agencies; food standards agencies; phytosanitary regulations and authorities; professional networks, including trade and farmer associations; education system; IPR and information system; government regulatory system (e.g. local govt, local policy makers, policy enforcement e.g. regulations, laws etc); standards and norms
Demand domain: consumers of food and food products in rural and urban areas; consumers of industrial raw materials; local, national and international commodity markets; policy-making process and agencies
Interaction
International interactions: trade & investment agreements; agricultural policies; exchange rates; market structures

Reducing Postharvest Losses In the OIC Member Countries
90
greater interaction/communication between cereal postharvest researchers in and outside Egypt16. Training – crop postharvest management is often omitted from agricultural training programmes due to resource constraints, postharvest activities being seen to be at the end of the crop cycle, and a lack of familiarity with the topic by many agricultural trainers. In addition to running specific multi-disciplinary improved postharvest management training courses targeted at the needs of the various actors in the cereal postharvest supply chain (e.g. extensionists, farmers, traders, transporters, store managers), crop postharvest management also needs to be incorporated into the curricula of primary and secondary schools and diploma level agriculture (Stathers et al., 2013). Some freely-accessible hands-on-learning style cereal postharvest management training materials already exist (e.g. the WFP/NRI Training Manual and Course for Improving Grain Postharvest Handling and Storage created by Hodges and Stathers, 2012), and could be adapted to fit the Egyptian context and targeted towards the different supply chain actors. Products – many products already exist which could be adopted and adapted by actors in the Egyptian cereal postharvest supply chains to help reduce losses. Some of these products include improved smallholder grain protection options such as hermetic bags, effective pesticides, drying sheets, threshing machines, and larger scale storage options such as improved warehouses and stock management systems. However, these products will only be useful if they are introduced alongside capacity building programmes so that supply chain actors understand how to use them optimally and why. Strengthened innovation system functioning – ongoing co-learning and interaction needs to be facilitated between the different key stakeholders in the cereal postharvest systems (this can initially be expensive, and needs to be owned, driven and of value to the supply chain actors if real issues are to be highlighted and sustainable solutions identified and implemented at the scale required), this process will also generate demand-driven research agendas which if followed will increase the perceived relevance of agricultural research to various private and public-sector stakeholders. Creating an enabling environment –the enabling environment is diverse and multi-faceted, the different players including the political leadership will need to be sensitised to ensure they understand the potential and increasing role to be played by cereal postharvest loss reduction in national and household level food security. This will help build advocacy for the integration of postharvest management in development planning and resources and sectoral policies.
16 The need for more postharvest specialists and extensionists and greater communication between postharvest researchers and development of more inter-disciplinary working styles were also noted by Yahia, 2005.

Reducing Postharvest Losses In the OIC Member Countries
91
As discussed in the previous sub-section, the Egyptian government is heavily involved in the cereal supply chains with the aim of securing national food security and political stability. However, various studies suggest this involvement is in several ways leading to inefficiencies, uncertainties and increased losses. Whether and how the private sector in partnership with the public sector can improve efficiency, increase investment and reduce postharvest losses without jeopardising national food security and political stability in such an import dependent country will be a key area of future exploration and experimentation. The government is already implementing innovative strategies to try and improve efficiency and reduce losses and corruption in the cereal supply chain (e.g. the baladi bread reforms which have involved a switch to electronic smart cards for beneficiaries to access their 5 loaves of baladi bread per day and to determine the bakers subsidies (FAO, 2015), although such changes bring new challenges with reports of bakers holding and misusing the smart cards of their insufficiently informed customers and hacking the systems (Wally, 2016; Knecht, 2016), the system may ultimately move to becoming a cash-based more targeted income transfer system; upgrading of shouna storage facilities and management systems with improved warehouses and in some cases more secure and less labour intensive silos of increased storage capacity (e.g. ~30,000t)). Many methods and tools to assist such cereal postharvest loss reduction approaches already exist. Whilst significant gains could be made through simply supporting the adoption of already known improved postharvest management practices and greater interaction and co-learning between the different actors involved in the cereal supply chain, a longer-term improved postharvest management strategy is required to drive sustainable and on-going loss reduction, including incorporation of the topic into agricultural training programmes, capacity building of extensionists, researchers, traders and store managers etc. for continued monitoring and responsive action.
4.2. Cassava in Nigeria
This was a desk based study and is based on available published literature.
4.2.1. Status and Importance Nigeria is the wealthiest country in Africa by GDP and also the most populous at 184 million. Nigeria is the largest producer of cassava globally and has been since 1991 (Figure; FAOSTAT) and this production has been steadily increasing, mainly responding to population growth and yield (Figur).

Reducing Postharvest Losses In the OIC Member Countries
92
Figure 12: Trends in cassava production in Nigeria and other top producing country from 1960 to 2013.
Source: Authors own analysis of FAO data.
Figure 13: Relationship between trends in cassava production and yield in Nigeria between 2000 and 2013.
Source: Authors own analysis of FAO data.
Cassava production has been increasing and is expected to increase as Nigeria’s population is expected to increase to 440 million in 2050 year from the current 182 million in 2015 ("World Population Prospects The 2012 Revision" (PDF). United Nations. Retrieved 6 September 2013.). The utilization of cassava in South-West Nigeria is illustrated in Table . This is related
0
10
20
30
40
50
60
Pro
du
ctio
n (
ton
nes
)
x 1
00
00
00
Nigeria Thailand
Indonesia Brazil
Democratic Republic of the Congo Angola
Ghana Mozambique
9
10
11
12
13
14
15
30
35
40
45
50
55
60
Yie
ld (
ton
nes
/Ha)
Pro
du
ctio
n (
mil
lio
n t
on
nes
)
Production (tonnes) Yield (Hg/Ha)

Reducing Postharvest Losses In the OIC Member Countries
93
to a characteristic of cassava in Nigeria in that it is primarily a food crop compared to that grown in Asia as a cash crop. An effect is that this maintains a higher price and demand for fresh roots. Table 45: Utilization of cassava roots for different products in South West Nigeria
Utilization Share (%) Fresh root use (t)
Own-consumption 20% 1,500,164
Gari 52% 3,900,426
Fufu 24% 1,800,197
Lafun 3% 240,026
Industrial, incl. dry chips and starch 1% 60,007
TOTAL 100% 7,500,820
In the light of Nigeria’s status as a cassava producer, postharvest losses of cassava and other crops are considered to be an important issue in Nigeria. The permanent secretary, Ministry of Agriculture and Rural Development, Mr. Sonny Echono, mentioned that postharvest losses have been estimated to range between 5 and 20% for grains, 20% for fish and as high as 50-60% for tubers, fruits and vegetable. While the focus of government policy is directed at horticultural crops the Nigerian government in partnership with the private sector is working to tackle issues of postharvest losses through the establishment of Staple Crops Processing Zones (SCPZ), and a number of export crops handling, preservation and conditioning centres. In the literature review, losses for cassava in Nigeria were reported as between 8% (Naziri et al 2014) and 25% (for gari; Oguntade 2013) while the FAO gave general figures of 50% which do not specifically refer to Nigeria. The economic cost varied from US$20 million (South West only) and US$900 million (EUR 686 million). The differences in the value of the economic losses reflects the differences in estimated physical losses, whether the authors are referring to the whole of Nigeria or part and differences in value attributed to cassava. 4.2.2. Assessment of Postharvest Physical Losses and Economic Burden Physical losses
There are few publications that focus on the analysis of postharvest losses of cassava in Nigeria. Of these publications, we refer to two publications being Naziri et al., 2014 and Oguntade 2013 which estimated physical losses and the stages in the value chain where these occur. Naziri et al., 2014 reported that physical losses in the value chain in South West Nigeria were estimated to be 7%. The greatest losses occurred during processing of gari and fufu at 5-8% physical losses due to delays in processing and account for 80% of all physical losses in the value chain. Other losses in the production of gari and fufu production for example were 1% at the farm, 1% during transport were estimated to be 1% and negligible during trading, transport and consumption of the finished product. For the farmers own-consumption the roots are harvested by the farmer and usually immediately processed and there were negligible losses in this case. Naziri et al, 2014 proposed a range of mitigation measures to reduce losses during postharvest processing and marketing which are listed as follows:

Reducing Postharvest Losses In the OIC Member Countries
94
Roots handled gently to minimize bruising and breaking of the skin during loading and off-loading along with appropriate supervision
Farmers associations collectively hiring vehicles for transportation Involvement of cassava processor and collector associations; especially women Processing cassava close to the farms to minimise handling and reduce delays Pack processed products in polyethylene packs where feasible to reduce losses and
shelf-life Availability of shelters in the open markets
Oguntade 2013 in a different study reported that cassava farmers in Nigeria indicated that the most significant losses occurred during harvest (4.95%), due to inappropriate harvesting technologies (machetes) and poor soil conditions (dry and stony). The main challenges for gari processors were that tubers were too small (5.8%) and too woody (4.1%), as these could not be peeled correctly and were thrown away. The main reasons for losses of gari were at the marketing level due to moisture (4.5%) and rodents (2.5%) during storage, whereas transportation accounts for around 2.5% of losses. Losses were negligible when gari was processed for home consumption at the farm level. Improved cassava peeling technology was suggested as a way to reduce postharvest physical losses. Losses during starch production (Oguntade 2013) was also reported. Starch production is a growing but till minor cassava product in Nigeria were also significant, amounting to nearly 12%. The most significant losses occurred during processing of tubers (5.5%) and during storage of starch (6.3%). Other losses reported by FAO tend to be higher at 50-60% and are not specific to any particular country of stages in the value chain. Economic losses
There are few publications that focus on the analysis of postharvest losses of cassava in Nigeria. Of these publications, we refer to two publications being Naziri et al., 2014 and Oguntade 2013 which estimated economic losses and the stages in the value chain where these occur. Naziri et al, 2014 reported that fresh roots were sold at a discounted price because they were either broken or partially spoiled. It was estimated that between 10% and 30% of roots suffer economic losses on farm due either to breakages during the harvest or quality decrease when delays in transport occurred. An additional 2% of roots incur economic losses, mainly due to breakages, during the transport to the gari and fufu processing sites. This meant that in the gari and fufu sub-chains around 20% of roots were sold at discounted prices. No economic losses are incurred by the own-consumption sub-value chain since the fresh roots are not traded. An indicative value of these losses for South-West Nigeria was estimated at over US$ 50 million per year, representing around 7% of the current retail value. Oguntade 2013 extrapolated physical losses to the whole of Nigeria indicates that they were significant in both, gari and starch value chains. The total sum of monetary losses of cassava at the farm gate and during processing, storage, transport and marketing amounted to EUR 686 million.

Reducing Postharvest Losses In the OIC Member Countries
95
4.2.3. Causes of Postharvest Losses
Naziri et al, 2014b reported on the causes and mitigation of losses for gari and fufu made from cassava in Nigeria (Table 46). It can be seen that there a variety of causes of losses at the on-farm, trading, transport and handling, processing and retail and consumption stages for both Gari and fufu, two main products produced from fresh cassava in Nigeria. The most important area of postharvest loss in the cassava sector in Nigeria was identified as harvest and processing. According to Naziri et al., 2014 there is no single measure that will reduce losses but rather a number or series of interventions which together will lead to reduced physical and economic losses. The most critical are locating the centre of processing close to the farm and processing fresh roots with minimal of time delays. Specifically, in a separate study, Oguntade 2013 reported that the main challenges for gari processors were that tubers were too small (5.8%) and too woody (4.1%), as these could not be peeled correctly and were thrown away. The main reasons for losses of gari were at the marketing level due to moisture (4.5%) and rodents (2.5%) during storage, whereas transportation accounts for around 2.5% of losses. Improved cassava peeling technology was suggested as a way to reduce postharvest physical losses.

Reducing Postharvest Losses In the OIC Member Countries
96
Table 46: Main causes, mitigation measures and extent of postharvest losses occurring along the different sub-value chains
Location Fresh root (own
consumption)
Gari Fufu
On-farm Causes of losses
Pests attack Diseases Excessive rains/floods during the rainy season During the dry season the hard soil structure causes breakage of the roots at harvest Poor handling
Pests attack Diseases Excessive rains/floods during the rainy season During the dry season the hard soil structure causes breakage of the roots at harvest High cost of transport and non-availability of vehicles at village level causing delays Poor handling
Pests attack Diseases Excessive rains/floods during the rainy season During the dry season the hard soil structure causes breakage of the roots at harvest High cost of transport and non-availability of vehicles at village level causing delays Poor handling
Mitigation measures
Planting of disease resistant varieties Main harvest during the rainy season when the soil is moist Roots harvested by the subsistence farmers themselves (careful harvesting) Roots harvested when immediate need of the household Roots handled gently to minimize bruising and breaking of the skin during harvesting
Planting of disease resistant varieties Main harvest during the rainy season when the soil is moist Most roots harvested by the subsistence farmers themselves (careful harvesting) Commercial farmers and traders hire experiences harvesters Farmers supervising harvesters Roots handled gently to minimize bruising and breaking of the skin during harvesting Delayed harvest if unavailability or immediate buyer Farmers associations collectively hiring vehicles for transportation
Planting of disease resistant varieties Main harvest during the rainy season when the soil is moist Most roots harvested by the subsistence farmers themselves (careful harvesting) Commercial farmers and traders hire experiences harvesters Farmers supervising harvesters Roots handled gently to minimize bruising and breaking of the skin during harvesting Delayed harvest if unavailability or immediate buyer Farmers associations collectively hiring vehicles for transportation
Extent of losses
Negligible physical losses No economic losses (everything used at household level)
Some physical losses (1%) Economic losses affecting 10% to 20% of roots
Some physical losses (1%) Economic losses affecting 10% to 20% of roots
Trading, transport and handling
Causes of losses
- Poor state of roads Delays in transport Poor handling
Poor state of roads Delays in transport Poor handling
Mitigation measures
- Roots handled gently to minimize bruising and breaking of the skin during loading and off-loading Supervision during loading and off-loading Farmers associations collectively hiring vehicles for transportation Vertical integration: some collectors are rural women
Roots handled gently to minimize bruising and breaking of the skin during loading and off-loading Supervision during loading and off-loading Farmers associations collectively hiring vehicles for transportation Vertical integration: some collectors are rural women involved in wet fufu processing Horizontal coordination: presence

Reducing Postharvest Losses In the OIC Member Countries
97
Location Fresh root (own
consumption)
Gari Fufu
involved in the gari processing Horizontal coordination: presence of women gari processor associations Processing close to FCR production area FCR transported over relatively short distances in comparison to processed products
of women fufu processor associations Processing close to FCR production area FCR transported over relatively short distances in comparison to processed products
Extent of losses
- Minimal physical losses of FCR (0.5%) During transport up to 2% breakage Broken FCR sold at discounted price
Minimal physical losses of FCR (0.5%) During transport up to 2% breakage Broken FCR sold at discounted price
Processing Causes of losses
- Poor state of roads Delays in transport
Poor state of roads Delays in transport
Mitigation measures
- Just in time procurement of FCR FCR processed as much as possible immediately after delivery Processing close to FCR production area Packaged in polypropylene packs
Just in time procurement of FCR FCR processed as much as possible immediately after delivery Processing close to FCR production area Packaged in polypropylene packs Recent development towards dry instant fufu sold in supermarkets (up to 6 month shelf life) but still marginal
Extent of losses
- Minimal physical losses of FCR (1%) Negligible losses of processed product
Minimal physical losses of FCR (1%) Negligible losses of processed product
Retail and consumption
Causes of losses
- Pests Lack of storage facilities Packs breakages
Pests Lack of storage facilities Packs breakages
Mitigation measures
- Packed in polyethylene packs Well packaged gari (up to 6 month shelf life) Availability of shelters in the open markets
Packed in polyethylene packs Recent development towards dry instant fufu sold in supermarkets (up to 6 month shelf life) but still marginal Availability of shelters in the open markets
Extent of losses
- Negligible losses of processed product
Negligible losses of processed product
Where: FCR = Fresh cassava root
4.2.4. Measures and Strategies Implemented for Postharvest Loss Reduction
Many of the causes of postharvest losses of cassava in Nigeria can be addressed through raising greater awareness of the level of losses and situations where they occur, the causes of the losses, well-known options and actions for addressing and reducing these losses (such as those shown in (Table 46), and changes to the enabling environment. Postharvest innovation systems are complex and dynamic, bringing many different activities, actors, sectors and goals together. Using an innovation systems perspective can help to examine technological and institutional change as a complex process of interactions among diverse actors engaged in
Reducing Postharvest Losses In the OIC Member Countries
98
generating, exchanging, and using knowledge, and the social and economic institutions that condition their actions and interactions (Spielman et al., 2008; Larsen et al., 2009). The innovation systems concept extends beyond the creation of knowledge to encompass factors affecting demand for and use of new and existing knowledge (Hall et al., 2004).
An Natural Resources Institute, University of Greenwich led EU FP7 Project (Gains from Losses of Root and Tuber Crops; GRATITUDE) deliverable report suggests ways that cassava losses can be turned into commercially viable business opportunities (Sergeant et al., 2015). At the time of publication viable business opportunities for turning cassava waste in Nigeria were not considered feasible but the situation may change in the short to medium term. Example opportunities included mushroom production from cassava peels and stems in Ghana, using High Quality Cassava Flour to access the gluten free market in Thailand and Asia and recovery from starch from waste pulp from starch factories in Thailand and Asia,.
4.2.5. Lessons Learned from the Case Study
There are a number of lessons from this case study
There are few published reports on losses and economic losses The published reports agree in some areas and disagree in others. This suggests a
need for common and standardised methodology A value chain approach is important since you can have the same crop in different
value chains leading to very different losses, especially economic ones Viable business opportunities for reducing waste or turning it into a product of value
need to be carefully considered before investing money Gender needs to be considered in waste reduction or waste opportunity solutions
4.3. Oilseeds and Pulses in Senegal
This was a desk based study and is based on available published literature.
4.3.1. Status and Importance
Groundnuts production used to dominate the agricultural sector and, indeed, the economy of Senegal. In the 1960-70s it accounted for over 80% of the country’s merchandise exports and employed more than 85% of the active population (Caswell 1985). Output however declined sharply and close to just about one-fifth of levels achieved in the past by 2002/03. By then export volumes were negligible. In response, the Government of Senegal launched an initiative to boost groundnuts production as part of its Great Agricultural Offensive for Food and Abundance (GOANA) programme in 2008. Since then the subsector has experienced a recovery, posting a rise to 669,000 tonnes in 2014/15 and further to 1,067,000 tonnes in 2015/16. This places Senegal second only to Nigeria (another OIC Member Country) in Africa and sixth in the global production league. Output is forecast by Government to rise to 1.1 million tonnes during the 2016/17 season.
Export of groundnuts has also resumed and, according to reports by the Global Agricultural Information Network (GAIN), the country exported a total of 340,000 tonnes of the nuts in 2015/16. The bulk of the exports went into China (about 65%) and another 33% to Vietnam. The remaining 2% was shared between other African countries including Egypt and Cote d’Ivoire as well as Asian countries such as Indonesia and Malaysia. Increased competition, especially among exporters, also drove up farmgate prices, well above the minimum fixed price

Reducing Postharvest Losses In the OIC Member Countries
99
of US$ 0.33 per kilogramme17. The average farmgate price was about US$ 0.53 – representing an increase of more than 60% over the price during the previous season.
This is important in meeting the pro-poor growth objectives of the Government because close to half of the population of 14.3 million live on incomes below the poverty line18. Though the contribution of agriculture to GDP is currently at 17.1%, the sector remains the largest employer of the active labour force (employs about 77% of the labour force). It is also the main source of livelihood for nearly 60% of the population who live in rural areas. Hence, removing the bottlenecks facing players in agriculture, and specifically the groundnuts value, will not only lead to improved growth prospects but will simultaneously help reduce the incidence of poverty. For this reason, the Government of Senegal is reported to be investing over US$ 50 million in the subsector. The funding covers supply of certified seed, fertiliser and other small farm equipment. The World Bank in 2016 also committed US$ 20 million to support producers. The target of both programmes is about 850,000 smallholder farmers.
4.3.2. Assessment of Postharvest Losses and Economic Burden
Official sources estimate quantitative postharvest losses in groundnuts at about 150,000 tonnes in the 2015/16 season – representing 14.1% of total output. This volume is just under half of the volume of groundnuts currently exported and 3.75 times the volume absorbed by the four major local groundnut processing companies. This implies, on one hand, that reducing quantitative losses by 27% will potentially double the supply of raw materials to the local processing industry and so ease pressure on Government to impose export restrictions which tend to destabilise the subsector.
Furthermore, based on the average farmgate price, we estimate the value of the quantitative losses at close to US$ 80 million – more than the total amount invested by the Government and the World Bank to boost production (i.e. US$ 73 million). If the 850,000 farmers targeted under the Government/World Bank projects were to be directly assisted to reduce the quantitative postharvest losses, then the gross per capita gain will be about US$ 94.06 which is about the estimated gross household income per hectare of groundnuts produced (this estimate is based on the reported average yield net of the average postharvest loss). Hence, investing in reduction of postharvest losses can make a difference not only to the farm households but can also boost scaling up of output (and probably job generation) in groundnuts-based industries in the country.
What is apparent, however, is that it is not only the quantitative losses which matter but also the potential quality-related losses. Evidence from a number of studies converge around the view that the scale of Aflatoxin contamination in Senegal and other African countries is very high. Imes (2011) cites studies by local research institutions which found levels of Aflatoxin contamination at as high as 85% of groundnuts products sampled in Senegal. This is consistent with similar levels in Togo and also in Ghana in West Africa (Anim-Somuah et al. 2013).
Weak standards enforcement regime a factor in high incidence of contaminants
Relevant quality standards are enforced only within the export chains, where prior to shipment exporters are required to obtain the following:
Certificate of origin issued by the Senegal Agency for Export Promotion. Confirmation of fumigation. Phytosanitary certificate issued by the National Plant Protection Office.
17 Reported in GAIN – 19th July 2016. 18 Estimated at 46.7 percent of the population in a World Bank Overview published on 21st April 2016.

Reducing Postharvest Losses In the OIC Member Countries
100
These standards are largely not enforced within the typical informal supply chain which is predominant in Senegal (Figure 14).
Source: Adapted from Nakhumwa (2015)
Figure 14: Typical groundnuts value chain in African producer country

Reducing Postharvest Losses In the OIC Member Countries
101
The local processing industry representing the formal segment of the domestic market for groundnuts and groundnut products is quite small. It absorbs less than 4% of the total volume of groundnuts produced in the country. The bulk of the crop – about 82%) – goes through the informal channel. Quite often the processors buy through agents who are linked to rural-based traders for whom volume traded is more important than quality. The chain also includes artisanal processors with operations similar to what is shown in Figure. These operators are highly unlikely to have the capacity to enforce quality standards at the point of procurement of groundnuts. Their products are also traded in informal markets where they are not subjected to controls by national standards authorities. There are similar scale-related capacity issues among microenterprises processing groundnuts for the local informal and unregulated confectionary groundnuts market. Due to these inherent features of the groundnuts supply chain, the contaminated nuts are not “sorted/graded” out, implying physical or quantitative loss. Furthermore, as the trade, especially in rural markets, is volume driven, no quality premium is paid for instance to farmers or traders marketing Aflatoxin-free nuts. Figure 15: Artisanal processors

Reducing Postharvest Losses In the OIC Member Countries
102
This situation persists despite evidence in the public domain about the health risks associated with Aflatoxin contamination. For instance, Gong and Cardwell (2002) reports that children with high levels of Aflatoxin are highly vulnerable to stunted growth, whilst Turner and Moore (2003) observed higher risk of chronic infection with hepatitis B virus. Imes (2011) also cites a notable case in Kenya in 2004 when 125 people died and another 317 became ill as a result of exposure to high levels of Aflatoxin.
4.3.3. Causes of Postharvest Losses
The quantity and quality losses which occur in groundnuts value chains at various stages are discussed below, include losses at the pre-harvest, during harvest, postharvest handling and processing. Pre-harvest: Limited access to quality seed can lead to increased vulnerability to pests and diseases which reduce yield (volume) and also affect the quality of the harvested crop (Nakhumwa 2015). Where production is dependent on rainfall, as is the case for most smallholder producers in Senegal, erratic rainfall at flowering stage can increase the risk of groundnut rosette disease (GRD) leading to significant yield loss. Postharvest: Poor harvesting methods as well as postharvest handling (including drying, storage, shelling, grading, packaging and transportation) can lead to significant losses, including especially quality-related losses. Competition for rural labour during the harvesting season may delay harvest or sometimes farmers leaving the harvested crop on the ground and exposed to the weather. New methods of forming heaps of the harvested nuts – for instance the Mandela Cock system – can improve drying and reduce risk of mycotoxin contamination. Storage also needs to occur in well-ventilated facilities to minimise spoilage. Using pallets can reduce moisture seepage, which can cause moulding. Storage facilities also need to be constructed in a way which minimises access to the nuts by rodents and birds. It is advisable that groundnuts are stored unshelled and only shelled prior to sale or processing. Manual shelling can be difficult especially when the nuts are well dried and some farmers reportedly moisten the pods to ease shelling – a process which encourages fungal growth and increases risk of Aflatoxin contamination (Nakhumwa 2015). If mechanical hand shellers are used then proper calibration is necessary to reduce breakage, which may lead to quality losses, even if the volume traded is not affected. Trading: To assure high throughput, some traders rush into villages to buy nuts early in the season when the groundnuts are not properly dried. This increases the risk of moulds and sharp increase in quality deterioration during storage (CYE Consult, 2009). In this case re-drying does not mitigate the risk of contamination. As mentioned above, the rural trade in groundnuts often does not entail payment of quality premium. Hence, farmers are usually not motivated to adopt pre- and postharvest handling systems which enhance quality. In addition, farmers tend to be suspicious about the reliability of scales used and therefore adopt practices to cheat which end up contaminating the nuts. This is usually done as a means of compensating tor perceived cheating by traders. 4.3.4. Measures and Strategies Implemented for Postharvest Loss Reduction Quotes from respondents interviewed in Senegal by Imes (2011) show that there is awareness of Aflatoxin (particularly moulds) and some of its potential health effects. However, some of

Reducing Postharvest Losses In the OIC Member Countries
103
them don’t practice what it takes to avoid, especially, quality losses, largely because “traders don’t separate the nuts” and don’t pay higher prices for quality nuts. This evidence from a rather small sample of respondents is consistent with evidence from a larger-scale study undertaken by Nakhumwa (2015). Hence, if the potential remedial actions outlined below are to be adopted then market incentives need to be right. 4.3.5. Lessons Learned from the Case Study
Technical guidelines on pre and postharvest actions and technologies to reduce losses (quantity and quality) are available. To foster adoption we propose the following:
Training of farmers as well as traders and micro/small-scale processors on measures to minimise losses, including the implications of disease-causing contaminants.
This should be linked to measures to promote structured marketing systems which ensure that the supply chain, especially those linked to exporters and large-scale processors, is shortened and result in tangible revenue gains for producers. Such a marketing system should offer quantifiable premiums to producers and traders complying with stipulated quality standards.
Easing access to finance for pre-harvest activities as well as at the postharvest level is likely to assuage the liquidity pressures which compels farm households to sell without complying with the recommended actions. This will also enhance the capacity of farmers and other SMEs to adopt the technologies needed to minimise losses and improve product quality.
Policy support for the market development initiatives briefly indicated above will be required, especially in enforcing standards within the domestic processing industry. However, this may require significant political will as the fear of causing public panic often discourages political actions being initiated.
4.4. Tomatoes in Bangladesh
4.4.1. Status and Importance
Tomatoes are one of the most important and popular vegetables in Bangladesh, ranking fourth in respect of production and third in respect of area (Hossain and Abdulla, 2015). In 2013, Bangladesh produced 251,000 tonnes of tomatoes (down from 155,430 tonnes in 2012, see table 1) (FAOSTAT) with a value of approximately US$ 156 million (USAID, 2014). Bangladesh is the third largest tomato producer in South Asia. From 2004 to 2012, tomato production increased at an average rate of approximately 11% per year, the highest in this area. According to the Department of Agricultural Extension, tomato cultivation has increased five to six times during the last 15 to 20 years. The area under tomatoes is estimated at 26,000 hectares and the average yield at 9.5 tonnes. Table 47 gives overall figures for production, area, yields and imports.

Reducing Postharvest Losses In the OIC Member Countries
104
Table 47: Tomato production, yields and imports, Bangladesh 2009-2013 2009 2010 2011 2012 2013
Production Tonnes (t)
150,720 190,213 232,459 255,430 251,000
Yield (t/ha) 7.38 7.99 9.38 9.97 9.54
Imports (t) 17,004 19,727 23,330 8,800* 21,209
Imports as % of production
11 10 10 3 8
Imports US$ million
3.9 5.0 9.3 2.4 6.1
* Unofficial figure Source: FAOSTAT production data
The main producing areas are Rangpur, Rajshahi, Bogra, Comilla, Chittagong, Norshingdi and Jessore districts (Alam et al., 2015). Godargari Upazila in Rajshahi district in the north is accredited for producing two-thirds of the country’s production. However, tomato production is widespread throughout the country.
Tomatoes are traditionally grown as a winter crop, from November to March, following the main aman rice crop but high demand and prices, in the summer months have encouraged the development and planting of summer varieties which command a much higher price. Supply of tomatoes in the hot, humid months from April to September was previously met entirely by imports from India and elsewhere, amounting to around 10% of production and an import cost of nearly US$30 million over the past five years. Summer tomatoes have to be grown under protective plastic polytunnels to protect the plants from the heavy monsoon rain. They also have to be irrigated. Summer tomato production requires specific varieties, several of which have been developed by BARI with material from the AVRDC. A third production method is known as the dyke system where tomatoes are grown as on the dykes between fish ponds in the southern parts of the country (USAID, 2014) in an integrated production system. Farmers use the silt and nutrient-rich water from the ponds to fertilise the tomato plants, which reduces or eliminates the need for purchased fertiliser. Dyke tomatoes mature earlier than winter tomatoes and are marketed when prices are higher. They also need some form of protection against monsoon rains.
Tomatoes has become a major cash crop and a good income earner for farmers although crops are subject to disease which can lead to huge field losses and to gluts which can result in dumping of unsold or unmarketable produce. Although there are several companies producing and selling hybrid seeds, seed quality is often mentioned by farmers as a significant factor in low yields and pre-harvest losses. Local seed companies have developed varieties that are resistant to bacterial wilt and viruses and with longer shelf life. Fresh tomatoes last for three to four days without preservation, such as cold storage. Early-yielding varieties are preferred by farmers, to gain the price advantage at the start of the season. Ripening agents, such as ethephon, are used to spray harvested immature green tomatoes to hasten ripening and gain early market advantage. Research has indicated (Moniruzzaman et al., 2015) that the use of such chemicals can shorten subsequent shelf life. Fresh tomato consumption increased at 13% per year between 2005 and 2012 (USAID, 2014:102). Tomatoes are an essential ingredient in Bengali curry dishes and are increasingly consumed fresh in salads. Tomatoes are rich in vitamin C, vitamin A, vitamin B6, vitamin K, vitamin E, biotin, and molybdenum; provide potassium, iron, and fibre and contain lycopene, an antioxidant.

Reducing Postharvest Losses In the OIC Member Countries
105
The share of processed tomatoes has been estimated at 5% of total production according to a USAID value chain study (USAID, 2014) although some stakeholders interviewed for this case study felt that this was likely to be higher. The USAID study found this to be the fastest growing market segment, with growth around 30% per year. Tomatoes are mainly processed into tomato paste, sauces and ketchup. Tomato paste is an intermediate product used to make tomato sauces and ketchup. Tomato paste processors procure fresh tomatoes, often via contract farming arrangements, and sell tomato paste to sauce manufacturing companies. PRAN Ltd, the largest food processor, has some 1,000 contact tomato growers in Rajshahi from which it purchases tomatoes, although it also buys on the local market, and a tomato processing plant in Natore district, two to three hours’ drive from the tomato growing areas. Other processors have contract farming arrangements in which seed, fertiliser and specialist extension services are provided to farmers.
Several tomato varieties, more suited to processing having thicker skins, less easily damaged and taking on a red colour quickly, are available. These include Syngenta’s Shobol variety. PRAN contract growers grow Mintu Super, a Lal Teer seed company variety and Salamat, a variety supplied by Energy Pac Agro Ltd, another Bangladesh seed and agro-product supply company. Both varieties have a longer shelf life and are high yielding. 4.4.2. Assessment of Postharvest Losses & Economic Burden
A number of studies of postharvest losses have been attempted in the past decade. Prior to that it was noted (Hassan et al., 2010:118) that “Reliable data on the magnitude of postharvest losses fruits and vegetables in Bangladesh are meagre”. However, tomato postharvest losses are considered the highest of any fruit or vegetable by the Hortex Foundation (government organisation responsible for promotion and development of high value fresh and processed agricultural products). The results (Table 48) show some variation in losses and the methodology used in most of the references are not clearly laid out. Only two reports attempt to add a monetary value to the losses and these are based on data in 2008 and 2009-10. In 2008, Hassan et al. (2010) estimated a Tk605 million at an average farm gate price (based on 75 farmers) and Tk780 million at an average retail price, based on 100 retail traders. These values equate to around US$9 million at the farm gate price and US$11.6 million at the retail price. In 2009-10, Khatun et al. (2014) estimated the national economic loss at Tk523 million, which equate to around US$7.7 million.

Reducing Postharvest Losses In the OIC Member Countries
106
Table 48: Summary of percentage volume and value of tomato losses, 2008 – 2014, Bangladesh
Dates Organisations Findings on quantities lost 2010 BAU paper
Akhter, R. Postharvest (PH) loss for farmers (n=75) was between 4.5% and 22%; average was 11.27%.
2010 BAU MSc thesis Uddin, M. J.
Average PH loss was 36.4%. 13% was lost due to grading and transportation to local market; 4.5% lost in storage by assembly traders; 10.8% lost due to long transport, packaging, handling and storage at wholesaler; 8.1% was lost at city/district market retailers and 1.35% to tomato ketchup industry.
2010 BAU, FAO Hassan et al.
Estimates of PH losses were: Farmers (n=75) 6.9%; Assembly traders (n=75) 9.1%; wholesalers (n=100) 8% and Retailers (n=100) 8.9%. Total = 32.9% Total value lost in 2008 was Tk605 million at farm price and Tk 780 million at retail price.
2014 BARI Khatun et al.
Average PH losses estimated at 15.37% for farmers (n=90) and 10% for traders (n=90). Monetary loss for farmers’ level was estimated at Tk78,540 per hectare. At national level monetary loss was estimated at Tk523 million during 2009-10
2014 USAID Postharvest losses at farm level estimated at 30-40% with a further 10% loss from farm-gate to local market. An additional 20% loss occurs when produce travels from regional/local market to national market.
2016 FAO/BARI 2.6% of tomatoes unmarketable after 5 days (brought from Bogra to Gazipur wholesale market)
The issue of crop loss is significant not only at national level but for individual farmers who have invested large amounts in the hope of making good returns. Investing in production and marketing of perishable produce is a high risk activity. The impact of this loss is summarised by USAID (2014:123) as “reducing returns to actors at all levels of the value chain as well as detracting from overall value and pushing all actors in the value chain to adjust prices downward in anticipation of losses”. It also means that consumer prices are higher than they could be. However, the studies did not consider what happened to the ‘lost’ produce and the wastage may actually have an economic use. Farmers are often unaware of their costs of production and may refuse to sell their produce if the price falls below a certain level rather than maximise their profits by selling as much as they can, even at a lower price. Quality lost and value of that quality
The study by Hassan et al. (2010) highlights postharvest quality and produce safety as important concerns for consumers. They found that little previous work on this subject and highlighted the need for assessment of nutritional quality loss due to its important for nutritional food security. Their work indicated that vitamin C, being unstable, degrades due to oxidation and that the time between harvest and consumption should be minimised. No monetary value was given for the value of lost quality but the authors highlight its importance for national nutritional security policy. This is particularly significant in a country where considerable numbers of people depend on the starchy staple rice and where there is poor consumption of nutrient-rich foods such as fruits and vegetables fruit and vegetables (considerably below WHO/FAO recommended levels) (Arsenault et al., 2103). An environmental cost of postharvest losses was mentioned by Practical Action, of incidences of where gluts and significant price drops have led to rotting tomatoes being dumped into rivers.

Reducing Postharvest Losses In the OIC Member Countries
107
4.4.3. Causes of Postharvest Losses
The chief causes of postharvest losses were attributed to poor packaging methods and transport of tomatoes, particularly from distant production areas to the main wholesale markets in Dhaka. However, harvesting methods on-farm also contributory factors. According to Ahmed (2013), tomatoes are harvested at any time of the day and removal of field heat is rarely practiced; farmers’ knowledge of maturity indices is inadequate - immature and over mature produce are harvested; produce is often piled in heaps which causes bruising. Sorting is done to remove damaged and disease/insect infested produce based on visual observation. Grading is based on size but most produce is not graded. Washing is seldom practiced and there is no regard for water quality. Use of packaging materials such as bamboo baskets, jute bags and plastic sacks cause high losses due to squashing of the produce. Damage by rats to harvested tomatoes were mentioned as a cause of loss (Rokeya Begum Shefali, Aid Comilla, pers.com). Tomatoes are head loaded, carried on bicycles or motorbikes or in rickshaws from the fields to farmers’ houses or to the local markets for selling. Tomatoes bought from the villages are piled up in markets in the production areas, then loaded in bulk onto trucks for traveling to city/district markets hundreds of kilometres away. Produce is unloaded without care at the destination. These different modes of packaging and transportation exposed the tomatoes. According to Hassan et al. (2010) the main reasons for losses are physiological and biochemical processes, microbial decay, high perishability and sub-standard postharvest handling infrastructure. Improved pre- and postharvest practices noted for the higher value summer tomatoes by growers and traders were observed. Companies buying tomatoes for processing try to manage the risk of postharvest loss using strict specifications for their contract farmers and by providing training on harvesting time and methods, postharvest handling including sorting and grading. Farmers receive two-three taka more per kilogram than the market price but bear any postharvest losses or produce of unacceptable quality. PRAN Ltd, the largest processor, provides plastic crates to farmers for harvesting and transport of tomatoes. Political disputes also contribute to postharvest losses. In 2015, transport was disrupted due to strikes (Hartal) and civil disobedience and traders and transporters were deterred from travelling to the tomato production areas to buy produce. This resulted in considerable losses of tomatoes (Dhaka Tribune 19.1.15). 4.4.4. Measures and Strategies Implemented for Postharvest Loss Reduction
Researchers and practitioners involved in postharvest activities and produce marketing suggest and promote a number of improved preharvest practices, such as correct maturity, bird scaring, staking of tomato plants, as well as a range of improved postharvest practices of which the use of plastic crates, from the field to the retail market, is particularly encouraged (Table 49).

Reducing Postharvest Losses In the OIC Member Countries
108
Table 49: Improved postharvest projects and practices for tomatoes in Bangladesh Date Organisation Report title Location and type of
training Recommended
practices 2014-16 FAO Food Safety
project Hortex Foundation
- 5 tomato producing Upazilas
-
2015 Bangladesh Agricultural Research Council (BARC)
A manual on postharvest handling of tomatoes
N/A Includes advice on harvesting and handling Recommends use of ripening agents
2015 USAID/FTF (UC Davis Postharvest Technology Centre
Feed the Future Agricultural Value Chains program
1-week training for 30 trainers, consultants, and other industry leaders in agriculture and food companies who wanted to learn how to reduce food losses and improve food quality across the value chain
Grading Water loss Packaging – use of plastic crates Cooling (use of Cool Bot cooling system) Solar drying Needs-based extension
2016 AVRDC /USAID Postharvest Program
Establishing and managing smallholder vegetable packhouses to link farms and markets
Mymensingh Solar drying; processing
Good harvesting practice; processing of gluts
2016 FAO (Regional project) with BARI Dr Elda Esguerela, UPLB; Dr Atique Rahman and Dr Madan Gopal Saha, BARI
Postharvest losses on tomatoes and mangoes
Bogra district Value chain loss assessment and training to farmers and traders on reducing losses
Big losses of tomatoes (squashing leading to rotting) due to use of jute bags for transport. Recommended use of plastic creates by farmers, sorting; spreading planting and use of early maturing varieties
One stakeholder attributed the problem of postharvest losses to the focus of the Department of Agricultural Extension (DAE) on increasing production: “We [DAE] imparted training and provided advices to the farmers and supplied necessary agro-inputs timely which played a vital role in increasing the production” (The Daily Observer, 19.11.2015) but not giving enough attention to postharvest aspects, food safety and marketing. The Department of Agricultural Marketing (DAM) has worked on getting policy makers recognise the role of marketing but the department is very poorly staffed and price data collection, published online every day, is its main function. This information is not very accessible to farmers but it is used by traders. To address this the DAM has a pilot project to install electronic display boards at 3three to four major markets (there are 13,000 markets in the country). Group marketing is being promoted and there are now some 2,000 farmer marketing groups often supported by projects though principles of groups marketing and appreciation of the benefits are not always understood. The DAM lacks coordination with the DAE (although they sit in the same building) but the ideal solution would be for the two departments together so that agronomic advice is provided hand-in-hand with postharvest and marketing advice, including calculation of production costs and prices. Ideally these services would be available at Upazila level. The DAM is developing produce collection centres which combine assembly points with marketing infrastructure and cold storage.

Reducing Postharvest Losses In the OIC Member Countries
109
4.4.5. Lessons Learned from the Case Study
A key challenge to overcome is the lack of concern about postharvest losses and awareness of improved postharvest technologies. Farmers and traders are either unaware of the causes of losses or have no economic incentive to upgrade their practices. Postharvest experts from BARI indicated that farmers are unwilling to adopt improved practices unless they receive a price premium. The much higher prices received for summer tomatoes and the much lower losses achieved indicates that farmers are willing to adopt new practices if a better return can be achieved. There is indication from talking to researchers that traders and farmers are now encouraged to use plastic crates instead of baskets and jute bags. The growing market demand for safe, organic food produced following good agricultural practice, is another indication that people are willing to pay more for premium produce. What is needed is support for bringing together actors and stakeholders to encourage needs-based research and extension. Production and commerce come under two separate ministries. The Department of Agricultural Extension does not provide sufficient attention to postharvest issues and marketing. Support to innovation platforms and uptake of good agricultural practice and linking actors along the tomato value chain is an area that is not well covered by other projects and is an area that the OIC involvement could bring about a significant impact. The Department of Agricultural Marketing is under-resourced but could be a useful player in translating market needs into practical projects to facilitate marketing, reduce losses and improve returns to producers.
4.5. Meat and Meat Products in Oman 4.5.1. Status and Importance
Oman is a relatively wealthy state, so its food security is not threatened by postharvest losses. The Government of Oman is dedicated to achieving greater food self-sufficiency with relatively limited water resources and to arrest the decline in farming economies caused by failure to recruit younger farmers (Min. of Agriculture, 2011, p15). Livestock keeping has great social worth in Oman with animal values within society often outweighing simple economic parameters. This is especially true of camels, but can also be said of local goat breeds. The Omani agricultural economy is highly distorted by a number of measures designed to promote stable domestic food prices. For example, certain services are provided free or at below market prices, inputs such as animal feeds are price controlled, and consumer prices have been fixed since 2008. This has two major effects: it discourages investment in the local agricultural economy, and, to some extent, it may be driving certain parts of the economy (e.g., sale of hard-to-get goat species at period of high demand) into the informal economic space. Animal production in Oman is strongly limited by the availability of water. This creates a ceiling for total production because of the very high cost of importing fodder and animal feed. Domestic production of red meat is supplemented by imports of live animals and chilled/frozen meat products. Oman is an important source of demand for oxen, sheep and goats from Somalia (a term largely used in Oman to describe any animal that originates in Djibouti, Kenya, Ethiopia, Eritrea, Kenya – the actual origin is usually unknown). Much of this trade is informal (Anteneh B, et al, 2010). A separate sector of the livestock economy is

Reducing Postharvest Losses In the OIC Member Countries
110
engaged in importing live animals for fattening and sale domestically of for export within the members of the Gulf Cooperation Council (GCC) Free Trade Area19. A secondary supply source are large scale live cattle, sheep and goat shipments from Australia, New Zealand and Southern Africa. The third main live animal supplier is Iran who supply Oman with sheep and goats across the Straits of Hormuz. Frozen meat enters Oman from all the major meat producing regions including: Brazil, India, Pakistan, Australia and New Zealand. Farms are typically small and farming fragmented. Absentee farm management is common with a heavy reliance on expatriate farm workers in the livestock sector. The types of livestock farming system predominate: nomadic herding of camels and goats, transhumanant grazing of cattle, camels and goats, and, sedentary intensive and semi-intensive production of livestock, often combined with milk production (Table 50). Table 50: Oman live animal stock 2010-14
Head 2010 2011 2012 2013 2014 Camels 129,560 132,200 134,800 242,833 250,000
Sheep 388,590 396,400 404,000 548,231 410,000
Goats 1,719,120 1,753,500 1,788,600 2,085,206 2,100,000
Cattle 332,780 339,500 346,000 359,500 365,000
Source: FAOSTAT and Min. of Agriculture, Oman
In 2012, Oman produced 31,723mt of red meat domestically and imported 30,600mt of red meat equivalent on the hoof plus 20,617mt of red meat chilled or frozen. There were no red meat exports, so the total red meat imports were 82,940mt. Off-take from the domestic Omani animal herd is hard to assess and figures not readily available. In smallholder pastoral and transhumance farming systems off-take is often note considered and there is much debate about how this is calculated and what to include (Enkono S et al 2014, p202). For example, ceremonial and cultural exchange of animals is often missed in total calculations. Nb: livestock keeping and all aspects of livestock marketing are a male preserve where women are largely excluded. 4.5.2. Assessment of Postharvest Losses and Economic Burden
Postharvest practices in Oman The red meat value chain in Oman is divided between live (imported and domestic production) and the import of chilled and frozen carcasses and cuts. This second element represents about 30% of consumption. Frozen and chilled meat is imported from a range of sources at international standards and losses are reported to be unexceptional. Losses in the domestic animal production and consumption are unknown. Interviewees for this case study reported that anything between 85-90% of all animals produced domestically
19 The GCC was founded in 1981 and its membership includes: Gahrain, Kuwait, Oman, Qatar, Saudi Arabia and the United Arab Emirates.

Reducing Postharvest Losses In the OIC Member Countries
111
are slaughtered within the homestead. For these animals, the skins, head, feet, offal and blood are largely unused. In cities, this material is collected as municipal waste. In rural areas less in known about its destination. Oman imports a large number of live animals which are either re-exported, sold for consumption domestically or fattened by specialist and sold to domestic consumers. For these animals, the so-called 5th quarter is also not used. Live imports into Oman follow domestic animal quarantine rules (3 days). In the case of animals from ‘Somalia’, they have also been quarantined for 21 days at source. It was reported that mortality between quarantine and sale was low (1-2%). Mortality higher up the chain (e.g. between Ethiopia and Somalia) is unknown, but probably higher. Where animals are fattened or fed domestically, feed conversion and food safety were considered to be possible sources of loss, but no respondents were prepared to speculate on how great this might be. The same can be said of domestic livestock and meat market distortions, which undoubtedly result in a transfer of value along the chain, but how great this might be is not currently of interest to the Government of Oman. The processes and key loss points are summarised in Figure . Figure 16: The Oman red meat value chain and postharvest practices
Source: interviews

Reducing Postharvest Losses In the OIC Member Countries
112
Postharvest losses along the livestock value chain in Oman quickly add up to a substantial figure (see Table 51). Under-use of the ‘5th quarter’ and poor feed conversion leading are the key causes of loss. However, several losses are unmeasured, particularly those that involve sub-optimal use of resources.
Table 51: Summary of volume and value of losses by country Types of loss
identified Production
(Mt red meat
equivalent)
(1)
Loss estimate
(%)
(2)
Proportion of
production effected
(%)
(3)
Estimated Volume
(Mt meat equivalent)
(5)
Estimated Value (US$)
(6)
Notes
Quantitative In-chain mortality
62,323 2 100 1,246 623,000 May be higher for certain live imports
Low off-take 31,723 5 80 1,269 634,500 Domestic production only
Under-use of by-products (offal, blood, skin, hides etc.)
62,323 25 100 15,581 7,790,500 -
Qualitative Poor feed conversion
62,323 20 100 12,465 6,232,500 Assumes imported animal fattened
Feed safety/quality
Unknown – not estimated -
Others Market distortions (government policies)
Unknown – not estimated -
Total estimated financial loss
- - - - 15,280500 -
Total herd value
62,323 - - - 31,161,500 -
Percentage physical loss (%)
- 25-40% - - - -
Percentage economics loss (US$)
- - - - 49% -
Notes: (1) From total red meat production plus live imports (3) Proportion effected from case study interviews (5) A notional US$ 500 per Mt has been assumed for all meat based on a rough average of global wholesale prices (see for example www.meatinfo.co.uk)

Reducing Postharvest Losses In the OIC Member Countries
113
While these figures need to be treated with some caution due the potential for error and double counting of losses along the chain (and under-valuation of social or external benefits), the results are rather stark.
4.5.3. Causes of Postharvest Losses
According to economic orthodoxy, market distortions caused by subsidy lead sub-optimal resource allocation, and therefore represent a potential postharvest loss. Oman has controlled and fixed consumer prices for meat since 2008 and this has made farming less profitable and caused losses (and company failures) in the animal feed sector. The scale of this loss and who incurs it in the livestock sector are currently unknown. Figure shows example of the meat sector taken in Oman during the field visit. High proportion of all animals slaughtered within the household (estimates are 85-90%). This leads to waste (of offal and skins for example), environmental cost, and health hazards. Oman has no marketing standards for animal sales – price and quality are agreed by negotiation. Animals are not weighed. Domestically produced animals are under-supplied to the market, so this is a sellers’ market and quality is not always the most important issue for the consumer. The absence of standards and the means to judge animal weight at the point of sale means that trade is a factor of the negotiating skills of each actor. It is a matter of speculation that consumers are likely to be least empowered under these market conditions as they are conducting fewer transactions that in-chain actors such as traders. Halal production has some challenges at scale. It is hard to say whether this is a loss (e.g., through the additional labour cost and relative inefficiency of large scale processing) or not. Imported animals (goats, sheep and bulls) go through a complex chain, and have to be moved from one form of transport to another up to seven times with subsequent losses (mortality) through stress. In most slaughterhouses, by-products are underutilised. Skins and hides are exported salted, for example. The loss of value to the economy could be substantial. There is for all practical purposes, no farmer, agent or manufacturer coordination in the Oman livestock sector. Under-feeding. Due to the climatic conditions, Oman has insufficient pasture to feed its livestock population and has to import fodder and feed. Feed is expensive, and its use not particularly well understood or valued. Attaining minimum conformity for marketing is the primary aim of the majority of farmers. For this reason, a high proportion of animals are under prepared at time of sale. The absence of a sale by weight systems or quality standards means that this is not penalised. Low off-take rates. It is also common to find animals being fed maintenance ration long after they have reached optimum weight, thus wasting feed resources. The sub-optimality of the production system causes losses of both types. Under-feeding losses tend to be incurred down the chain in terms of the efficient conversion of animals to meat. Low off-take losses are the revers, being incurred by farmers or fattening businesses and gained by meat processors as a premium.

Reducing Postharvest Losses In the OIC Member Countries
114
Feed losses. Extreme aridity in Oman causes drying of feed ingredients and feed stock in-store. Feed purchased at 12% moisture can quickly lose weight. Feed storage losses also occur, but are unmeasured. Feed quality. Food safety, additives, toxins etc. The Omani feed industry is not strictly regulated. Levels of toxins such as aflatoxin or pesticide residue are not known. Addition of anti-biotics is common practice and largely unregulated. The degree to which this constrains production or impact on animal or human health is unclear. 4.5.4. Measures and Strategies Implemented for Postharvest Loss Reduction
The single most important area of postharvest loss in the Omani red meat sector is through domestic slaughter. By promoting use of 5th quarter and valorisation of hides and skins, Oman could reduce waste, raise public health standards and add value to existing production (and imports). Very little is known or understood about postharvest losses in Oman, particularly in the strategic livestock sector. Currently, postharvest losses are not included strategic plans for the agricultural sector. Increase awareness of postharvest losses at government, private sector and farmer levels through research, awareness and supporting pilot innovations would be very worthwhile. Oman would benefit from quantification of its key postharvest losses in the livestock sector. With more detailed data, new policies could be set to encourage behaviour change at key value chain loci. 4.5.5. Lessons Learned from the Case Study
Sale at optimal weight, condition and market price is a difficult challenge for Omani farmers and one that they are currently not particularly interested in due to price fixing and the sub-economic scale of production (many farmers are part-time) It was noticeable that nobody in Oman could agree who should take responsibility for postharvest losses. This highlights the finding that successfully identifying and tackling postharvest losses requires multi-agency coordination. The concept of postharvest losses in the livestock sector is a hard one to explain. With the exception of mortality, most of the cost of postharvest loss is subsumed into the final consumer price. As this is fixed in Oman, losses are all born by the farmer or chain actor. Great education of policy makers and promotion of research into the area would help.

Reducing Postharvest Losses In the OIC Member Countries
115
Figure 17: Meat sector in Oman
Omani supermarket manager shows meat waste record for product past its shelf-life
Oxen imported from Somalia in quarantine at the port of Salalah.
Somali goats – retail Al Musnaah Iranian goats – retail Al Musnaah
Source: Ben Bennett - photos

Reducing Postharvest Losses In the OIC Member Countries
116
4.6. Milk and Dairy Products in Uganda This was a desk based study and is based on available published literature. 4.6.1. Status and Importance
Agriculture is the main stay of Uganda’s economy, however, the share of agriculture in the national Gross Domestic Product (GDP) has been steadily declining. Agricultural sector activities which include cash crops, food crops, livestock, forestry and fishing contributed 22.2% of total GDP at current prices in the fiscal year 2013/14 compared to 22.5% in 2012/13. The livestock subsector contributed 1.8% to total GDP at current prices, in the fiscal year 2013/14. Value added for livestock grew by 3.3% in 2013/14 compared to 3.4% growth in 2012/13 (UBOS, 2014). The dairy industry is estimated to contribute more than 50% of the total output from the livestock sub-sector (Balikowa, 2011). According to Balikowa (ibid), the total volume of milk processed into value added products is only approximately 12.7% of the total marketed milk estimated at 1.92 million litres per day in 2010. The total installed capacity of the 14 operational milk processing plants20 and mini dairies is 618,000 litres per day and their average daily milk intake is 244,660 litres, equivalent to 40% of their total installed capacity. The same source (Balikowa, ibid) states that a total of 86,647 litres/day equivalent to 35.4% of the daily milk intake goes into production of pasteurized milk; 59,136 litres/day (24.2%) goes into UHT. Thus, a total of 145,783 L/day, equivalent to 59.6% of the total milk intake goes into production of liquid milk (pasteurized milk and UHT); An average of 83,558 litres/day (34.2%) is processed into SMP and Whole Milk Powder in the ratio of 2:8, while only 15,319 litres per day (6.3%) is processed into other value added products such as: yogurt, 11,519 litres/day (4.7%); cheese, about 2,000 litres/day (0.8%) and ice cream, 1,800 L/day (0.7%). Table provides a break-down of the production of dairy products in Uganda according to FAO Statistics (FAOSTAT, 2012). Table 52: Production of dairy products in Uganda
Product Quantity (tonnes) Milk, whole fresh cow 1,207,500
Butter, cow milk 316
Milk, whole condensed 6
Source: FAOSTAT 2012
The Dairy Master Plan which was adopted in 1993 was the main document guiding development of Uganda’s dairy industry. Some of the major implementations that have been carried out based on recommendations of the Dairy Master Plan include liberalization of the dairy industry, restructuring and commercialisation of the state owned dairy processing company, and establishment of a Dairy Board. The Dairy Industry Act, 1998 provided the legal framework for implementing recommendations of the Dairy Master Plan, including establishing Dairy Development Authority (DDA) as a semi-autonomous statutory body mandated to develop and regulate Uganda’s dairy industry (Balikowa, 2011). The DDA was
20 Given that this data is based on information available in 2010, it is likely that changes have taken place in the meantime. Developments in the Ugandan dairy market following liberalisation of the industry have had an impact on the milk production systems including an increasing intensification and market orientation.

Reducing Postharvest Losses In the OIC Member Countries
117
established under the Dairy Industry Act (2000) with the objectives to provide coordination and implementation of all government policies which are designed to achieve and maintain self-sufficiency in the production of milk in Uganda by promoting production and competition in the dairy industry and monitoring the market for milk and dairy products.21 Cattle are the major source of milk in Uganda, whilst the supply from other animals is insignificant (e.g. dairy goats). The size of the national cattle herd was estimated at 11.4 million in 2008 and had been growing steadily from approximately 4.2 million head of cattle in 1986 (Balikowa, 2011). The number of milked cows was estimated at about 1.5 million cows with an average milked yield per cow of 8.5 litres per week, which reflects the dominance of indigenous breeds in the dairy herd (Table). Table 53: Uganda dairy herd indicators
Region Number of milked cows
Milked cows as a % of all adult cows
Average milked
yield per milked cow per
week (litres)
Proportion of
milk production
sold
Average price (UGX)
Central 376,080 34.2% 9.8 39.1% 428
Eastern 310,480 33.9% 7.3 35.8% 459
Northern 158,540 25.7% 5.2 42.4% 517
Western 413,300 35.6% 9.7 42.7% 355
Karamoja 261,190 31.1% 7.8 6.4% 540
Total 1,519,590 32.8% 8.5 34.7% 442
Source: Balikowa (2011), based on MAAIF/UBOS, 2009
Milk production in Ugandan is dominated by smallholder producers who own over 90% of the national herd and produce the bulk of the milk in the country. The milk chain is show in Figure Indigenous cattle are still the majority of the herd (estimated at over 60% of the herd). The average herd size in Uganda is 6.9 heads of cattle per cattle owning household (Balikowa, 2011). About 65% of the milk produced in the country is marketed, which is based on FAO data and higher than the figure in Table. The remaining milk is either consumed by the family, fed to calves, offered as gift, processed into traditional dairy products for home consumption or wasted due to spoilage. According to slightly out-of-date data FAO estimate that 900 million litres of milk are produced per annum in Uganda, of which 585 million litres are marketed and the amount of marketed milk lost is 123 million litres (i.e. 21% of milk marketed). The value of these losses corresponds to USD 23 million (worth USD 0.187 per litre).22 According to FAOSTAT, in 2012 Uganda produced 1,207,500 tonnes of whole fresh cow milk and 316 tonnes of butter (from cow’s milk). An article in April 2015 in the NewVision newspaper states that milk production in Uganda was about 2 billion litres in 2015.23 Balikowa
21
http://www.agriculture.go.ug/Agencies/46; http://www.dda.or.ug/mission.html; (accessed, 28-04-2016) 22 http://www.fao.org/ag/ags/postharvest-management/milk-dairy/milk-and-dairy-products-postharvest-losses-and-food-safety-in-sub-saharan-africa-and-the-near-east-pfl/en/ (accessed, 28-04-2016). 23 Source: http://www.newvision.co.ug/new_vision/news/1324189/vendors-selling-adulterated-milk-rwamirama, newspaper article appeared on 15 April 2015.

Reducing Postharvest Losses In the OIC Member Countries
118
(2011) has calculated that the total milk production of Uganda for 2010 was 1.08 billion litres and the annual growth rate 4.9%. This growth in milk production has aided a rise in Uganda's earnings from export of milk and dairy products from $20m in 2012 to $28m in 2014 (NewVision article of 15 April 2015). As for milk consumption, the aforementioned newspaper article states that Uganda's per capita consumption of milk has grown from 46litres in 2013 to 60litres in April 2015, a figure which still leaves the country 140 litres below the 200 litres recommended by the World Health Organisation (WHO). According to the newspaper article, the Minister of State for Agriculture, Animal Industry, and Fisheries cites malnutrition in children, weak bones in adults, dental diseases and protein deficiency as some of the implications of low consumption of milk on the health of Ugandans. Growing consumption of dairy and other livestock products brings nutritional benefits, in that milk contains numerous nutrients and it makes a significant contribution to meeting the body’s needs for calcium, magnesium, selenium, riboflavin, vitamin B12 and pantothenic acid (vitamin B5) (FAO, 2013, Page 5). Milk is a major source of dietary energy, protein and fat, contributing on average 134 kcal of energy/capita per day, 8 g of protein/capita per day and 7.3 g of fat/capita per day (FAO, 2013). However, when different geographic regions are considered, the contribution from milk to the various nutritional components varies considerably: milk provides only 3% of dietary energy supply in Asia and Africa compared with 8% – 9% in Europe and Oceania; 6% –7% of dietary protein supply in Asia and Africa compared with 19% in Europe; and 6% – 8% of dietary fat supply in Asia and Africa, compared with 11% – 14% in Europe, Oceania and Americas. At the same time, some studies have associated high-fat, protein rich animal-source food, including milk and dairy, with increased risk of cardiovascular disease (FAO, 2013). However, some of these studies included dairy only as a component of the diet, and often included other dietary interventions and lifestyle changes. Nonetheless, according to the same publication (FAO, ibid) “It is clear that saturated fat intake increases blood cholesterol levels and the occurrence of cardiovascular disease”. An expert consultation on fats and fatty acids recommended that saturated fatty acid should be replaced with polyunsaturated fatty acid to decrease the risk of coronary heart disease (FAO and WHO, 2010, quoted in FAO, 2013). In particular, given relatively high milk and dairy consumption this applies to consumers in industrialised countries.

Reducing Postharvest Losses In the OIC Member Countries
119
Figure 18: Milk value chain
Source: Adapted from NRI and Foodnet, 2002
4.6.2. Assessment of Postharvest Losses and Economic Burden
Loss figures differ according to the source consulted. For example, data collected during an FAO project showed that in Uganda about 27% of all milk produced is lost, namely that 6% is wasted at the farm level, whilst 11% and 10% of production is either lost due to spillage or spoilage during transport or marketing, respectively (FAO and AfDB, 2009). FAO calculated the value of marketed milk losses at US$ 23 million per annum (see above, milk losses during marketing). It is also indicated that Ugandan milk production is 900 million litres per annum, of which 585 million litres are marketed and 123 million litres are lost (21% of marketed milk). As indicated, milk production levels are now much higher (e.g. 1.2 million tonnes, according to FAOSTAT 2012).
Balikowa (2011) states that about 5.8% of the farm produce is wasted (it is assumed that this is milk). This figure is similar to the aforementioned farm level loss of 6%.
FAO/ILRI (2004) state that on farm losses are 10-52% due to poor marketing infrastructure and low quality. Losses at milk collection centres differ according to the season, namely 11% and 37% in dry and wet season, respectively (for example, due to milk being returned to farmer due to souring). The same source states that losses at processing level are low (less than 1%) due to spillage, improper sealing, and power-cuts.
In a subsequent study, the same project (FAO/ILRI, 2005) report that farm-level losses amount to 2.7% of the value of available milk due to spillage, spoilage and forced consumption combined. Forced consumption does not imply that the milk is completely lost, but that milk which would otherwise have been sold has to be consumed at the farm because of lack of
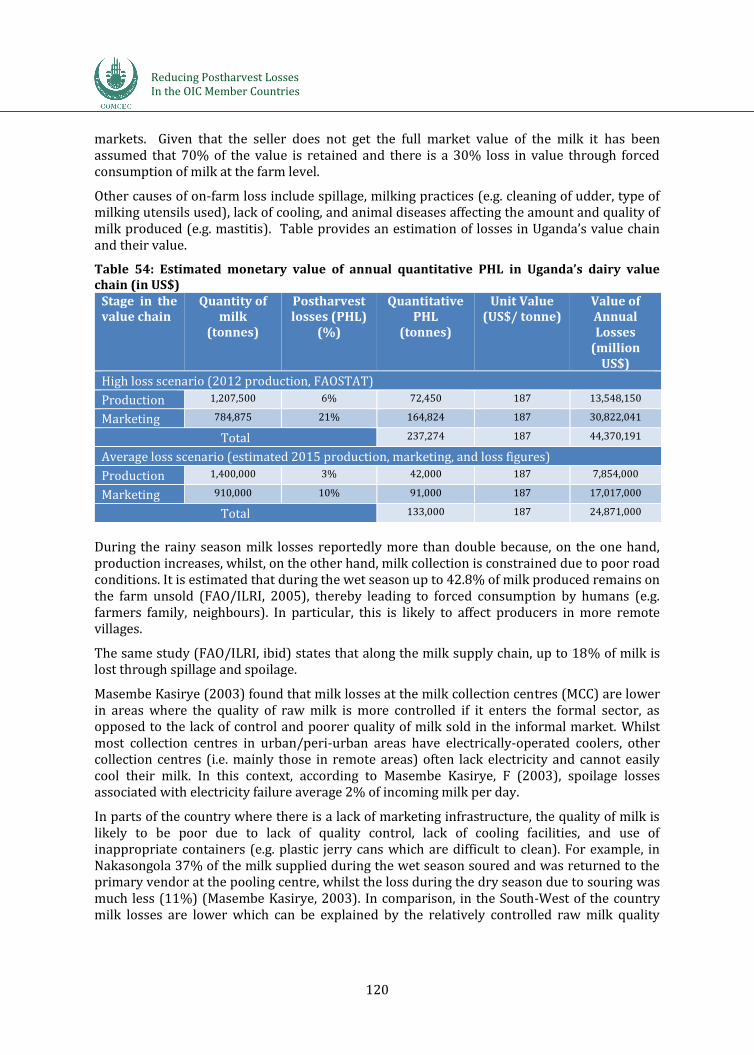
Reducing Postharvest Losses In the OIC Member Countries
120
markets. Given that the seller does not get the full market value of the milk it has been assumed that 70% of the value is retained and there is a 30% loss in value through forced consumption of milk at the farm level.
Other causes of on-farm loss include spillage, milking practices (e.g. cleaning of udder, type of milking utensils used), lack of cooling, and animal diseases affecting the amount and quality of milk produced (e.g. mastitis). Table provides an estimation of losses in Uganda’s value chain and their value.
Table 54: Estimated monetary value of annual quantitative PHL in Uganda’s dairy value chain (in US$)
Stage in the value chain
Quantity of milk
(tonnes)
Postharvest losses (PHL)
(%)
Quantitative PHL
(tonnes)
Unit Value (US$/ tonne)
Value of Annual Losses
(million US$)
High loss scenario (2012 production, FAOSTAT)
Production 1,207,500 6% 72,450 187 13,548,150
Marketing 784,875 21% 164,824 187 30,822,041
Total 237,274 187 44,370,191
Average loss scenario (estimated 2015 production, marketing, and loss figures)
Production 1,400,000 3% 42,000 187 7,854,000
Marketing 910,000 10% 91,000 187 17,017,000
Total 133,000 187 24,871,000
During the rainy season milk losses reportedly more than double because, on the one hand, production increases, whilst, on the other hand, milk collection is constrained due to poor road conditions. It is estimated that during the wet season up to 42.8% of milk produced remains on the farm unsold (FAO/ILRI, 2005), thereby leading to forced consumption by humans (e.g. farmers family, neighbours). In particular, this is likely to affect producers in more remote villages.
The same study (FAO/ILRI, ibid) states that along the milk supply chain, up to 18% of milk is lost through spillage and spoilage.
Masembe Kasirye (2003) found that milk losses at the milk collection centres (MCC) are lower in areas where the quality of raw milk is more controlled if it enters the formal sector, as opposed to the lack of control and poorer quality of milk sold in the informal market. Whilst most collection centres in urban/peri-urban areas have electrically-operated coolers, other collection centres (i.e. mainly those in remote areas) often lack electricity and cannot easily cool their milk. In this context, according to Masembe Kasirye, F (2003), spoilage losses associated with electricity failure average 2% of incoming milk per day.
In parts of the country where there is a lack of marketing infrastructure, the quality of milk is likely to be poor due to lack of quality control, lack of cooling facilities, and use of inappropriate containers (e.g. plastic jerry cans which are difficult to clean). For example, in Nakasongola 37% of the milk supplied during the wet season soured and was returned to the primary vendor at the pooling centre, whilst the loss during the dry season due to souring was much less (11%) (Masembe Kasirye, 2003). In comparison, in the South-West of the country milk losses are lower which can be explained by the relatively controlled raw milk quality

Reducing Postharvest Losses In the OIC Member Countries
121
destined for the formal market as opposed to the lack of control and poor quality of the milk sold in the informal market in some other parts of the country (Masembe Kasirye, 2003).
Balikowa (2011) quotes a study of the quality and safety of milk along the raw milk commodity chain in Uganda (N. Grillet et al, 2005), which showed that there were two main critical points within the raw milk commodity chain, namely i) the poor hygiene conditions leading to contamination of milk right from the farm to consumer; and ii) the inefficient preservation system that allows bacteria to develop quickly during transportation to distant markets.
In a newspaper article by the NewVision, the Minister of State for Agriculture, Animal Industry, and Fisheries (April 2015) has warned the public against purchasing loose milk sold by vendors, indicating that it can be adulterated with water and hydrogen peroxide, a chemical which when consumed in substantial quantities can cause health complications such as cancer.24 NRI and Foodnet (2002) also indicate that the widespread practice employed in the informal sector of adding chemical preservatives such as hydrogen peroxide and caustic soda is a health concern.
The Dairy (Marketing of Milk and Milk Products) Regulations 2003 being implemented by DDA and the code of hygienic practice for milk and milk products which was developed in collaboration with Uganda National Bureau of Standards (UNBS) have contributed significantly to the successful implementation of reforms in the dairy sector. As a result of the improvements in the handling and marketing of milk, the country has witnessed a steady growth in the production and consumption of milk, as well as significant private sector investments in the infrastructure for milk collection, bulking, transportation and processing (Balikowa, 2011) (Table).
Table 55: Postharvest practices in Uganda’s dairy sector
Stage in the value chain
Postharvest practices
Milking Improved practices: hygiene, equipment, cooling; Improved animal health (e.g. less mastitis) Sometimes “forced consumption of milk” when market is saturated or it is difficult to transport milk to collection centre
Milk Collection Centres Improvements in infrastructure (e.g. cooling, power supply, equipment) Quality assurance by DDA inspectors Organisation of farmers into associations to improve collection of milk from dispersed smallholder farms
Processing Formal sector / dairy processing factories: Investments in improved infrastructure (e.g. cooling, packaging); Informal sector (increased pasteurization; at the same time, still adulteration of milk with chemicals to preserve milk)
Marketing Formal distribution (e.g. retail outlets with refrigeration), and informal distribution (bicycle mounted traders)
Consumption Awareness raising (e.g. avoid purchase of loose milk from informal sector) and improved preservation (e.g. refrigeration), to safeguard consumer health and reduce spoilage
Cross-cutting Implementation of Dairy (Marketing of Milk and Milk Products) Regulations 2003 by Dairy Development Authority to develop and promote dairy sector (including quality assurance); Organisation of training workshops and capacity building measures.
24 Source: http://www.newvision.co.ug/new_vision/news/1324189/vendors-selling-adulterated-milk-rwamirama, newspaper article appeared on 15 April 2015.

Reducing Postharvest Losses In the OIC Member Countries
122
4.6.3. Causes of Postharvest Losses
Causes of postharvest losses are summarised in Table. The cause of loss occur at all stages in the value chain. Table 56: Causes of losses in the Ugandan dairy value chain
Stage in the value chain Causes of loss
Milking Inappropriate equipment and milking methods (e.g. unhygienic practices) Animal diseases affecting milk yields (e.g. mastitis) Adulteration of milk with water and chemicals such as hydrogen peroxide or caustic soda Lack of storage and cooling facilities at farm level
Milk Collection Centres Operation of cooling centres fraught by challenges such as high cost of equipment or irregular power supply; Collection of chilled milk (e.g. during rainy season, or if distances are long) During rainy season a relatively large proportion of milk is sent back to farmers due to souring Lack of sufficient quality assurance
Processing Difficulties to collect milk from dispersed small-holder farmers Disruption of cold chain (e.g. due to power cuts) SME processors face challenges such as capacity, infrastructure, etc. Lack of quality sufficient assurance
Marketing Lack of means of preservation Lack of appropriate transport Large proportion of milk is marketed through informal channels, where milk is sometimes adulterated and sold un-pasteurized.
Consumption Spoilage of milk due to lack of preservation methods Health risks due to unhygienic processing and storage of milk Lack of consumer awareness
4.6.4. Measures and Strategies Implemented for Postharvest Loss Reduction
According to Balikowa (2011), since the secretariat of the (Dairy Development Authority) DDA started operations in 2000, many reforms in the handling and marketing of milk have been implemented including, amongst others:
Code of hygienic practice for milk & milk products was developed in collaboration between DDA and Uganda National Bureau of Standards (UNBS).
Organization of the informal sector. Milk traders were mobilized through their umbrella body, the Uganda National Dairy Traders Associations (UNDATA) to undertake small-scale milk pasteurization using locally fabricated batch pasteurizers and to market loose pasteurized milk.
Boiling of large volumes of milk in unhygienic environments was outlawed. Use of plastic containers, particularly jerry cans for transporting milk was outlawed. Milk traders were advised to acquire aluminium or stainless milk cans which they
purchased in large numbers. Regular inspection and monitoring of milk processing facilities and retail outlets by
DDA was intensified. Registration of milk processors, traders, transporters, importers and input suppliers
was initiated. Widespread training of dairy farmers and milk traders on hygienic milk production
and handling was carried out.
Reducing Postharvest Losses In the OIC Member Countries
123
Establishment of a functional analytical laboratory and regular taking of samples of milk and dairy products on the market and analysis of their quality and composition was initiated.
All of the above actions and strategies have helped to reduce postharvest losses in the dairy value chain.
4.6.5. Lessons Learned from the Case Studies
The Ugandan dairy industry benefitted from a range of well-coordinated donor funded development programmes which facilitated a quick recovery of the industry after 1986 (Balikowa, 2011). Numerous national and international non-governmental organisations (NGOs), such as Heifer International, Send-A-Cow Uganda, Land O' Lakes, plus international development agencies such as DANIDA, USAID, French Development Agency, USDA, ADB, GTZ, EC, DFID, IDA, AU/IBAR, as well as UN Agencies such as FAO, WFP, IFAD, UNDP and the World Bank have supported the dairy sector during the last three decades (Balikowa, 2011). International agencies such as FAO and ILRI have included Uganda in projects to reduce milk postharvest losses (e.g. FAO Action Programme for the Prevention of Food Losses; Milk and dairy products, postharvest losses and food safety in sub-Saharan Africa and the Near East).
Another example of inter-regional programmes in East Africa is the ASARECA Programme “Exploiting Markets for Dairy and Meat Products: Quality and Safety; Improving Market Participation by Small Scale Livestock Producers” with local partners in 3 countries (e.g. ASARECA / PAAP-ILRI Project on rationalisation and harmonization). The inter-regional dimension of the sub-programme is attained by staging conferences with decision makers across a larger geographical spread to foster sharing of best practices, and support policies among the respective decision maker (Bennett and Peters, 2009).
Recommendations from projects such as the Kenya Smallholder Dairy Project25 should be taken into account in that they offer practical solutions to milk losses encountered by small-scale farmers and traders. For example, the use of the lactoperoxidase system (LPS) as a substitute for hydrogen peroxide is seen to offer a means by which milk collectors can preserve milk quality for a longer period, and reduce spoilage losses incurred.
Dairy production in Uganda contributes to household livelihoods, food security and nutrition. Strong demand for dairy products and increasingly complex processing and marketing systems offer significant opportunities for growth and poverty reduction at every stage in the value chain. However, these new market opportunities and livelihood options are accompanied by rapidly changing patterns of competition, consumer preferences and market standards, which pose challenges for smallholders to remain competitive.
Value chains must therefore be carefully managed to ensure that smallholders are in a position to exploit opportunities in this rapidly changing sector. Institutional support and public and private investments are needed to assist those smallholders who can compete in these value chains. The Government of Uganda has identified the dairy sector as one of the ten priority sectors as part of the development strategy and investment plan. Given that the dairy sector already has played an important role in agricultural policy during the last three decades, it is a matter of continuing the efforts which are underway.
25 www.smallholderdairy.org

Reducing Postharvest Losses In the OIC Member Countries
124
4.7. Fish and Seafood Products in Indonesia
4.7.1. Status and Importance
In 2011, the Indonesian population consumed some 7 million tonnes of fish – 29 kilos per person per year. This compares with a global average 19 kilos per person per year. Indonesia is self-sufficient in fish, exporting five times as much as it imports.
Fish is the most important source of protein in Indonesia by a considerable margin. This is shown in Table.
Table 57: Animal protein production in Indonesia, 2010 Type ‘000 tonnes % of total
Fish and shellfish 7,453 72% Beef and buffalo 472 5% Pig 695 7% Sheep and goat 114 1% Poultry 1,566 15% TOTAL 10,300 100%
Source: FAO Statistics Yearbook, 2011
Fish production for 2014 is shown in Table, below.
Table 58: Fish production for food, Indonesia, 2014 Species Production (‘000
tonnes) % of sub-set % of total
Capture: Tuna like- species 1,250 22 12
Capture: Other fish 3,901 67 39
Capture: Shrimp 255 4 3
Capture: Other fishes 374 6 4
Total Capture 5,780 100 57
Aquaculture: Shrimp 592 14 6
Aquaculture: Groupers 12 0 0
Aquaculture: Lates 4 0 0
Aquaculture: Milkfish 621 14 6
Aquaculture: Carp 484 11 5
Aquaculture: Tilapia 912 21 9
Aquaculture: Catfish 1,016 24 10
Aquaculture: Gouramy 108 3 1
Aquaculture: Others 535 12 5
Total Aquaculture: 4,284 100 43
Grand Total 10,064 100
Source: Marine and Fisheries in Figures, 2014, Ministry of Marine Affairs and Fisheries

Reducing Postharvest Losses In the OIC Member Countries
125
The Value Chain
The basic value chain is shown in Figure 19.
Figure 19: Basic value chain for fish and seafood
Capture
Culture (aquaculture)
Consolidation ProcessingPresentation to Market
Fish and other sea-foods are produced by a wide range of players. These can be broadly segmented as follows:
Large scale, industrial capture: Typically large scale, capital intensive, high level of technology; Targeting species such as Tuna.
Medium Scale Commercial Capture: Possibly the largest segment in Indonesian fishing. A wide range of fishing methods used, targeting a very wide range of species.
Small Scale / Artisanal Capture: Smaller vessels, usually under 10 meters, lower investment costs, generally, but not always servicing the local market.
Large Scale Commercial Aquaculture: Pond or cage based, high investment, generally farming shrimp of fin fish for further processing.
Medium Scale Commercial Aquaculture: A growing sector, similar to large scale, but less capital intensive.
‘Backyard Ponds’ Aquaculture: Largest sector in terms of participants. Significant impact on nutrition and food security.
The processing and marketing of fish is equally complex. The processing/handling sector and the products that are produced can broadly be segmented as:
Consolidation of fresh product & distribution producing iced and fresh fish for consumption and further processing;
Icing producing fresh fish, mostly for domestic consumption; Processing on board (freezing) producing frozen fish and seafood for both export and
domestic markets; Freezing in relatively sophisticated factories, working to zero loss and serving the high
end retail market (domestic and import) Canning producing canned tuna for export and canned small pelagic species for mostly
domestic consumption. Traditional processing. Producing a wide variety of dried, smoked, salted and
fermented product for domestic consumption.
This list is not exhaustive.
The Role of the Government
The Ministry of Marine Affairs and Fisheries (MMAF) is responsible for setting policy and for overall management of the fisheries and aquaculture sectors.
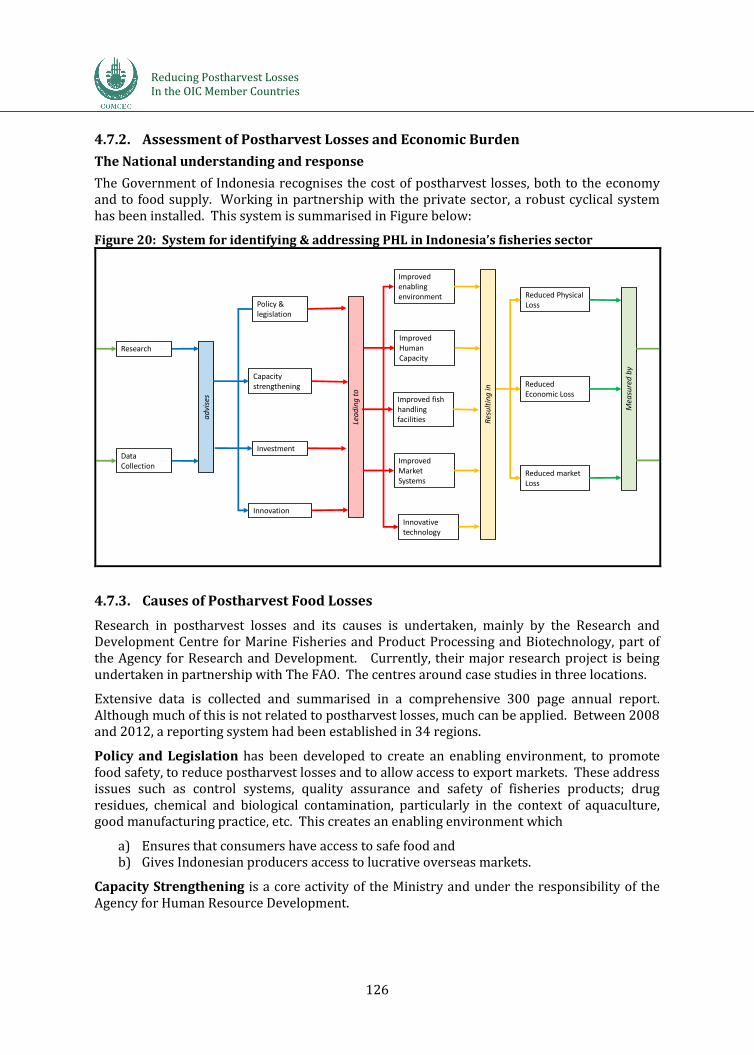
Reducing Postharvest Losses In the OIC Member Countries
126
4.7.2. Assessment of Postharvest Losses and Economic Burden
The National understanding and response
The Government of Indonesia recognises the cost of postharvest losses, both to the economy and to food supply. Working in partnership with the private sector, a robust cyclical system has been installed. This system is summarised in Figure below:
Figure 20: System for identifying & addressing PHL in Indonesia’s fisheries sector
Data Collection
ResearchLe
ad
ing
to
Policy & legislation
Investment
Capacity strengthening
Innovation
ad
vise
s
Improved enabling environment
Innovative technology
Reduced Economic Loss
Reduced Physical Loss
Reduced market Loss
Mea
sure
d b
y
Res
ult
ing
in
Improved Human Capacity
Improved Market Systems
Improved fish handling facilities
4.7.3. Causes of Postharvest Food Losses
Research in postharvest losses and its causes is undertaken, mainly by the Research and Development Centre for Marine Fisheries and Product Processing and Biotechnology, part of the Agency for Research and Development. Currently, their major research project is being undertaken in partnership with The FAO. The centres around case studies in three locations.
Extensive data is collected and summarised in a comprehensive 300 page annual report. Although much of this is not related to postharvest losses, much can be applied. Between 2008 and 2012, a reporting system had been established in 34 regions.
Policy and Legislation has been developed to create an enabling environment, to promote food safety, to reduce postharvest losses and to allow access to export markets. These address issues such as control systems, quality assurance and safety of fisheries products; drug residues, chemical and biological contamination, particularly in the context of aquaculture, good manufacturing practice, etc. This creates an enabling environment which
a) Ensures that consumers have access to safe food and b) Gives Indonesian producers access to lucrative overseas markets.
Capacity Strengthening is a core activity of the Ministry and under the responsibility of the Agency for Human Resource Development.

Reducing Postharvest Losses In the OIC Member Countries
127
Improved Enabling Environment comes about as a result of legislation and investment. It is noted that 60% of the Ministry budget is spent directly on fishermen and other value chain players. For example, this year the Government is planning to invest in 300 flake ice machines, 29 cold store complexes and over 30 single cold stores.
Finally, improved market systems and the application of innovative technology (fish processing factories that operate to zero losses for example) is trialled by both the private and public sector.
This results in reduced physical and economic loss, which is monitored through research and data collection.
4.7.4. Measures and Strategies Implemented for Postharvest Loss Reduction
As mentioned elsewhere in this report, there are several categories of postharvest losses. The ones that are monitored and addressed in Indonesia are:
Physical losses is the one that everyone understands. This is the volume of product that is produced, but which is not consumed, usually because it is unfit for human consumption.
Economic / quality losses: This is the reduction in value that occurs as a result of the product not achieving optimal price for quality reasons. For example, a poorly handled fish will attract a lower price than it could realise, were it handled properly. A good example of this is seen in the tuna fishery targeting the highly lucrative Shashimi market. Unless the tuna meets the highest specifications, full price will not be achieved.
Market losses: These occur when oversupply results in a glut in the market, resulting in lower prices.
Generally, losses are reports as single numbers, expressed as %. This is the % of the value realised compared to the value that could have been achieved, had all the fish captured or harvested been sold at the best price the market would expect. This is further explained in the box, below.
Scenario 1 A fishing vessel is fishing for mixed reef fish. The fair market price for reef fish at Jakarta market is $4,000 per tonne for Grade 1 and $ 2,500 per tonne for grade 2catches 10 tonnes of reef fish over a one week period.
The fishing vessel undertakes a one-week trip and catches 10 tonnes of fish. For various reasons only 9 tonnes are presented to market. One tonne is lost through
pilferage and spoilage. Of the 9 tonnes, 7 tonnes are first quality and achieve the grade 1 price. 2 tonnes are of second quality and achieve the lower, grade 2 price.
The total income realised by the vessel, therefore is 7 x 4,000 = 28,000 plus 2 x 2,500 = 5,000 = $33,000. The total potential income is 10 x 4,000 = 40,000. The total postharvest losses between capture and wholesale therefore are 1-(33/40)= 17.5% Of this, 1 x 4,000/40,000 = 10% is attributable to physical loss and the remainder, 7.5 % is attributable to quality loss.
Scenario 2 A fishing vessel is fishing for mixed reef fish. The fair market price for reef fish at Jakarta market is $4,000 per tonne for Grade 1 and $ 2,500 per tonne for grade 2catches 10 tonnes of reef fish over a one week period. However at the time of
Reducing Postharvest Losses In the OIC Member Countries
128
landing, there is a glut in the market and the price for fish has decreased to US$ 3,000 for grade 1 and $2,000 for grade 2.
The fishing vessel undertakes a one-week trip and catches 10 tonnes of fish. For various reasons only 9 tonnes are presented to market. One tonne is lost through
pilferage and spoilage. Of the 9 tonnes, 7 tonnes are first quality and achieve the grade 1 price. 2 tonnes are of second quality and achieve the lower, grade 2 price.
The total income realised by the vessel, therefore is 7 x 3,000 = 21,000 plus 2 x 2,000 = 4,000 = $25,000. The total potential income is 10 x 4,000 = 40,000. The total postharvest losses between capture and wholesale therefore are 1-(25/40)= 37.5% Of this, 25%is attributable to market loss, 7.5% is attributable to physical loss and 5 % is attributable to quality loss.
The figure quoted for postharvest losses in Indonesia in most literature is 30%. This figure is not disaggregated.
However, this is an estimate and the reality is different to this. Recent research has shown that it certainly is in specific value chains. For example, Wibowo et al reported losses ranging from 4% to 10% at a selection of fish landing areas and concluded that a blanket estimate of 30% was possible over-cautious. They also identified an overall year-on year decrease, attributable to targeted investment and training.26
Recent research, undertaken by the same team, jointly with FAO in four locations under the ‘Save Food Programme’ identified the following issues:
Squid Fishery, Muara Angke: Physical losses are minimal. Quality losses were seen in 5% of landed product. Market losses are not significant. Reasons for losses are clearly identified.
Gill net fishery, Tegal: There is some physical/environmental loss (up to 4%) through incidental by-catch and poor handling. Quality loss is more significant – 28% was measured.
Gillnet Fishery, Gunung Kidul: Significant physical loses were noted during peak season due to lack of adequate handling equipment on board vessels. Up to 15% of the catch was subject to quality loss. Market loss during high season could be up to 50%. Theft is a major problem, resulting in physical loss. This was estimated at 12.5%.
Mini Trawl, Brondong: There is a 3% physical loss due to theft. A further 5% loss physical/quality s experienced due to handling methods. 22% of the catch is affected by quality loss.
From this it is clear that losses in the capture fisheries value chain are variable from fishery to fishery and in some cases, unique to a given fishery. It is therefore difficult to ascribe an accurate cost of postharvest losses in the value chain as a whole. However, the research undertaken under this programme has presented specific costs in a given fishery. For example,
26 Evaluating and Monitoring of national Postharvest Fish Loss in Indonesia, Wibowo et al, Proceeding of the 3rd International Seminar of Fisheries and Marine Science, 2014

Reducing Postharvest Losses In the OIC Member Countries
129
Gill net fishery, Tegal: $441,000 quality loss on a potential 100% revenue of $1,757,000
Gillnet Fishery, Gunung Kidul: $12,000 loss per vessel per year through pilferage; $364,615 quality loss on a potential revenue of $9.1 million.
Mini Trawl, Brondong: US$ 5 million quality loss per annum in the fishery.
While postharvest losses in the fisheries value chain varies from fishery to fishery and from location to location, taken overall it represent a major economic loss.
At 30% (the conventional estimate of PhL) postharvest losses, cost the industry approximately US$ 4.8 billion.
Assuming the total production from capture fisheries alone that reaches the consumer is approximately 6 million tonnes, then 10% physical losses means that 650,000 tonnes of fish is essentially thrown away. To put this in to context, this is more than the total annual production from the capture fishery of Cambodia, South Africa, Namibia, Pakistan or New Zealand!
Research currently undertaken in Indonesia through the joint Government of Indonesia and FAO programme enumerates losses, identifies causes, and presents mitigating actions by loss type and fishery (Table 59).
Table 59: Reasons for losses for fisheries in Indonesia Reason for loss
Response Policy Legislation Technology Infrastructure
& services Skills
Poor quality raw material (Quality loss)
Possible introduction of warehouse receipts system
Standards for processing
Improved procedures
Improved general hygiene and sanitation; access to water; access to ice; Access to credit
Capacity building for fishers and processors; Technology & skills transfer
Incidental by-catch (Production / Physical loss)
- Community-based management plan
- - -
Long net soaking times (quality loss, Physical loss)
- - Mechanised hauling systems;
- Training of fishers; Sharing of best practice.
Poor on-shore handling. (Quality loss)
- - Use of ice and insulated containers
Upgrading of jetty facilities; Access to credit
Training of fishers and processors
Hygiene/ sanitation
- Quality standards legislation
- Upgrading facilities
-
Discards at Sea (physical loss)
- Community-based management plan
Alternative gear types
- -
Poor on-board handling
- - Alternative handling processes; Improved quality of ice;
Improved storage facilities; Improved landing facilities.
Training of fishers

Reducing Postharvest Losses In the OIC Member Countries
130
4.7.5. Lessons Learned from the Case Study
The Government of Indonesia clearly recognises the importance of managing postharvest losses in the sector. It does this through a process of researching and identifying the causes, enumerating the impact and putting in place mechanisms to address these causes. Research undertaken by Wibowo et al presented that the national average postharvest losses had decreased by 1.26% over the two years between 2010 and 2012. Based on 2014 figures, every percentage point adds approximately IDR 2.1 trillion million to the value chain. This is approximately equivalent to US$ 160 million. 1. The Government of Indonesia recognises the cost of postharvest losses and allocates resources to address and rectify this. There are clear indications, reported in peer reviewed articles that the strategy is having an impact. It is noted that this is seen as an ongoing process. Indonesia’s approach to managing postharvest losses in the fisheries and aquaculture value chain should be shared with other participating countries. 2. Comprehensive National fisheries statistics are produced annually. These look at a number of factors surrounding production, trade and contribution to the National economy. Likewise, comprehensive global statistics are produced by the FAO. It is noted that none of these statistics report on postharvest losses. The annual FAO report, ‘The State of World Fisheries and Aquaculture, 2014’, did include six-page section on postharvest losses in small scale fisheries. However, few numbers were presented. Working on the basis of ‘if you can’t measure it, you can’t manage it’, it is recommended that postharvest losses in fisheries value chains be reported as a matter of course, much in the same way as production, marketing and economic parameters are currently report. 3. Where postharvest loss data is reported, it is often done in the form of a simple percentage figure. This overall % is made up of both physical and financial losses. If the reporting of losses is to be used to guide future management action, it is strongly recommended that loss reporting be disaggregated. After all, what one does to address physical loss is very different to that one does to address quality losses. Also it must be recognised that the non-practitioner generally equates postharvest losses with physical losses only. Conspicuous disaggregation would make it cleared for the non-specialist. 4. If PHLs are to be included in annual statistical reports, then it may also be worth reporting values as well as percentages. This would allow planners to allocate resources that are concomitant with the problem. 5. The research team in Indonesia identified the development of a warehouse receipt system for fish as a mitigating action. It is understood that this has yet to be piloted. It is recommended that this be piloted and results shared.

Reducing Postharvest Losses In the OIC Member Countries
131
4.8. Summary of the Case Study Findings
For each of the seven case studies that focused on food crops, postharvest losses are complex and differ by commodity and target markets. These are summarised in Table 60. While losses in terms of physical and economic terms are reported, in practice they will substantially vary even for the same commodity because value chains can be quite different. There is no single measure that will reduce postharvest losses due the vast array of products and uniqueness of each market. Table 60: Summary of causes and mitigation for the cases studies
Case /desk study
Causes of postharvest losses Means for reduction of postharvest losses
Cereals in Egypt
Late harvesting leading to infestation and grain left in the field
Awareness of optimal harvest timing, field infestation risk. Better advanced planning for PH activities
Drying in the field
Stooking and/or quick removal of mature crop from field. Use of clean sheets/ containers to protect crop
Transport management
Better advanced planning & monitoring of PH activities
Inadequate threshing and shelling
Erect sides around threshing/shelling platforms and sheets underneath, gentler beating to prevent breakage, timely harvesting before crop over matures, maintenance/ knowledge of threshing machine to minimise breakage
Suboptimal Sorting Awareness: removing broken grains reduce pest damage. Support development of quality sensitive markets
Suboptimal Marketing Farmer organisation share transport, market info, increase access to credit and negotiation positions. Support development of quality sensitive markets, enforce grain standards efficiently and equitably. More efficient payment systems (e.g. mobile money). More efficient less complex grain import systems. As private sector procurement of domestic grain increases, warehouse receipt systems may have a role
Suboptimal Storage Training on improved grain storage for farmers, extensionists, teachers, traders/importers and store managers. Thorough cleaning and maintenance of stores. Better protection of grain to be stored (e.g. use of hermetics, recommended pesticide application for farmers; fumigation, rodent mgmt. & hygiene of large stores)
Suboptimal Milling Increased training in mill hygiene, product separation, rodent proofing and preventative maintenance. Monitoring and investment.
Suboptimal Utilisation Awareness raising on food safety issues and food choices

Reducing Postharvest Losses In the OIC Member Countries
132
Case /desk study
Causes of postharvest losses Means for reduction of postharvest losses
Cassava in Nigeria
Losses occur at the farm, trading, transport and handling, processing and retail and consumption stages for both Gari and fufu, two main products produced from fresh cassava in Nigeria. Of these the most critical was identified as harvest and processing. No single measure that will reduce losses but rather a number or series of interventions which together will lead to reduced physical and economic losses. The most critical are locating the centre of processing close to the farm and processing fresh roots with minimal of time delays.
• Roots handled gently to minimize bruising and breaking of the skin during loading and off-loading along with appropriate supervision • Farmers associations collectively hiring vehicles for transportation • Involvement of cassava processor and collector associations; especially women • Processing cassava close to the farms to minimise handling and reduce delays • Pack processed products in polyethylene packs where feasible to reduce losses and shelf-life • Availability of shelters in the open markets
Groundnuts in Senegal
Poor postharvest handling methods. Poor storage and shelling nearer to the point of sale and avoid wetting the nuts when selling. Nuts are often traded when not fully dried.
Training of farmers as well as traders and micro/small-scale processors. Promote structured marketing systems Easing access to finance as at the postharvest level to encourage compliance. Policy support for the market development initiatives.
Tomatoes in Bangladesh
Poor packaging and transport. Training. Grading, Water loss, Packaging – use of plastic crates, Cooling (use of Cool Bot cooling system), Solar drying Needs-based extension
Meat and meat products in Oman
For Domestic production. Market distortion by policy makers and no market standards. Slaughter of animals within the household leading to under-use of by-products (offal, blood, skin, hides etc.). Poor feed conversion
Changes to the marketing system would be required as operate a fixed price system. No single organisation responsible for postharvest losses. Informing policy makers of benefits of reducing postharvest losses.
Dairy and Dairy Products in Uganda
The occur during milking, at milk collection centres, during processing, marketing and consumption
Implementation of a code of practice, organisation of the informal sector, inspection and monitoring, registration, training and testing of dairy products
Indonesian Fisheries Sector
Economic losses were the main problem. Poor quality raw material due to poor on-board handling is landed and delivered for further processing or on-sale, resulting in economic losses. Excessive soak time in nets results in economic losses. Poor on-shore handling & storage results in economic losses Poor hygiene results in economic losses. Physical losses are generally minimal (less than 5%). However they do occur through discarded by-catch and through pilferage.
The Government of Indonesia takes a proactive approach to combatting PHLs in fish. Strategies that it has adopted include: • Introducing legislation setting minimum quality and hygiene standards • Developing better handling procedures • Introducing improved technology • Improving infrastructure – landing sites, markets, access to ice, cold chain, jetties • Community engagement, and possibly most importantly, • Skills training and capacity strengthening

Reducing Postharvest Losses In the OIC Member Countries
133
5. CAUSES AND CONSEQUENCES OF POSTHARVEST LOSSES
In this section, the postharvest food losses identified in the overview, online survey and case/field studies related to physical, economic and quality/nutrition losses are brought together in order to compare and explore trends in relation to the global situation. The caused and consequences are then considered along with other issues such as resource assessment, institutional support and suggestions from online participants.
5.1. Comparison of Postharvest Losses Identified in the Literature Review, Online Survey and Case/Field Studies.
In this section the report compares the levels of physical losses, economic losses and quality/nutrition losses found in the OIC Member Countries. 5.1.1. Physical Losses Identified in the Literature Review, Online Survey and
Case/Field Studies In this section, the focus will be on physical, economic and quality/nutrition losses in OIC Member Countries and relate this to the Global losses reported. In order to put these into context of postharvest global losses estimated from Gustavsson et al., 2011, we have retained the regional classifications and then related losses reported in the literature review, online survey and case/field studies. This enables trends to be easier to follow using the often limited information available. , The physical losses for the commodity groups are reported in Table 61 to Table 73. There are many gaps in the information available including the online survey which is expected. In general, the losses reported in OIC Member Countries in the literature review, online survey and case/field studies were similar to the global figures reported by Gustavsson et al., 2011. The results, however, do not mean that this is the true situation since the figures are estimates and the figures reported in the literature review, online survey and case/field studies are likely to be influenced by each other because few studies have undertaken accuracy measurements using a common methodology. Also, the losses are likely to vary greatly from one commodity to another, one region to another, and from one value chain to another (Table 61). Cereals
The physical losses for OIC Member Countries in Sub-Saharan Africa, North Africa, West and Central Asia and South and Southeast Asia are reported in Table 61. Compared to the global situation, the losses reported in OIC Member Countries in the literature review, online survey and the case/field study are similar or slightly higher.

Reducing Postharvest Losses In the OIC Member Countries
134
Table 61: Physical losses for cereals compared to the global situation, literature review, online survey and case/field survey
Postharvest loss Global Literature review
Online survey Case/Field study
Industrialised Asia
15%
Sub-Saharan Africa
12% Average 14%, Median 12% range 9%-31%
10% (Benin), 25% (Mozambique), 25% (Nigeria), 18% (Uganda), 25% (Sierra Leone), 5% (Mali)
North Africa, West and Central Asia
15% 16-48% (Egypt)
South and Southeast Asia
12% 12-17% (Pakistan), 18% (Indonesia)
25% (Bangladesh), 15% (Indonesia), 20% (Afghanistan)
1Taken from APHLIS, - = no data available for OIC Member Countries
Root and Tuber Crops The physical losses for OIC Member Countries in Industrialised Asia, Sub-Saharan Africa, North Africa, West and Central Asia and South and Southeast Asia are reported in Table 62. Compared to the global situation, the losses reported in OIC Member Countries in the literature review, online survey and the case/field study are generally similar or slightly higher although for Bangladesh, the figures were a little lower. Table 62: Physical losses for root and tuber crops compared to the global situation, literature review, online survey and case/field survey
Postharvest loss Global Literature review
Online survey Case/Field study
Industrialised Asia 22% 10-40% (Azerbijan, Bahrain)
Sub-Saharan Africa 28% 7-25% (Nigeria), 30% (Cameroon), 8-50% (Benin), 14-18% (Mozambique)
12-40% (Nigeria), 20% (Uganda)
7-24% (Nigeria)
North Africa, West and Central Asia
25% 10-40% (Algeria), 18% (Egypt),
South and Southeast Asia
34% 23-28% (Bangladesh)
- = no data available for OIC Member Countries

Reducing Postharvest Losses In the OIC Member Countries
135
Oilseed and Pulses The physical losses for OIC Member Countries in Sub-Saharan Africa is reported in Table. Compared to the global situation, the losses reported in the OIC Member Country Senegal in the case/field study was similar. Table 63: Physical losses for oilseeds and pulses compared to the global situation, literature review, online survey and case/field survey
Postharvest loss Global Literature review
Online survey Case/Field study
Industrialised Asia 10% - N- -
Sub-Saharan Africa 15% - - 14% (Senegal)
North Africa, West and Central Asia
12% - - -
South and Southeast Asia
18% - - -
Where: - = no data available for OIC Member Countries Fruit and Vegetables The physical losses for OIC Member Countries in Industrialised Asia, Sub-Saharan Africa, North Africa, West and Central Asia and South and Southeast Asia are report in Table. Compared to the global situation, the losses reported in OIC Member Countries in the literature review, online survey and the case/field study are generally similar. Table 64: Physical losses for fruit and vegetables compared to the global situation, literature review, online survey and case/field survey
Postharvest loss Global Literature review Online survey Case/Field study
Industrialised Asia
15% - - -
Sub-Saharan Africa
38% 50% (Benin), 30-40% (West Africa)
30-65% (Nigeria), 25% (Cameroon)
-
North Africa, West and Central Asia
32% 10-60% (Oman) 32% (Uzbekistan), 40% (Lebanon)
-
South and Southeast Asia
32% 24% (Malaysia) 41% (Pakistan), 5-35% (Tajikistan), 30% (indonesia)
3-40% (Bangladesh)
Where: - = no data available for OIC Member Countries Meat and Meat Products The physical losses for OIC Member Countries in North Africa, West and Central Asia is reported in Table. Compared to the global situation, the losses reported in OIC Member Countries in the literature review and the case/field study are of a similar order being lower in Turkey and higher in Oman.
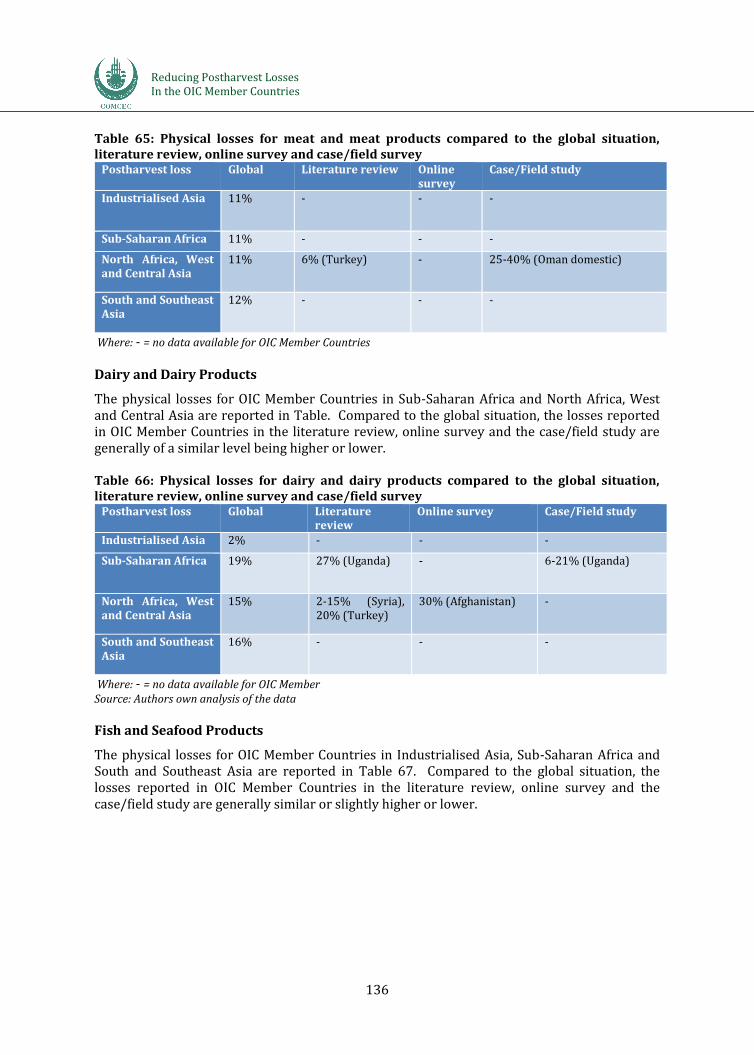
Reducing Postharvest Losses In the OIC Member Countries
136
Table 65: Physical losses for meat and meat products compared to the global situation, literature review, online survey and case/field survey
Postharvest loss Global Literature review Online survey
Case/Field study
Industrialised Asia 11% - - -
Sub-Saharan Africa 11% - - -
North Africa, West and Central Asia
11% 6% (Turkey) - 25-40% (Oman domestic)
South and Southeast Asia
12% - - -
Where: - = no data available for OIC Member Countries
Dairy and Dairy Products
The physical losses for OIC Member Countries in Sub-Saharan Africa and North Africa, West and Central Asia are reported in Table. Compared to the global situation, the losses reported in OIC Member Countries in the literature review, online survey and the case/field study are generally of a similar level being higher or lower. Table 66: Physical losses for dairy and dairy products compared to the global situation, literature review, online survey and case/field survey
Postharvest loss Global Literature review
Online survey Case/Field study
Industrialised Asia 2% - - -
Sub-Saharan Africa 19% 27% (Uganda) - 6-21% (Uganda)
North Africa, West and Central Asia
15% 2-15% (Syria), 20% (Turkey)
30% (Afghanistan) -
South and Southeast Asia
16% - - -
Where: - = no data available for OIC Member Source: Authors own analysis of the data
Fish and Seafood Products
The physical losses for OIC Member Countries in Industrialised Asia, Sub-Saharan Africa and South and Southeast Asia are reported in Table 67. Compared to the global situation, the losses reported in OIC Member Countries in the literature review, online survey and the case/field study are generally similar or slightly higher or lower.

Reducing Postharvest Losses In the OIC Member Countries
137
Table 67: Physical losses for fish and seafood products compared to the global situation, literature review, online survey and case/field survey
Postharvest loss Global Literature review
Online survey Case/Field study
Industrialised Asia 16% - - -
Sub-Saharan Africa 25% - 50% (Mali) -
North Africa, West and Central Asia
20% - - -
South and Southeast Asia
25% - - 3-50% and average of 30% (Indonesia)
Where: - = no data available for OIC Member
5.1.2. Economic Losses Identified in the Literature Review, Online Survey and
Case/Field Studies
The economic losses for the commodity groups are reported in Table 68 to Table 71. There is much less information compared to the physical losses which is expected since this is more difficult to estimate and measure. We have not reported on losses in the global situation because these figures do not appear to be available for these regional sectors. Nor have we included the economic losses estimated by the 66 respondents to the online survey because in general the percent economic losses reported were very similar to the percent physical losses reported. Naziri et al., 2015 showed that economic losses can significantly differ from physical losses because of the differing marginal increases in value due to whether losses occur close to farm were little margin as been accrued or at the consumer end where margins are much greater. In general, the losses reported in OIC Member Countries in the literature review and case/field studies were large and significant. Comparisons are difficult because comparison with global figures are complex and the figures are estimates. In all cases the economic losses are significant and hence consumer and actors in the value chains and the environment will benefit if these monetary losses could be reduced. Cereals
The economic losses for cereals n OIC Member Countries in Sub-Saharan Africa and North Africa, West and Central Asia are reported in Table 68. The losses are difficult to compare because they are total amounts but the estimated losses in all cases are large being in the billions of US$. This implies that the consumer and actors in the value chains and the environment will benefit if these monetary losses could be reduced.
Reducing Postharvest Losses In the OIC Member Countries
138
Table 68: Economic losses for cereals reported in the literature and case/field study Postharvest loss
Global Literature review Case/Field study
Sub-Saharan Africa
US$4 billion per year (World Bank, NRI, FAO, 2011).
North Africa, West and Central Asia
3.9 million tons of cereal grains per annum, equivalent to USD$ 1.16 billion/ annum (Egypt)
Where: - = no data available for OIC Member Root and Tuber Crops
The economic losses for root and tuber crops in were only reported for the OIC Member Country Nigeria. The losses arose from the case/desk study and literature view which both relied on the same information base. The economic losses reported vary from USD20 million (South-West only) and Euro686 million (whole country). Reducing economic losses will benefit the consumer and actors in the value chains and the environment. Oilseeds and Pulses
The economic losses for oilseeds and pulses in were only reported for the OIC Member Country Senegal and this was from the case study on groundnuts. The economic losses reported was US$80 million per year. Reducing economic losses will benefit the consumer and actors in the value chains and the environment. Fruit and Vegetables
The economic losses for fruit and vegetables n OIC Member Countries in Sub-Saharan Africa and South and Southeast Asia are reported in Table 69. The losses are difficult to compare because one is total amounts and the other a percentage figure and also they are for different crops. Nonetheless, both figures are significant. This implies that the consumer and actors in the value chains and the environment will benefit if these monetary losses could be reduced. Table 69: Economic losses for fruit and vegetables reported in the literature and case/field study
Postharvest loss
Global Literature review Case/Field study
Sub-Saharan Africa
25% loss in value of plantain (Uganda)
South and Southeast Asia
US$9 million at the farm gate and US$11.6 million at the retail price. Another rported US$7.7 million nationally. (tomoatoes in Bangladesh)
Where: - = no data available for OIC Member

Reducing Postharvest Losses In the OIC Member Countries
139
Meat and Meat Products
The economic losses for meat and meat products n OIC Member Countries in North Africa, West and Central Asia are reported in Table. The losses are difficult to compare because one is a total amount and the other a percentage figure. Nonetheless, both figures are significant. This implies that the consumer and actors in the value chains and the environment will benefit if these monetary losses could be reduced. Table 70: Economic losses for meat and meat products reported in the literature and case/field study
Postharvest loss Global Literature review
Case/Field study
North Africa, West and Central Asia
6% (Turkey) (Oman domestic) loss of US$31 million per annum or 49% of economic value
Where: - = no data available for OIC Member
Milk and Dairy Products
The economic losses for milk and dairy products n OIC Member Countries in sub-Saharan Africa and South and Southeast Asia are reported in Table 71. The losses are tend to be higher in Pakistan compared to those in Africa. Nonetheless, both figures are significant. This implies that the consumer and actors in the value chains and the environment will benefit if these monetary losses could be reduced.
Table 71: Economic losses for milk and dairy products reported in the literature and case/field study
Postharvest loss Global Literature review Case/Field study
Sub-Saharan Africa US$ 2.54 billion
US$56 million (Kenya + Uganda + Tanzania), US$ 23 (Uganda)
(Uganda) US$25 to US$44 million per annum
South and Southeast Asia
US$1.7 billion (Pakistan)
Where: - = no data available for OIC Member Fish and Seafood Products
The economic losses for fish and seafood products were only reported for the OIC Member Country Indonesia and this was from the case study on in Indonesia. The economic losses reported was large at US$4.8 billion per year. 5.1.3. Quality and Nutrition Losses Identified in the Literature Review, Online
Survey and Case/Field Studies
The economic losses for the commodity groups are reported in Table 68 to Table 71. There is much less information compared to the physical losses which is expected since this is more difficult to estimate and measure. We have not reported on losses in the global situation because these figures do not appear to be available for these regional sectors. Nor have we included the economic losses estimated by the 66 respondents to the online survey because in general the percent economic losses reported were very similar to the percent physical losses reported. Naziri et al., 2015 showed that economic losses can significantly differ from physical losses because of the differing marginal increases in value due to whether losses occur close to
Reducing Postharvest Losses In the OIC Member Countries
140
farm were little margin as been accrued or at the consumer end where margins are much greater. In general, the losses reported in OIC Member Countries in the literature review and case/field studies were large and significant. Comparisons are difficult because comparison with global figures are complex and the figures are estimates. In all cases the economic losses are significant and hence consumer and actors in the value chains and the environment will benefit if these monetary losses could be reduced. Cereals
The quality and nutrition losses for cereals n OIC Member Countries in Sub-Saharan Africa and North Africa, West and Central Asia are reported in Table . The losses relate to nutritional losses specifically calories. The estimates imply that there would be better access to calories if these losses could be reduced. This implies that the consumer and actors in the value chains and the environment will benefit if these losses could be reduced. Table 72: Quality and nutrition losses for cereals reported in the literature and case/field study Postharvest loss
Global Literature review Case/Field study
Sub-Saharan Africa
Annual caloric requirement of 48 million people (World Bank, NRI, FAO, 2011).
North Africa, West and Central Asia
Annual caloric requirements of at least 15 million people (at 2,500 kcal per person per day) (Egypt)
Where: - = no data Root and Tuber Crops
The quality and nutrition losses for root and tuber crops were only reported for the OIC Member Country Uganda and biofortified root and tuber crops containing provitamin A such as orange sweet potato and yellow cassava. However, these losses may apply to any OIC Member Country where such biofortified crops are consumed. Although not quantified as physical or economic loss terms, 70% of the pro-vitamin A of sweet potato was lost after 2-13 months of storage at ambient conditions. In areas where vitamin A deficiency is prevalent this would have a significant effect on health unless ways to delay the loss are employed; for example, lowering the temperature, removal of oxygen and light. Oilseeds and Pulses
The quality and nutrition losses for oilseeds and pulses in were only reported for the OIC Member Country Senegal and this was from the case study on groundnuts. The loss relates to aflatoxin in groundnuts and up to 85% of the crop can be contaminated. It is usually difficult to visually determine if the nuts are contaminated. As well as an impact on health this may also lead to economic losses though loss of export markets. Reducing aflatoxin contamination will benefit consumer health, increased income of actors in the value chains though more confidence in the market and improvement to the environment.

Reducing Postharvest Losses In the OIC Member Countries
141
Fruit and Vegetables
The quality and nutrition losses for fruit and vegetables n OIC Member Countries was only estimated for tomatoes Bangladesh and relates to the loss of vitamin A. Meat and Meat Products
The quality and nutrition losses in OIC Member Countries for meat and meat products has not been estimated. Milk and Dairy Products
The quality and nutrition losses in OIC Member Countries for milk and dairy and products has not been estimated. Fish and Seafood Products
The quality and nutrition losses in OIC Member Countries for fish and seafood products has been estimated in Indonesia to be between 3 and 50% depending on the season and type of fish. 5.1.4. Summary of Comparison of Postharvest Losses Identified in the Literature
Review, Online Survey and Case/Field Studies.
Bringing together the estimates for physical, economic and quality/nutrition losses in the OIC Member Countries along with comparisons with the global situation has highlighted a few lessons and gaps which will be discussed further in the recommendation and policy sections of this document. The bulk of the information obtained from the literature review, online survey and case/desk studies concerned the physical losses. This is because physical losses are easier for people to estimate either by direct measurement or by inspection. In general, the reported information we found suggests that physical losses for all of the commodity groups are similar to that known for the global situation. It should be noted however, that all are estimates and few studies are quantitative. Much less was reported concerning the economic losses and will differ markedly from one value chain for another, even for the same product and commodity. This therefore is an area of research that would require more inputs and due to the high cost of undertaking such work, the target value chains would need to be selected according to economic contribution to the OIC Member Country. In all cases the monetary cost of the losses was significant but it was not always known how the costs were estimated. If the monetary losses could be captured, this will lead to benefits for the consumer and actors in the value chain along with potential benefits to national balance of payments. The least is known regarding the quality/nutrition losses. It is quite possible that this will be critical for countries suffering from nutrition deficiency, particularly calories and vitamins.
5.2. Generic Causes of Postharvest Losses
Postharvest losses and their causes is complex because there are three types of loss being physical, economic and quality/nutrition losses. These losses can occur in all of the case study

Reducing Postharvest Losses In the OIC Member Countries
142
groups undertaken in OIC Member Countries and are summarised in Table. The losses tend to be specific to each commodity crop and probably to the specific value chains for a particular commodity group. For example for cereals physical losses tend to be related to harvesting, drying, transport, threshing and shelling, sorting, marketing and storage as these are the major processing and operation steps for this commodity group while for fruit and vegetables it is poor packaging and transport. Postharvest economic losses were more difficult to quantify but in all cases are related to the commodity group, the specific value chains and where in the value chains the losses occur. Economic losses will be more severe when they occur at the consumer end of the value chain (Naziri et al, 2015) and for higher value commodities such as meat and meat products, dairy and dairy product and fish and seafood products. Nutrition and quality losses are also scantily reported on even in the field and desktop studies. There are some trends that are important those. For example, for biofortified crops (cereals and root and tuber crops) contains vitamin A, this will degrade more rapidly once the commodity has been processed and measures will be required to prevent further losses such as removal of oxygen, and light and or reducing the temperature (Bechoff et al., 2010). These types of nutrition losses will occur in the absence of physical and economic losses and hence will be important for policy makers in decision making. Table 73: Summary of physical, economic and quality losses for the seven OIC commodity groups
Commodity group
Physical losses Economic losses Quality /nutrition losses
Cereals
Related to harvesting, drying, transport, threshing and shelling, sorting, marketing and storage
Related to the value chain, seasonal variation and stage in the value chain where the physical loss occurs
General staples and will lead mainly to calorie losses but also protein, vitamin and minerals. Can be an issue for biofortified cereals, after processing into flour, particularly vitamin A. Some cereals are susceptible to food safety losses through mycotoxins and poor storage will exacerbate this.
Root and Tuber Crops (cassava in Nigeria)
Losses occur at the farm, trading, transport and handling, processing and retail and consumption stages for both Gari and fufu, two main products produced from fresh cassava in Nigeria. Of these the most critical was identified as harvest and processing
Related to the specific value chain, seasonal variation in prices and stage in the value chain where the physical loss occurs. For example economic loss will be greatest if cassava is processed at the consumer end as reported in Naziri et al., 2015.
Physical losses in staples will lead mainly to calorie losses but also protein, vitamin and minerals. Can be an issue for processed biofortified cassava (chips, flour etc.), particularly vitamin A which may degrade rapidly (70% in 2 months example for sweet potato)
Fruit and Vegetables (tomatoes in Bangladesh)
Poor packaging and transport.
Related to the specific value chain, seasonal variation in prices and stage in the value chain where the physical loss occurs. For example economic loss will be greatest if the fruit and vegetable is processed at the consumer end where more economic value accumulates.
Fruit and vegetables are an important source of vitamins and minerals, vitamins and dietary fibre. Losses during processing and storage will be important.

Reducing Postharvest Losses In the OIC Member Countries
143
Commodity group
Physical losses Economic losses Quality /nutrition losses
Oilseeds and pulses
Poor postharvest handling methods. Poor storage and shelling nearer to the point of sale and avoid wetting the nuts when selling. Nuts are often traded when not fully dried.
Related to the specific value chain, seasonal variation in prices and stage in the value chain where the physical loss occurs. For example economic loss will be greatest if oilseeds and pulses are processed at the consumer end where more economic value accumulates.
Physical losses lead to lost protein opportunities in the diet. Critical in the drying and storage process is the prevention of aflatoxin formation which results in a quality loss and a food safety concern.
Meat and meat products (Oman)
For Domestic production. Market distortion by policy makers and no market standards. Slaughter of animals within the household leading to under-use of by-products (offal, blood, skin, hides etc.). Poor feed conversion
Meat and meat products are high value commodities. Related to the specific value chain, seasonal variation in prices and stage in the value chain where the physical loss occurs.
Physical and quality losses lead to lost sources of protein, vitamins, fat and minerals in the diet.
Milk and dairy products
They occur during milking, at milk collection centres, during processing, marketing and consumption
Milk and dairy products are high value commodities. Related to the specific value chain, seasonal variation in prices and stage in the value chain where the physical loss occurs.
Physical and quality losses lead to lost sources of protein, fat, vitamins and minerals in the diet.
Fish and seafood products (Indonesia)
Poor quality raw material due to poor on-board handling is landed and delivered for further processing or on-sale, resulting in economic losses. Excessive soak time in nets results in economic losses. Poor on-shore handling & storage results in economic losses Poor hygiene results in economic losses. Physical losses are generally minimal (less than 5%). However they do occur through discarded by-catch and through pilferage.
Economic losses were the main problem.
Physical and quality losses lead to lost sources protein, vitamins and minerals.
5.3. Consequences of Postharvest Losses in the OIC Member Country
Postharvest food losses can have long-reaching impacts on production, consumption, food security, the environment, and food safety. 5.3.1. Effects on Production
Lost food translates to a number of issues: Lost income for producers and farmers and increased pressures the farming system
for domestic production. For imported raw materials used in food production, this can lead to increased stress
on foreign exchange Increased cost of production which can lead to higher consumer prices Postharvest food losses can result in yield gaps due to shortfalls in plant or animal
nutrition, water management and pest management in the OIC Member Countries.

Reducing Postharvest Losses In the OIC Member Countries
144
5.3.2. Effects on the Value Chain
Postharvest food losses can lead to sub-optimal value chains. Most food processing in the OIC Member Countries is either from raw food materials produced by the domestic market or from imports. The final products are either consumed locally or increasingly exported. As well as increasing demand for raw materials due to waste, this puts pressure on the environment due to the need to dispose of waste, lost income opportunities and can lead to lost calories and lower nutrition for consumers. 5.3.3. Effects on Food Security
Wasted food due to postharvest processing can result in lost calories and lowered nutrition for consumers in the OIC Member Countries, which immediately reduces food security for the community, particularly, householders and small scale producers. Postharvest food losses can lead to these groups becoming more vulnerable to seasonal fluctuations in food supply since food is lost and less income opportunities as money is diverted for food use, since these losses reduce the amount of available processed food that a smallholder farm family can keep for their own consumption. Also this can have a direct effect on malnutrition in the populations resulting in lower consumption of nutritionally valuable perishable foods such those that contain vitamin A which can degrade by up to 70% over a period of 2 months in sweetpotato chips and flour made from orange fleshed sweetpotato (Bechoff et al., 2010). This may have a direct effect on chronic and acute malnutrition rates. 5.3.4. Effects on the Environment
Postharvest food losses can place direct demands on the environment though either the incorrect disposal of waste leading to pollution and odour or in waste disposal costs. Waste can be turned into gains (Sergeant et al., 2015) and this was been achieved for cassava waste in West Africa and Asia. The potential impacts of climate change on postharvest production of food has been explored by Lamboll and Stathers (2014) for cassava processing. Cassava has a very short shelf life after harvest, which may become even shorter with changing climate. Processing can mitigate this and climate change with offer both advantages and disadvantage with respect to drying and storage pests. 5.3.5. Effects on Food Safety
Food safety may have an impact of postharvest production. In food processing and production, where any food which is unsafe is part of a batch, lot or consignment of food of the same class or description, it can be presumed that all the food in that batch, lot or consignment is also unsafe. In these instances, postharvest food losses can increase leading to increased costs to the consumer and losses in income for the producer.
5.4. Current Resource Assessment of OIC Member Countries for Reducing Postharvest Losses
The current status and availability of resources that are presently mobilized to reduce postharvest losses in the OIC Member Countries varied widely by the region, key crops and by value chain.

Reducing Postharvest Losses In the OIC Member Countries
145
5.4.1. Global and Regional Resources
This has already been discussed in the COMCEC on-farm losses study which also discussed resources for postharvest losses. Recent initiatives in addition to those mentioned include the Bill and Melinda Gates Funded APHLIS PLUS project and the EC FP7 Gains for losses from Root and Tuber Crops. We anticipate that studies and actions targeting postharvest losses will continue to be a funded to explore research and extension to reduce food losses and waste along food value chains. APHLIS PLUS is extending the concept of postharvest losses to include nutrition and economic losses which to date have not been systematically examined. In the following sections, staple foods such as cereals, roots, tubers and fruit, and vegetables continue to currently receive the bulk of the funding. Only a handful are exploring economic losses (EC FP7 Gains from Looses of Root and Tuber Crops and APHLIS PLUS) but more projects of this type are anticipated. Individual OIC Member Countries are increasingly part of global and regional alliances. They have access to the CGIAR system and their many research institutes. 5.4.2. International Projects and Programs
A number of international project and programs have been recently funded by the UN, Bill and Melinda Gates Foundation, Rockefeller, European Union and through the CGIAR system via a basket of international donors. The majority of projects, programmes and studies on postharvest food losses have so far focussed on cereals and to a lesser extent fruit and vegetables and root and tuber crops. The focus has been mainly on measuring physical losses and to a less extent economic losses. Recently the APHLIS PLUS project will widen the scope from physical losses to economic and nutrition losses. The EU FP7 Gains from losses on root and tuber crops clearly showed that economic losses are more critical than physical losses whereby two value chains for cassava can have similar levels of physical losses but massively different economic losses depending on whether the losses occur at the farm end or at the consumer end (Naziri et al, 2015). We expect nutritional losses to equally critical. Projects and Programs - Cereals
Table reports projects mentioned by participants in the online survey. The authors have not confirmed the validity of the projects and this list may omit many other projects. Table 74: Projects on cereals
Name of project Target crop/
product
Name of lead organisation
Country Starting year
Website
Postharvest management in Sub-Saharan Africa
Cereals and pulses
HelvetasSwissIntercooperataion
Benin, Mozambique
2013 www.helvetas.org
Market Linkage Project Grains Carana Corporation
Malawi 2009 - 2011
http://www.carana.com/projects/subsaharanafrica/423-market-linkages-initiative

Reducing Postharvest Losses In the OIC Member Countries
146
Name of project Target crop/
product
Name of lead organisation
Country Starting year
Website
Center for food technology and research
Cereals , vegetables , tubes, fish
Benue state university
Nigeria 2014 Cefterbsu.edu.ng
AgResults on-farm grain storage pilot
Maize ASI - Andrew Gatheca
Kenya 2015
TCP/BGD/3404: Establishing Breeding and Postharvest Laboratory of Mushroom in National Mushroom Development and Extension Centre.
Mushroom FAO Bangladesh
2014 www.fao.org
GTFS/BGD/041/ITA: Food Security through Enhanced Agricultural Production Diversified Sources of Income, Value Addition and Marketing in Bangladesh.
Grains, field crops, fruits and vegetables
FAO Bangladesh
2014 www.fao.org
Feed The Future programme UC Davis, USAID
Bangladesh
Projects and Programs – Root and Tuber Crops Table reports projects mentioned by participants in the online survey. The authors have not confirmed the validity of the projects and this list may omit many other projects. Table 75: Projects on root and tuber crops
Name of project Target crop/prod
uct
Name of lead organisation
Country
Starting year
Website
Grains from Losses of root and tuber crops
Cassava and Yam
NRI UK 2012 www.fp7-gratitude.eu
Cassava: Adding Value for Africa I and II
Cassava NRI UK 2008-2019
cava.nri.org/ and cava2.unaab.edu.ng/
Biomassweb project Cassava IITA Nigeria 2013
IITA Postharvest Unit Cassava International Institute of Tropical Agriculture
Nigeria Since 1990s
www.iita.org
production of animal feed with dried peel pellets
Cassava/gari ILRI Nigeria 2014 -
production of fish feed from cassava waste
Cassava/gari GCP21 USA 2015 -
Projects and Programs - Oilseeds and Pulses
No current projects mentioned by online respondents. Projects and Programs. Fruit and Vegetables
Table reports projects mentioned by participants in the online survey. The authors have not confirmed the validity of the projects and this list may omit many other projects.

Reducing Postharvest Losses In the OIC Member Countries
147
Table 76: Projects on fruit and vegetables Name of project Target
crop/product
Name of lead
organisation
Country
Starting year
Website
Postharvest Loss Alliance for Nutrition (PLAN)
Tomatoes, other vegetables, perishables
Global Alliance for Improved Nutrition
Nigeria 2015 www.gainhealth.org
Farmer Advisory services in Tajikistan
Vegetables and fruits
USAID grantee
Tajikistan 2013 completed 2015
-
Value chain development project
Hort crops Udayana University, Dr. I Made Utama
Indonesia recently -
AGLinks Grape DAI - USAID Funded project
Uzbekistan
2011 -
Projects and Programs - Meat and meat products No current projects mentioned by online respondents Projects and Programs - Milk and Dairy products ICARDA led a project (Village based seed enterprises) on losses involving milk and dairy products and cereals in Afghanistan from 2006 to 2014. Projects and Programs - Fish and Seafood products No current projects mentioned by online respondents 5.4.3. Suggestions from Participants of the Online Survey for Reducing Postharvest
Food Losses The experts who participated in the online survey were invited to give suggestions for reducing postharvest losses. The list is not intended to be extensive but indicates a number of generic issues along with commodity group specific ones. Generic suggestions
A number of suggestions were received from the online survey which were generic in that they applied across value chains and commodity groups. These are summarised in Table 77 which groups the suggestions into those related to policy, infrastructure, value chain effectiveness, research and communication and promotion. A detailed discussion of these suggestions is beyond the scope of this study since the factors that will be important will vary from country to country according the contribution of the commodity groups to the national economy, health of the population etc.

Reducing Postharvest Losses In the OIC Member Countries
148
Table 77: Generic suggestions Policy Infrastructure Value Chain
effectiveness Research Communication and
promotion
Policies that better support waste reduction
Encourage private sector involvement
Encourage access to finance
Improve access to energy, water
Better transport (roads)
Improve access to marketing and storage
Training Early career
researchers Value Chain
field schools Farmer
organisations Community
based value chain management initiatives
Research on nutrient loss
More postharvest loss assessment studies
Better understand role of gender
App or web based training materials
Networking Better extension
services Form
communities of practice
Improve linkages between actors in value chains
Suggestions specific to the Commodity Groups
More specific suggestions related to the commodity groups and are listed in Table. The suggestions cover a range of issues specific to the commodities related to processing, environment, varietal selection etc.
Table 78: Specific suggestions related to the commodity groups Commodity Group Suggestions from online respondents Cereals
Research into new technologies such as drying
Root and Tuber Crops
Improved hand peeling methods Improved energy use for drying and processing to reduce costs and
improve the environment Turn biomass into fuel and feed Use waste for aquaculture Breed root and tuber varieties that are easier to peel and produce less
waste Landscape analysis
Oilseeds and pulses
No suggestions made
Fruit and Vegetables Improved storage facilities and ones that use less energy Improve the cold chain Develop pack house facilities
Meat and Meat Products
feed and water scarcity mitigation - especially on alternative sources of feed
abattoir development innovations around meat storage and marketing e.g. simple,
affordable meat kiosk designs
Milk and Dairy Products
Continuation of efforts started by national and international organizations, however on a larger scale
Fish and Seafood Products No suggestions made

Reducing Postharvest Losses In the OIC Member Countries
149
5.4.4. Institutional Support
This has been recently covered in the COMCEC on-farm losses study. Updates include. APHLIS+. The second phase of the Bill and Melinda Gates Funded APHLIS project will add the following functionality
Increase the crop varieties it covers Improve the accuracy of its estimation models Add estimates of value and nutritional losses Provide interactive tools to access the data and underlying models expand the number
of crops beyond cereals and also include nutritional losses. Think.Eat.Save (International) – This initiative, launched by the U.N. Environment Programme and the U.N. Food and Agriculture Organization, works to reverse food loss and food waste by providing consumers, retailers, leaders and the community with advice and ways to take action to reduce their yearly food waste. The campaign aggregates and shares different methods of conserving food, including policy recommendations and steps that consumers and households can take on their own to prevent waste. In 2016, The Rockefeller Foundation launched YieldWise, a $130 million initiative, with the goal of demonstrating how the world can halve food loss by 2030, one of the UN’s sustainable development goals. We will initially focus on fruits, vegetables, and staple crops in Kenya, Nigeria, and Tanzania, where up to half of all food grown is lost.

Reducing Postharvest Losses In the OIC Member Countries
150
6. POLICY RECOMMENDATIONS
This analysis has shown that the postharvest space as defined by the OIC Member Countries suffers substantial quantitative and qualitative losses. Aggregation of these losses and application of real economic values, though fraught with complexity and methodological challenges, quickly produces large figures against which investment and the application of scarce resources is an easy case to make. Differentiating between the cause of loss and who within the postharvest space incurs cost of that loss has proven very hard for policy makers and may explain why, to a large extent, the postharvest space has seen less investment that the pre-harvest one. Notwithstanding, the application of small packets of resources (i.e., seed money), promotion of a loss reducing culture and incentivisation of different sectors of national agricultural economies across OIC Member Countries can, we believe, have substantial short and long term benefits and impact. The evidence would seem to suggest that a coordinated effort to consider infrastructure investment from the point of view of its impact on postharvest losses has, to date, not been feasible or considered. Development of both rural and urban infrastructure (e.g., roads, markets and storage) and community assets (e.g., drying, storage, processing and preservation) could be reconsidered with postharvest losses in mind. At the level of individual or groups of OIC Member Countries, it would seem that no specific policies on postharvest food losses exist. Postharvest losses are often mentioned in national plans for agriculture, but the over-arching effort to identify projects or include activities in funding streams is rather limited. One reason for this is that policy makers find it hard to concretise the benefits of investment in reducing postharvest losses: measurement is difficult, quantification of value is hard and identifying who captures the benefits is less certain than other types of investments. Considering the level of individual commodity chains or clusters, the issue of incentives to develop better postharvest practices and invest in postharvest infrastructure would seem to be key. It is common for agricultural value chains across OIC Member Countries to have developed a least quality and low value ethos, with limited rejection of poor quality and minimal investment in infrastructure by chain actors. This type of value chain tends to have the highest postharvest losses, the risk and cost of which is usually born at the level of farm-gate sales. The real impacts of postharvest losses, are born by producers, in terms of lower prices, or by consumers, in terms of higher prices or poorer quality food, including less nutrition, and reduced food safety. Having identified this, the challenge faced by Member Countries is how to develop a comprehensive policy framework for agricultural and agribusiness development that identified and addresses postharvest losses.
6.1. General Recommendations
The prevalence of high postharvest losses across OIC Member Countries and throughout the different commodity value chains analysed highlights the need for an urgent and systematic review of policies that promote loss reduction. In this regard, ten areas where action can reduce postharvest losses are as following:

Reducing Postharvest Losses In the OIC Member Countries
151
Quantification
Member Countries need help to locate and quantify postharvest losses. For some commodities, methods are easily available (e.g. APHLIS), but for others, for example livestock, no standard approach has ever been developed. Development of baseline data on postharvest losses is needed for strategic commodities, and this should be done using a standard approach to allow target setting and country/commodity comparison to take place.
Recommendation 1: To set up national postharvest loss reduction coordination committees with the specific aim of identifying, prioritising and sharing postharvest losses data and practices across a range of strategic commodities. Resources
Investments are needed to reduce postharvest losses and to upgrade existing value chains at several levels. Research on postharvest issues is very sparse among OIC Member Countries. The link between investment in all kinds of infrastructure and the benefits that can be gained from reduced postharvest losses is poorly understood. Engagement with the private sector to promote investment in reduced losses is particularly weak.
Recommendation 2: To promote a consistency of approach, an OIC wide postharvest losses reduction coordination body should be initiated with the aim of using consistent methods, sharing best practice and promoting system wide efforts. Capacity
The range of knowledge about postharvest losses and how to address them is extremely variable across OIC Members Countries and commodities. However, examples of good practice and recent research do exist (e.g., fisheries in Indonesia, cassava in Nigeria and wheat in Egypt).
Recommendation 3: To promote capacity building and sharing among OIC Member Countries through a series of commodity-by-commodity ‘best practice’ workshops leading to a future OIC postharvest loss reduction symposium. Scope
This analysis has shown that even expert stakeholders struggle to understand the difference between physical and economic losses, let along adding some of the other types of loss that are known to exist such and nutritional and environmental. Addressing this weakness would be a task for the postharvest losses coordination body (recommendation 2 above). Engagement of value chain actors
Literature, case studies and surveys show that important constraints to the uptake of new practices that reduce postharvest losses relate to fully engaging actors along and across the different target value chains. Good practice seems to be associated with strong engagement, for example, where industries fully commit and farmers associations fully buy-in, such as the early development of hermetic bags for grain in some parts of Africa. In countries where there are existing and dynamic commodity organisations (e.g., the Ugandan dairy sector), advocacy draws strategic resources into postharvest loss reduction.
Recommendation 4: To facilitate local, national and, potentially, regional multi-stakeholder commodity platforms.
Reducing Postharvest Losses In the OIC Member Countries
152
Financial services
A key, but largely unmeasured, factor that can cause or exacerbate postharvest losses is finance. In most commodities analysed, the availability of capital to a) clear the market of product that is deteriorating and b) provide infrastructure to support (a) such as refrigeration, storage and processing equipment, was seen as an important postharvest loss cause.
Recommendation 5: To work with financial service providers to investigate the possibility of developing specific postharvest loss reduction instruments. The agency of agribusiness
Several examples emerged from this analysis of agribusinesses who were keen to engage in addressing postharvest losses beyond their factory gates, but who were uncertain how to start such a process. By facilitating the role of key agribusinesses in postharvest loss reduction, OIC Member Countries could leverage significant additional resources from the private sector.
Recommendation 6: OIC Member Countries should consider developing projects that specifically engage private sector agribusiness actors in identifying and reducing postharvest losses either backwards, within their own supply chains or forwards, among consumers of their products. A challenge fund would be a good way to support such initiatives.
Recommendation 7: OIC Member Countries should agree to consistently approach postharvest loss analysis and subsequent actions with gender differentiation in mind and to consider groups in society who may not benefit from losses reduction interventions.
Recommendation 8: A competition to develop postharvest loss reduction ICTs could have a disproportionately high impact to cost ratio in OIC Member Countries.
Recommendation 9: Close scrutiny by analysis of policy makers of by-products, particularly where high volumes can be achieved, can result in strategic investment opportunities for by-product upgrading and reduced postharvest losses.
Recommendation 10: If postharvest losses are to be addressed, a system of measuring them at a strategic level should be considered and promoted to national agricultural statistics bodies.
6.2. Towards a Policy Framework for Reducing Postharvest Losses at the National Level in OIC Member Countries
A challenge for policy maker in many OIC countries is that for postharvest losses, they are generally more complex than pre-harvest losses due to the greater diversity of products and end uses and markets that the products are directed at. Policy makers may be able to prioritise which commodity groups and value chains to focus resources on using the following policy strategy for postharvest loses by identifying the following:
a) Which commodity food group is the most important in terms of economic contribution to the national economy?
b) Which commodity food group is the most important in terms of national consumption? c) Which commodity food group is the most important to the nutrition of specific
vulnerable groups?

Reducing Postharvest Losses In the OIC Member Countries
153
d) Which commodity food group is the most vulnerable to food safety risks for the national population?
Having identified the commodity groups for a), b), c) and d) decisions can be taken regarding identifying the value that are most important according the criteria selected. This suggested policy strategy decision tree for prioritising value chains with greatest postharvest losses and impact is shown in Figure. More work is proposed to test and develop this approach. Figure 21: Suggested Policy decision tree for selecting priority value chains when postharvest losses can have the greatest impact
COMMODITY GROUPSCereals
Root and Tuber CropsOilseeds and PulsesFruit and vegetables
Meat and Meat productsMilk and Dairy productsFish and Fish products
Is the commodity food group the most important in terms of economic contribution to
the national economy
Is the commodity food group vulnerable to food
safety risks for the national population in postharvest
production?
Is the commodity food group the most important to the
nutrition of specific vulnerable groups
Is commodity food group the most important in
terms of national consumption
Yes No
PRIORITY VALUE CHAINS FOR POSTHARVEST LOSSES IN AN
OIC MEMBER COUNTRY IDENTIFIED
STOP Yes No STOP Yes No STOP Yes No STOP
Source: Authors own suggestion

Reducing Postharvest Losses In the OIC Member Countries
154
CONCLUSION
Progress in postharvest food loss assessment and reduction is in its infancy in OIC Member Countries there remain many gaps in knowledge and information relating to the food groups of interest in this study. Where progress has been made it is in measuring or estimating physical losses only. There are a handful of studies that investigated economic losses and only one has estimated nutritional losses and this was for cereals. There is limited information for postharvest losses in the value chains in each of the OIC Member Countries and losses appear to be similar in each group using a variety of approaches being
a) Overview of literature, b) Online survey of experts and c) Case study of selected country/commodity groups.
The losses reported, however, do generally appear to be lower than the figures mention by the FAO but sometimes higher. However, since these figures are estimates, there is no method to determine who is correct without further research since this study is only a review with three field visits where no postharvest loss research was undertaken. More research is necessary but this is complex because for postharvest losses, the diversity of products and value chains are vast and complex. Such research is also costly; for selecting priority value chains when postharvest losses can have the greatest impact a policy decision tree has been suggested here. This may help countries with limited resources and expertise to make progress on postharvest losses that has the maximum impact according to national priorities and goals in each OIC Member Country. A total of six recommendations arose from this review and analysis. These covered a range of issues from the establishment of national postharvest loss reduction coordination committees, promote a consistency of approach among the OIC Member Countries where feasible, encourage capacity building and sharing among the OIC Member Countries, facilitating local, national and, potentially, regional multi-stakeholder commodity platforms, working with financial service providers to investigate the possibility of developing specific postharvest loss reduction instruments and to consider developing projects that specifically engage private sector agribusiness actors in identifying and reducing postharvest losses.
Reducing Postharvest Losses In the OIC Member Countries
155
REFERENCES
Ababouch, L. (1990). Histamine in fishery products: a review. Proceedings of the FAO expert consultation on fish technology in Africa. Abidjan, Côte d’Ivoire, 25 –28 April 1988. FAO-Fisheries Report, n. 4000: pp. 44 –50
Abila, R.O. (2003). Fish trade and food security: are they reconcilable in Lake Victoria? In: FAO, Report of the Expert Consultation on International Fish Trade and Food Security, Casablanca, Morocco, 27–30 January, 2003. FAO Fisheries Report No. 708. Rome, Food and Agricultural Organization: pp. 128–153
Abdulsalam-Saghir P, Bennett B, Quaye W, Tu Viet Phu, Sanni L and Martin A, (2015), Gender analysis of households’ decision-making to reduce postharvest losses of cassava in Ghana, Nigeria and Vietnam, Food Chain Journal.
Acedo A. L. Jr. and Md. Atiqur Rahman (Bangladesh translation) (2016) Establishing and managing smallholder vegetable packhouses to link farms and markets. A training manual. AVRDC – The World Vegetable Center South Asia. http://203.64.245.61/fulltext_pdf/EB/2016-2020/eb0259.pdf (accessed 21.6.16)
Adegboyega Eyitayo Oguntade (2013) Food losses in cassava and maize value chains in Nigeria: Analysis and recommendations for reduction strategies, published by Deutsche Gesellschaft für Internationale Zusammenarbeit (GIZ) GmbH (https://www.giz.de/fachexpertise/downloads/giz2013-en-reducing-food-losses-improve-food-security.pdf)
Adibli K.E. (2009) “Groundnut production in freefall in Senegal”, Africa, Development and Aid. www.ipsnews.net/2009/agriculture-senegal-groundnut-production-in-freefall/
Affognon, H,. Mutingi, C., Sanginga and C. Borgemeister. (2015), “Unpacking Postharvest Losses in Sub-Saharan Africa: a Meta-Analysis”, World Development. Volume 66. pp 49-68.
Agroprocess (1985). Grain quality, grain testing and quality control project: World Bank/ Pakistan Grain Storage Project: Consultant’s (R.W.D. Taylor) Inception Report. 40pp.
Ahmad, F., (2009). Food security in Pakistan. Pakistan Journal of Agricultural Science, 46(2): 83-89. http://pakjas.com.pk/papers%5C100.pdf
Ahmad, S.I., Afzal, M. (1984). Harvest and postharvest losses in wheat. Prog. Farm., 4: 31-35.
Ahmed, A.U., Bouis, H.E., Gutner, T., Lofgren, H., (2001). The Egyptian food subsidy system: structure, performance, and options for reform. Research report, 119. IFPRI, Washington DC.
Ahmed, E., Brooks, J.E., (1986a). A survey of vertebrate pest infestations in provincial grain storage facilities in North West Frontier Province and Balochistan. Technical Report No. 5, Government of Pakistan, United States of America Department of International Development, Denver Wildlife Research Center, National Agricultural Research Center, Islamabad, 13pp.
Ahmed, E., Brooks, J.E., (1986b) Vertebrate pest infestations in provincial food storage facilities in Pakistan. Technical Report No. 7, Government of Pakistan, United States of America Department of International Development, Denver Wildlife Research Center, National Agricultural Research Center, Islamabad, 11pp.

Reducing Postharvest Losses In the OIC Member Countries
156
Ahmed, E., Hussain, I., Brooks, J.E., (1995). Losses of stored foods due to rats at grain markets in Pakistan. International Biodeterioration and Biodegradation 36, 125–133.
Ahmed, M. S. (2013) Needs Assessment of Postharvest Handling and Storage for Selected Vegetable Crops in Bangladesh. Key findings of a study key findings of a study by Dr Md. Saleh Ahmed, consultant of AVRDC - The World Vegetable Center. Unpublished consultant report prepared for AVRDC)
Ahmedani, M.S., Haque, M.I., Afzal, S.N., Naeem, M., Hussain, T., Naz. (2011). Quantitative losses and physical damage caused to wheat kernel (Triticum aestivum L.) by khapra beetle infestation. Pak. J. Botanical, 43(1): 659-668.
Akande G R, Jeffries D, Ward A (2000) Fish Loss Assessment method research. DFID Postharvest Fisheries Research Project Paper R7008. NRI, Chatham, UK.
Akande, G. and Diei-Ouadi, Y. (2010). Postharvest losses in small-scale fisheries: case studies in five sub-Saharan African countries. FAO Fisheries and Aquaculture Technical Paper No. 550, Food and Agriculture Organization of the United Nations, Rome. 72pp.
Akhter, R. (2010) Postharvest losses of tomato and local knowledge for minimisation: A study in Bogra district. BAU, Mymensingh http://rda.gov.bd/file_uploads/169.pdf (accessed 21.6.160
Alam, A.K.M. (2010). Postharvest Loss Reduction in Fisheries in Bangladesh: A Way Forward to Food Security. Final Report PR 5/08
Alam, M.F., Palash, M.S., Mian, M.I.A. and Dey, M.M. (2012). Marketing of major fish species in Bangladesh: A value chain analysis. A report submitted to Food and Agriculture Organization for the project ‘A Value-chain Analysis of International Fish Trade and Food Security with an Impact Assessment of the Small-scale Sector’
Alam, M.S., Ahmed, M., (1989). Development of resistance in pests of stored grain against phosphine and contact insecticides in Pakistan. Report No. 7, Grain Quality Preservation Group, Pest Management Research Institute, Karachi, Pakistan. 31 pp.
Alam, S. M. K., Hassan, A. S., Kassan, M. K., and Azad, A. K. (2015) A manual on postharvest handling of tomato. Crops Division, Bangladesh Agricultural Research Council (BARC) https://ia601307.us.archive.org/14/items/BookBARCCropsTomatoEnglish/BookBARCCropsTomatoEnglish.pdf (accessed 28.6.16)
Aliro, E. B. (2012). Lake Victoria fisheries. Official Publication of the East African Community – 10 years of regional integration – integrating Burundi, Kenya, Rwanda, Tanzania and Uganda (eds.)
Allison, E.H. (2011). Aquaculture, Fisheries, Poverty and Food Security. Working Paper 2011-65. The WorldFish Center
Allison, E.H., Delaporte, A. and Hellebrandt de Silva, D. (2013). Integrating fisheries management and aquaculture development with food security and livelihoods for the poor. Report submitted to the Rockefeller Foundation, School of International Development, University of East Anglia Norwich, UK. 124pp.
Al-Sadi, A. M., Aljulandaal-Said, F., Al-Kaabi, S., Al-Quraini, S. M., Al-Mazroui, S., Al-Mahmooli, I. and Deadman, M. L. (2011) Occurrence, characterization and management of fruit rot of

Reducing Postharvest Losses In the OIC Member Countries
157
immature cucumbers under greenhouse conditions in Oman. Phytopathol. Mediterr. (2011) 50, 421−429 http://www.fupress.net/index.php/pm/article/viewFile/9364/9882
Al-Sharafat, A,. and T. M. Al-fawwaz, (2013), “Economic Analysis of Different Broiler Farm Capacities: A Case Study of Jordan”, International Journal of Business and Management, Vol. 8, No. 5, pp 41-47.
Alverson, D.L., Freeberg, M.H., Murawaski, S.A. and Pope, J.G. (1994). A global assessment of fisheries bycatch and discards. FAO Fisheries Technical Paper No. 339, Food and Agriculture Organization of the United Nations, Rome
Ames, G., Clucas, I. and Paul, S.S. (1991). Postharvest losses of fish in the tropics. Natural Resources Institute, UK
Amusa, N.A. Adegbite, A.A., Muhammed, S. and Baiyewu, R.A. (2003) Yam diseases and its management in Nigeria. African Journal of Biotechnology 2, 497-502.
Anihouvi, V.B., Kindossi, J.M., Hounhouigan, J.D. (2012). Processing and quality characteristics of some major fermented fish products from Africa: A critical review, International Research Journal of Biological Science 1(7): pp. 72- 84
Anim-Somuah H., Spencer Henson, John Humphrey and Ewan Robinson (2013) “Strengthening Agri-Food Value Chains for Nutrition: Mapping Value Chains for Nutrient-Dense Foods in Ghana”, Report produced by Institute of Development Studies, March 2013.
Anim-Somuah H., Spencer Henson, John Humphrey and Ewan Robinson (2013) “Strengthening Agri-Food Value Chains for Nutrition: Mapping Value Chains for Nutrient-Dense Foods in Ghana”, Report produced by Institute of Development Studies, March 2013.
Anteneh B, Tegegne A, Beyene F and B Gebremedhin, (2010), “Cattle milk and meat production and marketing systems and opportunities for market-orientation in Fogera woreda, Amhara region, Ethiopia”. Improving Productivity and Market Success of Ethiopian Farmers Project Working Paper 19. International Livestock Research Institute, Nairobi, Kenya.
APHLIS Network (2016). www.aphlis.net
Arah, I. K., Kumah, E. K., Anku, E. K. and Amaglo, H. (2015) an overview of postharvest losses in tomato production in Africa: Causes and Possible Prevention Strategies. Journal of Biology, Agriculture and Healthcare
Aral, A., M. S. Arikan., et al. (2014). Economic losses due to live weight shrinkage and mortality during broiler transport. Vet Fak Derg, Volume 61. pp 205-210.
Arsenault, J. E., Yakes, E.A., Islam, M. M., Hossain, M.B., Ahmed, T., Hotz, C., Lewis, B., Rahman, A. S., Jamil, K. M., Brown, K. H. (2013) Very low adequacy of micronutrient intakes by young children and women in rural Bangladesh is primarily explained by low food intake and limited diversity. J Nutr. 43(2):197-203 http://www.ncbi.nlm.nih.gov/pubmed/23256144 (accessed 30.6.16)
AU (2014) Malabo Declaration on Accelerated Agricultural Growth and Transformation for Shared Prosperity and Improved Livelihoods. African Union.
Bala, B.K., (1978). Postharvest losses of paddy in Bangladesh. AMA, 9(4): 54-56. Tokyo, Japan.

Reducing Postharvest Losses In the OIC Member Countries
158
Bala, B.K., Haque, M.A., Anower Hossain, Md., Majumdar, S., (2010). Postharvest loss and technical efficiency of rice, wheat, and maize production system: assessment and measures for strengthening food security. Final Report CF # 6/08
Balikowa, D. (2011), Dairy Development in Uganda - A Review of Uganda’s Dairy Industry, Report for project GOU/FAO Dairy Project, TCP/UGA/3202(D).
Baloch, U.K., (1986). Postharvest research in food grains in Pakistan. Pak. Agric. Res. Council, Islamabad, 45.
Bancroft (2000) Relieving Postharvest constraints and identifying opportunities for improving the marketing of fresh yam in Ghana. ZB0016 R6505 Final Technical Report. 1 Jan. 1996-31 Mar. 2000. Natural Resources Institute, University of Greenwich.
Baoua, I.B., Amadou, L., Abdourahmane, M., Bakoye, O., Baributsa, D., Murdock, L.L. (2015). Grain storage and insect pests of stored grain in rural Niger. Journal of Stored Products Research, 64: 8-12.
Barker B (2016) “Postharvest storage of pulses: tips for safe storage” - http://proof.saskpulse.com/files/general/150824_Post_harvest_storage.pdf
Barrett. C. (2013) eds. Food security and socio political stability. Oxford University Press
Minten, B., , Reardon T., Das Gupta S., Hu D. and Murshid K.A.S (2016) Wastage in Food Value Chains in Developing Countries: Evidence from the Potato Sector in Asia, Food Security in a Food Abundant World. 2016, 225-238
Bechoff, A., Westby, A., Owori, C., Menya, G., Dhuique-Mayer, C., Dufour D. and Tomlins K. (2010) Effect of drying and storage on the degradation of carotenoids in orange-fleshed sweet potato varieties, Journal of the Science of Food and Agriculture, 90, 622-629
Bechoff, A., Dhuique-Mayer, C., Dornier, M., Tomlins, K. I., Boulanger, R., Dufour, D. and Westby, A., (2010) Relationship between the kinetics of β -carotene degradation and formation of norisoprenoids in the storage of dried sweet potato chips, Food Chemistry, 121, 348-357
Belton, B., van Asseldonk, I.J.M., and Thilsted, S.H. (2014). Faltering fisheries and ascendant aquaculture: Implications for food and nutrition security in Bangladesh. Food Policy 44: pp. 77–87
Béné, C., Barange, M., Subasinghe, R., Pinstrup-Andersen, P., Merino, G., Hemre, G. and Williams, M. (2015). Feeding 9 billion by 2050 – Putting fish back on the menu. Food Sec. 7, pp.261–274
Béné, C., Macfadyen, G., and Allison, E. H. (2007). Increasing the contribution of small-scale fisheries to poverty alleviation and food security. FAO Fisheries Technical Paper, No. 481. Food and Agriculture Organization of the United Nations, Rome
Bennett, B., and Peters, K.J. (2009), Improving Market Opportunities – Changing Demand and Market Institutions; Review of ILRI Programmes on behalf of the Commission of the European Communities.
Beveridge, M.C., Thilsted, S.H., Phillips, M.J., Metian, M., Troell, M., Hall, S. J. (2013). Meeting the food and nutrition needs of the poor: the role of fish and the opportunities and challenges emerging from the rise of aquaculture. Journal of Fisheries Biology 83: pp. 1067-1084

Reducing Postharvest Losses In the OIC Member Countries
159
Bjorndal, T., Child, A. and Lem, A. eds. (2014). Value chain dynamics and the small-scale sector: policy recommendations for small-scale fisheries and aquaculture trade. FAO Fisheries and Aquaculture Technical Paper No. 581. Food and Agriculture Organization of the United Nations, Rome. 112pp.
Bledsoe, G. and Dan Cruz-DePaula, D. (2009). Cold chain and storage action plan. USAID Private Sector Competitiveness Enhancement Program http://pdf.usaid.gov/pdf_docs/Pnadt141.pdf
Blond, R.D. (1984). The agricultural development systems project in Egypt. Univ. Calif. Davis. p.42-48, 190-194.
Bolorunduro, P.I., Adesehinwa, A.O.K and Ayanda, J.O. (2005). Adoption of improved fish preservation technologies in Northwestern Nigeria. Tropiculture, 23: pp.117-123
Bourne, M., (1977), Post Harvest Food Losses – the Neglected Dimension in Increasing the World Food Supply, Connell International Agriculture Mimeograph 53, Ithaca, New York.
Boxall, R.A., (1998). Grain postharvest loss assessment in Ethiopia. Final report, NRI Report No. 2377.
Bruinsma, J., (2009). The resource outlook to 2050. In: Expert meeting on ‘How to feed the world in 2050’: FAO, Rome.
Buyukbay, E. O., Uzunoz, M. and Bal, H. S. G. (2011) Postharvest losses in tomato and fresh bean production in Tokat province of Turkey. Scientific Research and Essays Vol. 6(7), pp. 1656-1666
Calverley, D.J.B. (1996). A study of loss assessment in eleven projects in Asia concerned with rice. FAO, Rome
Carlton Jones, Joe l Bryce, John Vink and Alex Behar (2015). Reducing Postharvest Loss Through a Market-Led Approach: Lessons from Smallholder Farmer Sourcing in Kenya’s Mango Value Chain & Mozambique’s Cassava Value Chain, Rockefeller Foundation Report, Deloitte Touche Tohmatsu Limited (https://www.google.co.uk/?gfe_rd=cr&ei=CtdzV-aeCPLR8geczqvoCQ&gws_rd=ssl)
Caswell, N. “Peasants, Peanuts and Politics: State Marketing in Senegal, 1966-80. (1985) Marketing Boards in Tropical Africa Arhin K, P. Hesp and L. van der Laan, eds., pp. 79-119, London: KPI Limited.
Cauthen, J., Jones, D., Gugerty, M. K. and C. Leigh Anderson (2013) Banana and Plantain Value Chain: West Africa EPAR Brief No. 239 https://evans.uw.edu/sites/default/files/public/Evans_UW_Request_239_West_Africa_Bananas_and_Plantains_01_08_14_final_0.pdf
Chambers, R. (1994). The origins and practice of participatory rural appraisal. World Development 18 (22): pp. 953-969
B.D. Mignouna, T. Abdoulaye, A.D. Alene, R. Asiedu, and V.M. Manyong (2014) Characterization of Yam-growing Households in the Project Areas of Nigeria. International Institute of Tropical Agriculture (IITA). 92 pp.
Chaudhary, M.A., (1980). Food grain losses at farm level in Pakistan. Vol 1. Dept. Agric. Marketing, Univ. Agric. Faisalabad.
Reducing Postharvest Losses In the OIC Member Countries
160
Cheke, R.A. and Ward, A.R. (1998). A model for evaluating interventions designed to reduce postharvest fish losses. Fisheries Research 3: pp. 219-227
Christopher Mutungi & Hippolyte Affognon (2013) Mitigating food losses in Benin: Status and Way Forward for Postharvest Research and Innovations, ICIPE Policy Brief NO. 2/13
CIDA, (1980). Foodgrains storage and handling master plan: Pakistan. Executive Summary. 29pp.
CIMMYT, (2011). Effective grain storage for better livelihoods of African farmers project. Completion report, June 2008: February 2011. 65pp.
COMCEC COORDINATION OFFICE (October, 2015), Promoting Agricultural Value Chains In the OIC Member Countries, Standing Committee for Economic and Commercial Cooperation of the Organization of Islamic Cooperation.
Courtbaoui, P. and Ngadi, M. (2016) Characterization of postharvest practices and losses of fresh produce along the Caribbean supply chain: Guyana and St. Kitts-Nevis. IDRC http://idl-bnc.idrc.ca/dspace/handle/10625/55514
Dairy Development Authority (2016) http://www.dda.or.ug/. Uganda. Website accessed 28/04/2016
Davies, B., Baulcombe, D., Crute, I., Dunwell, J., Gale, M., Jones, J., Pretty, J., Sutherland, W., Toulmin, C., (2009). Reaping the benefits: science and the sustainable intensification of global agriculture. Royal Society, London.
Davies, R.W.D., Cripps, S.J., Nickson, A. and Porter G. (2009). Defining and estimating global marine fisheries bycatch. Marine Policy: doi:10.1016/j.marpol.2009.01.003
De Graaf, G. & Garibaldi, L. (2014). The value of African fisheries. FAO Fisheries and Aquaculture Circular No. 1093. Food and Agriculture Organization of the United Nations, Rome
De Lima, C.P.F., (1979). The assessment of losses due to insects and rodents in maize stored for subsistence in Kenya. Tropical Stored Products Information, 38: 21-25.
Delgado, C. L., M. Rosegrant, et al. (1999). Livestock to 2020: the Next Food Revolution. Food, Agriculture and the Environment Discussion Paper 28. Washington, International Food Policy Research Institute.
Dey, M.M., Bose, M.L., Alam, M.F. (2010). Demand for aquaculture development: perspectives from Bangladesh for improved planning. Reviews in Aquaculture 2: pp. 16–32
Diei-Ouadi, Y., Komivi Sodoke, B., Ouedraogo, Y., Adjoa Oduro, F., Bokobosso, K. and Rosenthal, I. (2015). Strengthening the performance of postharvest system and regional trade in small-scale fisheries – Case study of postharvest reduction in the Volta Basin riparian countries, FAO Fisheries and Aquaculture Circular No. 1105, Food and Agriculture Organization of the United Nations, Rome FAO (1995). Code of Conduct for Responsible Fisheries Rome, Food and Agriculture Organization of the United Nations, Rome. 41pp.
Egyir, I. S., and D. B. Sarapong, (2011), “M&E System for Postharvest Losses (Pilot Study)”. Final Report submitted to the Policy Planning, Monitoring and Evaluation Directorate, Ministry of Food and Agriculture, Accra, Ghana.

Reducing Postharvest Losses In the OIC Member Countries
161
Egyir, I. S., and D. B. Sarapong, (2011), “M&E System for Postharvest Losses (Pilot Study)”. Final Report submitted to the Policy Planning, Monitoring and Evaluation Directorate, Ministry of Food and Agriculture, Accra, Ghana.
Egyir, I.S., Sarpong, D.B., Obeng-Ofori, D. (2011). M&E system for postharvest losses (pilot study). Policy planning, monitoring and evaluation directorate, Ministry of Food and Agriculture, Ghana. Final report, pp106.
El Lateif Aita et al. (2012), Best Available Techniques (BAT) for the Dairy Industry in Egypt. Final report, Boosting Best Available Techniques in the FAOSTAT (2013). Commodities by country – Saudi Arabia. In: COMCEC COORDINATION OFFICE (October, 2015),
Elhadi M. Yahia (2005) Postharvest technology of food crops in the near east and North Africa (Nena) region In. Crops: Quality, Growth and Biotechnology. Publisher: WFL Publisher, Helsinki, Finland, Editors: R Dris, pp.643-664
El-Lakwah, F., (1984). Situation of storage and protection of stored commodities against storage pests especially at farmer’s level in Egypt. 17th Int’l. Congress of Entomology, Hamburg, 20-26 Aug.
El-Lakwah, F., (1995). Postharvest system of cereal grains in Egypt. FAO, Rome. http://www.fastonline.org/CD3WD_40/INPHO/VLIBRARY/MOVE_REP/X0291E/EN/X0291E00.HTM
El-Lakwah, F., Darwish, A., El-Khayat, E., Abdel-Latief, A., (1993). Grain storage situation and loss caused by stored product insects in the Kaluubia Governorate, Egypt. Journal of Applied Science, 8(2): 325-334.
El-Lakwah, F., Laborius, A., (1995). Determination of weight losses of wheat stored in shounas of the Principal Bank of Development and Agricultural Credit in various Governates in Egypt. Annals of Agric Science, Moshtohor, Zagazig Univ.
El-Lakwah, F.A., El-Kashlan, I.H., (1999). Efficiency of Neeazal (powder 10%) against some stored product insects. Alexandria Journal of Agricultural Research, 44: 271-283.
El-Rafie, M.S., Abo-El-Ghar, M.R., Metwally, F.A., Rafie, M.S., El-Gha, M.R.A., (1970). Further studies on certain grain protectants. Bulletin of the Entomological Society of Egypt, 4: 81-88.
El-Shanshoury, A.E-R.R., El-Sabbagh, S.M., Emara, H.A., Saba, H.E., (2014). Occurrence of moulds, toxigenic capability of Aspergillus flavus and levels of aflatoxins in maize, wheat, rice and peanut from markets in central delta provinces, Egypt. International Journal of Current Microbiology and Applied Sciences, 3(3): 852-865.
Enkono S., Kalaunda S. and Thomas, B. (2014), “Analysis of factors influencing cattle off-take rate and marketing in Ndiyona constituency of Kavango Region, Namibia”, Journal of Agriculture Extension and Rural Development, Vol.5 (9), pp.201-206.
Esguerela, E., Rahman, A. and Saha. M. G. (2016) Postharvest losses on tomatoes and mangoes. Report to the FAO.
EU (undated) Discarding and the landing obligation.
Eves A, Brown R (1993) the effect of traditional drying processes on the nutritional value of fish. Tropical Science Vol 33.

Reducing Postharvest Losses In the OIC Member Countries
162
FAO (1998) Fisheries Department. Responsible fish utilization. FAO Technical Guidelines for Responsible Fisheries. No. 7. Rome, 33p.
FAO (2003) Milk and Dairy Products, Postharvest Losses and Food Safety in Sub-Saharan Africa and the Near East; the Small Scale Dairy Sector – Ethiopia, by Getachew Felleke,
FAO (2003) Milk and Dairy Products, Postharvest Losses and Food Safety in Sub-Saharan Africa and the Near East; the Small Scale Dairy Sector – the Syrian Arab Republic, by; FAO Prevention of Food Losses Programme.
FAO (2008). An Introduction to the Basic Concepts of Food Security, Accessible at: http://www.fao.org/docrep/013/al936e/al936e00.pdf
FAO (2009). The state of world fisheries and aquaculture 2008. FAO Fisheries and Aquaculture department, Food and Agriculture Organization of the United Nations, Rome
FAO (2013), Milk and Dairy Products in Human Nutrition; Editors: Ellen Muehlhoff, Anthony Bennett, and Deirdre McMahon; United Nations Food and Agriculture Organization, Rome.
FAO (2013), Milk and Dairy Products in Human Nutrition; Editors: Ellen Muehlhoff, Anthony Bennett, and Deirdre McMahon; United Nations Food and Agriculture Organization, Rome.
FAO (2013). Food wastage footprint, Impact on natural resources. Summary report. Food Wastage Footprint and FAO, Rome
FAO (2013b) Food Losses and Waste in Turkey; Country Report prepared F.F.Tatlıdil, İ.Dellal, Z. Bayramoğlu; Food and Agriculture Organization of the United Nations, Regional Office for Europe and Central Asia.
FAO (2014a). The State of World Fisheries and Aquaculture 2014. Food and Agriculture Organization of the United Nations, Rome. 223 pp
FAO (2014b). Fishery and Aquaculture Country Profiles. Bangladesh. Country Profile Fact Sheets. In: FAO Fisheries and Aquaculture Department [online]. Rome. Accessible at http://www.fao.org/fishery/facp/BGD/en
FAO (2014c). FAO Statistical Yearbook 2014. Asia and the Pacific food and agriculture. Food and Agriculture Organization of the United Nations, Rome
FAO (2014d). Food Losses and Assessment: Causes and Solutions. Kenya. SAVE FOOD: Global Initiative on Food Loss and Waste Reduction, Food and Agriculture Organization of the United Nations, Rome
FAO (2014e). “Global Initiative on Food Losses and Waste Reduction: Framework of food loss”. Working Paper, Food and Agriculture Organization of the United Nations, Rome
FAO (2015). Strategy for Improving Information on Status and Trends of Capture Fisheries - Web site. Small-scale fisheries. FI Institutional Websites. In: FAO Fisheries and Aquaculture Department [online]. Rome http://www.fao.org/fishery/fishcode-stf/activities/ssf/en
FAO (2016) http://www.fao.org/ag/ags/postharvest-management/milk-dairy/milk-and-dairy-products-postharvest-losses-and-food-safety-in-sub-saharan-africa-and-the-near-east-pfl/en/ (accessed, 21-04-2016).

Reducing Postharvest Losses In the OIC Member Countries
163
FAO (2016) Regional Conference on Food Security and Income Generation through Reduction of Losses and Waste in Fisheries, 15 -17 December 2013, Nouakchott, Islamic Republic of Mauritania (in press).
FAO and AfDB (2009) Framework Paper on Postharvest Loss Reduction in Africa
FAO and INPhO, (1998). African experience in the improvement of postharvest techniques. Based on a workshop in Accra, Ghana, 4-8 July 1994. FAO, Rome. http://www.fao.org/docrep/W1544E/W1544E05.htm
FAO and World Fish Center (2008). Small-scale capture fisheries: A global overview with emphasis on developing countries. A preliminary report of the Big Numbers Project. Food and Agriculture Organization of the United Nations (FAO) and World Fish Center, sponsored by PROFISH – World Bank
FAO, (2006). World Agriculture: towards 2030/2050, Interim Report. FAO, Rome.
FAO, (2012). Role of agro-industry in reducing food losses in the Middle East and North Africa region. 106pp. FAO, Cairo, Egypt.
FAO, (2012). Role of agro-industry in reducing food losses in the middle-east and North Africa region. FAO, Cairo, Egypt. 106pp. Report prepared by Kader, A.A., Kitinoja, L., Hussein, A.M., Abdin, O., Jabarin, A., Sidahmed, A.E.
FAO, (2013). Report of the expert consultation meeting on food losses and waste reduction in the near east region: towards a regional comprehensive strategy. 35 pp.
FAO, (2015). Egypt: wheat sector review. 112 pp. FAO, Rome. Report prepared by McGill, J., Prikhodko, D., Sterk, B., Talks, P. http://www.fao.org/3/a-i4898e.pdf
FAO. (2014f). Save Food Global Initiative on Food Loss and Waste Reduction. Food Loss Assessment: Causes and Solutions Case studies in the Small-scale Agriculture Subsectors: Methodology. FAO 32p.
FAOSTAT (2016) http://FAOSTAT.fao.org/site/569/default.aspx#ancor. Accessed, 26/04/2016
FAOSTAT, (2016). http://FAOSTAT3.fao.org/
FAOSTAT. Food Balance Sheets (2011), available at: http://FAOSTAT3.fao.org/download/FB/FBS/E, last access on 11th December 2015
Fassinou Hotegni, V. N., Lommen, W. J. M., van der Vorst, J. G. A. J., Agbossoud, E. K. and Paul C. Struike (2014) Bottlenecks and Opportunities for Quality Improvement in Fresh Pineapple Supply Chains in Benin International Food and Agribusiness Management Review. Volume 17 Issue 3, 2014
Funge-Smith S, Lindebo E and Staples D (2005) Asian fisheries today: The production and use of low value/trash fish from marine fisheries in the Asia-Pacific region. RAP PUBLICATION 2005/16
GAIN (2016) Annual report on Oilseeds and products http://gain.fas.usda.gov/Recent%20GAIN%20Publications/Oilseeds%20and%20Products%20Annual%202016_Dakar_Senegal_7-19-2016.pdf

Reducing Postharvest Losses In the OIC Member Countries
164
Galal, O.M., (2002). The nutrition transition in Egypt: obesity, undernutrition and the food consumption context. Public Health Nutrition, 5(1A): 141-148.
Garcia, O., Balikowa, D., Kiconco, D., Ndambi, A., and Hemme, T. (no date) Milk Production in Uganda: Dairy Farming Economics and Development Policy Impacts, IGAD LPI Working Paper No. 09 – 08.
Geheb, K., Kalloch, S., Medard, S., Nyapendi, A-T., Lwenya, C., and Kyangwa, M. (2008). Nile perch and the hungry of Lake Victoria: Gender, status and food in an East African fishery. Food Policy 33(1): pp. 85-98
Giles, P.H., (1986). Post-maturity grain losses in the field. In: Maize conservation on the farm. Proceedings of a seminar at Kisumu, Kenya, 21-23 January, 1986. pp 21.
Gillett, R. (2008) Global study of shrimp fisheries. FAO Fisheries Technical Paper. No. 475. Rome, FAO. 2008. 331p.
GIZ, (2013a). Food losses in cassava and maize value chains in Nigeria: Analysis and recommendations for reduction strategies. 80pp. https://www.giz.de/fachexpertise/downloads/giz2013-en-reducing-food-losses-improve-food-security.pdf
GIZ, (2013b). The Ecological footprint of cassava and maize postharvest losses in Nigeria: a life cycle assessment. 48pp.
Gong Y. Y. and K Cardwell (2002) “Dietary aflatoxin exposure and impaired growth in young children in Benin and Togo: cross-sectional study” British Medical Journal Vol.325 pp.556-562
Gordon, A., Pulis, A., Owusu-Adjei, E. (2011). Smoked marine fish from Western Region, Ghana: a value chain assessment. WorldFish Center. USAID Integrated Coastal and Fisheries Governance Initiative for the Western Region, Ghana. 46pp.
Grain Storage Research Laboratory, (1994). PARC Research Digest, 5(2) (Apr-Jun 1994), University Campus Karachi, Pakistan.
Grillet, N., P. Grimaud, G. Loiseau, M. Wesuta, B. Faye, (2005). Qualité sanitaire du lait cru tout au long de la filière dans le district de Mbarara et dans la ville de Kampala en Ouganda, Revue d’Elevage et de Médecine vétérinaire dans les Pays tropicaux, 58 (4), 245-255.
Grolleaud, (1997). Postharvest losses: discovering the full story. FAO, Rome.
Grolleaud, (2002). Postharvest losses: discovering the full story. FAO, Rome. http://www.fao.org/docrep/004/ac301e/AC301e00.htm
Grolleaud, M. (2002). Postharvest losses: discovering the full story. Overview of the phenomenon of losses during the postharvest system. Food and Agriculture Organization of the UN, Agro- Industries and Postharvest Management Service, Rome
GSARS (2015). Improving methods for estimating postharvest losses. A Review of Methods for Estimating Grain Postharvest Losses. Global Strategy to improve Agricultural and Rural Statistics (GSARS). Working paper n.2. September 2015
Gustavsson, J., Cederbery, C., Sonesson, U., VanOtterdijk, R. & Meybeck, A. (2011). Global food losses and waste. Food and Agriculture Organization of the United Nations, Rome. 32pp.

Reducing Postharvest Losses In the OIC Member Countries
165
Hafiz, A., Hussain, S., (1961). Good seed storage reduces losses and increases production. Pakistan Agriculture 12, 368–387.
Hall, A., L. Mytelka, L., Oyeyinka, B., (2004). Innovation systems: What’s involved for agricultural policy and practice, ILAC Brief 2, October 2004: 1-4.
Hamza, M., Beillard, M., (2014). Egypt: Grain and Feed Annual, Forex availability impacts grain imports. 16 pp. GAIN Report, USDA Foreign Agricultural Service.
Haq, T., Usmani, N.F., Abbas, T., (2005). Screening of plant leaves as grain protectants against Tribolium castaneum during storage. Pakistan Journal of Botany, 37(1): 149-153. http://www.pakbs.org/pjbot/PDFs/37(1)/PJB37(1)149.pdf
Hasanuddin, A., Setyono, A., Soetjipto, P., Ananto, E.E., (2002). Tinjauan berbagai hasil kaajin/ penelitian tentang kehilangan hasil pascapanen padi [A review of the findings of some research on rice postharvest losses], Paper presented to a workshop on rice postharvest losses. Director General for Processing and Marketing of Agricultural Products, Jakarta.
Hassan, M. K., Chowdhury, B. L. D. and Akhtar, N. (2010) Postharvest loss assessment: A study to formulate policy for loss reduction of fruits and vegetables and socioeconomic uplift of the stakeholders. http://www.nfpcsp.org/agridrupal/sites/default/files/Kamrul_Hassan-PR8-08.pdf (accessed 21.6.16)
Hassan, S., Ahmad, M., Aslam, M., (2014). Assessment of Sitotroga cerealella losses in different sorghum varieties under controlled conditions. Archives of Phytopathology and Plant Protection, 47(8): 993-999.
Hempel, E. (2010). Value Chain Analysis in the Fisheries Sector in Africa, INFOSA and Trade Working Group of the PARTNERSHIP FOR AFRICAN FISHERIES, AU/NEPAD Programme
HLPE (2014a). Sustainable fisheries and aquaculture for food security and nutrition. A report by the High Level Panel of Experts on Food Security and Nutrition of the Committee on World Food Security, Rome
HLPE (2014b). Food losses and waste in the context of sustainable food systems. A report by the High Level Panel of Experts on Food Security and Nutrition of the Committee on World Food Security, Rome
Hodges, R. J., Buzby, J. C., and B, Bennett, (2011), Postharvest losses and waste in developed and less developed countries: opportunities to improve resource use. The Journal of Agricultural Science, Volume 149, pp 37-45.
Hodges, R.J., Stathers, T., (2012). Training Manual for Improving Grain Postharvest Handling and Storage. WFP, Rome and NRI, UK. pp246. http://www.wfp.org/content/p4p-training-manual-improving-grain-postharvest-handling-and-storage
Hodges, R.J., Stathers, T.E., (2013). Facing the Food Crisis: How African smallholders can reduce postharvest cereal losses by supplying better quality grain. Outlooks on Pest Management, 24(5): 217-221.
Hossain, A., & Miah, M. (2009). Postharvest losses and technical efficiency of potato storage systems in Bangladesh. Physical Location: FPMU Documentation Center, Classification Number: O-2009-38

Reducing Postharvest Losses In the OIC Member Countries
166
Hossain, M. M. and Abdulla, F. (2015) On the production behaviors and forecasting the tomatoes production in Bangladesh. J of Agricultural Economics and Development Vol. 4(5), 66-074
Hryckowian M (2015) Utilising discarded fish. Infofish International 6/2015 (November/December). Malaysia.
http://www.banglajol.info/index.php/BJAR/article/view/26932 (accessed 21.6.16)
http://www.fama.gov.my/documents/10157/19daca4e-47f2-479d-a1d6-1c4a1f201c87
http://www.ijbssr.com/journal/details/postharvest-loss-assessment-of-tomato-in-some-selected-areas-of-bangladesh-14013035 (accessed 21.6.16)
Hussain, S., (1966). Grain storage problems in Pakistan. In: Mahmood, S.H. (Ed.), Proceedings of Seminar on Problems of Agricultural Pests of Pakistan, 21–22 April 1966. Department of Zoology, University of Karachi, Pakistan, pp. 42–44.
IISS (International Institute for Strategic Studies) (2011). Bread and Protests, the return of high food prices. http://www.iiss.org/en/publications/strategic%20comments/sections/2011-a174/bread-and-protests--the-return-of-high-food-prices-432c
ILRI (2004), Types, Levels, and Causes of Postharvest Milk and Dairy Losses in sub-Saharan Africa and the Near East; FAO Action Programme for the Prevention of Food Losses; Milk and dairy products, postharvest losses and food safety in sub-Saharan Africa and the Near East; Phase One Synthesis Report prepared by Tezira Lore, Amos Omore and Steve Staal; International Livestock Research Institute, Nairobi.
ILRI (2005) Types, Levels, and Causes of Postharvest Milk and Dairy Losses in Sub-Saharan Africa and the Near East; Phase Two Synthesis Report by Tezira Lore, Amos Omore and Steve Staal; International Livestock Research Institute, Nairobi; February 2005.
Imes T (2011) “The implications of Aflatoxin contamination for local food safety in Senegal”, USDA Report.
INPhO, (2016). Sorghum postharvest operations. Report prepared by NRI for INPhO postharvest compendium. 33pp. FAO, Rome.
Irshad, M., Blaoch, U.K., (1985). Losses in wheat during storage and their prevention. Prog. Farm., 5: 17-19.
Islam, M.S. (2003). Perspectives of the coastal and marine fisheries of the Bay of Bengal, Bangladesh. Ocean & Coastal Management 46: pp. 763-796
Jeswani LM and B Baldev (1990) Advances in Pulse Production Technology, eds. Publication and Information Division, Indian Council of Agricultural Research, New Delhi.
Jones, A. (2015). Healthy food for a healthy world: leveraging agriculture and food to improve global nutrition. A Report Issued by an Independent Advisory Group Douglas Bereuter and Dan Glickman, cochairs. The Chicago Council on Global Affairs, April 2015
Jonsson, L.O., Kashweka, K., (1987). Relationship between drying, harvest and storage losses, production and consumption of maize for a rural household in Zambia. In: Improving food crop

Reducing Postharvest Losses In the OIC Member Countries
167
production on small farms in Africa. (Holmes, J.C. (ed)). FAO/SIDA seminar on increased food production through low-cost fooc crops technology, Harare (Zimbabwe), 2-17 March, 1987.
Juma, G.P.; Baltenweck, I.; Drucker, A.G.; Ngigi, M. (2007). Consumption of, and willingness to pay for, indigenous small ruminants’ meat in Marsabit, Kenya. Paper presented at the International Conference on Connecting Science, Society and Development: Development Studies Association (DSA) held at the University of Sussex, 18-20 September 2007. Nairobi (Kenya): ILRI.
Kabahenda, M. K. and Hüsken, S.M.C. (2009b). Postharvest handling of low-value fish products and threats to nutritional quality: a review of practices in the Lake Victoria region. Project report 1975. The WorldFish Center
Kabahenda, M.K. and Hüsken, S.M.C. (2009a). A review of low-value fish products marketed in the Lake Victoria region. Regional Programme Fisheries and HIV/AIDS in Africa: Investing in Sustainable Solutions. Project Report 1974. The WorldFish Center
Kader, A. A. (2005). Increasing food availability by reducing postharvest losses of fresh produce. Acta Horticult. 682: pp. 2169–2175
Kader, A. A. and Hussein, A. M. (2009) Harvesting and postharvest handling of dates. Project on the Development of Sustainable Date Palm Production Systems in the GCC countries of the Arabian Peninsula. ICARDA http://postharvest.ucdavis.edu/files/71533.pdf
Kasprzyk, Z., Wallemacq, F. and Yvergniaux, Y. (2015). Efficiency of the Scylla Serrata Crab Fishery Value Chain (Madagascar) Boosted by Simple Low Cost Interventions. The First International Congress on Postharvest Loss Prevention Proceeding, Oct 4-7, 2015, Rome
Kawarazuka, N. (2010). The contribution of fish intake, aquaculture, and small-scale fisheries to improving nutrition security: a literature review. Working Paper 2106. The WorldFish Center
Kawarazuka, N. and Béné, C. (2011). The potential role of small fish species in improving micronutrient deficiencies in developing countries: building evidence. Public Health Nutrition 14, 1927–1938. doi: 10.1017/S1368980011000814
Kelleher, K. (2005). Discards in the world’s marine fisheries – an update. Food and Agriculture Organization of the United Nations, Rome. ISBN 92-5-105289-1
Khan, I., (1986). Assessment of wheat grain losses increasing in various type of food department stores at Peshawar. MSc (Hons) Thesis Dept Ent. NWFP Agric University Peshawar, pp. 63.
Khan, S.M., Kulachi, I.R., (2002). Assessment of postharvest wheat losses in D.I. Khan. Asian Journal of Plant Sciences, 1: 103-106.
Khatun, M., Karim, S., Khandoker, S., Hossain, T. M. B. and Hossain, S. (2014) Postharvest loss assessment of tomato in some selected areas of Bangladesh. Int. J of Business, Social and Scientific Research 1(3) 2009-218
Kirema-Mukasa, C.T. and Reynolds, J.E. (1991). Marketing and consumption of fish in Uganda. FISHING Notes and Records: Occasional Papers No. 4. FISHING; FAO/UNDP Project UGA/87/007; Republic of Uganda; United Nations Development Programme; Food and Agricultural Organisation of the United Nations

Reducing Postharvest Losses In the OIC Member Countries
168
Kleih, U., Crentsil, D., Gallat, S., Gogoe, S. F., Netty, D. A. S. and Yeboah, D. (1994). Assessment of postharvest needs in non-grain starch staple food crop systems in Ghana, NRI Report.
Knecht, E., (2016). Corruption in Egypt: Egypt’s dirty wheat problem. http://www.reuters.com/investigates/special-report/egypt-wheat-corruption/
Koura, A., El-Halfaway, M.A., (1973). Weight loss in stored grains caused by insect infestation in Egypt. Bulletin de la Societe Entomologique d’Egypte, 56: 413-417.
Kronen, M., Meijberg, A., Reinhard, I. (2015). Small fish with a big potential for women’s business? Rural 12, 21/03/15
Kumolu-Johnson and Ndimele, P.E. (2011). A Review on Postharvest losses in Artisanal Fisheries of Some African Countries. Journal of Fisheries and Aquatic Science 6(4): pp. 365-378
Lamboll, R. and Stathers, T. (2014) Review of IPCC and CIAT climate change prediction models and assessing the influence of climate change prediction models on cassava postharvest systems, Report for EC FTSP Cassava Growth Markets Project, Natural Resources Institute, UK
Larsen, K., Kim, R., Theus, F. (eds.), (2009). Agribusiness and Innovation Systems in Africa. The World Bank, Washington DC, pp. 242.
Lathiya, S.B., Ahmed, S.M., Pervez, A., Rizvi, S.W.A., (2008). Food habits of rodents in grain godowns of Karachi, Pakistan. Journal of Stored Products Research, 44:41-46.
Lem, A. (2012). A value chain analysis of international fish trade and food security with an impact assessment of the small scale sector. NORAD-FAO project. Draft publication. Accessible at http://www.fao.org/fileadmin/user_upload/fisheries/docs/Synthesis_report_background_August_2012_.doc
Leroy, J. L., Ruel, M., Frongillo, E. A., Harris, J. and Ballard, T. J. (2015). Measuring the Food Access Dimension of Food Security: A Critical Review and Mapping of Indicators. Food Nutr Bull 36: pp. 167-195
Lipinski, B., Hanson, C., Lomax, J., Kitinoja, L., Waite, R., Searchinger, T. (2013) Reducing Food Loss and Waste; Instalment 2 of “Creating a Sustainable Food Future”; Working Paper, World Resources Institute.
Liu, G., (2014), OECD Food Agriculture and Fisheries Papers. No. 66. Paris, Organisation for Economic Cooperation and Development.
Macfadyen, G., Huntington, T., Cappell, R. (2009). Abandoned, lost or otherwise discarded fishing gear. UNEP Regional Seas Reports and Studies No.185; FAO Fisheries and Aquaculture Technical Paper, No. 523. Rome, UNEP/FAO
Magan, N. & Aldred, D., (2007). Postharvest control strategies: minimizing mycotoxins in the food chain. International Journal of Food Microbiology, 119 (1-2): 131-139.
Maksum, C., (2002). Survei susut pasca panen padi [The rice postharvest survey], Paper presented at workshop on rice postharvest losses. Director General for Processing and Marketing of Agricultural Products, Jakarta.

Reducing Postharvest Losses In the OIC Member Countries
169
Mansour, S., Iglesias, C., (2011). Egypt Grain and Feed Annual, Black Sea Inundates Egypt. 13pp. USDA Foreign Agricultural Services, GAIN Report.
Maredia M (2012) “Global pulse production and consumption trends: the potential for pulses to achieve “Feed the Future” Food and Nutritional Security goals”, global Researchers Meeting, Rwanda February 13-19, 2012.
Market Insider (2015) Agricultural sector has 25% postharvest losses in Cameroon, International Trade Centre (http://www.intracen.org/itc/blogs/Agricultural-sector-has-25-postharvest-losses-in-Cameroon/)
Martinez-Espinosa, M. (1997). Expert Consultation on Small-Scale Rural Aquaculture 1997. FAO Fisheries Report No. 548. Food and Agriculture Organization of the United Nations, Rome (also available at www.fao.org/docrep/005/w5171e/W5171e22.htm)
Masembe Kasirye, F (2003), A Review of the Small Scale Dairy Sector – Uganda, Milk and Dairy Products, Postharvest Losses and Food Safety in Sub-Saharan Africa and the Near East, FAO Prevention of Food Losses Programme.
Medard, M., Lwenya, C., Nyapendi, A., (2002). Results of the LVFRP Nutrition Survey. In: Geheb, K. (Ed.), Report of the LVFRP Nutrition Survey. LVFRP Technical Document No. 18. Socioeconomic Data Working Group of the Lake Victoria Fisheries. Research Project, Jinja, Uganda: pp. 76–89.
Mejia, D., (undated). Maize: Postharvest operations. Chapter 23, of INPHO Postharvest Compendium. FAO, Rome. www.fao.org/inpho/content/compend/text/ch23_03.htm
Micas, A., (1976). A study of problems associated with procurement storage and distribution of wheat. Report to the Prime Minister of Pakistan, Micas Associates Pakistan Limited, Rock Court, AH Road, Karachi, Pakistan (unpublished report), 316pp.
Mignouna, B.D., T. Abdoulaye, A.D. Alene, R. Asiedu, and V.M. Manyong (2014a). Characterization of Yam-growing Households in the Project Areas of Ghana. International Institute of Tropical Agriculture (IITA). 95 pp.
Mignouna, T. Abdoulaye, A.D. Alene, R. Asiedu, and V.M. Manyong. (2014b).
Ministry of Agriculture (2011), “Agriculture and Livestock Five-Year Research Strategy 2011-2015”, Ministry of Agriculture, Directorate General of Agriculture & Livestock Research, Sultanate of Oman, Muscat.
Ministry of Supply and Home Trade - Egypt, (1988). The Egyptian food problem and solution. Cairo: Ministry of Supply and Home Trade, February 1988.
Mohammad, R., (1986). Assessment of storage losses of wheat grains in the food department stores of Hazara Division (NWFP), Pakistan. MSc (Hons) Thesis Dept. Entomol. NWFP Agric. Univ., Peshawar, pp. 69.
Moniruzzaman, M., Khatoon, R., Hossain, M.F.B., Rahman. M. T. and Alam, S. N. (2015) Influence of ethephon on ripening and quality of winter tomato fruit harvested at different maturity standards. Bangladesh J of Ag Research, 40(4)
Morrissey M.T (ed) (1988) Postharvest fishery losses. Proceedings of an International Workshop Held April 12-16, 1987, at The University of Rhode Island, Kingston, RI Edited by

Reducing Postharvest Losses In the OIC Member Countries
170
Michael T Morrissey Co-sponsored by the U.S. Agency for International Development (USAID) and the International Center for Marine Resource Development (ICMRD) at The University of Rhode Island. Published by ICMRD.
Mvumi, B.M. (2001). The ecology of stored grain insects in Zimbabwe and their control using diatomaceous earths with particular reference to the grain moth Sitotroga cerealella (Olivier) (Lepidoptera: Gelechiidae). PhD thesis, University of Greenwich, UK.
Mvumi, B.M., Giga, D.P., Chiuswa, D.V., (1995). The maize (Zea mays L.) post-production practices of smallholder farmers in Zimbabwe: findings from surveys. Journal of Applied Science in Southern Africa, 1(2): 115-130.
Nakhumwa C (2015) “Smallholder market access: the case of groundnuts sector in Malawi”, PhD thesis, University of Greenwich, U.K., 2015.
Nalunga, A., Kikulwe, E., Nowakunda, K., Ajambo, S. and Naziri, D. (2015) Technical report: Structure of the Cooking Banana Value Chain in Uganda and Opportunities for Value Addition and Postharvest Losses Reduction. Expanding Utilization of Roots, Tubers and Bananas and Reducing Their Postharvest Losses. CGIAR. http://www.rtb.cgiar.org/wp-content/uploads/2015/08/RPS/2/3.pdf
Naziri, D., Quaye, W., Siwoku, B. , Wanlapatit, S., Tu Viet, P., Bennett, B. (2015) The diversity of postharvest losses in cassava value chains in selected developing countries, Journal of Agriculture and Rural Development in the Tropics and Subtropics, Vol. 115, 111–123
Ndunguru, G., Thomson, M., Walda, R., Rwiza, E. and Westby, A. (1998). Methods for examining the relationship between quality characteristics and economic value of marketed fresh sweet potato. Tropical Agriculture (Trinidad), 75, 129-33.
New Vision (2016) http://www.newvision.co.ug/new_vision/news/1324189/vendors-selling-adulterated-milk-rwamirama (article appeared 15 April 2015); website accessed 28/4/2016.
Nindjin, C., Otokoré, Z., Farah, Z., Dao, D., Tschannen, A. et Girardin, O. 2003. Influences du dégermage et du traitement à l'acide gibbérellique des tubercules d'igname (Dioscorea spp.) stockés, sur les qualités organoleptiques du foutou d'igname. Agronomie Africaine Numéro special (4), 29-38.
NRI and Foodnet (2002) Transaction Cost Analysis, Study prepared for the Plan for the Modernisation of Agriculture by the Natural Resources Institute, University of Greenwich, and Foodnet, International Institute of Tropical Agriculture.
NRI, (2009), “Continental framework paper on postharvest loss reduction in Africa”, African Development Bank.
Nymabo, B.T., (1993). Postharvest maize and sorghum grain losses in traditional and improved stores in South Nyanza district, Kenya. International Journal of Pest Management, 39(2): 181-187.
Odogola, W.R., Henrikkson, R., (1991). Postharvest management and storage of maize. AGROTEC/UNDP/OPS, Regional Programme on Agricultural Operations Technology for Smallholders in East and Southern Africa. Harare, Zimbabwe.
OECD (2014). Fishing for development. The Challenge to combat illegal, unreported and unregulated (IUU) fishing. Background paper n.4 for participants to “Fishing for Development”,

Reducing Postharvest Losses In the OIC Member Countries
171
a joint meeting of the OECD Fisheries and Development Assistance Committees, with the Food and Agriculture Organization of the United Nations and the World Bank 10-11 April 2014. OECD, Paris
OECD-FAO (2013). Agriculture outlook 2013-2022 - Highlights. Paris, OECD, and Rome, FAO. 119 pp.
Oguntade, A. E.(2013) Food losses in cassava and maize value chains in Nigeria: Analysis and recommendations for reduction strategies, published by Deutsche Gesellschaft für Internationale Zusammenarbeit (GIZ) GmbH (https://www.giz.de/fachexpertise/downloads/giz2013-en-reducing-food-losses-improve-food-security.pdf)
Omar, E.E., Kamel, A.H., (1984). Assessment of damage in some stored cereal grains due to insect attack. Bulletin de la Societe Entomologique d’Egypte, 64: 119-127.
Osman, A. Saari, N., Saleh, R., Bakar, J. Zainal, N. D. and Yacob, M. (2009) Postharvest handling practices on selected local fruits and vegetables at different levels of the distribution chain. Journal of Agribusiness Marketing, Vol. 2
Oxford Business Group (2012b) The Report: Egypt 2012, In: COMCEC COORDINATION OFFICE (October, 2015).
Pakistan today Newspaper (2016) http://www.pakistantoday.com.pk/2012/08/05/business/time-to-cry-over-spilt-milk/ (accessed, 26/04/2016).
Parfitt, J., Barthel, M. and Macnaughton, S. (2010). Food waste within food supply chains: quantification and potential for change to 2050. Phil. Trans. R. Soc. 365: pp. 3065-3081
Pazderka C (2010) “Groundnut case study”, Chatham House Procurement for Development Forum, June 2010.
Porter M. E. (1985). Competitive advantage: Creating and sustaining superior performance, N. York: The Free Press, USA
Poulter, G.R., Ames, G.R. & Evans, N.J. (1988). Postharvest losses in traditionally processed fish products in less developed countries. In Postharvest Fishery Losses. Proceedings of an International Workshop held at the University of Rhode Island. Kingston, Rhode Island: ICMRD
Prasad, H., P. Bhatia, G.R. Sethi., (1977). Estimation of feeding losses by Trogoderma granarium Everts in wheat. Ind. J. Entomol., 39: 377-378.
Pushpamma, P., Chittemma, R.K., Sudhakar, R.K., Prameela, D., (1985). Storage of sorghum and millets at domestic level in Andra Pradesh, India. Bulletin Grain Technology, 23: 50-60.
Raghunathan, M.N., Muthu, M., Majumder, S.K. (1969). Control of internal fungi in sorghum by fumigation. Journal of Stored Product Research 5, 389-392.
Rahman, K.A., Sohi, G.S., Sapra, A.N., (1945). Studies on stored grain pests in the Punjab. VI. Biology of Trogoderma granarium Everts. Ind. J. Agri. Sci., 15: 85-92.

Reducing Postharvest Losses In the OIC Member Countries
172
Rees, D. and Bancroft, R. (2003) Development of integrated protocols to safeguard the quality of fresh yams R7582 (ZB0234). Final Technical Report. 1 Feb. 2000-31 Mar. 2003. Natural Resources Institute, University of Greenwich.
Riady, H., Nurhuda, A., Akbar, S.A., Fitria, L.A., (2015). Mesin Tresher Padi Otomatis. Program Kreativitas Mahasiswa – Teknologi (PKM-T) http://artikel.dikti.go.id/index.php/PKMT/article/view/579/579
Riethmuller, P. (2003), “The social impact of livestock: a developing country perspective”, Animal Science Journal. Volume 74, issue 4, pp245-253.
Roba, G. M., et al. (2013), “Stakeholder Processes to Reduce Losses and Add Value: An Example of a Pastoral Meat Supply Chain in Northern Kenya”. http://reload-globe.net/cms/attachments/article/57/PLANT2030_Poster%20SP6andSP7.pdf
Roberts, T.J., (1981). Project findings and recommendations terminal report. Vertebrate Pest Control Center, Karachi, Pakistan. Agricultural Research Council, Pakistan/71/554, Food and Agricultural Organization, United Nations Development Programme Rome, 65pp.
Rosen, S., Thome, K., Meade, B., (2016). International Food Security Assessment, 2016-2026. USDA Economic Research Services. http://www.ers.usda.gov/data-products/international-food-security/documentation.aspx
Sayat Shortan (2014) food losses and waste in Kazakhstan, FAO Country Report
Schulten, G.G.M., (1982). Postharvest losses in tropical Africa and their prevention.
Sergeant, A. Frimpong, Kuakoon, C., Ruthaiyanont P.A., Sonnenberg, A. and Bennett, B. (2015) Development of methods for scaling-up production as commercial enterprises, Deliverable Report, EU FP7 funded project Grains from Losses of Root and Tuber Crops FP7 reference – 289843 (http://www.fp7-gratitude.eu/communications/reports-publications)
Shafi, M.M., (1986). Grain godowns losses due to rodents and their control in Pakistan. In: Mohammad, A.H.H., Zaghloul, T.M., Zakaria, M. (Eds), Proceedings of Second Symposium on Recent Advances in Rodent Control, Kuwait, 2–6 February 1985, pp. 333–337.
Sharma, H.C., Ashok, S.A., Ch Ravinder, R., JaiRaj, V.V.J., Varaprasad, K.M., Belum, V.S.R., Rai, K.N., (2007). Management of sorghum and pearl millet pests in bulk storage; Global Theme on Crop Improvement. International Crops Research Institute for the Semi-Arid Tropics, Patancheru- 502324, Andhra Pradesh, India, p. 16.
Siam, G.M., Croppenstedt, A., (2007). An assessment of the impact of wheat market liberalization in Egypt: a multi-market model approach. ESA working paper, No. 07-15. 29pp. FAO, Rome. www.fao.org/es/esa
Simatupang, P., Timmer, P.C., (2008). Indonesian rice production: policies and realities. Bulletin of Indonesian Economic Studies, 44(1): 65-80.
Simtowe F, Asfaw S, Shiferaw B, Siambi M, Monyo E, Muricho G, Abate T, Silim S, Rao G and O. Madzonga (2010) “Socioeconomic Assessment of Pigeon pea and Groundnut Production Conditions- Farmer Technology Choice, Market Linkages, Institutions and Poverty in rural Malawi” Research Report No. 6, Markets, Institutions and Policy, ICRISAT.
Singano, C., (2008), pers. comms. Principal agricultural research scientists, DARS, Malawi.

Reducing Postharvest Losses In the OIC Member Countries
173
Singh, P., Danish, M., and Saxena, A. (1991). Spoilage of Fish-Process and Its Prevention. Department of Fishery Biology, College of Fisheries, G.B. Pant University of Agriculture and Technology, Pantnagar, Uttrakhand, India
Singleton, G. R., Belmain, S., Brown, P. R., Aplin, K., & Htwe, N. M. (2010). Impacts of rodent outbreaks on food security in Asia. Wildlife Research, 37(5), 355-359.
Smallholder Dairy Project (SDP) Policy Brief 8, (2005); LPS: a practical alternative for reducing postharvest milk losses; www.smallholderdairy.org).
Smallholder Diary Project (2016) www.smallholderdairy.org - Accessed, 26/04/2016
Smil, V. (2004). Improving efficiency and reducing waste in our food system. J. Integr. Environ. Sci., 1: 17-26.
Spielman, D.J., Ekboir, J., Davis, K., Ochieng, C.M.O., (2008). An innovation systems perspective on strengthening agricultural education and training in sub-Saharan Africa. Agricultural Systems, 98: 1-9.
SSEAD, (1997). Amhara National Regional State Bureau of Agriculture, Regional Crop Pest Survey Report on Insect Pests. Ethiopia.
Stathers, T., Karunditu, S., (2014). Investigating the role of innovative finance in creating the conditions to scale-up and out waste and spoilage reducing technologies in maize, bean and tomato value chains in Kenya. 87pp. Natural Resources Institute (NRI), Chatham, UK.
Stathers, T., Lamboll, R., Mvumi, B.M., (2013). Postharvest agriculture in changing climates: its importance to African smallholder farmers. Food Security, 5(3): 361-392.
Stathers, T., Tran, B.M.D., Riwa, W., Mbogho, A., Kitandu, L., Fuseini Andan, P., Okwae Fening, K., Hodges, R.J., Forsythe, L., Bennett, B., (2014). Market Research to Identify Opportunities to Introduce a Novel Means of Controlling Postharvest Pests of Maize in Ghana and Tanzania. Natural Resources Institute, Chatham, UK. pp.130.
Stathers, T., Morris, M., Riwa, W., Mvumi, B.M., (2004). Farmers’ livelihoods: What role for grain protection? Natural Resources Institute (NRI), Chatham, UK. 2 pp.
Steinfeld, H., et al. (2006), Livestock’s long shadow: environmental issues and options. Rome, Food and Agricultural Organisation of the United Nations.
Tall, A. (undated). Fish trade in Africa: an update. Accessible at: http://www.fao.org/in-action/globefish/market-reports/resource-detail/en/c/338418/
Tathdil, F. F., Dellal, I., and Z. Bayramogul., (2013), Food Losses and Waste in Turkey: Country Report. Rome, Food and Agricultural Organisation of the United Nations.
Tilman, D., Balzer, C., Hill, J., Befort, B., (2011). Global food demand and the sustainable intensification of agriculture. Proceedings of the National Academy of Sciences 1080, 20260-20264.
Togola, A., Seck, P.A., Glitho, I.A., Diagne, A., Adda, C., Toure, A., Nwilene, F.E., 2013. Economic losses from insect pest infestation on rice stored on-farm in Benin. J. Appl. Sci. 13, 278e285.

Reducing Postharvest Losses In the OIC Member Countries
174
Tran, B., Someling, E., Mutukwa, P., Stathers, T., Cammelbeeck, S., (2013). Grain quality control and mobile information system for the Zambian Food Reserve Agency: Pilot Project Report. 34pp. NRI, UK.
Tribune Pakistan (2016) http://tribune.com.pk/story/417661/milk-post-production-losses-cost-pakistan-rs169-billion/ Accessed, 26/04/2016
Tschannen A.T., Girardin O., Nindjin C., Dao D., Farah Z., Stamp P., and Escher F. (2003). Improving the application of gibberellic acid to prolong dormancy of yam tubers (Dioscorea sp.). Journal of the Science of Food and Agriculture 83 (8), 787-796.
Turner P. c. and S.E. Moore (2003) “Modification of immune function through exposure to dietary aflatoxin in Gambian children”, Environment Health Perspectives Vol. 111 (2) pp. 217-220.
UBOS (2014) Statistical Abstracts; Uganda Bureau of Standards.
Uddin, M. J. (2010) Fresh produce tomato value chain in Bangladesh. MSc thesis. Bangladesh Agricultural University http://www.google.co.uk/url?sa=t&rct=j&q=&esrc=s&source=web&cd=1&ved=0ahUKEwiH6OrZ-rjNAhVpL8AKHV74D2QQFggeMAA&url=http%3A%2F%2Fwww.saulibrary.edu.bd%2Fdaatj%2Fpublic%2Findex.php%2FgetDownload%2FBAU201001_10-fm_5.pdf&usg=AFQjCNGOgRTP7U4LnfxmNXM0TVvwML_L_Q (accessed 21.6.16)
UN, (2015), Sustainable Development Goals www.sustainabledevelopment.un.org accessed August 2016.
UNDESA, (2014). UN Department of Economic and Social Affairs: Population Division. World Urbanisation Prospects, the 2014 revision.
UNECA (2009). The Economic Report on Africa 2009; Developing African Agriculture through Regional Value Chains. Addis Ababa, United Nationals Economic Commission for Africa.
UNIFEM (1988) Fish processing. Food Cycle Technology Source Book No. 4. United Nations Development Fund for Women/Intermediate Technology Development Group, UK
United Nations (2015). World Population Prospects: The 2015 Revision, Volume I: Comprehensive Tables (ST/ESA/SER.A/379). Department of Economic and Social Affairs, Population Division
US Department of State (2013) Postharvest Loss Challenges Discussion Paper. http://www.state.gov/e/eb/tpp/agp/postharvest/reports/220748.htm
USAID (2014) Value chain selection report, end market and value chain analysis. Chapter 6: tomatoes. http://pdf.usaid.gov/pdf_docs/PA00KMXZ.pdf (accessed 21.6.16)
USAID, (2011). Rural and agricultural finance: taking stock of five years of innovations. microReport 181. Pp38.
USDA (2011) 2011 Raisin Annual, Afghanistan. Gain report. http://agriexchange.apeda.gov.in/MarketReport/Reports/Afghanistan_raisin_report.pdf
USDA, (2016). Grain: World Markets and Trade. 57 pp. USDA, Foreign Agricultural Service.

Reducing Postharvest Losses In the OIC Member Countries
175
USSD, (2013). Postharvest Loss Challenges Discussion Paper, Washington, US Department of State. www.state.gov/documents/organization/220958.pdf
Utami, W., Ihalauw, J., (1973). Some consequences of small farm size. Bulletin of Indonesian Economic Studies, 9(2): 46-56.
Uygun, U., Ozkara, R., Ozbey, A., Koksel, H., (2007). Residue levels of malathion and fenitrothion and their metabolites in postharvest treated barley during storage and malting. Food Chemistry, 100 (3): 1165-1169.
van Dijk, N., Herpers, G. and Steven Trijsburg (2015). The impact of food standards on inclusive growth in agriculture: the case of Bangladesh. BoP Innovation Center
van Wesenbeeck, C.F.A., Venus, V. Keyzer, M.A. Wesselman, B. and Asare Kye, D. (2015) Development of a horticulture production chain in Western Africa: a case study of tomatoes in Burkina Faso and Ghana. Stichting Onderzoek Wereldvoedselvoorziening van de Vrije Universiteit. Staff Working Paper WP - 14 - 01 http://www.sow.vu.nl/pdf/wp14.01.pdf
Vervroegen, D., Yehwola, F., (1990). Project for the identification of post-production grain losses and training on their reduction in Wollo region, Ethiopia. FAO terminal report. Action programme for the prevention of food losses. pp.17. UNFAO
Wally, A., (2016). Egypt Grain and Feed Annual, Foreign exchange crunch and unusually restrictive trade measures affect wheat imports and continued mishandling of rice export policy. 15 pp. USDA Foreign Agricultural Services, GAIN Report http://gain.fas.usda.gov/Recent%20GAIN%20Publications/Grain%20and%20Feed%20Annual_Cairo_Egypt_3-10-2016.pdf
Ward, A.R and D.J. Jeffries (2000). A manual for assessing postharvest fisheries losses. Natural Resources Institute, Chatham, UK
Ward, A.R. (1996). Quantitative data on postharvest losses in Tanzania: The fisheries of Lake Victoria and Mafia Island. Natural Resources Institute, UK, Overseas Development Administration.
Ward, A.R. and Jeffries, D. J. (2000). A manual for assessing postharvest fisheries losses. Natural Resources Institute, Chatham, UK. 140 pp.Ward, A.R. (2000). Field and desk based tool for Assessing fish losses: Adaptation and validation in West Africa. Final technical report on research project R7008. Report 2564. Natural Resources Institute, Chatham, UK. 45 pp.
WHO (2014). The top 10 causes of death, Fact sheet N. 310. Accessible at: http://www.who.int/mediacentre/factsheets/fs310/en/
Williamson, O. E. (1971). The vertical integration of production: Market failure considerations, American Economic Review 61: pp. 112-123
World Bank, (2016). Egypt: Country at a Glance and API data. http://www.worldbank.org/en/country/egypt
World Bank, NRI, FAO, (2011). Missing Food: the case of postharvest grain losses in sub-Saharan Africa. The World Bank, Washington, US, Report No: 60371-AFR. 116pp. http://siteresources.worldbank.org/INTARD/Resources/MissingFoods10_web.pdf
Reducing Postharvest Losses In the OIC Member Countries
176
World Bank. (2013). Fish to 2030: prospects for fisheries and aquaculture. World Bank Report No. 83177-GLB. Washington, DC. 102 pp.
World Grain News, (2015). Blumberg opens grain control center in Egypt. World-grain.com http://www.world-grain.com/articles/news_home/World_Grain_News/2015/12/Blumberg_opens_grain_control_c.aspx?ID=%7BF8864A7F-56A1-4A64-8538-5F5679F10859%7D
WorldFish (2010). Gender and fisheries: Do women support, complement or subsidize men’s small-scale fishing activities? Issues Brief No. 2108. The WorldFish Center.
WRI, (2015). Food Loss & Waste Protocol: Food Loss & Waste Accounting and Reporting Standard: Version 1.0, World Resources Institute, Washington DC.
Yachaou, M. and Zhihong, T. (undated) Onion sector in Niger: an overview of “Violet de Galmi” onion. www.paper.edu.cn/download/downPaper/201310-346
Yahia, E. M., Lobo, M.G. and A. A. Kader (2011) Harvesting and Postharvest Technology of Dates. Chapter 5 https://www.researchgate.net/publication/277693159_Dates_Postharvest_Science_Processing_Technology_and_Health_Benefits
Yahia, E.M., (2005). Postharvest technology of food crops in the Near East and North Africa (NENA) region. Chapter 15. 643-664. In: R. Dris (ed.), Crops: Quality, Growth and Biotechnology. WFL Publisher, Helsinki, Finland. http://www.elhadiyahia.net/wp-content/uploads/pdf/Yahia.%20Quality-Chapt-15,%20postharvest%20in%20NENA,%202005.pdf
Yao, A. K., Koffo, D. M., Irié, Z. B. and Niamke, S. L. (2014) Conservation de la banane plantain (Musa AAB) à l’état vert par l’utilisation de films de polyethylene de différentes épaisseurs. J. of Animal & Plant Sciences Vol.23, Issue 3: 3677-3690 http://www.m.elewa.org/JAPS/2014/23.3/5.pdf
Reducing Postharvest Losses In the OIC Member Countries
177
ANNEXES
Annex 1: OIC Member Country Questionnaire
It should be noted that although the number of questions is large, because the questionnaire was menu driven, participants only completed questions that related to their country and crop expertise indicated. OIC questionnaire Welcome to the Reducing Postharvest Losses in OIC Member Countries Survey Postharvest losses and waste in Value Chains in OIC countries Thank you for participating in our survey. Your feedback is important. This survey is an important part of a COMCEC Project: Reducing Postharvest losses in the Organisation of Islamic Cooperation (OIC) member countries. Your country has been selected because it is a member of OIC. The project is managed by the Natural Resources Institute (NRI), University of Greenwich, UK. We are interested in learning about your perceptions of the magnitudes and causes of losses which occur throughout the value chain (handling, drying, storage, processing, packaging, transportation, distribution and marketing stages) for selected crops and products. We will ask you a few questions about postharvest losses of selected food products in your country. It will take about 15 minutes of your time. The information you share will be used anonymously and will help the OIC Member Countries in strategically reducing postharvest losses, alleviating poverty and improving the environment. This survey complies with the University of Greenwich policy on Research Ethics. If you have any questions or would like more information, please contact Professor Keith Tomlins (email: [email protected], tel +44 1634 883460). By participating in this survey you agree to allow us to anonymously use the information you share in research publications and presentations. Q1. What is the main final product in the value chain Q2. What are the main by-products in the value chain Q3. What are the postharvest activity stages Postharvest losses and waste in Value Chains in OIC countries Q4. Postharvest losses can be measured in both quantity (e.g. % weight lost) and quality (e.g. % value lost). Please provide your best estimate of the percentage of final product lost by weight in the postharvest value chain Q5. For each of the value chain stages, please provide your best estimate of the percentage of main product lost by weight. Q6. Please provide your best estimate of the percentage of final product lost by value in the postharvest value chain Q7. For each of the value chain stages please provide your best estimate of the percentage of main product lost by value. Q8. What are the main causes of loss for the postharvest value chain activities

Reducing Postharvest Losses In the OIC Member Countries
178
Q9. Which would be the priority stages to focus on to support postharvest loss reduction Q10. What practical options are there for reducing losses during each of the activities below? Q11. What are the main constraints to reducing losses Q12. Thinking about your knowledge of postharvest losses in {{ Q2 }}, to what extent do you agree with the following? Q13. Which of these do you consider most important to reduce postharvest losses in {{ Q2 }}? Q14. Please provide details of the successful activities or projects aimed at reducing postharvest losses below: Finally, please provide some information about yourself below Q15. What is your gender (optional)? Q16 For what type of organisation do you currently work (optional)? Q17. How many years of experience do you have in postharvest value-chain activities? Q18. Please enter any additional comments or remarks you would like to make below. Q19. Your email address (optional) Thank you for completing this survey!

Reducing Postharvest Losses In the OIC Member Countries
179
ANNEX 2: Regional Groups of the OIC Member Countries
Arab Group Asian Group African Group
Algeria Afghanistan Benin
Bahrain Albania Burkina Faso
Comoros Azerbaijan Cameroon
Djibouti Bangladesh Chad
Egypt Brunei Darussalam Cote d’Ivoire
Iraq Indonesia Gabon
Jordan Iran Gambia
Kuwait Kazakhstan Guinea
Lebanon Kyrgyz Republic Guinea-Bissau
Libya Malaysia Mali
Mauritania Maldives Mozambique
Morocco Pakistan Niger
Oman Tajikistan Nigeria
Palestine Turkey Senegal
Qatar Turkmenistan Sierra Leone
Saudi Arabia Uzbekistan Togo
Somalia Guyana* Uganda
Sudan Suriname *
Syria
Tunisia
United Arab Emirates
Yemen
* Guyana and Suriname are in Latin America Region. However due to the limited number of countries in that
region, they are included in the Asian Group.

Reducing Postharvest Losses In the OIC Member Countries
180
ANNEX 3. List of Experts Consulted and Met During the Field Visits to Oman, Indonesia and Bangladesh
OIC Member Country
Expert name Organisation
Bangladesh Sultana (not known)
Meeting with PRAN Agro Business Ltd (tomato processing), Dhaka
Prof Zulfikar Rahman, Department of Extension, Bangladesh Agricultural University
Mymensingh Nur Khondaker and Shamin Ahmed Chowdhury
FAO re FAO project that looked at postharvest loss assessments in 2010
Dr Abdus Siddique, Prof Lutfur Rahman
ACI Ltd
Dr Madan Gopal Saha, CSO Horticultural Research Centre, BARI Dr Md. Atiqur Rahman Postharvest Technology Section, BARI Dr Mohammed Razu Ahmed AVRDC, Dhaka Dr Shahabuddin Ahmad former director, Horticultural Research
Centre, BARI Mital Saha
Assistant General Manager, Horticultural Export Development Foundation
Md. Reza Ahmed Khan
Assistant Chief, Department of Agricultural Marketing
A.Z.M. Nazmul Islam Chowdhury
Practical Action (NGO)
Indonesia C.Desyana
Secretary - Agribusiness Department, Researcher-Center for Sustainable Aquaculture & Pathology Studies (C-AquaPath) SURYA UNIVERSITY
Oman Habib Abdullah AL-Hsani Director of International Cooperation Department