Embed Size (px)
Citation preview

THIS REPORT CONTAINS ASSESSMENTS OF COMMODITY AND TRADE ISSUES MADE
BY USDA STAFF AND NOT NECESSARILY STATEMENTS OF OFFICIAL U.S.
GOVERNMENT POLICY
Required Report - public distribution
Date: 4/15/2010
GAIN Report Number: MX0022
Mexico
Oilseeds and Products Annual
Mexican Oilseeds Production Expected to Increase
Approved By:
Allan Mustard
Prepared By:
Benjamin Juarez, Mark Ford, and Carlos A. Gonzalez
Report Highlights: Though total Mexican oilseeds production in MY 2010/11 is forecast to increase to 196,000 metric tons (MT),
consumption continues to greatly exceed production. Soybean production is forecast to increase, with peanut production
remaining constant. Total oil meal and oil production are also expected to increase, due to increased demand from the
livestock and industrial sectors, respectively. Total domestic oilseed and oil meal consumption should also increase,
largely due to Mexico's economic recovery and demand from the livestock feed sector. Oil consumption is also expected
to increase in MY 2010/11, due to greater demand from the industrial and retail sectors resulting from shifting consumer
preferences towards mid-oleic oils as well as population growth. Oilseed, oil meal and oil imports are all expected to
increase in MY 2010/11 due to Mexico's economic recovery.

Executive Summary:
Commodities:
Oilseed, Peanut
Oilseed, Rapeseed
Oilseed, Soybean
Oilseed, Sunflowerseed
Meal, Soybean
Meal, Rapeseed
Meal, Sunflowerseed
Oil, Soybean
Oil, Rapeseed
Oil, Sunflowerseed
Production: OILSEEDS
Total Mexican oilseeds production in MY 2010/11 is forecast to increase to 196,000 metric tons (MT), assuming normal
weather conditions and an increase in harvested area. Despite this increase, domestic production continues to represent less
than 4 percent of total domestic consumption, as imports have effectively displaced domestic oilseed production with almost
all imports coming from the United States. Estimated production for MY 2009/10 has been revised downward to 169,000
MT due to recent official government information (please Soybean Production section). Similarly, the estimate of total
oilseed production for MY 2008/09 has been adjusted upward based on recent official government information.
Soybean Production
Total soybean production and harvested area estimates for MY 2009/10 have been revised downward based on updated
official data. Adverse weather conditions in the main producing states were the main reason for this decline.
Total Mexican soybean production for MY 2010/11 is forecast at 115,000 MT. This increase is due to a slight expansion in
area harvested in Mexico’s soybean producing regions, and assumes normal weather conditions. However, it should be
noted that this increase is lower than that offered by the Pro-Oilseeds governmental program , launched by the Government
of Mexico (GOM) in June 2009 (see Policy Section). According to industry sources, the decreased interest in cultivating
soybeans and canola in Mexico is due to:
Pests and diseases such as the Asian soybean rust and whitefly that have adversely affected soybean production in
previous years;
Limited availability of seed for planting varieties that can tolerate to these diseases and pests;
The low productivity of seeds;
Lack of training, technical assistance, and agronomic supervision resulting in inadequate pest and disease
management as well as inadequate planting densities and inappropriate dates for sowing; and

GOM policies aimed at supporting the production and marketing of grains such as corn.
In the case of canola or rapeseed, the factors that have limited its production in Mexico are:
Lack of domestic seeds with high yields;
Lack of technical assistance and training in crop management (such as optimum planting date), which causes
variability in yields; and
Lack of proper equipment such as suitable planters and harvesters.
Other factors that have inhibited the production of oilseeds in Mexico are its high production costs, which are not
compensated by GOM supports programs such as the “Target Income Program” (please see GAIN Reports MX2173 and
MX9001), even though this program benefits other crops such as corn and wheat. Moreover, Mexican farmers are more
familiar with the cultural production practices of crops such as corn and wheat. In the case of canola (or rapeseed), some
sources pointed out that this cultivation is considered a soil “predator” that reduces the soil nutrients and that this perception
consequently discourages its plantings. It should be noted that canola and sunflower seed production in Mexico continue to
be zero.
Peanut Production
Peanut production is forecast to remain unchanged at 80,000 MT in MY 2010/11, which is consistent with the average of the
last few years. It should be noted that production increased slightly compared to MY 2007/08. According to private sources,
the rise in peanut production in the last two years was because producers found a better market price. However, growers
continue to complain of insufficient GOM support programs for peanuts, relative to other crops. The graph below illustrates
the distribution of peanut production in the main producing states for the 2009 spring/summer crop:
Source: SIAP/SAGARPA
SAGARPA publishes official data just once a year. Thus, peanut production and the planted and harvested areas have been
revised upward for MY 2008/09 based on official information. Similarly, the peanut import and export estimates for MY
2008/09 and MY 2009/10 have been revised downward (from USDA official data), based on the Secretariat of Economy’s
(SE) official information for the former and industry data for the latter. Peanuts continue to be consumed mainly as snacks

as well as dried, roasted, or ground into powders for sauces. Moreover, private industry sources have stated that none of the
total production is used for oil or meal.
According to industry sources, the majority of peanuts are processed and packed in 500-gram bags for retail sale. There are
many processors, and the main brands include: Sabritas, Barcel, Mafer and Nippon. Regional processors located in different
states of Mexico, such as Botanas Bokados, Productos Michel, BYDSA, and Nishikawa also process peanuts snacks, with
important regional market shares. However, there is also a big number of small/informal peanut processors that acquire
peanuts from big distributors/importers and process peanut snacks in a more artisan way. During the last years, important
peanut processors located in different regions of the country have identified U.S. peanuts as a high quality product in terms
of flavor, shelf life, low aflatoxin levels and low foreign material content. A smaller amount of peanuts is also sold in-shell,
especially for specific seasons such as Christmas, where peanuts are used to stuff traditional “piñatas.”
OIL MEALS
As in previous years, high-protein soybean meal accounts for approximately 77 percent of total Mexican oil meal
production. Production of oil meal from imported rapeseed and canola seed accounts for approximately 23 percent of total
meal usage. Total meal production estimates for MY 2008/09 and MY 2009/10 were revised slightly downward and upward,
respectively, from previous USDA official estimates, based on updated industry information. FAS/Mexico forecasts the MY
2010/11 oil meal production to increase 3.6 percent due to the expected bullish demand from the livestock sector. For
example, the poultry sector outlook is slightly optimistic for 2010 in comparison with 2009 (please see GAIN Report
MX0010) and this sector is the major consumer of oilseeds meal in Mexico. The main factor that could stimulate broiler
production in 2010 is the rate of economic recovery as it pertains to family incomes.
The soybean meal production estimate for MY 2009/10 has been revised downward, reflecting the sluggish demand from the
livestock sector. However, this trend is expected to be reverse course due to stronger processor demand in MY 2010/11.
Similarly, the rapeseed meal production for MY 2010/11 is forecast to increase 2.5 percent due to an expected increase in
pork domestic production in 2010 (please see GAIN Report MX 0013). The pork industry is a major consumer of rapeseed
meal. In line with more recent information obtained from private and official sources, MY 2009/10 rapeseed meal
production has been revised slightly upward. Sunflower seed meal production is forecast to remain unchanged at 7,000 MT
in MY 2010/11. The sunflower seed meal production estimates for MY 2008/09 and MY 2009/10 have been revised upward
due to new information from the industry.
OILS
Total oil production is expected to increase by approximately 3.2 percent in MY 2010/11. Industry sources state that this
increase is being driven by greater demand from the industrial sector, including snack food manufacturers (such as Games,
Frito-Lay, Bimbo, Unilever, Sabritas, etc.). These companies are expected to continue the trend of cooking with vegetable
oils with reduced linoleic acid, which are lower in trans fatty acids than many hydrogenated oils. Other factors that should
encourage the increase in oil production are the expected consumer purchasing power recovery, due to the economic
recovery, and population growth. The estimates of total Mexican oil production for MY 2008/09 and MY 2009/10 have been
revised upward and downward, respectively, in accordance with more recent industry information. As a result of the
recessionary scenario in CY 2009, industry sources stated that crushers were operating at less than 70 percent capacity.
Also, these sources stated that big crushers found it more profitable to halt crushing and import crude oil to refine it since
already thin crushing margins could disappear when variable input costs increased. In general, the prices of some inputs,
such as gas and electricity, are higher in Mexico than in the United States.
The soybean oil production estimates for MY 2009/10 have been revised downward based on new industry information
while reflecting an adverse economic scenario that included an increase in input prices. However, this trend should change
in MY 2010/11 considering the recovery of the economy, which should increase consumer disposable incomes and
encourage Mexico’s oil market, mainly in the cooking sector. Soybean oil continues to constitute the majority Mexico’s oil
production. In MY 2009/10 soybean oil will represent 52 percent of total Mexican oil output, with rapeseed oil representing
48 percent.
Regarding rapeseed oil production, the estimate for MY 2009/10 has been increased slightly based on industry and official
data and reflects favorable seed prices. This trend is expected to continue in MY 2010/11, with production reaching 574,000
MT. Sunflower oil production estimates in MY 2008/09 and MY 2009/10 have been revised upward based on revisions by

SAGARPA and industry sources. Production of sunflower seed oil is forecast to increase to 7,000 MT in MY 2010/11 as
result of the growing demand of the snack food industry for vegetable oils with higher quality.
According to industry sources, in 2009 the leading oil-producing companies (i.e., La Corona, Agydsa, Hidrogenadora
Yucateca or Proteinas y Oleicos, Industrial Aceitera and Aceites Industriales El Zapote), which account for more than 70
percent of total oil production, halted investments in plants as well as changes to brand images and packaging due to the poor
macroeconomic scenario and the GOM’s decision to lower applied duties for vegetables oils (please see GAIN Report
MX8086).
Consumption:
OILSEEDS
Total domestic oilseed consumption for MY 2010/11 is estimated to increase approximately 3.4 percent from the revised
MY 2009/10 estimate to 5.25 MMT. This increase in domestic demand is attributed mainly to the economic recovery.
Recently, Mexican private sector economists increased their 2010 Gross Domestic Product (GDP) growth estimates. This
occurred after the GOM raised its forecast for the year and indicators such as industrial output and retail sales rose for the
first time in more than a year. Mexico’s GDP will expand 3.87 percent in 2010, according to a monthly Central Bank
(Banxico) survey of private economists released at the beginning of March, up from last month’s 3.28 percent estimate.
Meanwhile, the GOM also revised its forecast, raising its 2010 GDP forecast to 3.9 percent from 3 percent in February
2010. Latin America’s second-biggest economy is recovering due to increasing exports and improving domestic demand,
following a 6.5 percent contraction – the worst annual slump in 30 years – in 2009.
Based on this more optimistic macroeconomic prediction, consumer purchasing power should be favorably impacted in
2010. Domestic demand for meat products will likely recover because improved disposable income will encourage middle
and lower-income consumers to substitute less expensive protein sources with meat and poultry products. In addition, the
livestock sector is expected to have a better performance in 2010. The poultry sector outlook, for example, is slightly
optimistic for 2010 in comparison with 2009 (please see GAIN Report MX0010) and this sector continues to be the major
consumer of oilseed meal (especially soybean meal). The swine industry is another important end-user of oilseed meals.
At the same time, Mexican consumers will increase their consumption of products containing vegetable oils, such as
soybean and canola oils, as improved incomes could encourage demand for convenience foods and other vegetable oil
products. For MY 2009/10 the total demand for oilseeds was revised downward, reflecting the recessive scenario
previously mentioned.
Soybean domestic consumption is expected to increase 136,000 MT in MY 2010/11 to 3.61 MMT, as a result of the
moderate increase in feed demand, stronger processor demand and population growth (0.8 percent). For MY 2009/10
domestic soybean consumption estimates have been revised downward reflecting the bearish market situation this year.
Decreased demand has also led to lower than expected imports.
The rapeseed consumption estimate for MY 2009/10 has been revised slightly upward according to the most recent official
information from SAGARPA and private sources. Meanwhile, MY 2010/11 is forecast to increase 2.4 percent to 1.44
MMT. Private sources have commented that Mexican crushers have a market for canola oil and they will import canola
when the price is competitive.

For sunflower seed consumption, the MY 2008/09 and MY 2009/10 estimates have been revised upward based on
SAGARPA information and reflect a relatively stronger demand from the confection, snack, and bird-feed sectors. For MY
2010/11, sunflower seed consumption is expected to increase slightly, due to the improved economic outlook. However,
over the past few years, only a small amount of total sunflower seed production has been used for oil and meal.
For MY 2010/11, peanut consumption is forecast to increase to 189,000 MT. Approximately 97 percent of total peanut
consumption comes from the snack-food market. The consumption estimates for MY 2008/09 and MY 2009/10 have been
revised downward to 189,000 and 184,000 MT, respectively, based on industry figures.
Private sources state that due to the uncertainty generated by unfavorable economic conditions in CY 2009, the main
crushers (i.e., Agydsa, Ragasa, Cargill, HYSA, ADM) have stopped or postponed investments in expanded crushing
capacity.
Prices will continue to be the overriding factor in marketing oilseeds as demand is price elastic and companies can substitute
some oilseeds depending on the price. Mexico will continue to be a net importer of oilseeds, and the United States will
continue to be the principal supplier.
OIL MEALS
For MY 2010/11 the consumption of all oil meal products is forecast to increase to 5.29 MMT, up 2.4 percent compared to
revised MY 2009/10 data, and reflects the expected slight growth of the livestock feed sector. Imported products will
represent approximately 31.5 percent of Mexico’s total oil meal consumption, which is slightly higher than the previous
year but lower than the level registered in MY 2008/09. Soybean meal is likely to continue to be the ingredient of choice
for the poultry and swine industries. However, rapeseed meal consumption, which is used mainly by the swine and dairy
sectors, is expected to continue gaining market share assuming affordable prices prevail for Canadian rapeseed meal in MY
2010/11. It is expected that canola meal will constitute approximately 18.5 percent of total meal consumption. Total oil
meal consumption figures were revised downward for both MY 2008/09 and MY 2010/11, reflecting the most recent
industry and official information.
Soybean meal consumption increased in MY 2010/11 over last year’s revised estimate, and is expected to continue to
increase in the medium term, assuming a better performance from the poultry and hog industries.
The rapeseed meal estimate for MY 2008/09 has been revised upward, mainly due to low priced Canadian canola meal
imports. For MY 2010/11, rapeseed meal consumption is expected to increase slightly to 1.09 MMT, assuming that
Canadian imports continue to be affordable.
Sunflower seed meal is forecast to increase to 9,000 MT due to relatively stronger demand from the feed industry. The
consumption estimate of sunflower meal has been revised downward for MY 2008/09 and MY 2009/10 to 8,000 each year,
based on the most recent industry information. Industry sources indicated that sunflower seed meal has a very low
acceptance rate by the crushing industry and feed manufacturers due to its high fiber content.
OILS

Oil consumption is expected to increase by 3.25 percent in MY 2010/11. This increase is driven by greater demand from
the industrial and retail sectors due to shifting consumer preferences towards mid-oleic oils as well as population growth.
Moreover, ANIAME stated that another factor that should increase the vegetable oil consumption from the industrial sector
(mainly snack food sector) is the new GOM program to battle obesity, which costs the health system $3.2 billion per year
based on its estimates. On January 25, 2010, President Felipe Calderon launched a national public and private campaign
against obesity and he called parents, teachers and the food industry to guide people to more healthful living.
The plan involves more exercise, weight measurement, drinking water, increasing fruit and vegetable consumption, and
“socializing the problem and the strategy”. He called for support in the national strategy against obesity as it constitutes a
serious national health problem with social and economic impact. He stated that Mexico is the nation with the greatest
number of obese adults in the world and that Mexican children are following the same path. Calderon pointed out that 70
percent of Mexican adults are overweight. This includes some 4.5 million children between 5-11 years old. The plan
should reverse the excessive growth of obesity in children between the ages of 2-5 and stop the progress of the disease
between the ages of 5-19. The plan will also fight obesity in adults due to the unsustainable costs associated with obesity,
such as diseases such as diabetes, hypertension, breast cancer and others.
As a result of this new plan, ANIAME stated that the big vegetable oil companies that have invested in marketing, and
developed retail labels in the past few years, are now promoting the healthy aspects of vegetable oils. The products from
these companies are low in saturated fats and contain omega-3 fatty acids (i.e., soybean, canola and sunflower oils). At the
same time, industry snack food companies have been involved in a new campaign to promote healthy diets among
schoolchildren and encourage the use of vegetables oils in their products.
Total oil consumption figures for MY 2008/09 and MY 2009/10 have been revised upward and downward, respectively, due
to higher-than-expected crush levels the first year and higher-than-previously estimated imports during the second year.
The soybean oil consumption estimate for MY 2009/10 has been revised slightly downward based on updated information
from the industry and reflects sluggish demand and deteriorated consumer purchasing power. However, for MY 2010/11
soybean oil consumption is forecast to increase 3.1 percent to 825,000 MT.
Soybean oil continues to be the dominant oil consumed in Mexico. Companies such as Ragasa and Oleofinos have
continued to package and market oil as a retail vegetable oil in its own right. For example, pure soybean oil under the label
“Nutrioli” was bottled and launched by Ragasa several years ago. Recently, this company launched a new version called
“Nutrioli DHA.” This is the first Mexican cooking oil to feature DHA (docosahexaenoic acid), a nutrient important to brain
health throughout the lifecycle. The DHA logo has been prominently displayed on all Nutrioli DHA packaging and in all
marketing efforts, which includes broadcast, print and web advertising as well as television and radio spots. Moreover, it
currently has a strong consumer demand because it was marketed at the high income market segment. In addition, this
product is also being exported to the United States.
Similarly, Nutrioli initiated the operation of a new plant that includes the process called “Enzymatic interesterification,”
which provides a safe, easy and cost-efficient alternative to chemical interesterification and hydrogenation. According to
industry sources, this method of fat modification retains all of the health benefits of fat produced through chemical
interesterification and allows for a more natural product with important environmental benefits. Sources state that soybean

oil awareness among the Mexican consumers has increased significantly over the years. It should be noted that, some years
ago, soybean oil was considered a low quality product by many Mexican consumers.
The consumption estimate for rapeseed oil for MY 2009/10 has been revised upward based on revisions of industry sources
and SAGARPA. Assuming affordable international prices, rapeseed oil consumption is expected to increase slightly in MY
2010/11, due to market preference for this vegetable oil.
Recently, the Nielsen Company released the results of a 2009 survey about Mexicans’ usage and knowledge of cooking
oils. The survey, conducted in November/December 2009 among over 600 consumers in Mexico City, Guadalajara and
Monterrey, pointed out that Mexicans buy oil twice a month and use it daily for cooking. Health and versatility are the
attributes they most look for in cooking oils (i.e., that they are low in saturated fats and contain omega-3 fatty acids).
According to the survey, only 11 percent of the interviewees used canola oil, and 11 percent thought they knew the
difference between canola and other vegetable oils. After a description of canola oil’s benefits was read to participants, 47
percent stated they would be willing to switch to this oil.
The consumption estimates for sunflower oil for MY 2008/09 and MY 2009/10 have been revised downward, based on
revisions by SAGARPA and industry sources. However, sunflower oil consumption is forecast to increase slightly to
14,000 MT in MY 2010/11.
Table 2. Mexico: Retail Edible Oil Prices 2008-2010
Variety Presentation March 08 March 09 March10
Mixed vegetables 1lt. 12 bottle box 231.39 263.33 221.81
Soybean 1lt. 12 bottle box 263.07 274.75 248.71
Corn 1lt. 12 bottle box 258.41 280.58 232.65
Safflower 1lt. 12 bottle box 239.99 264.73 226.36

Trade: OILSEEDS
Mexico's total oilseed import estimates for MY 2008/09 and MY 2009/10 have been revised downward to 3.38 MMT and
3.49 MMT, respectively, based on official data of the SE in the first year and reflecting the impact of the economic recession
and a relatively lower level of consumer purchasing power in the second year. While soybeans dominate oilseed imports in
Mexico, imports are expected to increase 3 percent for MY 2010/11 because of the expected recovery in the economy.
Mexico's outlook is substantially more favorable than the previous year and slight growth is therefore expected in the
domestic hog and poultry sectors.
The soybean import estimate for MY 2009/10 has been revised downward based on industry sources. This decline primarily
reflects the sluggish performance of the poultry and hog sectors.
The United States and Canada will continue to be the main suppliers of oilseeds to the Mexican market. Due to proximity
and lower freight costs, U.S. suppliers should remain price-competitive and even increase their market share, eventually. For
MY 2010/11, the U.S. share is expected to remain about the same as it was in MY 2009/10, at 74 percent.
Canada has continued to be the primary canola supplier to the Mexican market. Canola is counted in the rapeseed PSD. The
rapeseed import estimates for MY 2009/10 have been revised upward from the previous estimates based on updated industry
information. For MY 2010/11, rapeseed imports are expected to increase slightly to 1.44 MMT due to favorable
international prices. Mexico's import decisions for oilseeds continue to be based largely on price and the availability of
credit, rather than quality or strong consumer preference.
Sunflower seed imports are forecast to increase to 16,000 MT due to the increasing popularity of sunflower seed oil in the
frying snack industry. Sunflower seed import estimates for MY 2008/09 have been revised upward based on end-of the year
data from SE and industry information for the second year.

OIL MEALS
It is expected that oil meal imports will increase to approximately 1.7 MMT in MY 2010/11. The United States should
capture 86 percent of the total meal import market, which is slightly higher than a year ago. Greater than previously
estimated demand, mainly rapeseed (canola) meal, caused oil meal imports to increase in MY 2009/10. This increase in
Mexican rapeseed meal imports was a result of an embargo on imported Canadian canola meal by the Food and Drug
Administration (FDA). According to industry sources, in May 2009 FDA imposed a ban on Canadian canola meal
imports into the United States after it detected salmonella bacteria in some shipments. A canola processing mill in
Saskatchewan, Canada, has since been cleared to ship meal to U.S. customers, but other Canadian canola plants remain under
an embargo. As a result, Canadian mills have been shipping much of the meal that would have been exported to U.S. to
buyers to Mexico instead, at very affordable prices. Due to the adverse impact on the sales of domestic crushing companies, the National Vegetable Oil and Lard Association
(ANIAME) has requested that the Mexican government regulate these Canadian canola meal imports that have been detected
with salmonella bacteria. Reportedly, Mexico does not have any regulation for imported canola meal. In October 2009,
ANIAME filed an official letter to COFEPRIS (Mexico’s FDA counterpart), requesting an emergency standard to regulate
canola meal imports, mainly coming from Canada. Despite the lobbying efforts of ANIAME with the Secretariats of
Agriculture, Health and Economy, Mexico continues to import the Canadian canola meal since there are not any applicable
regulations. ANIAME has been informed that SENASICA does not regulate processed products such as canola meal and
neither does COFEPRIS, as this product is for animal feed and not for human consumption.
The soybean meal import estimate for MY 2009/10 has been revised downward given the sluggish demand from the
livestock sector and because the soybean meal is facing increased competition from distiller’s dried grains with solubles
(DDGS). It should be noted that Mexico is the largest export markets for U.S. DDGS, and its demand for the ethanol co-
product continues to increase. Last year, Mexico imported approximately 1.47 MMT in 2009 against 1.15 MMT a year
before. Industry experts anticipate more volumes to be traded in 2010. Much of this growth can be attributed to greater
awareness about the product. Animal feed industry sources have pointed out that while the market for poultry, pork and beef
in Mexico declined in 2009 largely because of reduced consumer purchasing power, the market for DDGS was amazingly
stable. There is currently no other country exporting DDGS to Mexico, and as long as producers are searching for cheaper
feed options, the United States will remain the key exporter to Mexico. Given this competition and the expected slight
recovery on the livestock sector demand, imports of soybean meals are expected to increase only slightly in MY 2010/11.
Sunflower seed meal imports are forecast to remain unchanged at 7,000 MT in MY 2010/11. Import estimates of sunflower
seed meal for MY 2008/09 and My 2009/10 have been revised upward reflecting official data and industry information.
OILS
With the expected rebound of the Mexican economy, oil imports are forecast to rise almost 5 percent in MY 2010/11, and
soybean oil is forecast to account for 77.2 percent of total oil imports while rapeseed and sunflower seed oils are forecast to
account for 11.4 percent each. Soybean oil imports are expected to increase by 5 percent in MY 2010/11. The soybean oil
import estimate for MY 2009/10 was revised upward based on preliminary information from the SE.
The sunflower oil import estimate for MY 2008/09 has been decreased based on revised SE data. Importers expect that
sunflower oil import levels will remain relatively stable in MY 2010/11, due to a lack of domestic production. For rapeseed
oil, the import estimate for MY 2009/10 has been increased, reflecting official industry information. According to industry
sources, there is a relatively high rate of substitutability between soybean oil and sunflower and rapeseed oils. Price
continues to be one of the main factors in marketing vegetable oils in the Mexican marketplace.
Policy:
OILSEEDS
Under PROCAMPO (the Mexican domestic agricultural support program), a flat-rate payment for oilseed crops was
provided to farmers for the 2009 spring/summer crop cycle. On April 8, 2009, SAGARPA announced modifications to the
operational rules of PROCAMPO in the Mexican Federal Register (Diario Oficial) for the 2009 spring/summer to the 2012
spring/summer planting seasons. The new supports are between 963 to 1,300 pesos per hectare (U.S. $71.07- 95.94/ ha),
depending on the number of hectares each producer has registered in the program. Additionally, SAGARPA reduced the
maximum payment limit under the program to 100,000 pesos (roughly U.S. $7,380), regardless of total area under
production. (For more information, please see GAIN Report MX9020.)
On June 25, 2009, SAGARPA announced the new “Pro-Oilseeds” Program that assists oilseeds growers with support for
planting plots, purchasing improved seeds and fertilizers, and expert technical support. The main purpose of this program is
to increase the production and productivity of oilseeds (i.e., safflower, canola, soybean and sunflower seed), increasing
domestic production as well as providing alternative crops to improve growers’ incomes. As specific objectives, the “Pro-
Oilseeds” program seeks to:
1. Increase safflower, canola, soybean and sunflower seed yields through improved production technologies and technical
support;
2. Encourage the organization of crops at regional level, taking advantage of potentially productive areas for these oilseed
crops; and
3. Encourage the capitalization of growers through support infrastructure for production and harvest.
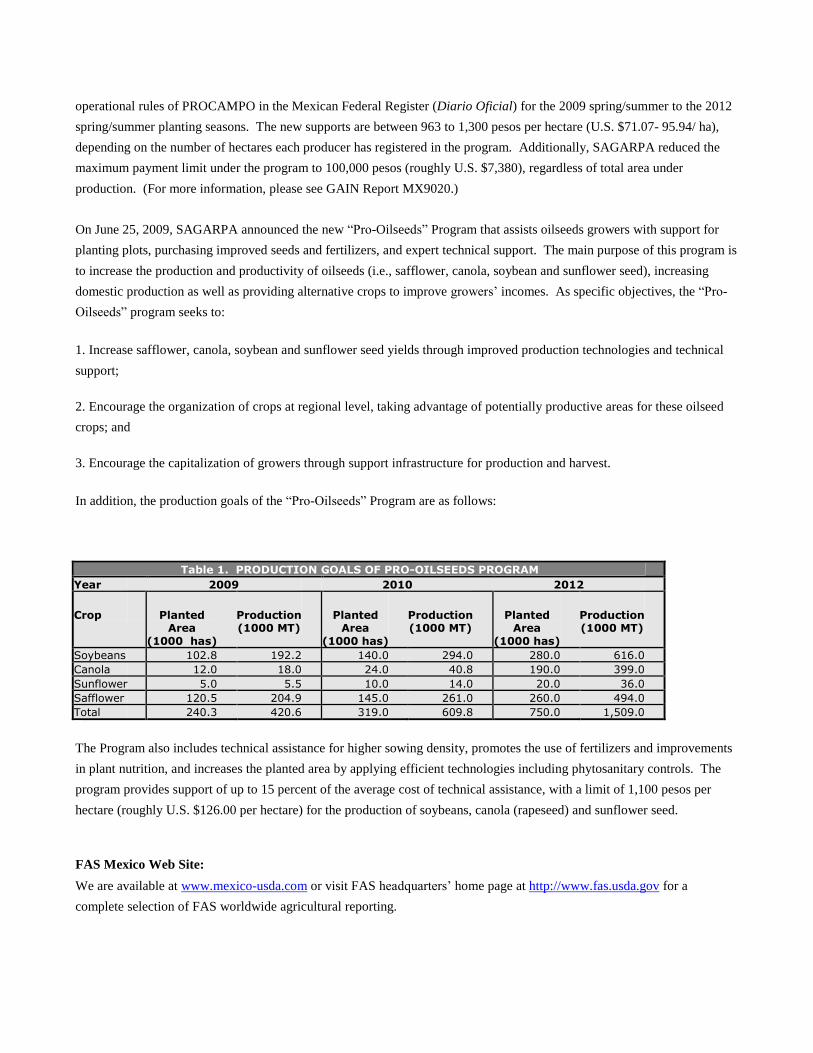
In addition, the production goals of the “Pro-Oilseeds” Program are as follows:
Table 1. PRODUCTION GOALS OF PRO-OILSEEDS PROGRAM Year 2009 2010 2012
Crop
Planted
Area (1000 has)
Production (1000 MT)
Planted
Area (1000 has)
Production (1000 MT)
Planted
Area (1000 has)
Production (1000 MT)
Soybeans 102.8 192.2 140.0 294.0 280.0 616.0 Canola 12.0 18.0 24.0 40.8 190.0 399.0 Sunflower 5.0 5.5 10.0 14.0 20.0 36.0 Safflower 120.5 204.9 145.0 261.0 260.0 494.0 Total 240.3 420.6 319.0 609.8 750.0 1,509.0
The Program also includes technical assistance for higher sowing density, promotes the use of fertilizers and improvements
in plant nutrition, and increases the planted area by applying efficient technologies including phytosanitary controls. The
program provides support of up to 15 percent of the average cost of technical assistance, with a limit of 1,100 pesos per
hectare (roughly U.S. $126.00 per hectare) for the production of soybeans, canola (rapeseed) and sunflower seed.
FAS Mexico Web Site:
We are available at www.mexico-usda.com or visit FAS headquarters’ home page at http://www.fas.usda.gov for a
complete selection of FAS worldwide agricultural reporting.

Production, Supply and Demand Data Statistics:
Mexico: PSD Total Oilseeds
Total Oilseeds Mexico
(1000 Hectares) (1000 MT)
2008 2009 2010 2008/2009 2009/2010 2010/2011
Market Year Begin: Sep 2008
Market Year Begin: Sep 2009
Market Year Begin: Sep 2010
USDA Official Data
New Post USDA Official Data
New Post USDA Official Data Jan
Official Post Data Official Post Data Official Post Data Area Planted 130 135 142 130 140 144 0 0 142 Area Harvested 122 121 129 116 119 111 0 0 127 Beginning Stocks 120 126 120 97 54 92 0 0 90 Production 224 228 235 176 186 161 0 0 196 MY Imports 4,647 4,678 4,616 5,035 4,904 4,928 0 0 5,076 MY Imp. from U.S. 3,395 3,380 3,376 3,567 3,552 3,492 0 0 3,598 MY Imp. from EU 0 0 0 0 0 0 0 0 0 Total Supply 4,991 5,032 4,971 5,308 5,144 5,181 0 0 5,362 MY Exports 15 16 12 15 17 11 0 0 12 MY Exp. to EU 0 0 1 0 0 0 0 0 0 Crush 4,641 4,754 4,643 4,962 4,942 4,861 0 0 5,029 Food Use Dom. Cons. 200 170 185 195 172 180 0 0 185 Feed Waste Dom. Cons. 38 38 39 38 37 39 0 0 39 Total Dom. Cons. 4,879 4,962 4,867 5,195 5,061 5,080 0 0 5,253 Ending Stocks 97 54 92 98 66 90 0 0 97 Total Distribution 4,991 5,032 4,971 5,308 5,144 5,181 0 0 5,362 CY Imports 4,562 4,930 4,930 5,205 5,068 4,708 0 0 5,006 CY Imp. from U.S. 3,268 3,541 3,542 3,718 3,701 3,528 0 0 3,620 CY Exports 15 15 15 15 15 11 0 0 14 CY Exp. to U.S. 0 9 11 0 8 6 0 0 10
Mexico: PSD Soybeans
Oilseed, Soybean Mexico
(1000 Hectares)
2008 2009 2010 2008/2009 2009/2010 2010/2011
Market Year Begin: Sep 2008
Market Year Begin: Sep 2009 Market Year Begin: Sep 2010
USDA Official New USDA Official New USDA Official Data Jan

(1000 MT) Data Post Data Post
Official Post Data Official Post Data Official Post Data Area Planted 80 88 88 80 89 92 0 0 90 Area Harvested 76 76 76 70 70 62 0 0 78 Beginning Stocks 56 56 56 36 36 36 0 0 36 Production 153 153 153 105 105 80 0 0 115 MY Imports 3,327 3,327 3,327 3,500 3,500 3,400 0 0 3,500 MY Imp. from U.S. 3,327 3,327 3,281 3,500 3,500 3,400 0 0 3,500 MY Imp. from EU 0 0 0 0 0 0 0 0 0 Total Supply 3,536 3,536 3,536 3,641 3,641 3,516 0 0 3,651 MY Exports 0 0 0 0 0 0 0 0 0 MY Exp. to EU 0 0 0 0 0 0 0 0 0 Crush 3,465 3,465 3,465 3,560 3,560 3,445 0 0 3,577 Food Use Dom. Cons.
0 0 0 0 0 0 0 0 0
Feed Waste Dom. Cons. 35 35 35 35 35 35 0 0 35
Total Dom. Cons. 3,500 3,500 3,500 3,595 3,595 3,480 0 0 3,612 Ending Stocks 36 36 36 46 46 36 0 0 39 Total Distribution 3,536 3,536 3,536 3,641 3,641 3,516 0 0 3,651 CY Imports 3,207 3,478 3,478 3,650 3,650 3,425 0 0 3,520 CY Imp. from U.S. 3,200 3,478 3,478 3,650 3,650 3,425 0 0 3,520 CY Exports 0 0 0 0 0 0 0 0 0 CY Exp. to U.S. 0 0 0 0 0 0 0 0 0
Mexico: PSD Rapeseed
Oilseed, Rapeseed Mexico
(1000 Hectares) (1000 MT)
2008 2009 2010 2008/2009 2009/2010 2010/2011
Market Year Begin: Oct 2008
Market Year Begin: Oct 2009
Market Year Begin: Oct 2010
USDA Official Data New Post USDA Official Data
New Post
USDA Official Data Jan
Official Post Data Official Post Data Official Post Data Area Planted 0 0 0 0 0 0 0 0 0 Area Harvested 0 0 0 0 0 0 0 0 0 Beginning Stocks 46 56 46 47 10 47 0 0 47 Production 0 0 0 0 0 0 0 0 0 MY Imports 1,164 1,230 1,164 1,385 1,280 1,400 0 0 1,435 MY Imp. from U.S. 15 15 46 15 15 40 0 0 40 MY Imp. from EU 0 0 0 0 0 0 0 0 0 Total Supply 1,210 1,286 1,210 1,432 1,290 1,447 0 0 1,482 MY Exports 0 0 0 0 0 0 0 0 0 MY Exp. to EU 0 0 0 0 0 0 0 0 0 Crush 1,163 1,276 1,163 1,390 1,280 1,400 0 0 1,435 Food Use Dom. Cons. 0 0 0 0 0 0 0 0 0 Feed Waste Dom. Cons. 0 0 0 0 0 0 0 0 0 Total Dom. Cons. 1,163 1,276 1,163 1,390 1,280 1,400 0 0 1,435 Ending Stocks 47 10 47 42 10 47 0 0 47 Total Distribution 1,210 1,286 1,210 1,432 1,290 1,447 0 0 1,482 CY Imports 1,200 1,337 1,337 1,400 1,300 1,156 0 0 1,350 CY Imp. from U.S. 15 25 25 15 15 49 0 0 40 CY Exports 0 1 1 0 0 0 0 0 0 CY Exp. to U.S. 0 1 1 0 0 0 0 0 0

Mexico: PSD Sunflowerseed
Oilseed, Sunflowerseed Mexico
2008 2009 2010 2008/2009 2009/2010 2010/2011
Market Year Begin: Oct 2008 Market Year Begin: Oct 2009
Market Year Begin: Oct 2010
USDA Official Data
New Post
USDA Official Data
New Post
USDA Official Data Jan
Official Post Data Official Post Data Official Post Data Area Planted 0 1 1 0 1 1 0 0 1 Area Harvested 1 1 1 1 1 1 0 0 1 Beginning Stocks 1 1 1 1 1 1 0 0 1 Production 1 1 1 1 1 1 0 0 1 MY Imports 11 11 14 10 9 15 0 0 16 MY Imp. from U.S. 8 8 10 7 7 12 0 0 13 MY Imp. from EU 0 0 0 0 0 0 0 0 0 Total Supply 13 13 16 12 11 17 0 0 18 MY Exports 0 0 0 0 0 0 0 0 0 MY Exp. to EU 0 0 0 0 0 0 0 0 0 Crush 9 9 11 8 8 12 0 0 13 Food Use Dom. Cons. 0 0 0 0 0 0 0 0 0 Feed Waste Dom. Cons. 3 3 4 3 2 4 0 0 4 Total Dom. Cons. 12 12 15 11 10 16 0 0 17 Ending Stocks 1 1 1 1 1 1 0 0 1 Total Distribution 13 13 16 12 11 17 0 0 18 CY Imports 10 8 8 10 8 17 0 0 18 CY Imp. from U.S. 8 6 6 8 6 15 0 0 16 CY Exports 0 0 0 0 0 0 0 0 0 CY Exp. to U.S. 0 0 0 0 0 0 0 0 0
Mexico: PSD Peanuts
Oilseed, Peanut Mexico
(1000 Hectares) (1000 MT)
2008 2009 2010 2008/2009 2009/2010 2010/2011
Market Year Begin: Sep 2008
Market Year Begin: Jun 2009
Market Year Begin: Sep 2010
USDA Official Data
New Post USDA Official Data
New Post USDA Official Data
Jan
Official Post Data Official Post Data Official Post Data Area Planted 50 46 53 50 50 51 0 0 51 Area Harvested 45 44 52 45 48 48 0 0 48 Beginning Stocks 17 13 17 13 7 8 0 0 6 Production 70 74 81 70 80 80 0 0 80 MY Imports 145 110 111 140 115 113 0 0 125 MY Imp. from U.S. 45 30 39 45 30 40 0 0 45 MY Imp. from EU 0 0 0 0 0 0 0 0 0 Total Supply 232 197 209 223 202 201 0 0 211 MY Exports 15 16 12 15 17 11 0 0 12 MY Exp. to EU 0 0 1 0 0 0 0 0 0 Crush 4 4 4 4 4 4 0 0 4 Food Use Dom. Cons. 200 170 185 195 172 180 0 0 185 Feed Waste Dom. Cons. 0 0 0 0 0 0 0 0 0 Total Dom. Cons. 204 174 189 199 176 184 0 0 189 Ending Stocks 13 7 8 9 9 6 0 0 10 Total Distribution 232 197 209 223 202 201 0 0 211 CY Imports 145 107 107 145 110 112 0 0 120 CY Imp. from U.S. 45 32 33 45 30 43 0 0 48

CY Exports 15 14 14 15 15 11 0 0 14 CY Exp. to U.S. 0 8 10 0 8 6 0 0 10
Mexico: PSD Total Oilmeals
Total Oilmeals
Mexico
(1000 MT) (Percent)
2008 2009 2010 2008/2009 2009/2010 2010/2011
Market Year Begin: Sep 2008
Market Year Begin: Sep 2009
Market Year Begin: Sep 2010
USDA Official Data New Post USDA Official Data New Post USDA Official Data Jan
Official Post Data Official Post Data Official Post Data Crush 4,637 4,704 4,639 4,958 4,848 4,857 0 0 5,025 Extr. Rate, 999.9999 0.733 0.731 0.733 0.727 0.730 0.725 0 0 0.726 Beginning Stocks 43 43 43 91 91 91 0 0 45 Production 3,399 3,437 3,400 3,602 3,539 3,521 0 0 3,646 MY Imports 1,650 1,629 1,647 1,585 1,557 1,611 0 0 1,667 MY Imp. from U.S. 1,577 1,564 1,566 1,535 1,507 1,371 0 0 1,432 MY Imp. from EU 0 0 0 0 0 0 0 0 0 Total Supply 5,092 5,109 5,090 5,278 5,187 5,223 0 0 5,358 MY Exports 6 6 6 7 7 6 0 0 6 MY Exp. to EU 0 0 0 0 0 0 0 0 0 Industrial Dom. Cons. 0 0 0 0 0 0 0 0 0 Food Use Dom. Cons. 50 50 50 50 56 50 0 0 50 Feed Waste Dom. Cons. 4,945 4,962 4,943 5,187 5,090 5,122 0 0 5,248 Total Dom. Cons. 4,995 5,012 4,993 5,237 5,146 5,172 0 0 5,298 Ending Stocks 91 91 91 34 34 45 0 0 54 Total Distribution 5,092 5,109 5,090 5,278 5,187 5,223 0 0 5,358 CY Imports 1,635 1,587 1,587 1,630 1,603 1,557 0 0 1,592 CY Imp. from U.S. 1,566 1,558 1,558 1,585 1,558 1,399 0 0 1,432 CY Exports 7 7 7 7 7 6 0 0 6 CY Exp. to U.S. 0 0 0 0 0 0 0 0 0
Mexico: PSD Soybean Meal
Meal, Soybean Mexico
(1000 MT) (Percent)
2008 2009 2010 2008/2009 2009/2010 2010/2011
Market Year Begin: Sep 2008
Market Year Begin: Sep 2009
Market Year Begin: Sep 2010
USDA Official Data New Post USDA Official
Data New Post USDA Official Data Jan
Official Post Data Official Post Data Official Post Data Crush 3,465 3,465 3,465 3,560 3,560 3,445 0 0 3,577 Extr. Rate, 999.9999 1. 1. 0.787 1. 1. 0.7866 0 0 0.787 Beginning Stocks 43 43 43 91 91 91 0 0 45 Production 2,727 2,727 2,727 2,800 2,800 2,710 0 0 2,815 MY Imports 1,497 1,497 1,497 1,450 1,450 1,350 0 0 1,400 MY Imp. from U.S. 1,497 1,497 1,497 1,450 1,450 1,350 0 0 1,400 MY Imp. from EU 0 0 0 0 0 0 0 0 0 Total Supply 4,267 4,267 4,267 4,341 4,341 4,151 0 0 4,260 MY Exports 6 6 6 7 7 6 0 0 6 MY Exp. to EU 0 0 0 0 0 0 0 0 0 Industrial Dom. Cons. 0 0 0 0 0 0 0 0 0 Food Use Dom. Cons. 50 50 50 50 50 50 0 0 50 Feed Waste Dom. Cons. 4,120 4,120 4,120 4,250 4,250 4,050 0 0 4,150 Total Dom. Cons. 4,170 4,170 4,170 4,300 4,300 4,100 0 0 4,200

Ending Stocks 91 91 91 34 34 45 0 0 54 Total Distribution 4,267 4,267 4,267 4,341 4,341 4,151 0 0 4,260 CY Imports 1,486 1,486 1,486 1,500 1,500 1,346 0 0 1,380 CY Imp. from U.S. 1,486 1,486 1,486 1,500 1,500 1,346 0 0 1,380 CY Exports 7 7 7 7 7 6 0 0 6 CY Exp. to U.S. 0 0 0 0 0 0 0 0 0
Mexico: PSD Rapeseed Meal
Meal, Rapeseed Mexico
(1000 MT) (PERCENT)
2008 2009 2010 2008/2009 2009/2010 2010/2011
Market Year Begin: Oct 2008
Market Year Begin: Oct 2009
Market Year Begin: Oct 2010
USDA Official Data New Post USDA Official
Data New Post USDA Official Data Jan
Official Post Data Official Post Data Official Post Data Crush 1,163 1,230 1,163 1,390 1,280 1,400 0 0 1,435 Extr. Rate, 999.9999 1. 0.574 0.5735 1. 1. 0.5743 0 0 0.5742 Beginning Stocks 0 0 0 0 0 0 0 0 0 Production 667 706 667 798 735 804 0 0 824 MY Imports 148 130 148 130 105 260 0 0 265 MY Imp. from U.S. 75 65 67 80 55 20 0 0 30 MY Imp. from EU 0 0 0 0 0 0 0 0 Total Supply 815 836 815 928 840 1,064 0 0 1,089 MY Exports 0 0 0 0 0 0 0 0 0 MY Exp. to EU 0 0 0 0 0 0 0 0 0 Industrial Dom. Cons. 0 0 0 0 0 0 0 0 0 Food Use Dom. Cons. 0 0 0 0 0 0 0 0 0 Feed Waste Dom. Cons. 815 836 815 928 840 1,064 0 0 1,089 Total Dom. Cons. 815 836 815 928 840 1,064 0 0 1,089 Ending Stocks 0 0 0 0 0 0 0 0 0 Total Distribution 815 836 815 928 840 1,064 0 0 1,089 CY Imports 144 98 98 125 100 209 0 0 210 CY Imp. from U.S. 75 69 69 80 55 51 0 0 50 CY Exports 0 0 0 0 0 0 0 0 0 CY Exp. to U.S. 0 0 0 0 0 0 0 0 0
Mexico: PSD Sunflowerseed Meal
Meal, Sunflowerseed Mexico
2008 2009 2010 2008/2009 2009/2010 2010/2011
Market Year Begin: Oct 2008
Market Year Begin: Oct 2009
Market Year Begin: Oct 2010
USDA Official Data
New Post
USDA Official Data
New Post
USDA Official Data
Jan
Official Post Data Official Post Data Official Post Data Crush 9 9 11 8 8 12 0 0 13 Extr. Rate, 999.9999 0. 0. 0.5455 0. 0. 0.5833 0 0 0.5385 Beginning Stocks 0 0 0 0 0 0 0 0 0 Production 5 4 6 4 4 7 0 0 7 MY Imports 5 2 2 5 2 1 0 0 2 MY Imp. from U.S. 5 2 2 5 2 1 0 0 2 MY Imp. from EU 0 0 0 0 0 0 0 0 0 Total Supply 10 6 8 9 6 8 0 0 9 MY Exports 0 0 0 0 0 0 0 0 0 MY Exp. to EU 0 0 0 0 0 0 0 0 0

Industrial Dom. Cons. 0 0 0 0 0 0 0 0 0 Food Use Dom. Cons. 0 0 0 0 6 8 0 0 9 Feed Waste Dom. Cons. 10 6 8 9 0 0 0 0 0 Total Dom. Cons. 10 6 8 9 6 8 0 0 9 Ending Stocks 0 0 0 0 0 0 0 0 0 Total Distribution 10 6 8 9 6 8 0 0 9 CY Imports 5 3 0 5 3 2 0 0 2 CY Imp. from U.S. 5 3 3 5 3 2 0 0 2 CY Exports 0 0 3 0 0 0 0 0 0 CY Exp. to U.S. 0 0 0 0 0 0 0 0 0
Mexico: PSD Total Oils
Total Oils Mexico
(1000 MT) (Percent)
2008 2009 2010 2008/2009 2009/2010 2010/2011
Market Year Begin: Sep 2008
Market Year Begin: Sep 2009
Market Year Begin: Sep 2010
USDA Official Data New Post USDA Official Data
New Post USDA Official Data Jan
Official Post Data Official Post Data Official Post Data Crush 4,638 4,704 4,639 4,958 4,768 4,857 0 0 5,025 Extr. Rate, 999.9999 0.232 0.235 0.233 0.239 0.240 0.241 0 0 0.241 Beginning Stocks 50 49 50 20 14 20 0 0 18 Production 1,078 1,105 1,079 1,186 1,142 1,171 0 0 1,209 MY Imports 200 210 235 235 245 260 0 0 272 MY Imp. from U.S. 170 170 208 206 205 231 0 0 243 MY Imp. from EU 0 0 0 0 0 0 0 0 0 Total Supply 1,328 1,364 1,328 1,441 1,401 1,451 0 0 1,499 MY Exports 31 31 22 32 32 25 0 0 26 MY Exp. to EU 0 0 0 0 0 0 0 0 0 Industrial Dom. Cons. 0 0 0 0 0 0 0 0 0 Food Use Dom. Cons. 1,272 1,314 1,281 1,380 1,340 1,403 0 0 1,449 Feed Waste Dom. Cons. 5 5 5 5 5 5 0 0 5 Total Dom. Cons. 1,277 1,319 1,286 1,385 1,345 1,408 0 0 1,454 Ending Stocks 20 14 20 24 24 18 0 0 19 Total Distribution 1,328 1,364 1,328 1,441 1,401 1,451 0 0 1,499 CY Imports 254 294 294 235 239 223 0 0 247 CY Imp. from U.S. 225 261 261 206 206 196 0 0 217 CY Exports 32 35 35 32 32 23 0 0 25 CY Exp. to U.S. 29 32 32 29 29 21 0 0 21
Mexico: PSD Soybean Oil
Oil, Soybean Mexico
(1000 MT) (Percent)
2008 2009 2010 2008/2009 2009/2010 2010/2011
Market Year Begin: Sep 2008
Market Year Begin: Sep 2009
Market Year Begin: Sep 2010
USDA Official Data New Post USDA Official Data New Post USDA Official Data Jan
Official Post Data Official Post Data Official Post Data Crush 3,465 3,465 3,465 3,560 3,560 3,445 0 0 3,577 Extr. Rate, 999.9999 0. 0. 0.1758 0. 0. 0.1756 0 0 0.1756 Beginning Stocks 38 38 38 5 5 5 0 0 3 Production 609 609 609 626 626 605 0 0 628 MY Imports 159 159 159 195 195 200 0 0 210 MY Imp. from U.S. 159 159 159 195 195 200 0 0 210

MY Imp. from EU 0 0 0 0 0 0 0 0 0 Total Supply 806 806 806 826 826 810 0 0 841 MY Exports 1 1 1 2 2 2 0 0 2 MY Exp. to EU 0 0 0 0 0 0 0 0 0 Industrial Dom. Cons. 0 0 0 0 0 0 0 0 0 Food Use Dom. Cons. 795 795 795 810 810 800 0 0 825 Feed Waste Dom. Cons. 5 5 5 5 5 5 0 0 5 Total Dom. Cons. 800 800 800 815 815 805 0 0 830 Ending Stocks 5 5 5 9 9 3 0 0 9 Total Distribution 806 806 806 826 826 810 0 0 841 CY Imports 214 214 214 195 195 175 0 0 185 CY Imp. from U.S. 214 214 214 195 195 175 0 0 185 CY Exports 2 2 2 2 2 2 0 0 2 CY Exp. to U.S. 1 1 1 1 1 1 0 0 1
Mexico: PSD Rapeseed Oil
Oil, Rapeseed Mexico
(1000 MT) (Percent)
2008 2009 2010 2008/2009 2009/2010 2010/2011
Market Year Begin: Oct 2008
Market Year Begin: Oct 2009
Market Year Begin: Oct 2010
USDA Official Data
New Post
USDA Official Data
New Post
USDA Official Data Jan
Official Post Data Official Post Data Official Post Data Crush 1,163 1,230 1,163 1,390 1,280 1,400 0 0 1,435 Extr. Rate, 999.9999 0.3998 0.4 0.3998 0. 0. 0.4 0 0 0.4 Beginning Stocks 12 11 12 15 9 15 0 0 15 Production 465 492 465 556 512 560 0 0 574 MY Imports 11 11 11 10 9 30 0 0 31 MY Imp. from U.S. 5 5 8 5 4 25 0 0 26 MY Imp. from EU 0 0 0 0 0 0 0 0 0 Total Supply 488 514 488 581 530 605 0 0 620 MY Exports 0 0 0 0 0 0 0 0 0 MY Exp. to EU 0 0 0 0 0 0 0 0 0 Industrial Dom. Cons. 0 0 0 0 0 0 0 0 0 Food Use Dom. Cons. 473 505 473 566 515 590 0 0 610 Feed Waste Dom. Cons. 0 0 0 0 0 0 0 0 0 Total Dom. Cons. 473 505 473 566 515 590 0 0 610 Ending Stocks 15 9 15 15 15 15 0 0 10 Total Distribution 488 514 488 581 530 605 0 0 620 CY Imports 10 47 47 10 9 18 0 0 30 CY Imp. from U.S. 5 41 41 5 4 15 0 0 25 CY Exports 0 0 0 0 0 0 0 0 0 CY Exp. to U.S. 0 0 0 0 0 0 0 0 0
Mexico: PSD Sunflowerseed Oil
Oil, Sunflowerseed Mexico
2008 2009 2010 2008/2009 2009/2010 2010/2011
Market Year Begin: Oct 2008
Market Year Begin: Oct 2009
Market Year Begin: Oct 2010
USDA Official Data
New Post
USDA Official Data
New Post
USDA Official Data
Jan
Official Post Data Official Post Data Official Post Data Crush 9 9 11 8 8 12 0 0 13

Extr. Rate, 999.9999 0. 0. 0.4545 0. 0. 0.5 0 0 0.5385 Beginning Stocks 0 0 0 0 0 0 0 0 0 Production 4 4 5 4 4 6 0 0 7 MY Imports 30 40 29 30 41 30 0 0 31 MY Imp. from U.S. 6 6 5 6 6 6 0 0 7 MY Imp. from EU 0 0 0 0 0 0 0 0 0 Total Supply 34 44 34 34 45 36 0 0 38 MY Exports 30 30 21 30 30 23 0 0 24 MY Exp. to EU 0 0 0 0 0 0 0 0 0 Industrial Dom. Cons. 0 0 0 0 0 0 0 0 0 Food Use Dom. Cons. 4 14 13 4 15 13 0 0 14 Feed Waste Dom. Cons. 0 0 0 0 0 0 0 0 0 Total Dom. Cons. 4 14 13 4 15 13 0 0 14 Ending Stocks 0 0 0 0 0 0 0 0 0 Total Distribution 34 44 34 34 45 36 0 0 38 CY Imports 30 33 33 30 35 30 0 0 32 CY Imp. from U.S. 6 6 6 6 7 6 0 0 7 CY Exports 30 33 33 30 30 21 0 0 23 CY Exp. to U.S. 29 32 32 29 29 20 0 0 21