Embed Size (px)
Citation preview
3. COMMODITY SNAPSHOTS
OECD-FAO AGRICULTURAL OUTLOOK 2016-2025 © OECD/FAO 2016 101
OILSEEDS AND OILSEED PRODUCTS
Market situationGlobal soybean production for the 2015 marketing year (see glossary for a definition of
marketing year) continued to increase, whereas production of other oilseeds (rapeseed,
sunflower seed and groundnuts) declined relative to 2014. Low crude oil and cereal prices
put additional pressure on oilseed prices.
Vegetable oil production increased more slowly than oilseed production for two
reasons. First, palm oil yields decreased in Southeast Asia due to El Niño and, second, the
slow production growth of oilseed oils due to an increased share of soybeans (containing
less oil than other oilseeds) in the oilseeds market. However, growth in vegetable oil
demand has slowed recently due to contracting biodiesel production from vegetable oils
in 2015 in several developed and developing countries. Vegetable oil prices are expected to
recover first within the oilseed complex due to currently stagnating production.
The continuously growing demand for protein meals has been the main driver behind
the expansion of oilseed production in recent years. This has increased the share of protein
meals in the returns from the crushing of oilseeds, and more so for soybeans over other
oilseeds due to its higher protein content. Compared with coarse grains and other feed
ingredients, protein meal prices have declined recently to historically average levels,
meaning that protein meal prices are about 1.5 to 2 times those of maize.
Projection highlightsIn nominal terms all oilseeds and oilseed product prices are projected to increase over
the outlook period. The price relationships within the sector will shift slightly in favour of
the meal component. Due to saturation in per capita food demand in many emerging
economies and reduced growth in biodiesel production from vegetable oils, vegetable oil
prices will decline whereas protein meal prices will increase slightly in real terms during
the outlook period.
During the outlook period, global soybean production is expected to continue its
expansion, yet at 2.4%, below the annual growth rate of 4.2% experienced during the last
decade. Production of other oilseeds increases by 1.2% p.a. over the next decade,
considerably below the growth rate of 3.6% p.a. in the previous decade. Globally, crushing
soybean and other oilseeds into meal (cake) and oil dominates total usage and it increases
slightly faster than other uses, notably direct food consumption of soybeans, groundnuts
and sunflower seed. Overall, 91% of world soybean production and 84% of world production
of other oilseeds will be crushed in 2025.
Vegetable oil includes oil from the crushing of soybeans and other oilseeds (around
55% of production), palm (36%), as well as palm kernel, coconut and cottonseed oils. World
vegetable oil production will remain concentrated among a few countries in the coming
decade. Despite a slowdown in area expansion, significant production growth still occurs
in the main palm oil producing countries: Indonesia (2.5% p.a. vs. 8.1% p.a. in the previous
decade) and Malaysia (2.1% p.a. vs. 2.4% p.a.). The other source of growth is soybean oil
produced from the increased production and crushing of soybeans. Demand growth for
vegetable oil is expected to slow down in the coming decade due to: a) reduced growth in

3. COMMODITY SNAPSHOTS
OECD-FAO AGRICULTURAL OUTLOOK 2016-2025 © OECD/FAO 2016102
per capita food use in developing countries, at 1.5% p.a. compared to 3.0% in the previous
decade; and b) only slight increases in biodiesel production from vegetable oils at 1.5% p.a.,
due to the gradual fulfilment of biodiesel mandates.
Protein meal production and consumption is dominated by soybean meal. Compared
to the past decade, consumption growth of protein meal slows down (2.2% p.a. vs. 3.9%
p.a.), reflecting both slower growth in global livestock production and saturated levels of
protein meal in Chinese feed rations. Chinese consumption of protein meal is projected to
grow by 2.7% p.a. compared to 7.9% p.a. in the previous decade, still exceeding the growth
rate of animal production however.
Growth in the world trade of soybeans is expected to slow down considerably in the
next decade, compared to the previous decade. This development is directly linked to the
projected slower growth in soybean crushing in the People’s Republic of China (hereafter
“China”). Because the growth in livestock production is expected to be concentrated in the
main protein meal producing countries, domestic use of protein meal increases while trade
will only expand slightly in the coming decade, resulting in a declining share of trade in
world production.
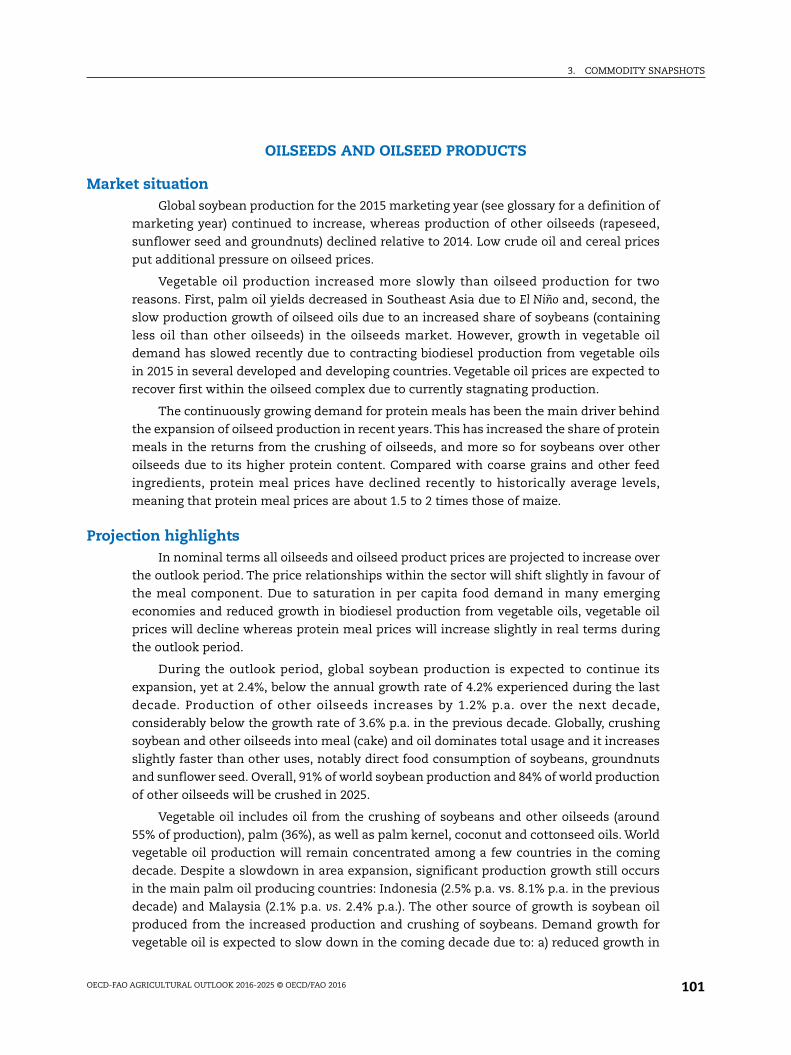
Whereas soybean, other oilseeds and protein meal exports are dominated by the
Americas, vegetable oil exports continue to be dominated by Indonesia and Malaysia
(Figure 3.2). Vegetable oil, at 42%, is one of the agricultural commodities with the highest
share of production that is traded. It is expected that this share remains stable throughout
the projection.
In addition to the issues and uncertainties common to most commodities (e.g. macro-
economic environment, crude oil prices and weather conditions), the oilseed complex has
its specific supply and demand sensitivities. The expected expansion of soybean and palm
oil production depends on the availability of additional new land which might be
constrained by new legislation aimed at protecting the environment. The low soybean
Figure 3.2. Exports of oilseeds and oilseed products by region
Source: OECD/FAO (2016), “OECD-FAO Agricultural Outlook”, OECD Agriculture statistics (database), http://dx.doi.org/10.1787/agr-data-en.1 2 http://dx.doi.org/10.1787/888933381602
0
20
40
60
80
100
120
140
160
180
2013-15 2025 2013-15 2025 2013-15 2025 2013-15 2025Soybean Other oilseeds Protein meals Vegetable oils
Mt
United States Canada Brazil Argentina Malaysia Indonesia Rest of the World
3. COMMODITY SNAPSHOTS
OECD-FAO AGRICULTURAL OUTLOOK 2016-2025 © OECD/FAO 2016 103
stock-to-use level projected for the end of the outlook period is a source of uncertainty for
the stability of prices if the sector is affected by adverse weather events. Biofuel policies in
the United States, the European Union and Indonesia are also a source of major
uncertainties in the vegetable oil sector because they have an impact on a considerable
share of the demand in these countries.
The expanded oilseeds and oilseed products chapter is available athttp://dx.doi.org/10.1787/agr_outlook-2016-8-en
OILSEEDS AND OILSEED PRODUCTS – 1
OECD-FAO AGRICULTURAL OUTLOOK 2016 © OECD/FAO 2016
OILSEEDS AND OILSEED PRODUCTS
Prices
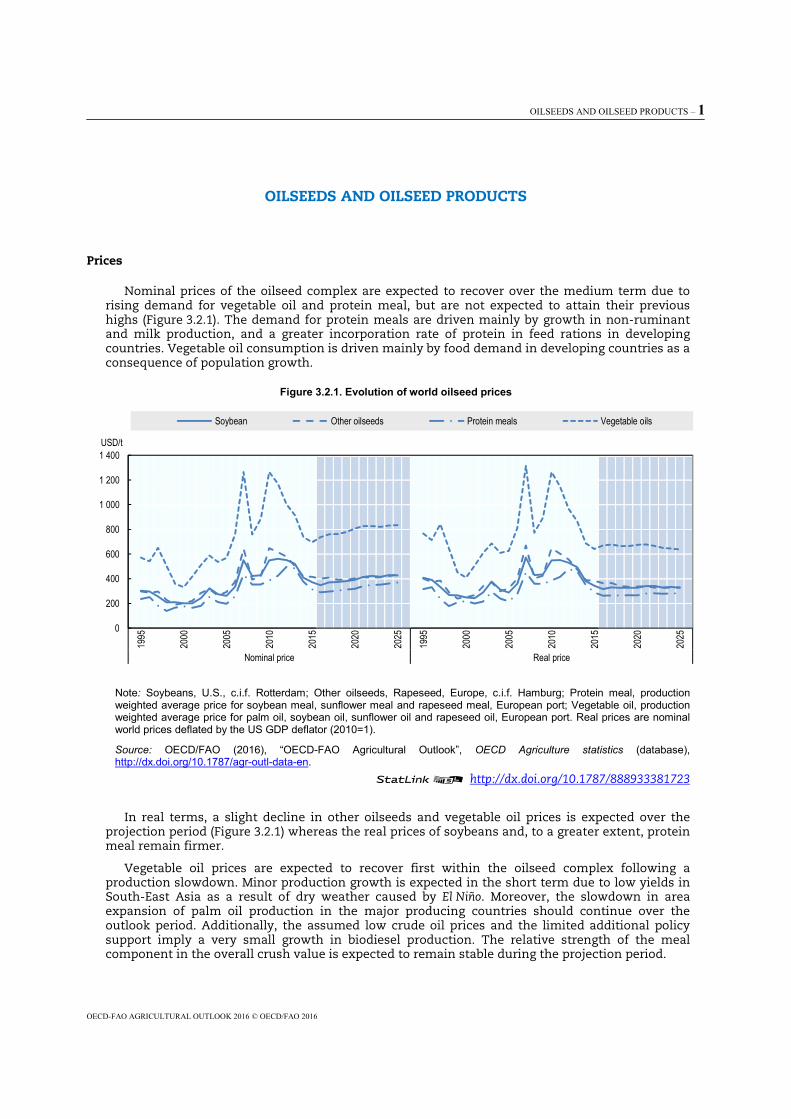
Nominal prices of the oilseed complex are expected to recover over the medium term due to rising demand for vegetable oil and protein meal, but are not expected to attain their previous highs (Figure 3.2.1). The demand for protein meals are driven mainly by growth in non-ruminant and milk production, and a greater incorporation rate of protein in feed rations in developing countries. Vegetable oil consumption is driven mainly by food demand in developing countries as a consequence of population growth.
Figure 3.2.1. Evolution of world oilseed prices
Note: Soybeans, U.S., c.i.f. Rotterdam; Other oilseeds, Rapeseed, Europe, c.i.f. Hamburg; Protein meal, production weighted average price for soybean meal, sunflower meal and rapeseed meal, European port; Vegetable oil, production weighted average price for palm oil, soybean oil, sunflower oil and rapeseed oil, European port. Real prices are nominal world prices deflated by the US GDP deflator (2010=1).
Source: OECD/FAO (2016), “OECD-FAO Agricultural Outlook”, OECD Agriculture statistics (database), http://dx.doi.org/10.1787/agr-outl-data-en.
12 http://dx.doi.org/10.1787/888933381723
In real terms, a slight decline in other oilseeds and vegetable oil prices is expected over the projection period (Figure 3.2.1) whereas the real prices of soybeans and, to a greater extent, protein meal remain firmer.
Vegetable oil prices are expected to recover first within the oilseed complex following a production slowdown. Minor production growth is expected in the short term due to low yields in South-East Asia as a result of dry weather caused by El Niño. Moreover, the slowdown in area expansion of palm oil production in the major producing countries should continue over the outlook period. Additionally, the assumed low crude oil prices and the limited additional policy support imply a very small growth in biodiesel production. The relative strength of the meal component in the overall crush value is expected to remain stable during the projection period.
0
200
400
600
800
1 000
1 200
1 400
1995
2000
2005
2010
2015
2020
2025
1995
2000
2005
2010
2015
2020
2025
Nominal price Real price
USD/t
Soybean Other oilseeds Protein meals Vegetable oils
2 – OILSEEDS AND OILSEED PRODUCTS
OECD-FAO AGRICULTURAL OUTLOOK 2016 © OECD/FAO 2016
Oilseed production
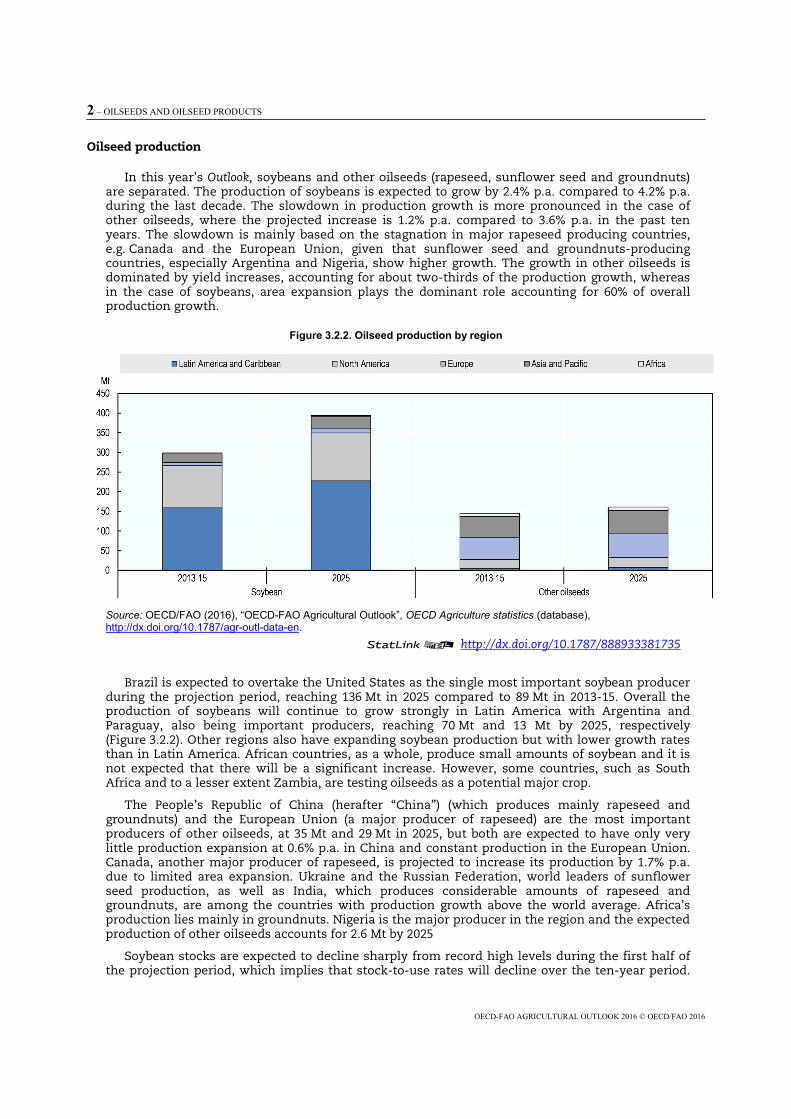
In this year’s Outlook, soybeans and other oilseeds (rapeseed, sunflower seed and groundnuts) are separated. The production of soybeans is expected to grow by 2.4% p.a. compared to 4.2% p.a. during the last decade. The slowdown in production growth is more pronounced in the case of other oilseeds, where the projected increase is 1.2% p.a. compared to 3.6% p.a. in the past ten years. The slowdown is mainly based on the stagnation in major rapeseed producing countries, e.g. Canada and the European Union, given that sunflower seed and groundnuts-producing countries, especially Argentina and Nigeria, show higher growth. The growth in other oilseeds is dominated by yield increases, accounting for about two-thirds of the production growth, whereas in the case of soybeans, area expansion plays the dominant role accounting for 60% of overall production growth.
Figure 3.2.2. Oilseed production by region
Source: OECD/FAO (2016), “OECD-FAO Agricultural Outlook”, OECD Agriculture statistics (database), http://dx.doi.org/10.1787/agr-outl-data-en.
12 http://dx.doi.org/10.1787/888933381735
Brazil is expected to overtake the United States as the single most important soybean producer during the projection period, reaching 136 Mt in 2025 compared to 89 Mt in 2013-15. Overall the production of soybeans will continue to grow strongly in Latin America with Argentina and Paraguay, also being important producers, reaching 70 Mt and 13 Mt by 2025, respectively (Figure 3.2.2). Other regions also have expanding soybean production but with lower growth rates than in Latin America. African countries, as a whole, produce small amounts of soybean and it is not expected that there will be a significant increase. However, some countries, such as South Africa and to a lesser extent Zambia, are testing oilseeds as a potential major crop.
The People’s Republic of China (herafter “China”) (which produces mainly rapeseed and groundnuts) and the European Union (a major producer of rapeseed) are the most important producers of other oilseeds, at 35 Mt and 29 Mt in 2025, but both are expected to have only very little production expansion at 0.6% p.a. in China and constant production in the European Union. Canada, another major producer of rapeseed, is projected to increase its production by 1.7% p.a. due to limited area expansion. Ukraine and the Russian Federation, world leaders of sunflower seed production, as well as India, which produces considerable amounts of rapeseed and groundnuts, are among the countries with production growth above the world average. Africa’s production lies mainly in groundnuts. Nigeria is the major producer in the region and the expected production of other oilseeds accounts for 2.6 Mt by 2025
Soybean stocks are expected to decline sharply from record high levels during the first half of the projection period, which implies that stock-to-use rates will decline over the ten-year period.
OILSEEDS AND OILSEED PRODUCTS – 3
OECD-FAO AGRICULTURAL OUTLOOK 2016 © OECD/FAO 2016
In 2025, a stock-to-use ratio of 8.8% is projected compared to around 12% in the base period 2013-15.
Oilseed crush and production of vegetable oils and protein meal
Based on the projected small growth rate in global soybean production, annual average growth in world soybean crush is expected to be 2.5%, compared to 4.3% in the previous decade. In absolute terms, this translates into an expansion of 91 Mt over the outlook period. Chinese crush is expected to increase by 31 Mt, accounting for about 34% of the world’s additional soybean crush. Crush of other oilseeds is expected to grow by only 1.5% p.a. or 16 Mt compared to 2013-15. This is partly explained by a slight reduction of 0.1% p.a. in the European Union, which, along with China, has the highest crushing levels.
Which regions will crush these oilseeds depends on many factors, including transport costs, trade policies, acceptance of genetically modified crops, processing costs (e.g. labour and energy), and infrastructure (e.g. ports and roads). It is anticipated that China will continue to increase soybean crush and that its share of the world total will reach 30%. The bulk of China’s anticipated increase in crushing is expected to come from imported soybeans.
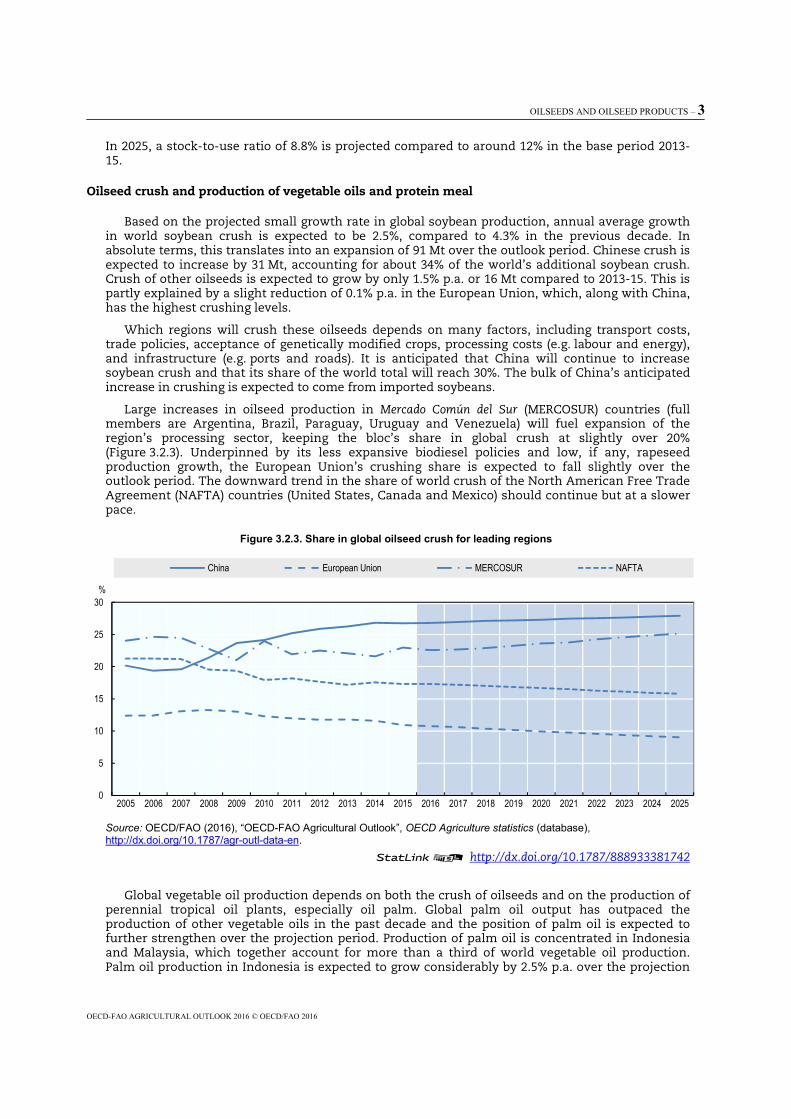
Large increases in oilseed production in Mercado Común del Sur (MERCOSUR) countries (full members are Argentina, Brazil, Paraguay, Uruguay and Venezuela) will fuel expansion of the region’s processing sector, keeping the bloc’s share in global crush at slightly over 20% (Figure 3.2.3). Underpinned by its less expansive biodiesel policies and low, if any, rapeseed production growth, the European Union’s crushing share is expected to fall slightly over the outlook period. The downward trend in the share of world crush of the North American Free Trade Agreement (NAFTA) countries (United States, Canada and Mexico) should continue but at a slower pace.
Figure 3.2.3. Share in global oilseed crush for leading regions
Source: OECD/FAO (2016), “OECD-FAO Agricultural Outlook”, OECD Agriculture statistics (database), http://dx.doi.org/10.1787/agr-outl-data-en.
12 http://dx.doi.org/10.1787/888933381742
Global vegetable oil production depends on both the crush of oilseeds and on the production of perennial tropical oil plants, especially oil palm. Global palm oil output has outpaced the production of other vegetable oils in the past decade and the position of palm oil is expected to further strengthen over the projection period. Production of palm oil is concentrated in Indonesia and Malaysia, which together account for more than a third of world vegetable oil production. Palm oil production in Indonesia is expected to grow considerably by 2.5% p.a. over the projection
0
5
10
15
20
25
30
2005 2006 2007 2008 2009 2010 2011 2012 2013 2014 2015 2016 2017 2018 2019 2020 2021 2022 2023 2024 2025
%
China European Union MERCOSUR NAFTA
4 – OILSEEDS AND OILSEED PRODUCTS
OECD-FAO AGRICULTURAL OUTLOOK 2016 © OECD/FAO 2016
period compared with 8.1% p.a. in the previous decade, partly reflecting stricter environmental policies.
Global protein meal output is projected to increase by 2.2% p.a., reaching 386 Mt by 2025. In contrast to vegetable oil, world production of protein meals is dominated by soybean meal which accounts for more than two-thirds of world protein meal production. Production is concentrated in a small group of countries, with Argentina, Brazil, China, the European Union, India, and the United States accounting for 97% of global production in 2025. In China and the European Union, meal production will continue to rely on both domestically grown and imported seeds.
In China, meal production is projected to rise by 26 Mt by 2025, accounting for 31% of world production increase. Strong growth in the production of protein meal in Brazil, Argentina and India is expected at 19 Mt, 9.7 Mt and 4.3 Mt, respectively. The United States, another important meal producer, is expected to grow by 5.2 Mt, an historical average level.
Vegetable oil consumption
Rising per capita income is expected to lead to a 1.5% p.a. increase in per capita vegetable oil consumed as food in developing economies, yet smaller than 3.0% p.a. during 2006-15. This slowdown confirms the saturation in per capita food demand in many emerging economies. By region, only Latin America is expected to grow at similar levels as the last decade (0.7% p.a.), whereas per capita consumption will decline in Africa and Asia. Annual per capita vegetable oil consumption is expected to average 21 kg across developing countries, but no more than 11 kg in the least developed countries by 2025. India, a prominent consuming country and, more importantly, the main importer of vegetable oil, is expected to maintain a high per capita food use growth of 3.4% p.a. India’s vegetable oil consumption will reach 33 Mt by 2025, up from 20 Mt in 2013-15. In contrast, developed countries as a group show a stable per capita consumption level of 26 kg (an increase by 0.2% p.a.), but individual countries differ based on tastes and dietary preferences.
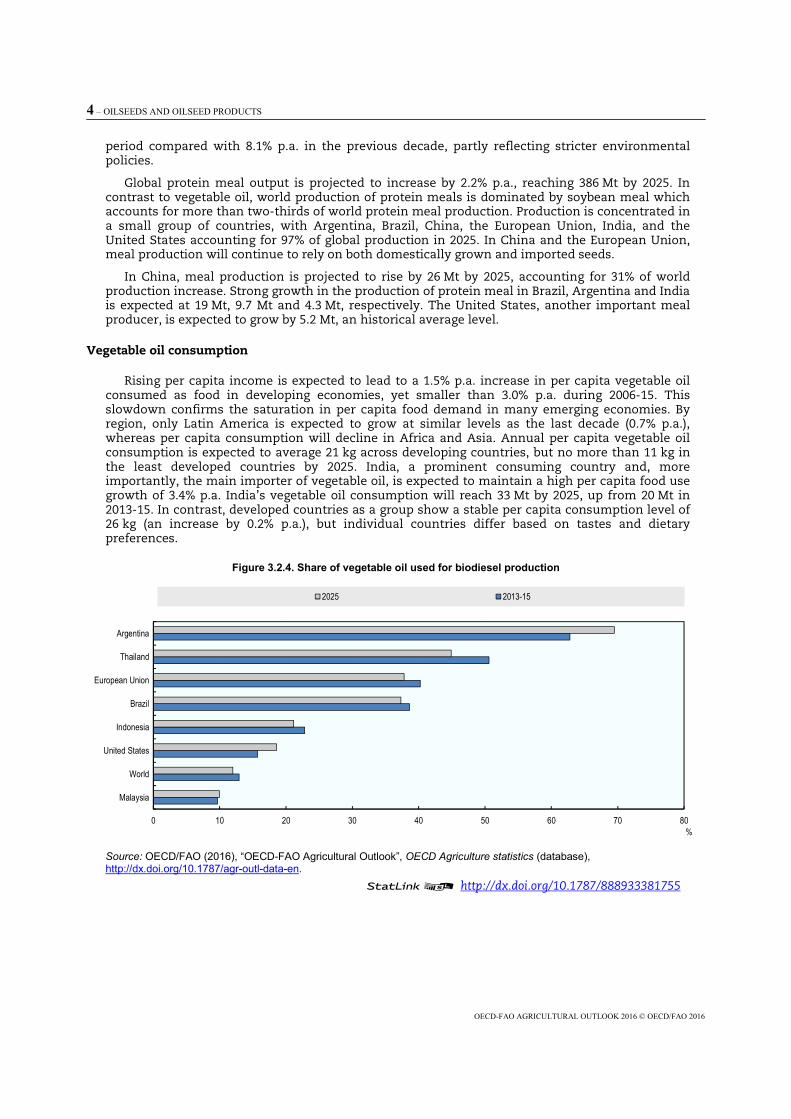
Figure 3.2.4. Share of vegetable oil used for biodiesel production
Source: OECD/FAO (2016), “OECD-FAO Agricultural Outlook”, OECD Agriculture statistics (database), http://dx.doi.org/10.1787/agr-outl-data-en.
12 http://dx.doi.org/10.1787/888933381755
0 10 20 30 40 50 60 70 80
Malaysia
World
United States
Indonesia
Brazil
European Union
Thailand
Argentina
%
2025 2013-15
OILSEEDS AND OILSEED PRODUCTS – 5
OECD-FAO AGRICULTURAL OUTLOOK 2016 © OECD/FAO 2016
It is projected that the use of vegetable oil as feedstock for biodiesel will increase by 1.5% p.a. over the next ten years compared to 16% p.a. in the previous decade when biofuel policies were taking effect. National targets for mandatory biodiesel consumption are expect to increase at a lower level than in previous years while low crude oil prices are likely to dent growth in discretionary biodiesel production. The share of vegetable oil used to produce biodiesel worldwide is expected to decline slightly from 13% of world vegetable oil demand in 2013-15 to 12% in 2025 (Figure 3.2.4).
Argentina is expected to maintain an export-oriented biodiesel industry (around 40% of produced biodiesel is exported). Vegetable oil used to produce biodiesel is expected to reach 3.0 Mt by 2025, i.e. 70% of domestic vegetable oil consumption. In the European Union, vegetable oil for biodiesel production is expected to account for 38% of domestic vegetable oil consumption by 2025. Thailand’s share shows a decline compared to the 2013-15 period and reaches 45% in 2025. In Indonesia, it is projected that following a strong decline in 2015, biodiesel production for the domestic market will grow strongly at 8.4% p.a.; but biodiesel use of total vegetable oils consumption reaches only 21% of total vegetable oil consumption in 2025, a similar value as in 2013-15. In Brazil, the share of vegetable oil use for biodiesel production declines slightly.
Protein meal consumption
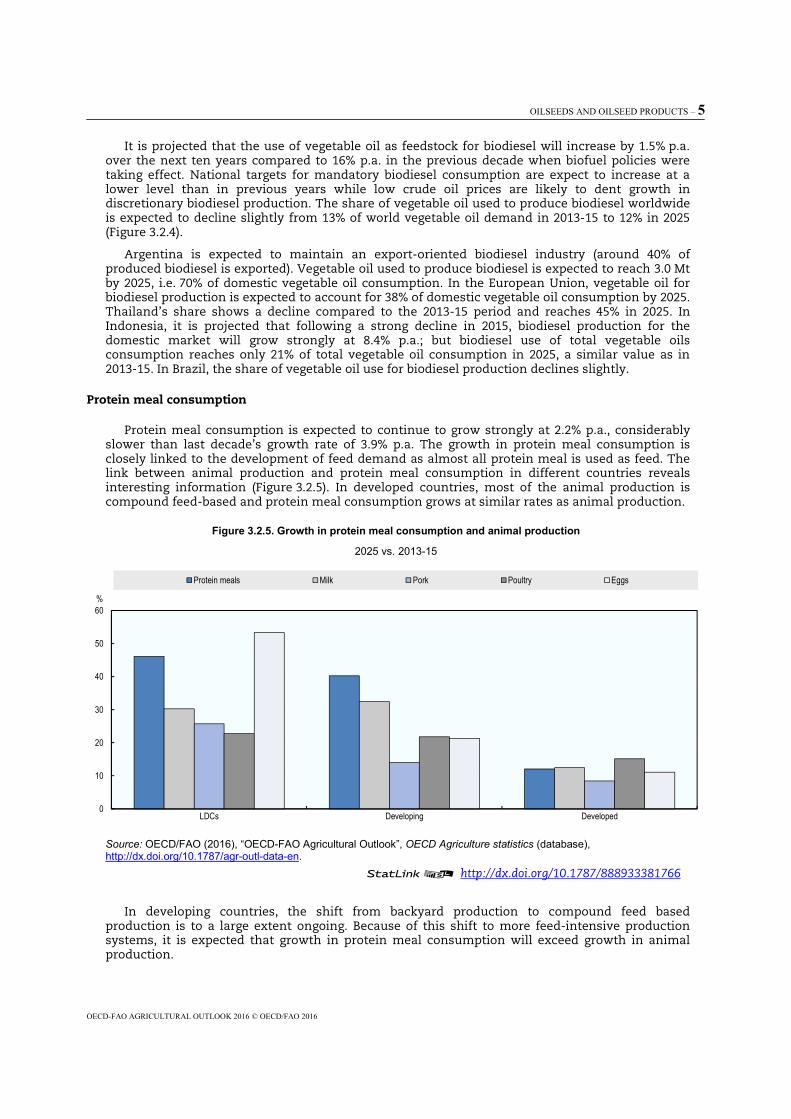
Protein meal consumption is expected to continue to grow strongly at 2.2% p.a., considerably slower than last decade’s growth rate of 3.9% p.a. The growth in protein meal consumption is closely linked to the development of feed demand as almost all protein meal is used as feed. The link between animal production and protein meal consumption in different countries reveals interesting information (Figure 3.2.5). In developed countries, most of the animal production is compound feed-based and protein meal consumption grows at similar rates as animal production.
Figure 3.2.5. Growth in protein meal consumption and animal production
2025 vs. 2013-15
Source: OECD/FAO (2016), “OECD-FAO Agricultural Outlook”, OECD Agriculture statistics (database), http://dx.doi.org/10.1787/agr-outl-data-en.
12 http://dx.doi.org/10.1787/888933381766
In developing countries, the shift from backyard production to compound feed based production is to a large extent ongoing. Because of this shift to more feed-intensive production systems, it is expected that growth in protein meal consumption will exceed growth in animal production.
0
10
20
30
40
50
60
LDCs Developing Developed
%
Protein meals Milk Pork Poultry Eggs
6 – OILSEEDS AND OILSEED PRODUCTS
OECD-FAO AGRICULTURAL OUTLOOK 2016 © OECD/FAO 2016
Protein meal consumption growth in China is projected to decline from 7.9% p.a. in the last decade to 2.7% p.a., about 2.5 Mt p.a. in absolute terms. Overall growth for compound feed demand is expected to slow due to declining growth rates for animal production and the existing large share of compound feed-based production. Secondly, the share of protein meal in China’s overall feed use surged in the last decade and now considerably exceeds the shares in the United States and European Union.
Trade
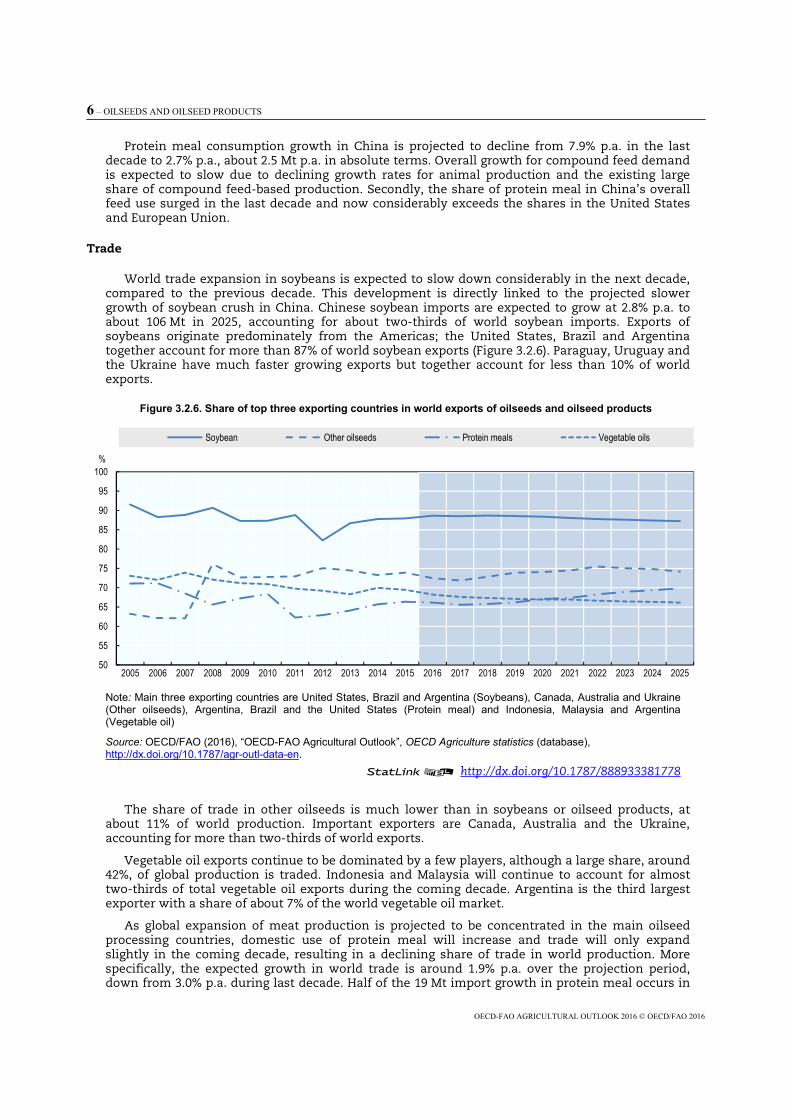
World trade expansion in soybeans is expected to slow down considerably in the next decade, compared to the previous decade. This development is directly linked to the projected slower growth of soybean crush in China. Chinese soybean imports are expected to grow at 2.8% p.a. to about 106 Mt in 2025, accounting for about two-thirds of world soybean imports. Exports of soybeans originate predominately from the Americas; the United States, Brazil and Argentina together account for more than 87% of world soybean exports (Figure 3.2.6). Paraguay, Uruguay and the Ukraine have much faster growing exports but together account for less than 10% of world exports.
Figure 3.2.6. Share of top three exporting countries in world exports of oilseeds and oilseed products
Note: Main three exporting countries are United States, Brazil and Argentina (Soybeans), Canada, Australia and Ukraine (Other oilseeds), Argentina, Brazil and the United States (Protein meal) and Indonesia, Malaysia and Argentina (Vegetable oil)
Source: OECD/FAO (2016), “OECD-FAO Agricultural Outlook”, OECD Agriculture statistics (database), http://dx.doi.org/10.1787/agr-outl-data-en.
12 http://dx.doi.org/10.1787/888933381778
The share of trade in other oilseeds is much lower than in soybeans or oilseed products, at about 11% of world production. Important exporters are Canada, Australia and the Ukraine, accounting for more than two-thirds of world exports.
Vegetable oil exports continue to be dominated by a few players, although a large share, around 42%, of global production is traded. Indonesia and Malaysia will continue to account for almost two-thirds of total vegetable oil exports during the coming decade. Argentina is the third largest exporter with a share of about 7% of the world vegetable oil market.
As global expansion of meat production is projected to be concentrated in the main oilseed processing countries, domestic use of protein meal will increase and trade will only expand slightly in the coming decade, resulting in a declining share of trade in world production. More specifically, the expected growth in world trade is around 1.9% p.a. over the projection period, down from 3.0% p.a. during last decade. Half of the 19 Mt import growth in protein meal occurs in
50
55
60
65
70
75
80
85
90
95
100
2005 2006 2007 2008 2009 2010 2011 2012 2013 2014 2015 2016 2017 2018 2019 2020 2021 2022 2023 2024 2025
%
Soybean Other oilseeds Protein meals Vegetable oils
OILSEEDS AND OILSEED PRODUCTS – 7
OECD-FAO AGRICULTURAL OUTLOOK 2016 © OECD/FAO 2016
Asia, e.g. Viet Nam increases its imports by 3.3 Mt from 2013-15 to 2025, Thailand by 2.0 Mt and the Islamic Republic of Iran by 1.8 Mt. Therefore, Asia and Africa (both North and Sub-Saharan Africa) are expected to increase their import dependency of protein meal. Latin America will remain the major exporting region.
Argentina will remain by far the largest meal exporter because it is the only country among the large protein meal producers with a very small consumption base. Other important exporters are the United States and Brazil. The largest importer is the European Union, where the increase of imports by 0.6% p.a. is expected to satisfy a slightly growing demand.
Main issues and uncertainties
In addition to the issues and uncertainties common to most commodities (e.g. macroeconomic environment, crude oil prices, and weather conditions), each oilseed sub-sector has its specific supply and demand sensitivities. The low soybean stock-to-use level at the end of the outlook period is a source of uncertainty for the stability of prices if, for example, the sector is affected by adverse weather events.
Questions over the sustainability of soybeans and palm oil production stem from the high share of soybean production that is derived from genetically modified seeds as well as the expansion of oil palm plantations into rain forests. Certification schemes, labelling, and environmental legislation might curb import demand and further area expansion, and subsequently supply growth.
Overall, crushing capacity changes are not expected since the main players should follow historical trends. However, if we look at the country-level, some minor producers might develop additional capacity, which would affect the trade patterns of oilseeds. Instead of importing oilseed products, countries might start importing raw seeds and increase their crop processing activity. Pakistan, for example, has shifted its rapeseed and protein meal imports to soybeans in order to process them domestically.
Protein meals compete directly with other feed components in the composition of compound feed and are thus reactive to any change in cereal price. In addition, changing feeding habits, especially of cattle, can alter the demand for protein meals. The adjustment of domestic cereal prices in China will affect the composition of compound feeds, which currently contain a higher share of protein meal than in developed countries and other major emerging economies.
The phasing-out of export taxes in Argentina opens new opportunities for that country’s soybeans and sunflowers and their products, although some reallocation of land might take place in favour of competing grain crops that also benefit from export liberalisation. The impact on the trade of a single commodity remains uncertain as domestic processing competes with the export of soybeans and sunflowers.
Biofuel policies in the United States, the European Union, and Indonesia and the development of mineral oil prices remain a source of major uncertainty in the vegetable oil sector because of the sizeable share of vegetable oil production used to produce biodiesel. For example, since biodiesel is considered an advanced biofuel in the Renewable Fuel Standard mandates, the uncertainties related to that policy are also relevant for the vegetable oil market.
ANNEX: COMMODITY SNAPSHOT TABLES
OECD-FAO AGRICULTURAL OUTLOOK 2016-2025 © OECD/FAO 2016124
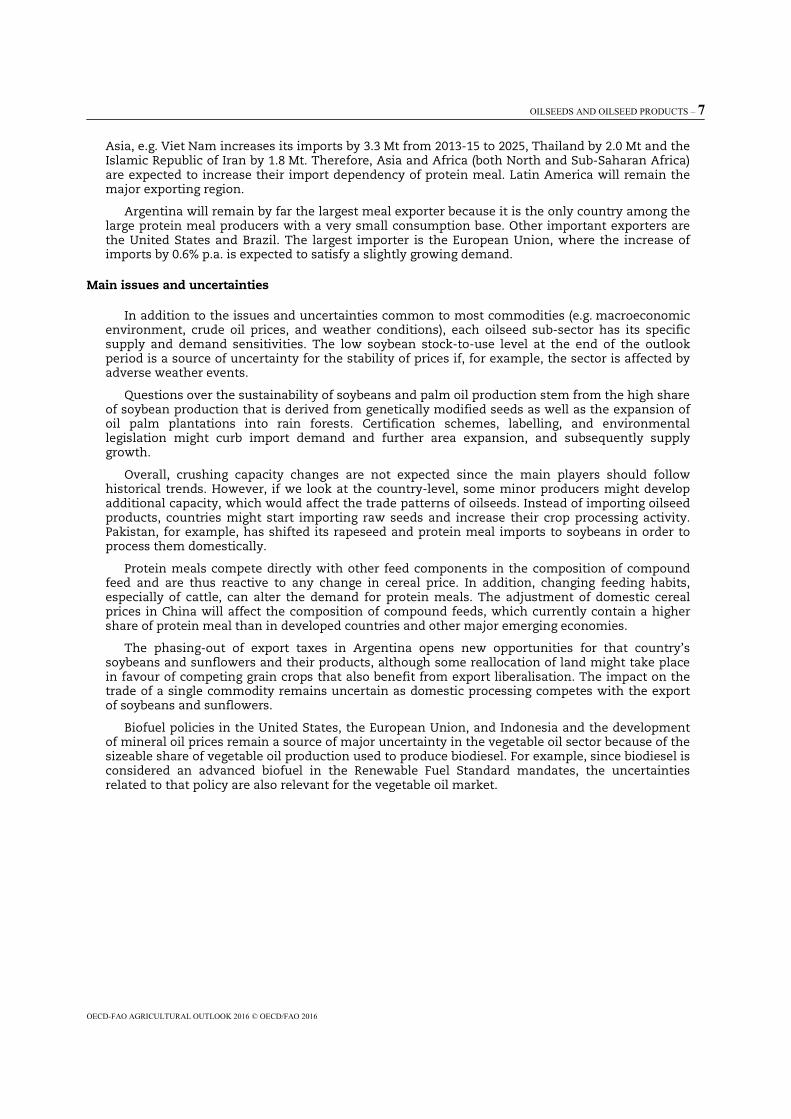
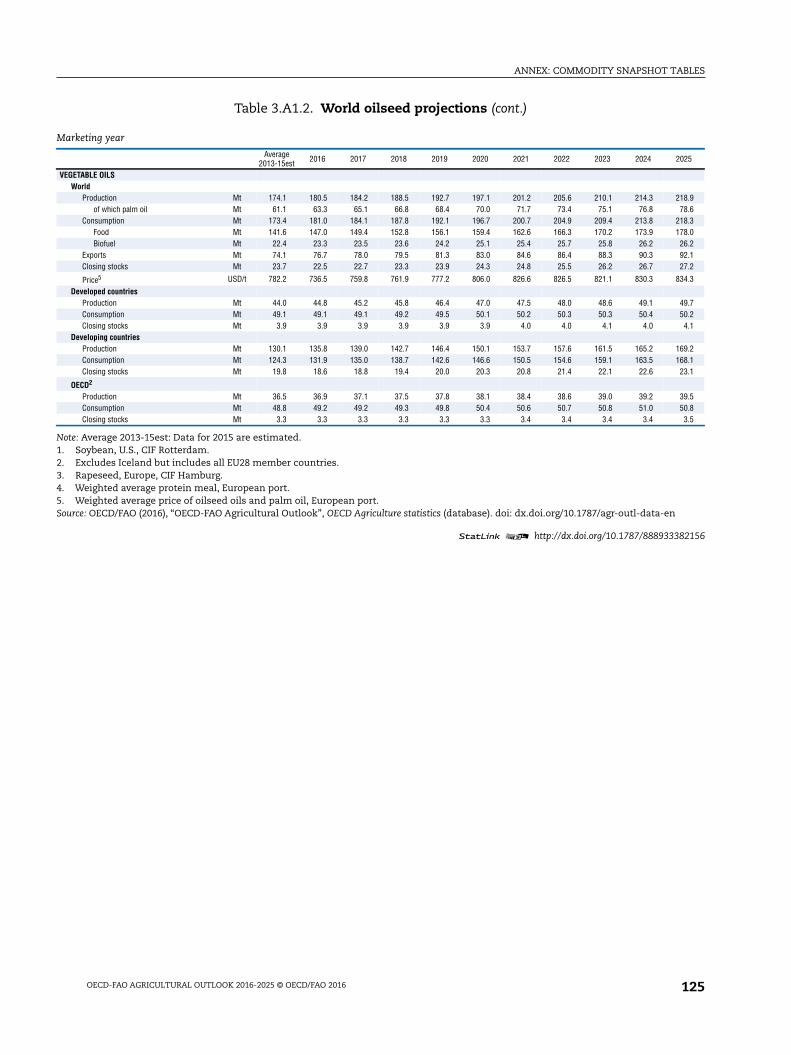
Table 3.A1.2. World oilseed projections
1 2 http://dx.doi.org/10.1787/888933382156
Marketing year
Average2013-15est 2016 2017 2018 2019 2020 2021 2022 2023 2024 2025
SOYBEANWorld
Production Mt 298.7 318.7 324.5 334.7 342.9 351.3 358.9 367.9 377.6 384.4 393.9Consumption Mt 298.8 320.9 326.7 334.9 343.2 351.9 359.0 367.2 376.6 384.0 393.9
Crush Mt 268.1 289.0 294.5 302.2 310.3 318.8 325.5 333.4 342.3 349.5 359.0Closing stocks Mt 34.6 36.2 33.9 33.7 33.5 32.9 32.7 33.4 34.4 34.8 34.8
Price1 USD/t 433.3 347.5 370.7 373.5 381.1 390.5 414.2 423.7 416.1 430.0 427.3
Developed countriesProduction Mt 117.0 121.5 123.7 126.0 127.2 128.4 129.9 131.8 133.5 134.4 135.9Consumption Mt 83.3 87.2 87.7 88.7 89.2 90.1 90.7 91.0 92.1 92.3 93.4
Crush Mt 75.3 79.3 79.7 80.5 81.4 82.3 82.9 83.2 84.2 84.6 85.7Closing stocks Mt 10.1 14.4 13.0 12.5 12.2 12.2 11.9 12.1 12.4 12.2 12.5
Developing countriesProduction Mt 181.7 197.2 200.8 208.8 215.7 222.9 229.0 236.1 244.0 250.0 258.0Consumption Mt 215.5 233.7 239.0 246.2 254.0 261.8 268.3 276.2 284.5 291.7 300.5
Crush Mt 192.8 209.7 214.8 221.6 229.0 236.5 242.6 250.2 258.1 264.9 273.3Closing stocks Mt 24.5 21.8 20.9 21.2 21.2 20.7 20.9 21.3 22.0 22.6 22.4
OECD2
Production Mt 110.3 114.0 115.5 117.5 118.4 119.3 120.5 122.0 123.4 124.0 125.1Consumption Mt 83.5 87.5 87.9 88.9 89.5 90.3 91.0 91.3 92.4 92.7 93.9
Crush Mt 75.4 79.5 79.8 80.6 81.5 82.5 83.1 83.4 84.5 84.8 86.0Closing stocks Mt 9.9 14.3 12.9 12.3 12.1 12.0 11.7 12.0 12.3 12.1 12.3
OTHER OILSEEDSWorld
Production Mt 144.5 143.6 145.9 148.0 149.8 151.7 153.6 155.5 157.1 158.9 160.7Consumption Mt 143.9 143.4 145.1 147.4 149.5 151.5 153.5 155.7 157.3 159.1 160.7
Crush Mt 119.6 118.8 120.5 122.6 124.7 126.6 128.6 130.7 132.4 134.2 135.8Closing stocks Mt 9.3 8.3 9.0 9.6 9.9 10.1 10.1 10.0 9.7 9.4 9.4
Price3 USD/t 444.7 400.5 409.0 391.6 391.0 401.9 412.5 407.2 411.8 422.3 433.1
Developed countriesProduction Mt 83.8 82.7 84.3 85.4 86.5 87.5 88.6 89.7 90.6 91.8 92.8Consumption Mt 74.8 75.3 76.3 77.5 78.5 79.5 80.5 81.5 82.3 83.3 84.0
Crush Mt 67.2 67.4 68.4 69.4 70.4 71.3 72.3 73.3 74.0 74.9 75.7Closing stocks Mt 7.0 6.9 7.6 8.1 8.4 8.6 8.6 8.4 8.1 7.8 7.8
Developing countriesProduction Mt 60.7 60.9 61.6 62.6 63.3 64.2 64.9 65.8 66.5 67.1 67.9Consumption Mt 69.1 68.1 68.8 70.0 71.0 72.0 73.0 74.2 75.0 75.9 76.7
Crush Mt 52.4 51.4 52.1 53.2 54.3 55.3 56.3 57.4 58.4 59.3 60.1Closing stocks Mt 2.3 1.4 1.4 1.5 1.5 1.5 1.5 1.6 1.6 1.6 1.6
OECD2
Production Mt 58.2 56.0 57.0 57.4 57.9 58.3 58.6 59.1 59.3 59.8 60.2Consumption Mt 54.5 53.9 54.4 54.9 55.3 55.7 56.0 56.4 56.6 56.9 57.1
Crush Mt 48.6 47.7 48.2 48.6 49.0 49.3 49.7 50.0 50.2 50.5 50.7Closing stocks Mt 5.8 5.5 6.2 6.6 6.8 7.0 7.0 6.7 6.4 6.1 6.0
PROTEIN MEALSWorld
Production Mt 301.1 317.0 322.7 330.6 338.6 346.8 353.6 361.5 369.9 377.0 385.7Consumption Mt 298.0 316.9 322.9 330.6 338.5 346.5 353.6 361.2 369.6 376.8 385.6Closing stocks Mt 16.0 16.1 15.9 16.0 16.1 16.4 16.4 16.7 16.9 17.1 17.3
Price4 USD/t 391.0 289.7 296.9 302.8 312.3 318.0 340.8 350.0 352.1 360.8 368.5
Developed countriesProduction Mt 99.4 102.0 103.0 104.5 105.7 106.9 107.9 108.6 109.7 110.4 111.6Consumption Mt 114.6 118.9 119.4 120.9 122.5 123.7 124.3 125.2 126.4 127.0 128.3Closing stocks Mt 2.2 2.0 2.0 2.1 2.1 2.2 2.2 2.2 2.3 2.3 2.4
Developing countriesProduction Mt 201.8 215.0 219.7 226.1 232.9 239.9 245.8 252.9 260.2 266.6 274.2Consumption Mt 183.4 198.0 203.4 209.7 216.1 222.8 229.3 236.0 243.2 249.9 257.2Closing stocks Mt 13.8 14.1 13.9 13.9 14.0 14.2 14.2 14.4 14.7 14.8 14.9
OECD2
Production Mt 92.5 94.8 95.5 96.8 97.8 98.7 99.5 100.0 101.0 101.4 102.4Consumption Mt 119.2 123.2 123.8 125.3 126.7 127.9 128.5 129.5 130.9 131.6 133.2Closing stocks Mt 2.1 2.0 1.9 1.9 1.9 2.0 2.0 2.0 2.0 2.0 2.0
ANNEX: COMMODITY SNAPSHOT TABLES
OECD-FAO AGRICULTURAL OUTLOOK 2016-2025 © OECD/FAO 2016 125
Table 3.A1.2. World oilseed projections (cont.)
1 2 http://dx.doi.org/10.1787/888933382156
Note: Average 2013-15est: Data for 2015 are estimated.1. Soybean, U.S., CIF Rotterdam.2. Excludes Iceland but includes all EU28 member countries.3. Rapeseed, Europe, CIF Hamburg.4. Weighted average protein meal, European port.5. Weighted average price of oilseed oils and palm oil, European port.Source: OECD/FAO (2016), “OECD-FAO Agricultural Outlook”, OECD Agriculture statistics (database). doi: dx.doi.org/10.1787/agr-outl-data-en
Marketing year
Average2013-15est 2016 2017 2018 2019 2020 2021 2022 2023 2024 2025
VEGETABLE OILSWorld
Production Mt 174.1 180.5 184.2 188.5 192.7 197.1 201.2 205.6 210.1 214.3 218.9of which palm oil Mt 61.1 63.3 65.1 66.8 68.4 70.0 71.7 73.4 75.1 76.8 78.6
Consumption Mt 173.4 181.0 184.1 187.8 192.1 196.7 200.7 204.9 209.4 213.8 218.3Food Mt 141.6 147.0 149.4 152.8 156.1 159.4 162.6 166.3 170.2 173.9 178.0Biofuel Mt 22.4 23.3 23.5 23.6 24.2 25.1 25.4 25.7 25.8 26.2 26.2
Exports Mt 74.1 76.7 78.0 79.5 81.3 83.0 84.6 86.4 88.3 90.3 92.1Closing stocks Mt 23.7 22.5 22.7 23.3 23.9 24.3 24.8 25.5 26.2 26.7 27.2
Price5 USD/t 782.2 736.5 759.8 761.9 777.2 806.0 826.6 826.5 821.1 830.3 834.3
Developed countriesProduction Mt 44.0 44.8 45.2 45.8 46.4 47.0 47.5 48.0 48.6 49.1 49.7Consumption Mt 49.1 49.1 49.1 49.2 49.5 50.1 50.2 50.3 50.3 50.4 50.2Closing stocks Mt 3.9 3.9 3.9 3.9 3.9 3.9 4.0 4.0 4.1 4.0 4.1
Developing countriesProduction Mt 130.1 135.8 139.0 142.7 146.4 150.1 153.7 157.6 161.5 165.2 169.2Consumption Mt 124.3 131.9 135.0 138.7 142.6 146.6 150.5 154.6 159.1 163.5 168.1Closing stocks Mt 19.8 18.6 18.8 19.4 20.0 20.3 20.8 21.4 22.1 22.6 23.1
OECD2
Production Mt 36.5 36.9 37.1 37.5 37.8 38.1 38.4 38.6 39.0 39.2 39.5Consumption Mt 48.8 49.2 49.2 49.3 49.8 50.4 50.6 50.7 50.8 51.0 50.8Closing stocks Mt 3.3 3.3 3.3 3.3 3.3 3.3 3.4 3.4 3.4 3.4 3.5
From:OECD-FAO Agricultural Outlook 2016-2025
Access the complete publication at:http://dx.doi.org/10.1787/agr_outlook-2016-en
Please cite this chapter as:
OECD/FAO (2016), “Oilseeds and Oilseed Products”, in OECD-FAO Agricultural Outlook 2016-2025, OECDPublishing, Paris.
DOI: http://dx.doi.org/10.1787/agr_outlook-2016-8-en
This work is published under the responsibility of the Secretary-General of the OECD and the Director-General of the FAO. Theopinions expressed and arguments employed herein do not necessarily reflect the official views of OECD member countries, orthe governments of the FAO member countries.
This document and any map included herein are without prejudice to the status of or sovereignty over any territory, to thedelimitation of international frontiers and boundaries and to the name of any territory, city or area.
You can copy, download or print OECD content for your own use, and you can include excerpts from OECD publications,databases and multimedia products in your own documents, presentations, blogs, websites and teaching materials, providedthat suitable acknowledgment of OECD as source and copyright owner is given. All requests for public or commercial use andtranslation rights should be submitted to [email protected]. Requests for permission to photocopy portions of this material forpublic or commercial use shall be addressed directly to the Copyright Clearance Center (CCC) at [email protected] or theCentre français d’exploitation du droit de copie (CFC) at [email protected].