Embed Size (px)
Citation preview

Bradford Technologies, Inc. • 302 Piercy Road • San Jose, CA 95138 • 800-622-8727 • www.BradfordSoftware.com
Redstone User’s GuideMarch 17, 2016 • v. 1.1.0
www.BradfordSoftware.com/Redstone
Page 1 of 36 dated 03/17/2016
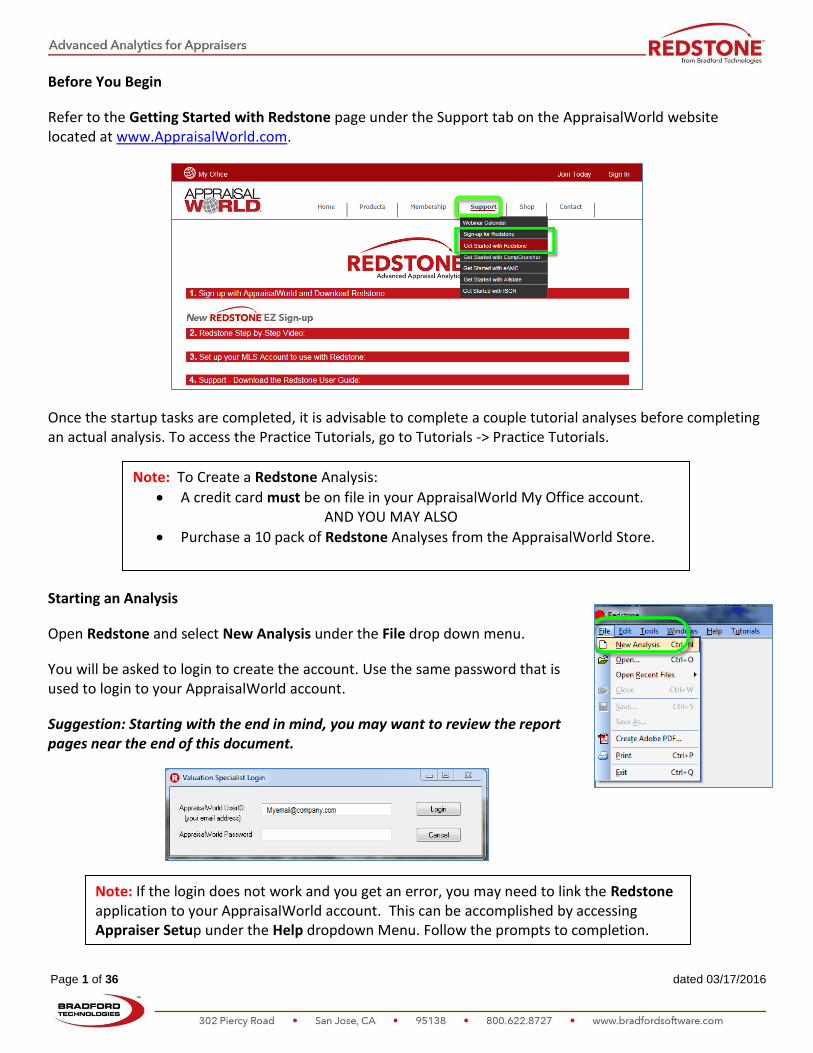
Before You Begin
Refer to the Getting Started with Redstone page under the Support tab on the AppraisalWorld website located at www.AppraisalWorld.com.
Once the startup tasks are completed, it is advisable to complete a couple tutorial analyses before completing an actual analysis. To access the Practice Tutorials, go to Tutorials -> Practice Tutorials.
Starting an Analysis
Open Redstone and select New Analysis under the File drop down menu.
You will be asked to login to create the account. Use the same password that is used to login to your AppraisalWorld account.
Suggestion: Starting with the end in mind, you may want to review the report pages near the end of this document.
Note: If the login does not work and you get an error, you may need to link the Redstone application to your AppraisalWorld account. This can be accomplished by accessing Appraiser Setup under the Help dropdown Menu. Follow the prompts to completion.
Note: To Create a Redstone Analysis:
A credit card must be on file in your AppraisalWorld My Office account. AND YOU MAY ALSO
Purchase a 10 pack of Redstone Analyses from the AppraisalWorld Store.
Page 2 of 36 dated 03/17/2016
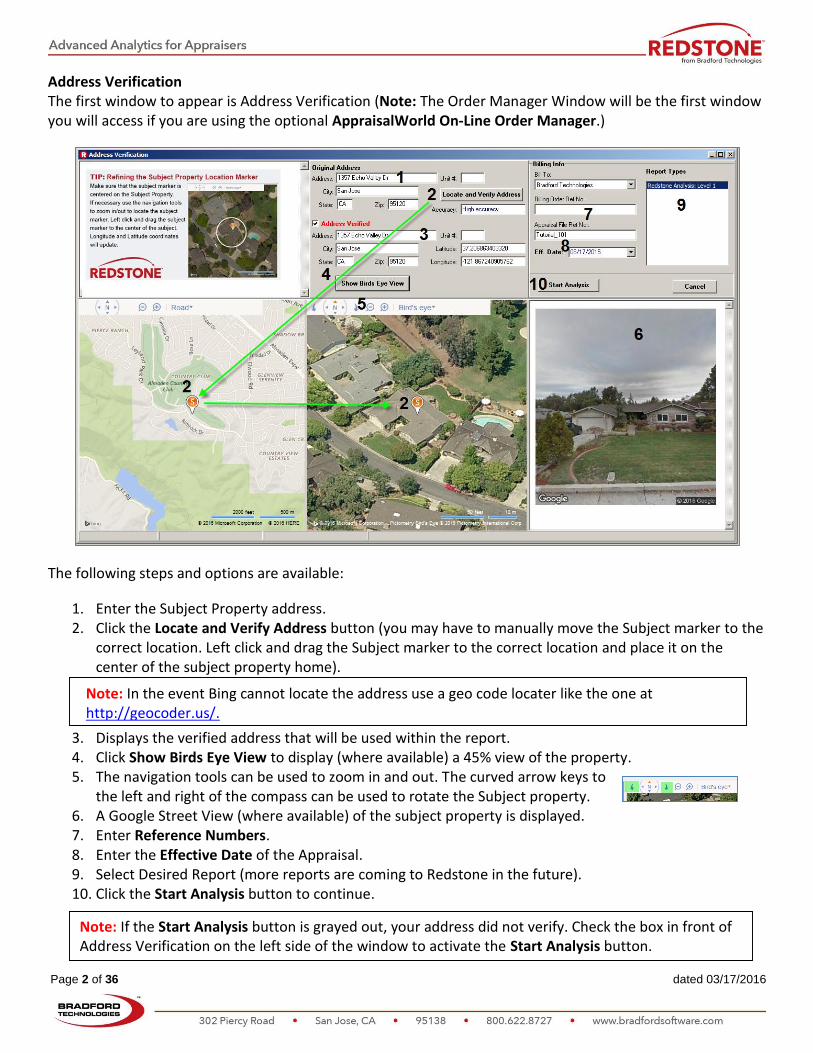
Address Verification The first window to appear is Address Verification (Note: The Order Manager Window will be the first window you will access if you are using the optional AppraisalWorld On-Line Order Manager.)
The following steps and options are available:
1. Enter the Subject Property address. 2. Click the Locate and Verify Address button (you may have to manually move the Subject marker to the
correct location. Left click and drag the Subject marker to the correct location and place it on the center of the subject property home).
3. Displays the verified address that will be used within the report. 4. Click Show Birds Eye View to display (where available) a 45% view of the property. 5. The navigation tools can be used to zoom in and out. The curved arrow keys to
the left and right of the compass can be used to rotate the Subject property. 6. A Google Street View (where available) of the subject property is displayed. 7. Enter Reference Numbers. 8. Enter the Effective Date of the Appraisal. 9. Select Desired Report (more reports are coming to Redstone in the future). 10. Click the Start Analysis button to continue.
Note: If the Start Analysis button is grayed out, your address did not verify. Check the box in front of Address Verification on the left side of the window to activate the Start Analysis button.
Note: In the event Bing cannot locate the address use a geo code locater like the one at http://geocoder.us/.

Page 3 of 36 dated 03/17/2016
Order Confirmation
If the Address, Property Indicator (S) and/or Report Type are incorrect, click No and go back to the Address Verification window to make your corrections.
Once all information is correct, click the Yes, Authorize Charge button again and credit/debit card is billed.
Saving your file
Upon confirming your report address and authorizing the Charge to your account, the Save file window opens. Enter your file name.
a. Click the Save button
Report files are saved under your Documents Library in the My Redstone>Reports file folder

Page 4 of 36 dated 03/17/2016
Overview of Drop Down Menu Bar
Below are the options available under the primary drop down menus. For the sake of time, most are typical and will not be covered here.
Important menu Options:
1. Edit: Copy Redstone Analysis copies report pages onto the clipboard for import into ClickFORMS (exclusively for ClickFORMS users). For those who use other form filler software, simply add a PDF of the Redstone Addendum to your report.
2. Orders: Links to the Order Manager. (Future Enhancement: A link to the AppraisalWorld Order Manager )
3. Window: Display multiple Redstone Analyses as a Cascade, Tile Vertically and Tile Horizontally. 4. Help: to Check What’s New for recent enhancements, fixes and current issues. 5. Help: to access this User Guide (This Document). 6. Help: to access the Regression Overview (Step-by-step walkthrough of Regression). 7. Help: Request Support opens a window for forwarding a support request. 8. Help: Send a Suggestion opens a window for forwarding a suggestion to the Product Manager. 9. Help: AppraisalWorld opens the AppraisalWorld website within your default internet browser. 10. Help: Appraiser Setup opens the Appraiser’s AppraisalWorld user profile for editing Appraiser profile
information. 11. Tutorials: Practice Properties opens the tutorial selection window. 12. Tutorials: Check MLS Data Import opens a tool to check an MLS import for missing data fields. 13. Tutorials: How to Test your MLS Data Import for missing fields
Page 5 of 36 dated 03/17/2016
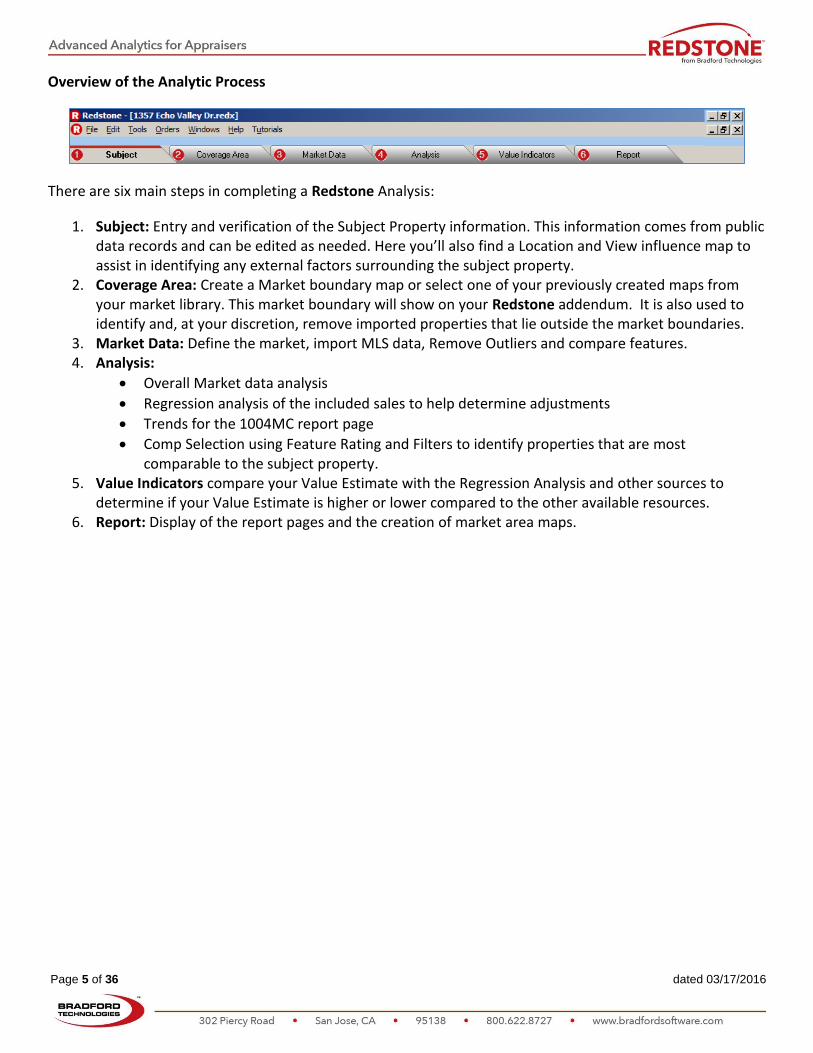
Overview of the Analytic Process
There are six main steps in completing a Redstone Analysis:
1. Subject: Entry and verification of the Subject Property information. This information comes from public data records and can be edited as needed. Here you’ll also find a Location and View influence map to assist in identifying any external factors surrounding the subject property.
2. Coverage Area: Create a Market boundary map or select one of your previously created maps from your market library. This market boundary will show on your Redstone addendum. It is also used to identify and, at your discretion, remove imported properties that lie outside the market boundaries.
3. Market Data: Define the market, import MLS data, Remove Outliers and compare features. 4. Analysis:
Overall Market data analysis
Regression analysis of the included sales to help determine adjustments
Trends for the 1004MC report page
Comp Selection using Feature Rating and Filters to identify properties that are most comparable to the subject property.
5. Value Indicators compare your Value Estimate with the Regression Analysis and other sources to determine if your Value Estimate is higher or lower compared to the other available resources.
6. Report: Display of the report pages and the creation of market area maps.
Page 6 of 36 dated 03/17/2016
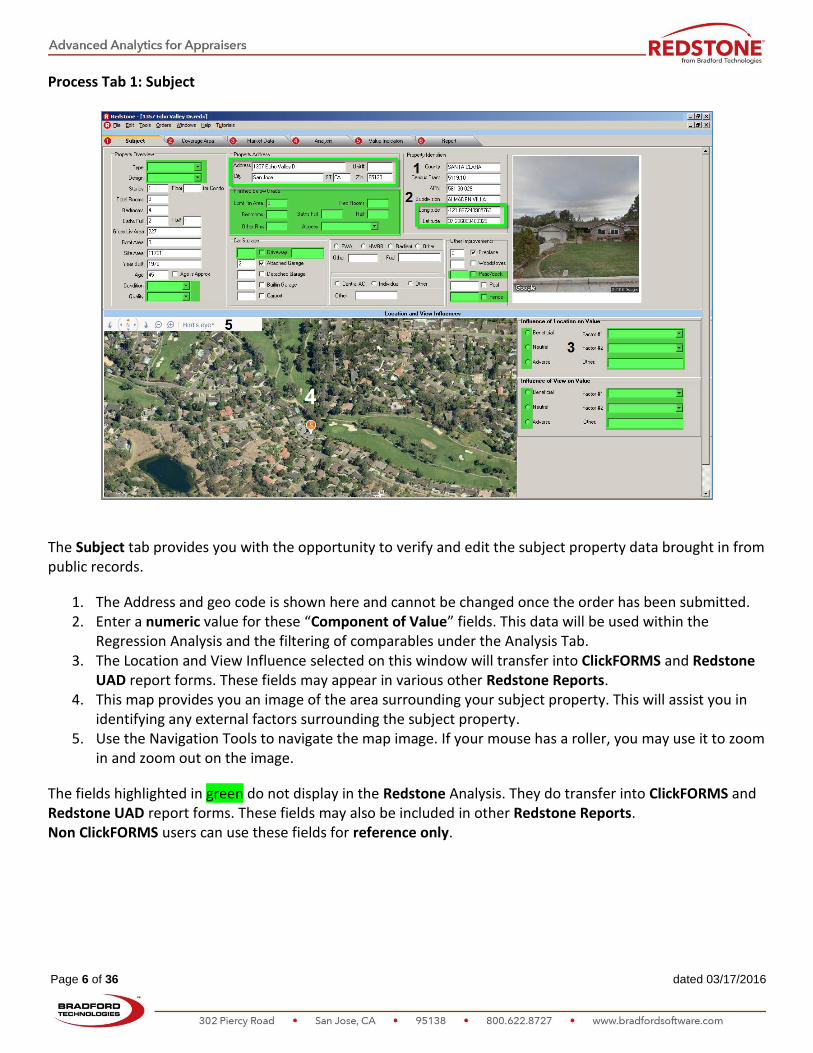
Process Tab 1: Subject
The Subject tab provides you with the opportunity to verify and edit the subject property data brought in from public records.
1. The Address and geo code is shown here and cannot be changed once the order has been submitted. 2. Enter a numeric value for these “Component of Value” fields. This data will be used within the
Regression Analysis and the filtering of comparables under the Analysis Tab. 3. The Location and View Influence selected on this window will transfer into ClickFORMS and Redstone
UAD report forms. These fields may appear in various other Redstone Reports. 4. This map provides you an image of the area surrounding your subject property. This will assist you in
identifying any external factors surrounding the subject property. 5. Use the Navigation Tools to navigate the map image. If your mouse has a roller, you may use it to zoom
in and zoom out on the image.
The fields highlighted in green do not display in the Redstone Analysis. They do transfer into ClickFORMS and Redstone UAD report forms. These fields may also be included in other Redstone Reports. Non ClickFORMS users can use these fields for reference only.
Page 7 of 36 dated 03/17/2016
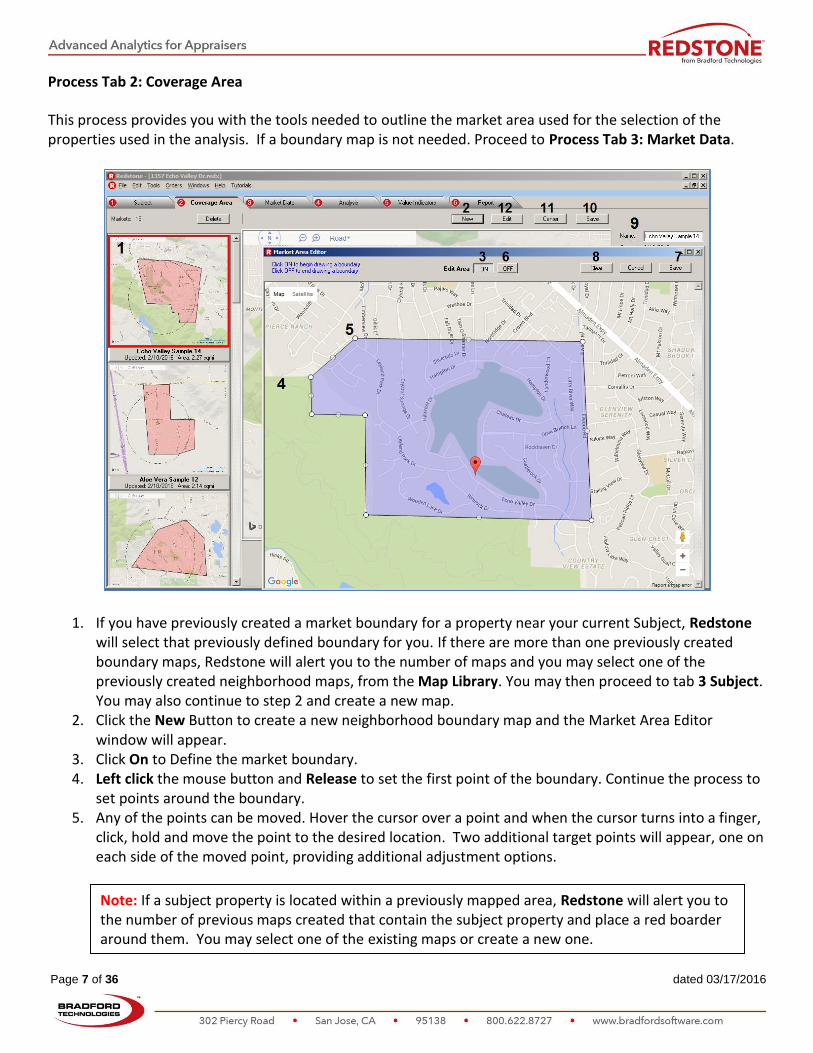
Process Tab 2: Coverage Area This process provides you with the tools needed to outline the market area used for the selection of the properties used in the analysis. If a boundary map is not needed. Proceed to Process Tab 3: Market Data.
1. If you have previously created a market boundary for a property near your current Subject, Redstone will select that previously defined boundary for you. If there are more than one previously created boundary maps, Redstone will alert you to the number of maps and you may select one of the previously created neighborhood maps, from the Map Library. You may then proceed to tab 3 Subject. You may also continue to step 2 and create a new map.
2. Click the New Button to create a new neighborhood boundary map and the Market Area Editor window will appear.
3. Click On to Define the market boundary. 4. Left click the mouse button and Release to set the first point of the boundary. Continue the process to
set points around the boundary. 5. Any of the points can be moved. Hover the cursor over a point and when the cursor turns into a finger,
click, hold and move the point to the desired location. Two additional target points will appear, one on each side of the moved point, providing additional adjustment options.
Note: If a subject property is located within a previously mapped area, Redstone will alert you to the number of previous maps created that contain the subject property and place a red boarder around them. You may select one of the existing maps or create a new one.
Page 8 of 36 dated 03/17/2016
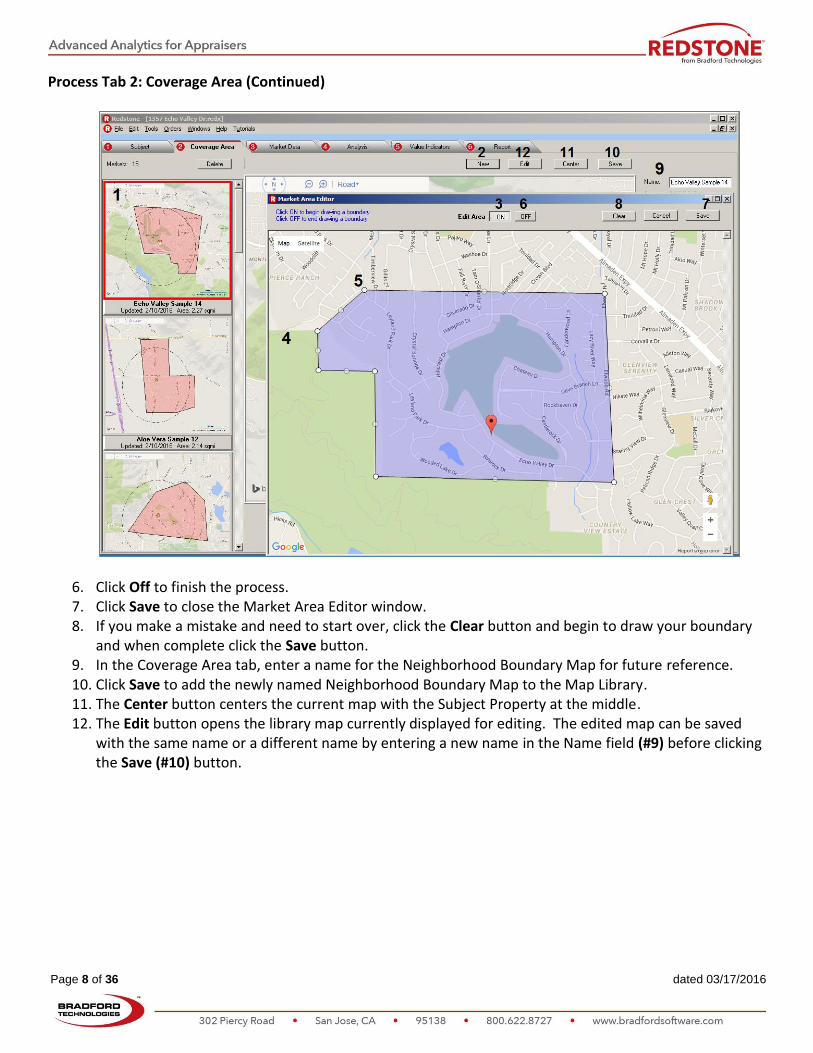
Process Tab 2: Coverage Area (Continued)
6. Click Off to finish the process. 7. Click Save to close the Market Area Editor window. 8. If you make a mistake and need to start over, click the Clear button and begin to draw your boundary
and when complete click the Save button. 9. In the Coverage Area tab, enter a name for the Neighborhood Boundary Map for future reference. 10. Click Save to add the newly named Neighborhood Boundary Map to the Map Library. 11. The Center button centers the current map with the Subject Property at the middle. 12. The Edit button opens the library map currently displayed for editing. The edited map can be saved
with the same name or a different name by entering a new name in the Name field (#9) before clicking the Save (#10) button.
Page 9 of 36 dated 03/17/2016
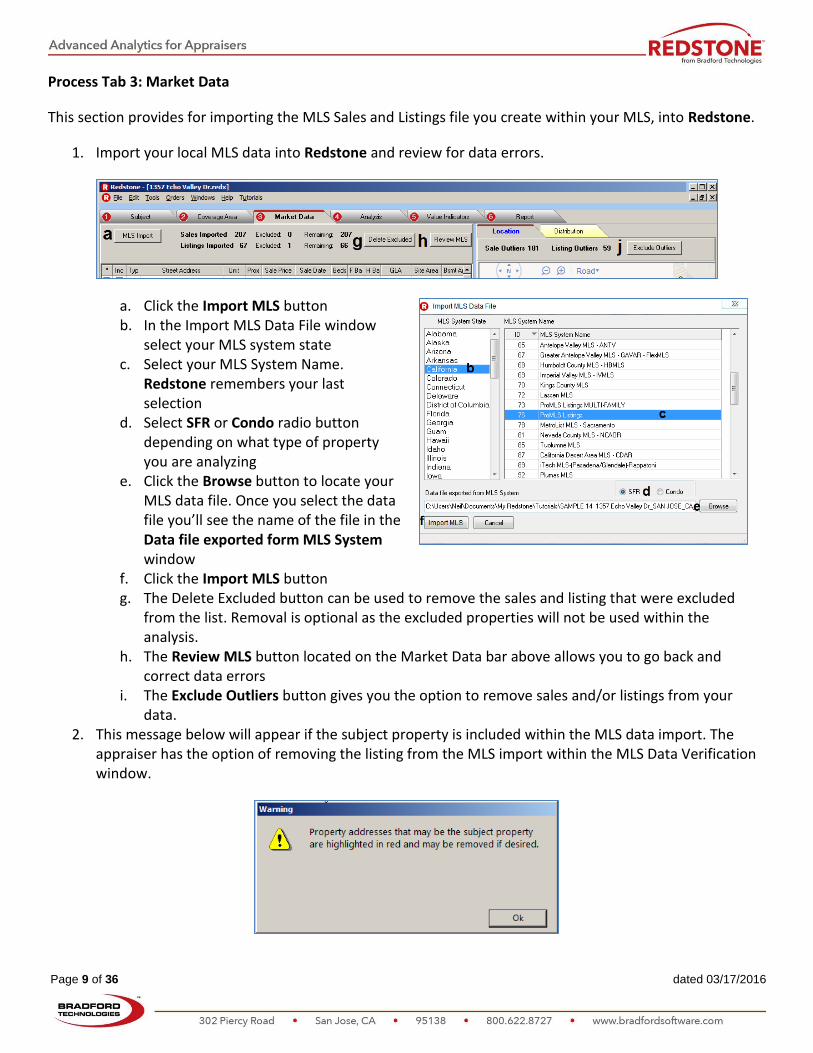
Process Tab 3: Market Data
This section provides for importing the MLS Sales and Listings file you create within your MLS, into Redstone.
1. Import your local MLS data into Redstone and review for data errors.
a. Click the Import MLS button b. In the Import MLS Data File window
select your MLS system state c. Select your MLS System Name.
Redstone remembers your last selection
d. Select SFR or Condo radio button depending on what type of property you are analyzing
e. Click the Browse button to locate your MLS data file. Once you select the data file you’ll see the name of the file in the Data file exported form MLS System window
f. Click the Import MLS button g. The Delete Excluded button can be used to remove the sales and listing that were excluded
from the list. Removal is optional as the excluded properties will not be used within the analysis.
h. The Review MLS button located on the Market Data bar above allows you to go back and correct data errors
i. The Exclude Outliers button gives you the option to remove sales and/or listings from your data.
2. This message below will appear if the subject property is included within the MLS data import. The appraiser has the option of removing the listing from the MLS import within the MLS Data Verification window.
Page 10 of 36 dated 03/17/2016
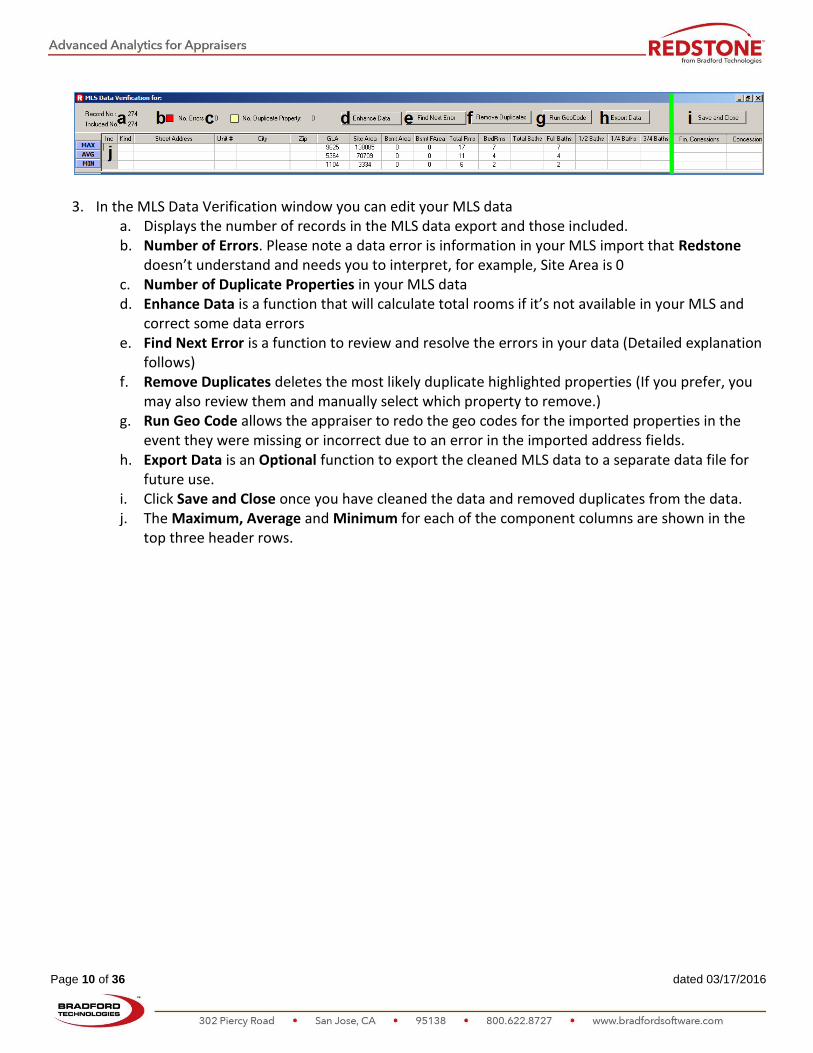
3. In the MLS Data Verification window you can edit your MLS data a. Displays the number of records in the MLS data export and those included. b. Number of Errors. Please note a data error is information in your MLS import that Redstone
doesn’t understand and needs you to interpret, for example, Site Area is 0 c. Number of Duplicate Properties in your MLS data d. Enhance Data is a function that will calculate total rooms if it’s not available in your MLS and
correct some data errors e. Find Next Error is a function to review and resolve the errors in your data (Detailed explanation
follows) f. Remove Duplicates deletes the most likely duplicate highlighted properties (If you prefer, you
may also review them and manually select which property to remove.) g. Run Geo Code allows the appraiser to redo the geo codes for the imported properties in the
event they were missing or incorrect due to an error in the imported address fields. h. Export Data is an Optional function to export the cleaned MLS data to a separate data file for
future use. i. Click Save and Close once you have cleaned the data and removed duplicates from the data. j. The Maximum, Average and Minimum for each of the component columns are shown in the
top three header rows.

Page 11 of 36 dated 03/17/2016
4. Find Next Error function provides options for reviewing and correcting imported MLS data.
a. Yellow highlighted data is the data currently presented for verification. b. Red highlighted data fields are those fields that will need verification. c. MLS Data Verification window provides multiple options for correcting or bypassing the data
issue. d. The address of the property address that contains the data issue. e. The column header that contains the data issue. For example, GLA. f. Display area for the data issue to be resolved. g. Enter the correct value in this field. h. Replace the data displayed in area f with the information displayed in g. i. Replace All the data errors with the data displayed in area f in the column e with the
information displayed in g. j. Skip the specific data error displayed in f for the property d. k. Skip Column ignores all data errors for the column e. l. Exclude Property removes the property from the data to be transferred into the analysis. If you
decide to exclude a property from the analysis, be sure that it is not potential comparable. m. Cancel stops the data review process and returns you to the Data Verification window.
The process can be resumed by clicking the Find Next Error button.
Note: Use caution in making corrections as corrections to Fireplaces, Garages, Carports, Pools and Spas are recorded. When the same entry appears again, your previous correction will be used to replace the unrecognized entry.
Note: Clicking the column header of any colum will sort the properties from either high to low or low to high based on the data contained within the column.
Page 12 of 36 dated 03/17/2016
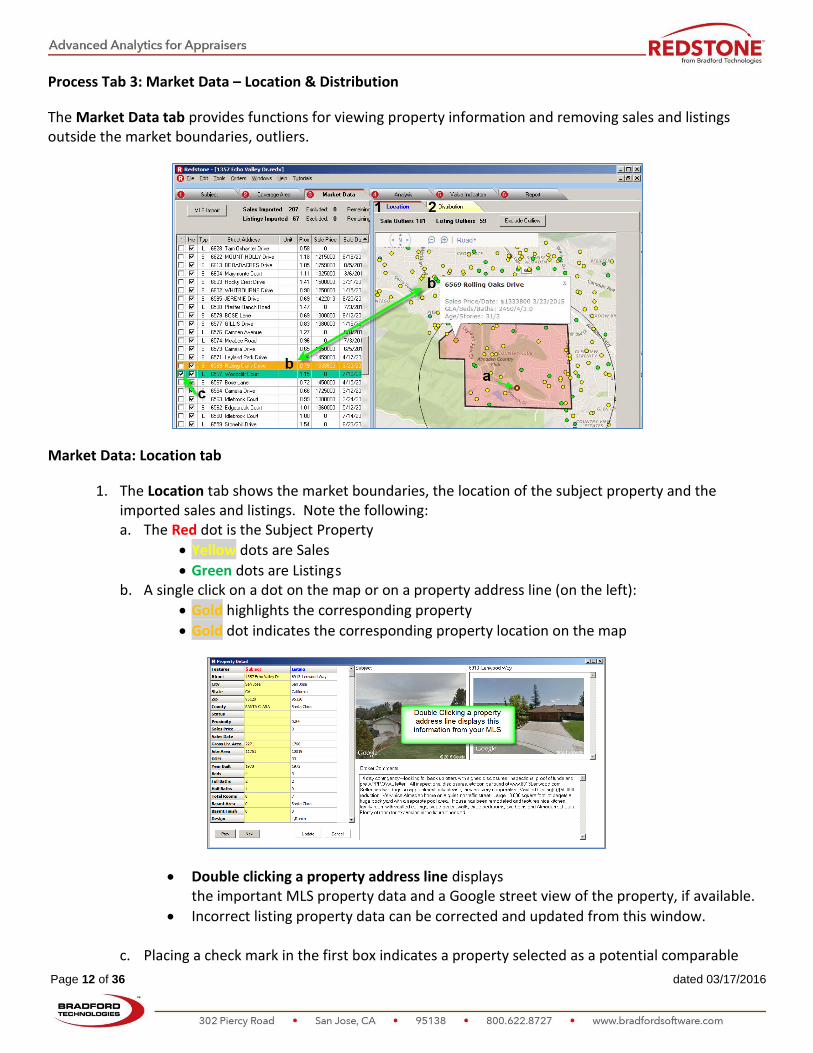
Process Tab 3: Market Data – Location & Distribution
The Market Data tab provides functions for viewing property information and removing sales and listings outside the market boundaries, outliers.
Market Data: Location tab
1. The Location tab shows the market boundaries, the location of the subject property and the imported sales and listings. Note the following: a. The Red dot is the Subject Property
Yellow dots are Sales
Green dots are Listing s b. A single click on a dot on the map or on a property address line (on the left):
Gold highlights the corresponding property
Gold dot indicates the corresponding property location on the map
Double clicking a property address line displays the important MLS property data and a Google street view of the property, if available.
Incorrect listing property data can be corrected and updated from this window.
c. Placing a check mark in the first box indicates a property selected as a potential comparable

Page 13 of 36 dated 03/17/2016
Process Tab 3: Market Data – Location & Distribution Continued
Market Data: Distribution tab
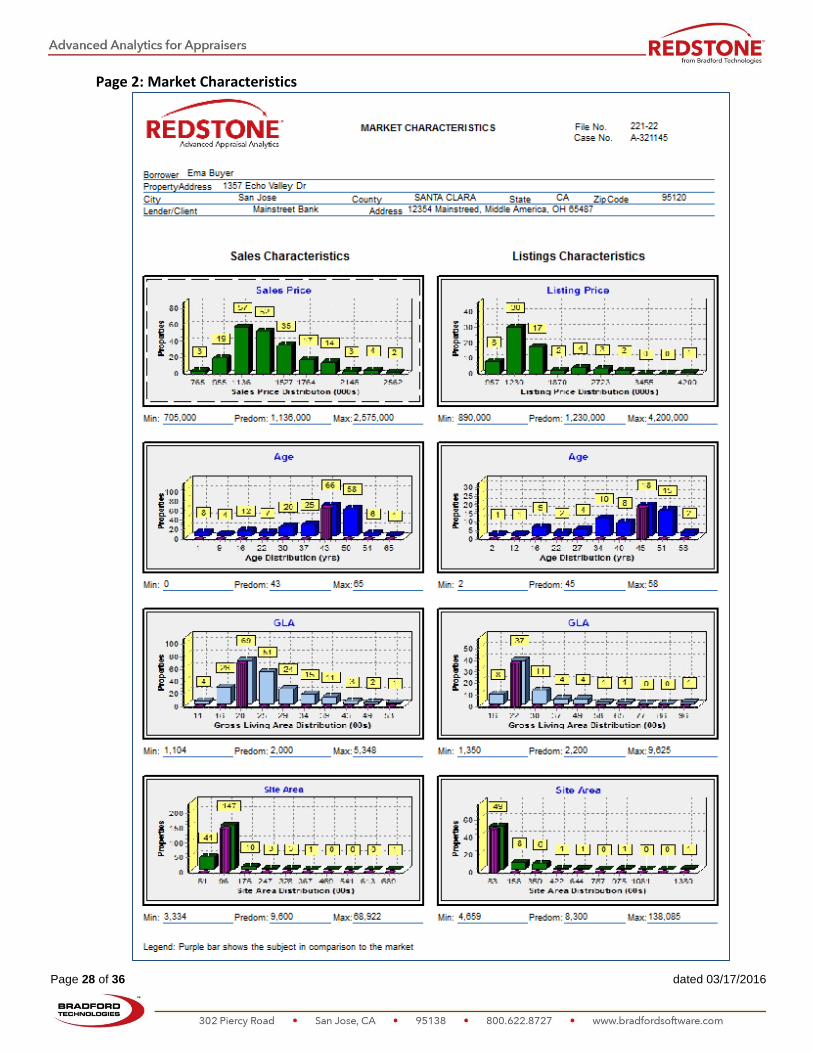
2. The Distribution tab shows histograms of the market distribution of various components of value for both sales and listings. The purple bar or the subject property indicator marks where the subject property falls within the distribution. These histograms are displayed on the second page of the report, Market Characteristics.
You may remove outliers here by unchecking the checkmark in the Include column. The histogram will update with the new information.
Note: Clicking the column header of any colum will sort the properties from either high to low or low to high based on the data contained within that column.
Page 14 of 36 dated 03/17/2016
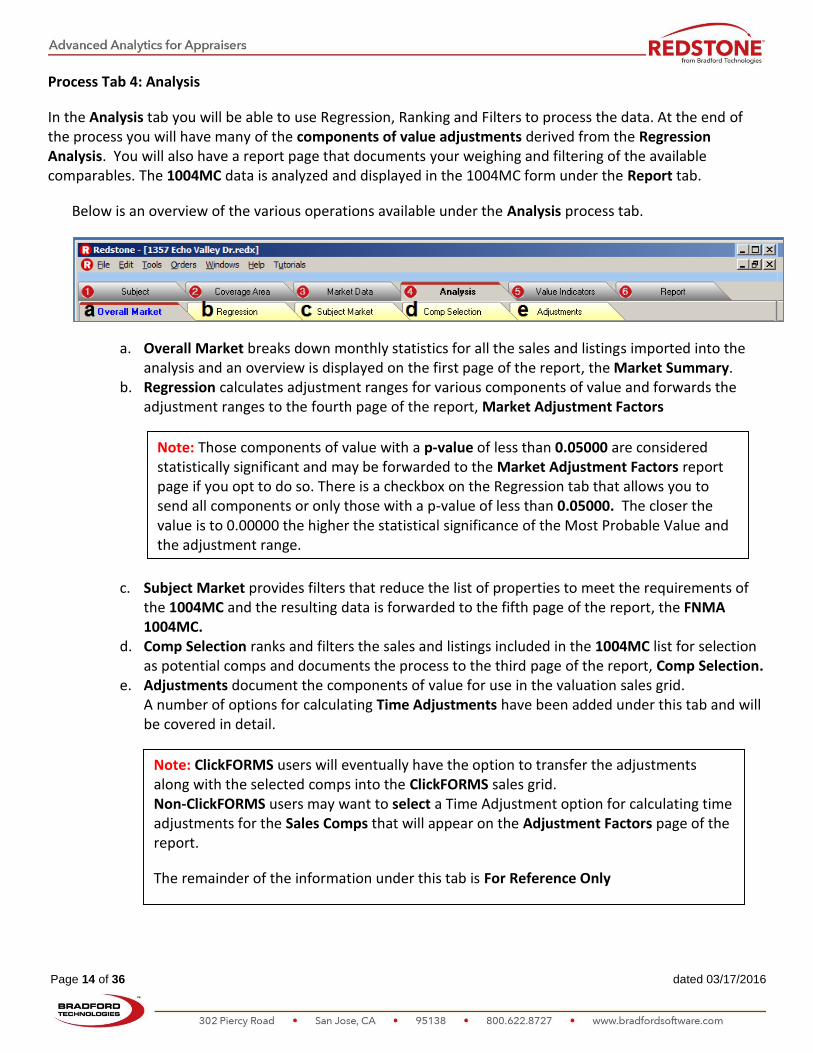
Process Tab 4: Analysis
In the Analysis tab you will be able to use Regression, Ranking and Filters to process the data. At the end of the process you will have many of the components of value adjustments derived from the Regression Analysis. You will also have a report page that documents your weighing and filtering of the available comparables. The 1004MC data is analyzed and displayed in the 1004MC form under the Report tab.
Below is an overview of the various operations available under the Analysis process tab.
a. Overall Market breaks down monthly statistics for all the sales and listings imported into the analysis and an overview is displayed on the first page of the report, the Market Summary.
b. Regression calculates adjustment ranges for various components of value and forwards the adjustment ranges to the fourth page of the report, Market Adjustment Factors
c. Subject Market provides filters that reduce the list of properties to meet the requirements of the 1004MC and the resulting data is forwarded to the fifth page of the report, the FNMA 1004MC.
d. Comp Selection ranks and filters the sales and listings included in the 1004MC list for selection as potential comps and documents the process to the third page of the report, Comp Selection.
e. Adjustments document the components of value for use in the valuation sales grid. A number of options for calculating Time Adjustments have been added under this tab and will be covered in detail.
Note: Those components of value with a p-value of less than 0.05000 are considered statistically significant and may be forwarded to the Market Adjustment Factors report page if you opt to do so. There is a checkbox on the Regression tab that allows you to send all components or only those with a p-value of less than 0.05000. The closer the value is to 0.00000 the higher the statistical significance of the Most Probable Value and the adjustment range.
Note: ClickFORMS users will eventually have the option to transfer the adjustments along with the selected comps into the ClickFORMS sales grid. Non-ClickFORMS users may want to select a Time Adjustment option for calculating time adjustments for the Sales Comps that will appear on the Adjustment Factors page of the report.
The remainder of the information under this tab is For Reference Only

Page 15 of 36 dated 03/17/2016
Analysis: Overall Market tab
The chart and graphs shown below pertain to the total properties brought into Redstone. This information is to help you to view the overall market as compared to the limited data used for the 1004MC. The information shown on the Market Summary, page one of the report, comes from the information shown here.
a. Detailed Market Analysis: Each line item is also shown as a graph below. b. Use the scroll bar on the right of the window to view each of the graphs that illustrate each line
of the Market Analysis c. Check this box to treat Pending Sales as Settled Sales d. You may select trend lines for, the last 12, 6 or 3 months to assist you as you interpret the data.
Here you can determine if the trend is increasing, decreasing or stable.

Page 16 of 36 dated 03/17/2016
Analysis: Regression tab
A preliminary analysis has been run against the data and outlying properties were removed from the list of available properties. The properties are listed to the left with the removed properties unchecked and highlighted in blue.
a. Indicates the total number of sales and the remaining number after exclusion of the outliers. b. Press the Run Analysis button after a line item has been removed from the list in area f.
(See Note below.) c. The Subject Property Indicated Sale Price by Regression
It is shown here for your reference only and is NOT shown within the report.
This is a baseline value and ranges from the amount shown plus or minus the standard error. For example, if the value shown is $100,000 and the standard error is 10% or $10,000. Then the baseline value plus or minus the standard error ranges from$90,000 to $110,000.
Regression does NOT predict value. It is setting a baseline value based upon the others sales within the selected neighborhood.
The subject properties location, view, condition and quality are not factored into the analysis.
As the analysis is based on sales for the past year, an increasing or decreasing market will affect the indicated value of the subject property.
d. A scatter-plot showing the point where each property included in the analysis falls on the graph based upon its Actual Sales Price and Predicted Value from regression.
Actual Sales Price is the horizontal X-axis and Predicted Value is the vertical Y-axis.
Note: Pressing the <Ctrl> key on your keyboard and clicking the Run Analysis button at the same time will apply the currently checked components of value to All the available properties and automatically remove outliers. This is a reset of the automatic removal of outliers using a consistent methodology.

Page 17 of 36 dated 03/17/2016
Analysis: Regression tab (Continued)
e. There are two actions that will result in a distribution of properties that will resemble a bell curve within a regression:
The initial number of properties included within the regression analysis without using constraints (size, age, price and configuration).
The removal of outliers (properties whose predicted accuracy are +/- a significant percentage from 100% accuracy).
f. The list of the Components of Value, variables, showing Most Probable Value, Probable Value Range, P-value and check boxes for excluding specific variables.
The components of value with inflated value or high p-values may be removed from the analysis.
Components of Value highlighted in yellow may be indicating a negative value.
Year Built should be a negative value.
The Sale Date value may be negative or positive depending on the market
The other components of value typically are a positive value. g. Display of the Confidence level of the Statistical Measures. h. Properties displayed in blue are outliers removed from the Regression Analysis. i. Removing the Check Mark in the Checkbox allows all of the values listed on the left to be transferred.
Remove any adjustments that you do not want to have displayed on the Adjustment Factors Report page. This option has been added as requested by appraisers. Redstone’s default setting ONLY display components of value with a p-value of less than 0.05000 to be considered statistically significant and forwarded to the Adjustment Factors report page. The closer the value is to 0.00000 the higher the statistical significance of the Most Probable Value and the adjustment range.
Note: A Regression Overview document containing information on how to refine your analysis is available under Redstone’s Help dropdown menu.
Page 18 of 36 dated 03/17/2016
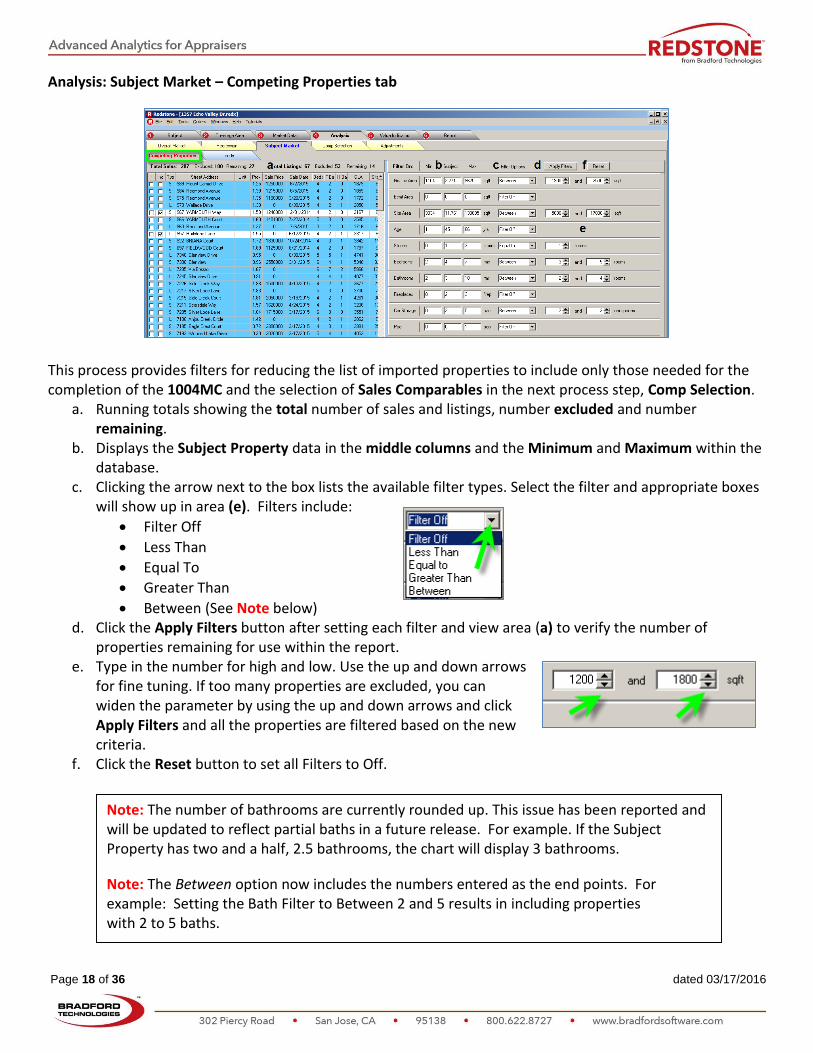
Analysis: Subject Market – Competing Properties tab
This process provides filters for reducing the list of imported properties to include only those needed for the completion of the 1004MC and the selection of Sales Comparables in the next process step, Comp Selection.
a. Running totals showing the total number of sales and listings, number excluded and number remaining.
b. Displays the Subject Property data in the middle columns and the Minimum and Maximum within the database.
c. Clicking the arrow next to the box lists the available filter types. Select the filter and appropriate boxes will show up in area (e). Filters include:
Filter Off
Less Than
Equal To
Greater Than
Between (See Note below) d. Click the Apply Filters button after setting each filter and view area (a) to verify the number of
properties remaining for use within the report. e. Type in the number for high and low. Use the up and down arrows
for fine tuning. If too many properties are excluded, you can widen the parameter by using the up and down arrows and click Apply Filters and all the properties are filtered based on the new criteria.
f. Click the Reset button to set all Filters to Off.
Note: The number of bathrooms are currently rounded up. This issue has been reported and will be updated to reflect partial baths in a future release. For example. If the Subject Property has two and a half, 2.5 bathrooms, the chart will display 3 bathrooms.
Note: The Between option now includes the numbers entered as the end points. For example: Setting the Bath Filter to Between 2 and 5 results in including properties with 2 to 5 baths.

Page 19 of 36 dated 03/17/2016
Analysis: Subject Market – Trends tab
The charts and graphs display results for sales and listings remaining after applying filters under the Competing Properties tab.
a. Effective Date is the date used within the analysis to determine all time calculations. b. Sets the option to calculate trend lines shown in area (g).
Previous 12 months
Previous 6 months
Previous 3 months
Hide Trend Lines c. Determines the tipping point for switching the bubble indicator from stable to increasing or
decreasing. For example: Setting the percentage to less than 5% would show -4.99% to 4.99% as stable. d. Check this box to treat Pending Sales as Settled Sales e. Rate and % change based on the time period of the trend line in area (b) f. Subject Market Trends radio buttons are initially set based on the calculations as shown in area (d)
within the limits set in area (c). The radio buttons can be manually changed by the appraiser. The results will be forwarded to the 1004MC report page.
g. A graph is shown for each line of the chart above. The Trend Lines are shown as set in area (b) (calculated by previous 12 month, 6 month and 3 month trends). Use the scroll bar at the right of the window to scroll down to view all of the charts.
h. You may opt to turn off Trend Lines as this may help to make the chart less cluttered. This has no impact on the period covered by the Trend Line as set in area (b) or the calculations shown in area (d).
i. The 1004MC chart calculations are shown at the bottom of the window.
Note: Selecting “Hide Trend Lines” defaults to showing the Rate and % Change in area (b) to a 12 month period. The Rate and % Change are NOT displayed within the report and are provided to assist you in determining Market Trends.
Page 20 of 36 dated 03/17/2016
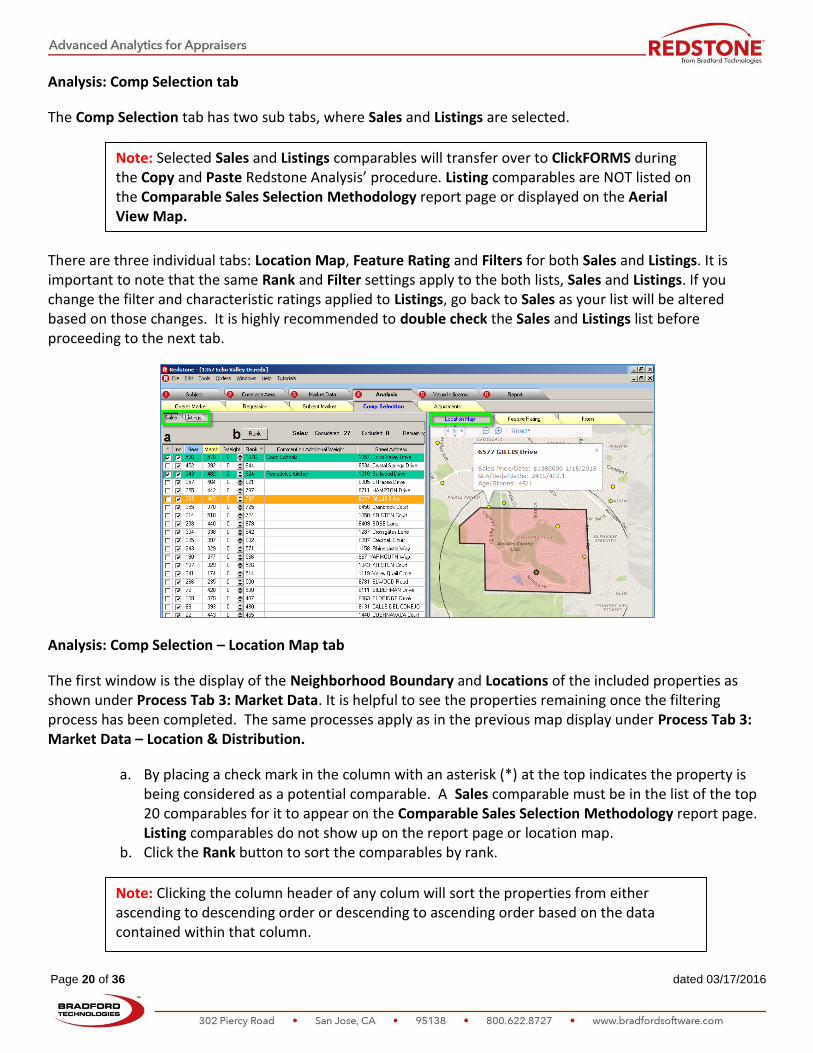
Analysis: Comp Selection tab
The Comp Selection tab has two sub tabs, where Sales and Listings are selected.
There are three individual tabs: Location Map, Feature Rating and Filters for both Sales and Listings. It is important to note that the same Rank and Filter settings apply to the both lists, Sales and Listings. If you change the filter and characteristic ratings applied to Listings, go back to Sales as your list will be altered based on those changes. It is highly recommended to double check the Sales and Listings list before proceeding to the next tab.
Analysis: Comp Selection – Location Map tab
The first window is the display of the Neighborhood Boundary and Locations of the included properties as shown under Process Tab 3: Market Data. It is helpful to see the properties remaining once the filtering process has been completed. The same processes apply as in the previous map display under Process Tab 3: Market Data – Location & Distribution.
a. By placing a check mark in the column with an asterisk (*) at the top indicates the property is being considered as a potential comparable. A Sales comparable must be in the list of the top 20 comparables for it to appear on the Comparable Sales Selection Methodology report page. Listing comparables do not show up on the report page or location map.
b. Click the Rank button to sort the comparables by rank.
Note: Selected Sales and Listings comparables will transfer over to ClickFORMS during the Copy and Paste Redstone Analysis’ procedure. Listing comparables are NOT listed on the Comparable Sales Selection Methodology report page or displayed on the Aerial View Map.
To return the list to rank order, click the Rank button.
Note: Clicking the column header of any colum will sort the properties from either ascending to descending order or descending to ascending order based on the data contained within that column.
To return the list to rank order, click the Rank button.

Page 21 of 36 dated 03/17/2016
Analysis: Comp Selection – Feature Rating tab
Feature Rating is the process used to bring the most likely Sales and Listings comparables to the top of the list.
Click the top of the Rank column to sort by rank. Moving the slide bars dynamically changes the Rank for the corresponding column. The final Rank Score (d) is calculated by adding the Near Score (a) + the Match Score (b) + the Weight Score (c).
a. The Near score combines the ratings for Proximity and (Date of Sale for Sales and Listing Date for Listing Comps) and is highlighted in blue on the right side of the window. Moving the sliders increases and decreases the significance of each of the characteristics displayed.
b. The Match score is a combined rating of characteristics and is highlighted in yellow. c. The Weight score is a value entered by the appraiser to give individual properties added
significance due to other aspects of the property. This could be related to quality, style, location, view and proximity to busy streets and commercial property. Space is provided to document the reason for adding additional weight to the property.
d. The Rank button sorts the properties by Rank order.
Note: The Near Score for Date of Sale is determined by how long ago the sale was completed. High is closer to the Effective Date, Low is further from the effective date. Listing Date, High is closer to the Effective Date, Low is further from the effective date.
Page 22 of 36 dated 03/17/2016
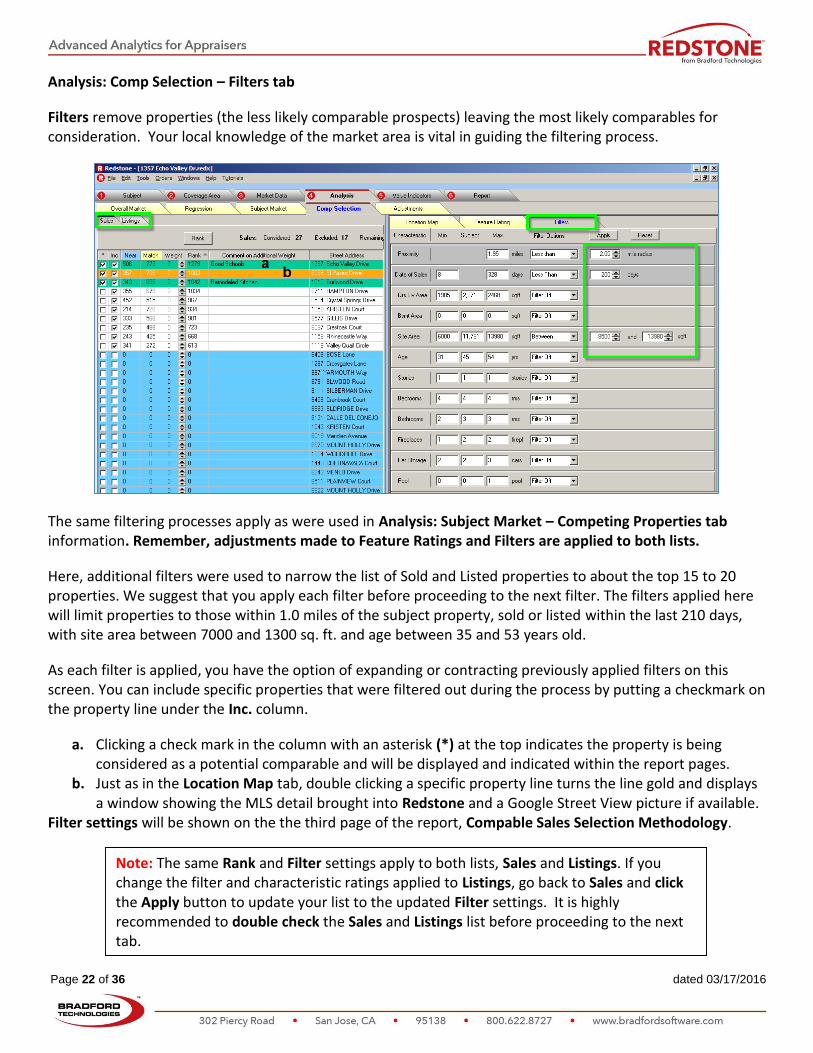
Analysis: Comp Selection – Filters tab
Filters remove properties (the less likely comparable prospects) leaving the most likely comparables for consideration. Your local knowledge of the market area is vital in guiding the filtering process.
The same filtering processes apply as were used in Analysis: Subject Market – Competing Properties tab information. Remember, adjustments made to Feature Ratings and Filters are applied to both lists.
Here, additional filters were used to narrow the list of Sold and Listed properties to about the top 15 to 20 properties. We suggest that you apply each filter before proceeding to the next filter. The filters applied here will limit properties to those within 1.0 miles of the subject property, sold or listed within the last 210 days, with site area between 7000 and 1300 sq. ft. and age between 35 and 53 years old.
As each filter is applied, you have the option of expanding or contracting previously applied filters on this screen. You can include specific properties that were filtered out during the process by putting a checkmark on the property line under the Inc. column.
a. Clicking a check mark in the column with an asterisk (*) at the top indicates the property is being considered as a potential comparable and will be displayed and indicated within the report pages.
b. Just as in the Location Map tab, double clicking a specific property line turns the line gold and displays a window showing the MLS detail brought into Redstone and a Google Street View picture if available.
Filter settings will be shown on the the third page of the report, Compable Sales Selection Methodology.
Note: The same Rank and Filter settings apply to both lists, Sales and Listings. If you change the filter and characteristic ratings applied to Listings, go back to Sales and click the Apply button to update your list to the updated Filter settings. It is highly recommended to double check the Sales and Listings list before proceeding to the next tab.
Page 23 of 36 dated 03/17/2016
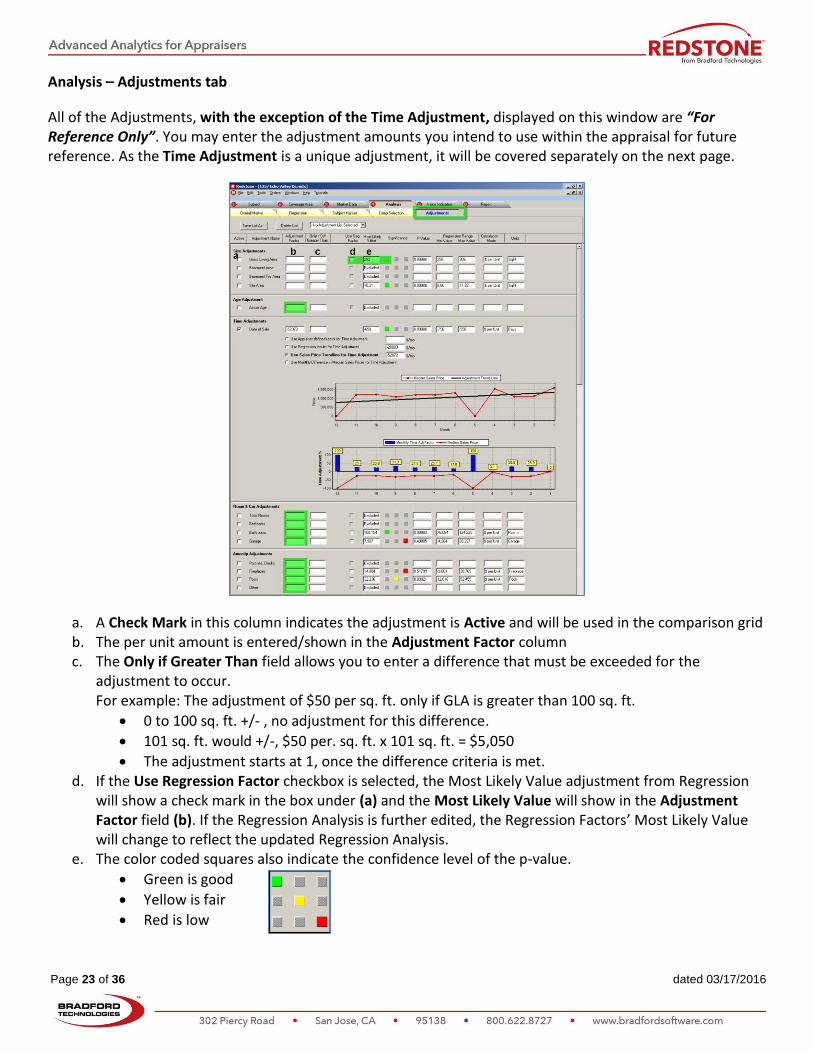
Analysis – Adjustments tab
All of the Adjustments, with the exception of the Time Adjustment, displayed on this window are “For Reference Only”. You may enter the adjustment amounts you intend to use within the appraisal for future reference. As the Time Adjustment is a unique adjustment, it will be covered separately on the next page.
a. A Check Mark in this column indicates the adjustment is Active and will be used in the comparison grid b. The per unit amount is entered/shown in the Adjustment Factor column c. The Only if Greater Than field allows you to enter a difference that must be exceeded for the
adjustment to occur. For example: The adjustment of $50 per sq. ft. only if GLA is greater than 100 sq. ft.
0 to 100 sq. ft. +/- , no adjustment for this difference.
101 sq. ft. would +/-, $50 per. sq. ft. x 101 sq. ft. = $5,050
The adjustment starts at 1, once the difference criteria is met. d. If the Use Regression Factor checkbox is selected, the Most Likely Value adjustment from Regression
will show a check mark in the box under (a) and the Most Likely Value will show in the Adjustment Factor field (b). If the Regression Analysis is further edited, the Regression Factors’ Most Likely Value will change to reflect the updated Regression Analysis.
e. The color coded squares also indicate the confidence level of the p-value.
Green is good
Yellow is fair
Red is low
Page 24 of 36 dated 03/17/2016
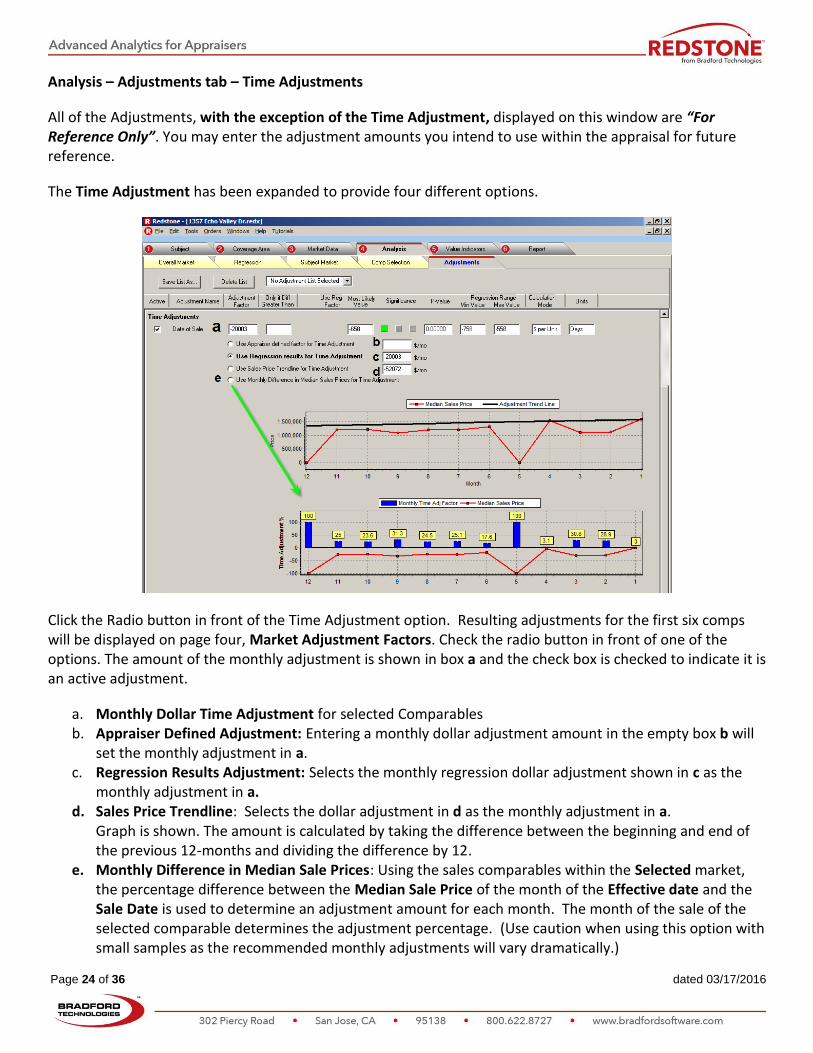
Analysis – Adjustments tab – Time Adjustments
All of the Adjustments, with the exception of the Time Adjustment, displayed on this window are “For Reference Only”. You may enter the adjustment amounts you intend to use within the appraisal for future reference.
The Time Adjustment has been expanded to provide four different options.
Click the Radio button in front of the Time Adjustment option. Resulting adjustments for the first six comps will be displayed on page four, Market Adjustment Factors. Check the radio button in front of one of the options. The amount of the monthly adjustment is shown in box a and the check box is checked to indicate it is an active adjustment.
a. Monthly Dollar Time Adjustment for selected Comparables b. Appraiser Defined Adjustment: Entering a monthly dollar adjustment amount in the empty box b will
set the monthly adjustment in a. c. Regression Results Adjustment: Selects the monthly regression dollar adjustment shown in c as the
monthly adjustment in a. d. Sales Price Trendline: Selects the dollar adjustment in d as the monthly adjustment in a.
Graph is shown. The amount is calculated by taking the difference between the beginning and end of the previous 12-months and dividing the difference by 12.
e. Monthly Difference in Median Sale Prices: Using the sales comparables within the Selected market, the percentage difference between the Median Sale Price of the month of the Effective date and the Sale Date is used to determine an adjustment amount for each month. The month of the sale of the selected comparable determines the adjustment percentage. (Use caution when using this option with small samples as the recommended monthly adjustments will vary dramatically.)
Page 25 of 36 dated 03/17/2016
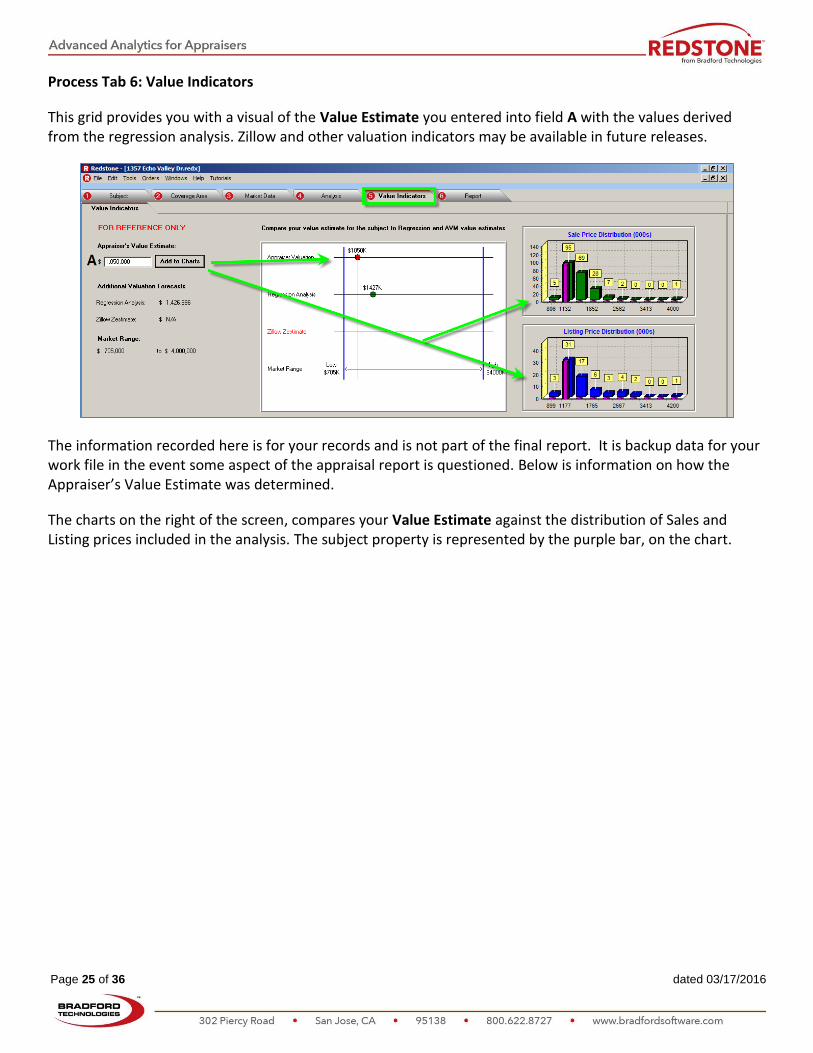
Process Tab 6: Value Indicators
This grid provides you with a visual of the Value Estimate you entered into field A with the values derived from the regression analysis. Zillow and other valuation indicators may be available in future releases.
The information recorded here is for your records and is not part of the final report. It is backup data for your work file in the event some aspect of the appraisal report is questioned. Below is information on how the Appraiser’s Value Estimate was determined.
The charts on the right of the screen, compares your Value Estimate against the distribution of Sales and Listing prices included in the analysis. The subject property is represented by the purple bar, on the chart.

Page 26 of 36 dated 03/17/2016
Process Tab 6: Reports
The Reports tab is where all the pages of the Redstone Analysis are displayed.
The following menu bar options are provided:
a. The size of the page display can be increased or decreased using the up and down arrows to the right of the percentage display
b. Maps will load automatically each time the Report tab is accessed. Select Manually Build Maps to
manually create maps before transferring the analysis by clicking the button above each map.
c. Map Labels (Optional) are accessed by clicking on the icon.
Analysis Pages Include:
1. The Market Area statistics report page contains all the sales and listing information displayed under the Analysis – Overall Market tab.
2. The Market Characteristics report page contains the histograms from the Market Data – Distribution tab.
3. The Comparable Sales Selection report page contains the Feature Ratings, Filters and Comparables selected under the Analysis – Comp Selection tab.
4. The Market Adjustment Factors report page contains a. Regression and Adjustment Values from the Analysis – Regression tab b. Comparable Time Adjustments from the Analysis Trends tab
Regression Components of Value as defined by the appraiser, are included in the report. 5. The 1004 MC report page contains the information from the Analysis – Subject Market - Trends tab
a. Information is from Analysis – Subject Market – Trends b. The text narrative is created using the Information from Analysis – Subject Market – Trends
6. The Market Trends report page displays the charts from the Analysis – Subject Market – Trends tab.

Page 27 of 36 dated 03/17/2016
Page 1: Market Area Statistics
a. Redstone automatically presents the map on the page. If you need to edit it, click the Create Map
button to bring up an area map. Control keys are provided to position, zoom in and out.
Page 28 of 36 dated 03/17/2016
Page 2: Market Characteristics
Page 29 of 36 dated 03/17/2016
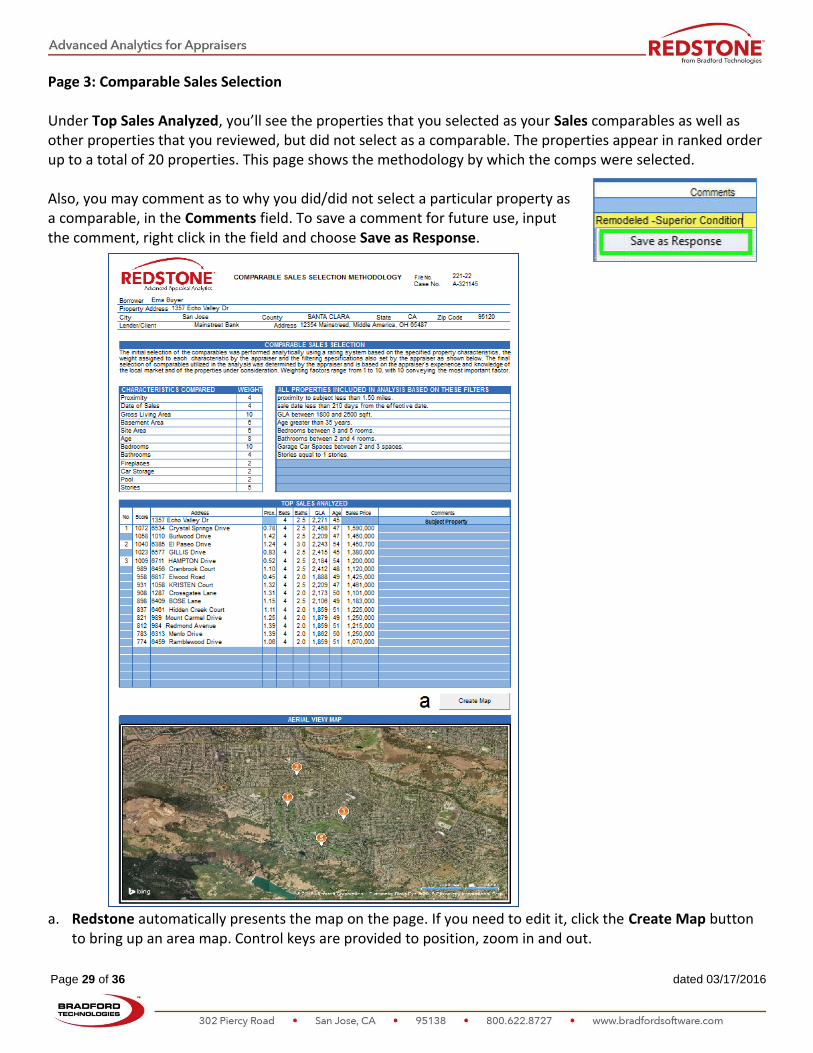
Page 3: Comparable Sales Selection Under Top Sales Analyzed, you’ll see the properties that you selected as your Sales comparables as well as other properties that you reviewed, but did not select as a comparable. The properties appear in ranked order up to a total of 20 properties. This page shows the methodology by which the comps were selected. Also, you may comment as to why you did/did not select a particular property as a comparable, in the Comments field. To save a comment for future use, input the comment, right click in the field and choose Save as Response.
a. Redstone automatically presents the map on the page. If you need to edit it, click the Create Map button
to bring up an area map. Control keys are provided to position, zoom in and out.

Page 30 of 36 dated 03/17/2016
Page 4: Market Adjustment Factors
Page 31 of 36 dated 03/17/2016
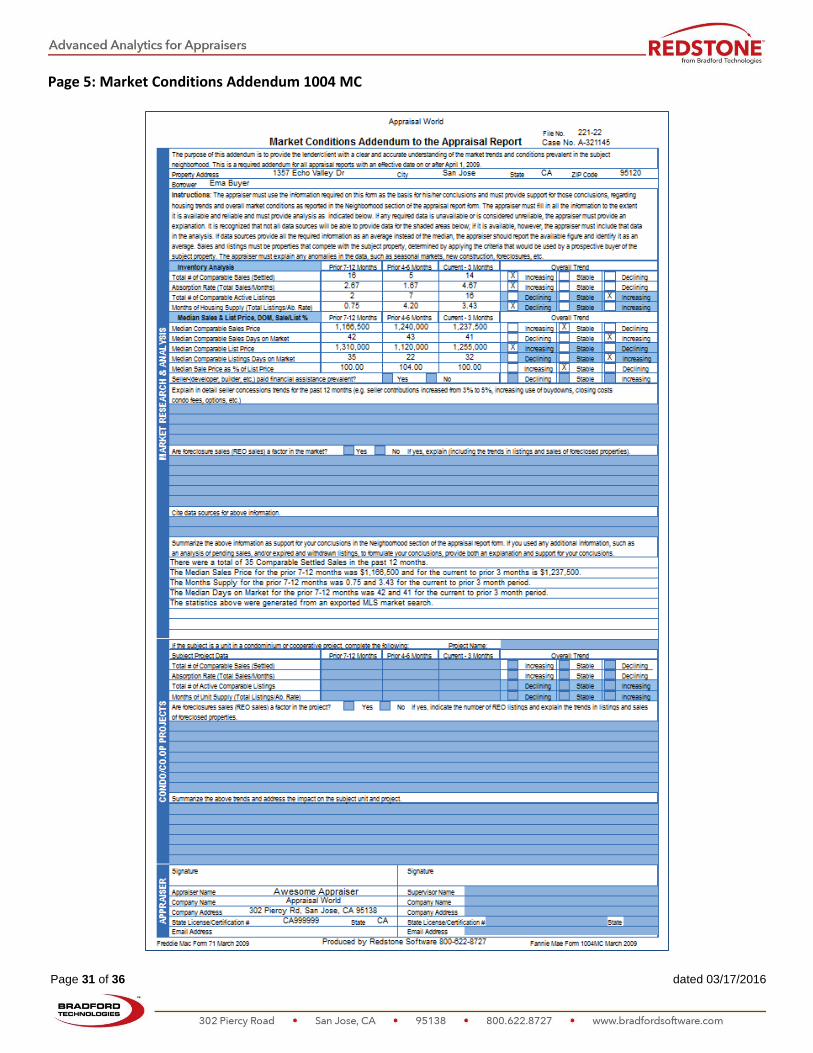
Page 5: Market Conditions Addendum 1004 MC

Page 32 of 36 dated 03/17/2016
Page 6: Market Tends
Page 33 of 36 dated 03/17/2016
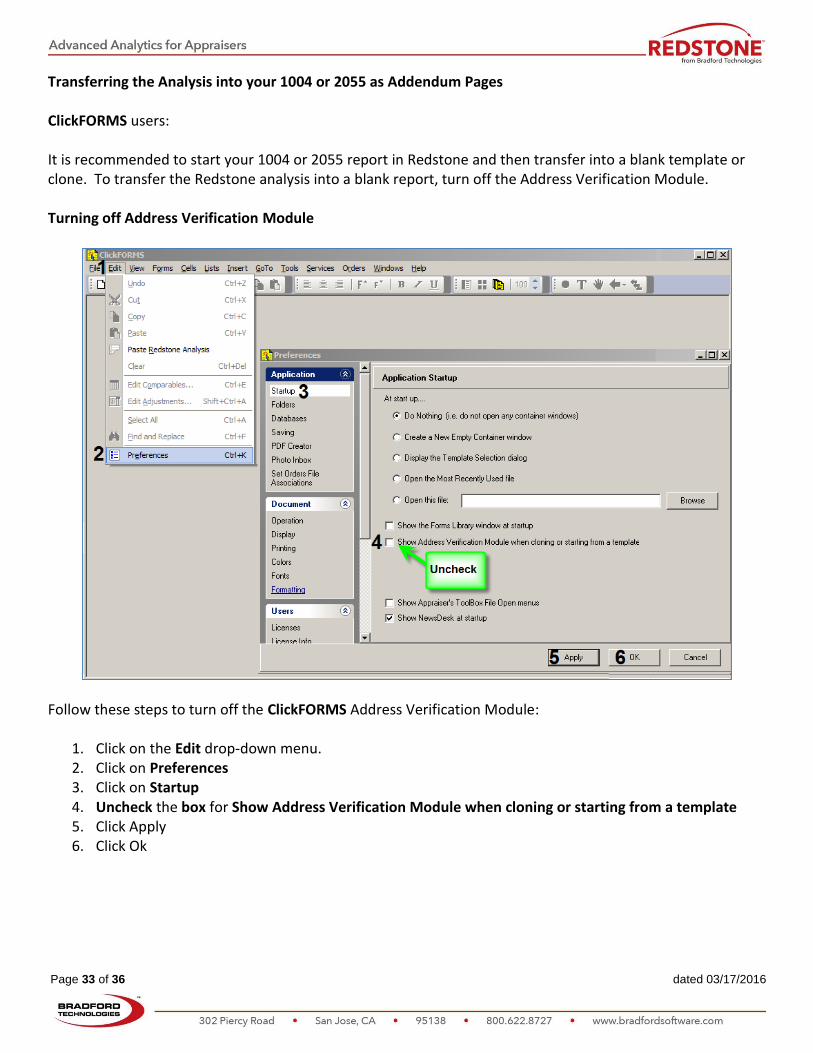
Transferring the Analysis into your 1004 or 2055 as Addendum Pages ClickFORMS users: It is recommended to start your 1004 or 2055 report in Redstone and then transfer into a blank template or clone. To transfer the Redstone analysis into a blank report, turn off the Address Verification Module. Turning off Address Verification Module
Follow these steps to turn off the ClickFORMS Address Verification Module:
1. Click on the Edit drop-down menu. 2. Click on Preferences 3. Click on Startup 4. Uncheck the box for Show Address Verification Module when cloning or starting from a template 5. Click Apply 6. Click Ok

Page 34 of 36 dated 03/17/2016
Transferring the Analysis into your 1004 or 2055 as Addendum Pages (Continued) ClickFORMS users: Follow the processes below to transfer the analysis to your 1004 and 2055 reports.
Within Redstone, Save the Redstone Analysis before using Copy.
Select the Edit > Copy Redstone Analysis function
Open ClickFORMS
Select the Edit> Paste Redstone Analysis function to complete the transfer
For users of other Appraisal software: (PDF Creation) Follow the processes below to transfer the analysis to your 1004 and 2055 reports.
Click File > Create Adobe PDF function
In the Create Adobe PDF File window select the report pages you want to include in your analysis addendum.
Import the PDF file into your 1004 or 2055 report as addendum pages using your software providers PDF import instructions.
The PDF file is stored in the Libraries>Documents>My Redstone>PDF files folder.

Page 35 of 36 dated 03/17/2016
Redstone Files and Where they are Stored
The primary Redstone files you will need to access are stored in the following folders:
a. The My Redstone file folder is located under Libraries>Documents>My Redstone b. It is recommended to place the MLS export files into the MLS Imports folder
This is the default folder for the MLS import tool
Once the MLS data has been imported into Redstone, you will see a prompt asking you if you want to move MLS export data file to the archive folder
Click Yes and the file will be moved to the newly created MLS Archive folder.
Following this process minimizes the risk of an old file accidently being re-used. c. PDF Files of Redstone Reports are saved to this default file folder d. Redstone Reports (.REDX file format) are automatically saved to this default file folder. This report file
is your electronic work file. The Backup folder is also located in the Reports folder. Here you’ll find your Backup files (.bak) in the event that you need to restore a file.
e. The User License file(s) are stored in this file folder
Page 36 of 36 dated 03/17/2016
DEFINITION OF STATISTICAL TERMS
Definitions
DEFINITION OF R-SQUARED (Coefficient of Determination): In regression analysis, a measure of the strength of the relationship between the independent variables and the dependent variable. The measure ranges from 0 to 1 - the higher the number, the stronger the relationship (0 would indicate no relationship)
DEFINITION OF ADJUSTED R-SQUARED: R-Squared can overstate the goodness of fit in a model when insignificant variables are included, or the number of variables R-Squared appropriately.
DEFINIITION OF P-VALUE: A particular statistic that measures the significance of a variable in a regression analysis. The statistic is important in inferential statistics for hypothesis testing in regression analysis. The P-Value is a measure of the randomness of a component used in the regression analysis.
DEFINITION OF COV (Coefficient of Variation): A standard statistical measure of the relative dispersion of the sample data about the mean of the data; the standard deviation expressed as a percentage of the mean.
DEFINITION OF COD (Coefficient of Dispersion): The average deviation of a group of numbers from the median expressed as a percentage of the median.
DEFINITION OF STANDARD ERROR: A measure of the precision of a measure of central tendency, the smaller the standard error, the more reliable the measure of standard tendency. In regression analysis, the standard deviation of a regression coefficient, the smaller the standard error relative to the coefficient, the more reliable the coefficient.
DEFINITION OF SALES RATIO: A measure of model accuracy that divides predicted values by sales prices. The closer to 1 that a sales ratio is, the better the model's predictive capabilities
DEFINITION OF STANDARD DEVIATION: The statistic calculated from a set number by subtracting the mean from each value and squaring the remainders, adding together all of the squares, dividing by the size of the sample less one, and taking the square root of the result. When the data are normally distributed, one can calculate the percentage of observations within any number of standard deviations of the mean from normal probability tables.
Sources Documents
The Collateral Valuation Report (CVR) has been designed in conformance with all available technology, data and statistical processes, generally accepted to represent the state of industry, including:
Uniform Standards of Professional Appraisal Practice (USPAP): Standard 1 Standard 2
Since specialized statistical and mass appraisal information is contained with Standard 6 and Advisory Opinion 18, these sources have also been considered in tandem with the Development and Reporting standards contained within Standard 1 and Standard 2. It is expressly understood that the Collateral Valuation Report is a summary appraisal report performed under the guidance of Standards 1 and 2 as noted above.
Joint Industry Task Force on Automated Valuation Models: Standards and Testing Guidelines These standards and guidelines are instructive in the method of testing accuracy and identifies the statistics and outcome guidelines that can be relied upon in performance of statistical analysis.
International Association of Assessing Officers: Standard on Ratio Studies Mass Appraisal of Real Property Standard on Automated Valuation Models
Appraisal Institute; A Guide to Appraisal Valuation Modeling Practical Applications in Appraisal Valuation Modeling and Design The 13th Edition of the Appraisal of Real Estate
Visual Valuation: Implementing Valuation Modeling and Geographic Information Systems
These texts form the body of knowledge that helps provide an understanding of the modeling process and the use of statistics in real estate.
The Modeling Process
An acceptable model will have both reasonable coefficients and satisfactory outcome statistics. The appraiser has been trained in a manner sufficient to understand the various statistical measures outlined in this report. The statistical measures defined within this analysis allow the appraiser to understand the data and draw certain conclusions based on the accuracy of the data, the amount and quality of the data, and the measures of statistical significance and accuracy of the analysis applied.
Competence
The appraiser completing the Collateral Valuation Report asserts that they have undergone sufficient training, and further, have an understanding of the statistical measures underlying the regression component of the process to generally understand the method and manner of analysis. The appraiser does not assert that they are statisticians. They are, however, aware of the basic guidelines pertaining to the use of CVR application as a tool to analyze small market datasets, and as such, are capable of understanding the analysis and methodology in a manner sufficient to render a credible estimate of value in tandem with the other data and analysis present in the report.
The final value conclusion is the appraiser's own, and is based on the appraiser's knowledge and experience in the field of appraisal. The data and analysis in this report, whether through direct information or through derived statistical information, aids the appraiser in understanding the dynamics of the neighborhood and market area.
10$10
for
Bradford Technologies, Inc. • 302 Piercy Road • San Jose, CA 95138 • 800-622-8727 • www.BradfordSoftware.com
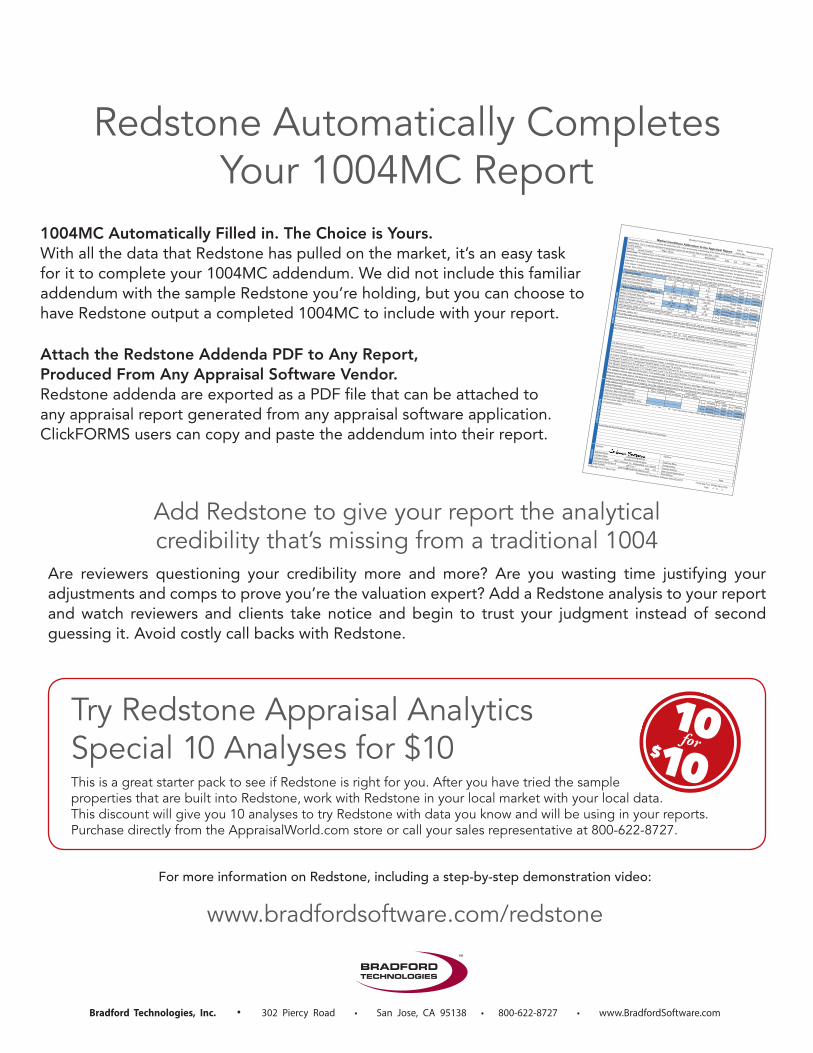
Redstone Automatically CompletesYour 1004MC Report
Add Redstone to give your report the analytical credibility that’s missing from a traditional 1004
Are reviewers questioning your credibility more and more? Are you wasting time justifying your adjustments and comps to prove you’re the valuation expert? Add a Redstone analysis to your report and watch reviewers and clients take notice and begin to trust your judgment instead of second guessing it. Avoid costly call backs with Redstone.
1004MC Automatically Filled in. The Choice is Yours.With all the data that Redstone has pulled on the market, it’s an easy task for it to complete your 1004MC addendum. We did not include this familiar addendum with the sample Redstone you’re holding, but you can choose to have Redstone output a completed 1004MC to include with your report.
Attach the Redstone Addenda PDF to Any Report, Produced From Any Appraisal Software Vendor. Redstone addenda are exported as a PDF file that can be attached to any appraisal report generated from any appraisal software application. ClickFORMS users can copy and paste the addendum into their report.
For more information on Redstone, including a step-by-step demonstration video:
www.bradfordsoftware.com/redstone
Try Redstone Appraisal AnalyticsSpecial 10 Analyses for $10This is a great starter pack to see if Redstone is right for you. After you have tried the sample properties that are built into Redstone, work with Redstone in your local market with your local data. This discount will give you 10 analyses to try Redstone with data you know and will be using in your reports. Purchase directly from the AppraisalWorld.com store or call your sales representative at 800-622-8727.
Produced by RedStone Software 800-622-8727
File No.
Market Conditions Addendum to the Appraisal Report
The purpose of this addendum is to provide the lender/client with a clear and accurate understanding of the market trends and conditions prevalent in the subject
neighborhood. This is a required addendum for all appraisal reports with an effective date on or after April 1, 2009.
Property Address
City
StateZIP Code
BorrowerInstructions: The appraiser must use the information required on this form as the basis for his/her conclusions and must provide support for those conclusions, regarding
housing trends and overall market conditions as reported in the Neighborhood section of the appraisal report form. The appraiser must fill in all the information to the extent
it is available and reliable and must provide analysis as indicated below. If any required data is unavailable or is considered unreliable, the appraiser must provide an
explanation. It is recognized that not all data sources will be able to provide data for the shaded areas below; if it is available, however, the appraiser must include that data
in the analysis. If data sources provide all the required information as an average instead of the median, the appraiser should report the available figure and identify it as an
average. Sales and listings must be properties that compete with the subject property, determined by applying the criteria that would be used by a prospective buyer of the
subject property. The appraiser must explain any anomalies in the data, such as seasonal markets, new construction, foreclosures, etc.
Inventory Analysis
Prior 7-12 Months Prior 4-6 Months Current - 3 MonthsOverall Trend
Total # of Comparable Sales (Settled)
IncreasingStable
Declining
Absorption Rate (Total Sales/Months)
IncreasingStable
Declining
Total # of Comparable Active Listings
DecliningStable
Increasing
Months of Housing Supply (Total Listings/Ab. Rate)
DecliningStable
Increasing
Median Sales & List Price, DOM, Sale/List %Prior 7-12 Months Prior 4-6 Months Current - 3 Months
Overall Trend
Median Comparable Sales Price
IncreasingStable
Declining
Median Comparable Sales Days on Market
DecliningStable
Increasing
Median Comparable List Price
IncreasingStable
Declining
Median Comparable Listings Days on Market
DecliningStable
Increasing
Median Sale Price as % of List Price
IncreasingStable
Declining
Seller-(developer, builder, etc,) paid financial assistance prevalent?Yes
No
DecliningStable
Increasing
Explain in detail seller concessions trends for the past 12 months (e.g. seller contributions increased from 3% to 5%, increasing use of buydowns, closing costs
condo fees, options, etc.)
Are foreclosure sales (REO sales) a factor in the market?Yes
No If yes, explain (including the trends in listings and sales of foreclosed properties).
Cite data sources for above information.
Summarize the above information as support for your conclusions in the Neighborhood section of the appraisal report form. If you used any additional information, such as
an analysis of pending sales, and/or expired and withdrawn listings, to formulate your conclusions, provide both an explanation and support for your conclusions.
MA
RK
ET
RE
SE
AR
CH
& A
NA
LYS
IS
If the subject is a unit in a condominium or cooperative project, complete the following:Project Name:
Subject Project Data
Prior 7-12 Months Prior 4-6 Months Current - 3 MonthsOverall Trend
Total # of Comparable Sales (Settled)
IncreasingStable
Declining
Absorption Rate (Total Sales/Months)
IncreasingStable
Declining
Total # of Active Comparable Listings
DecliningStable
Increasing
Months of Unit Supply (Total Listings/Ab. Rate)
DecliningStable
Increasing
Are foreclosures sales (REO sales) a factor in the project?Yes
No If yes, indicate the number of REO listings and explain the trends in listings and sales
of foreclosed properties.
Summarize the above trends and address the impact on the subject unit and project.
CO
ND
O/C
O.O
P P
RO
JEC
TS
Signature
Signature
Appraiser Name
Supervisor Name
Company Name
Company Name
Company Address
Company Address
State License/Certification #
StateState License/Certification #
State
Email Address
Email Address
AP
PR
AIS
ER
Freddie Mac Form 71 March 2009
Fannie Mae Form 1004MC March 2009Pageof
Bradford Technologies
Redstone SampleClient No
1 Main Street
Bakersfield
CA
93304
James Conrad
1410
13X
2.333.33
4.33X
65
3X
2.581.50
0.69X
144,200139,950
130,000
X
7466
60
X
147,425136,000
150,000X
7569
33X
100.0099.00
97.00
X
X
X
31% of the sales in the market segment had concessions ranging from $915 to $7,350 with a median of $3,378 or 2.3% of the sales price. Since
concessions are not predominant, they should be adjusted in the sales comparison approach to reflect a cash equivalent basis.X
Out 109 sales in the market segment in the past year, only 9 or 8% were REO sale, thus they are not a factor in this segment.The data source was Golden Empire Multiple Listing Service and the search perimeters encompassed the subject's defined neighborhood with size perimeters of +/-
15% and similar ages.
There were a total of 37 Comparable Settled Sales in the past 12 months.
The Median Sales Price for the prior 7-12 months was $144,200 and for the current to prior 3 months is $130,000.
The Months Supply for the prior 7-12 months was 3 and 1 for the current to prior 3 month period.
The Median Days on Market for the prior 7-12 months was 73.5 and 60 for the current to prior 3 month period.
The statistics above were generated from an exported MLS market search.
Based upon the data above, the demand exceeds supply, thus the current market is in shortage. Market times have been stable at 60 days and
exposure times are declining to 30 days. The historical price trend is declining, however the current 3 months reflects winter market conditions,
while the current listing price is increasing, thus the market is determined to be transitioning from declining to stable to increasing.
Ladonna BattersonBradford Technologies1532 Jameson Ln., Bakersfield, CA 93304
AR11111
CA
44