Embed Size (px)
Citation preview

Redesigning the Packaging Layout for a Book Binding Company
Francesca Delle Cese
Industrial Technology Department
Orfalea College of Business
March 10, 2011

ii
ABSTRACT
Powis Parker, a book binding company supplies premium quality book supplies. The current
problem with the packaging layout includes the multiple inserts and packaging components for
their two most popular products, binding strips and hardcovers. The excessive amount of
packaging material can be costly and provide more than the needed amount of packaging
material. The purpose of the project is redesigning a layout that will reduce packaging costs
while maintaining packaging performance. Although the current packaging layout has not failed
to damage product through shipment, reducing their packaging material could save costs.
The project includes the background research conducted to support the project and three
proposed solutions for each design. Each suggested layout to improve their packaging costs can
increase pallet loads and reduce packaging material. The proposed solution for binding strips can
increase pallet loads by 20 percent and reduce packaging material nearly 28 percent per unit. On
the other hand, the proposed solution for hardcovers can increase pallet loads by 16 percent and
reduce material by 12 percent per unit. However, the designs will suggest changing the sale
patterns in order to implement design. Even though the proposed solutions change the sale
pattern, the benefits of each solution show several ways to save costs. Overall, the project
suggested layouts that can reduce the packaging costs by 20 percent.

iii
ACKNOWLEDGMENTS
The author would like to thank Powis Parker for taking the time to create the project that was
proposed to them. Even though the company was busy throughout the project, they took the time
to respond promptly and provide necessary samples. The visits to the warehouse were helpful
because they took the time to give tours and willing to give the author the information needed.
The company also provided product samples needed in order to do testing. Although the
company was located in Berkeley, CA and the in person visits were limited, the company was
able to send the product samples to the author, which saved a trip to the company. Overall, the
company was supportive of the scope of the project.
Next, the author would like to thank Cal Poly’s Packaging Department that was able to supply
the author with corrugated sheets to create the design layouts for testing. This saved the author
from making an individual order of corrugated sheets which could be expensive. Additionally the
author would like to thank the department for allowing access to the dynamics lab to complete
testing. The Lansmont machinery shows industry accepted results to support the solution of the
project.
In addition to the Cal Poly Packaging Department, the author would like to thank Dr. Saha for
taking the time to review the results and guide the author to determining the best solution. The
author met with the professor several times to discuss industry questions and analyzing the
results. Lastly, I would like to thank Evan Cernokus for coming to the lab on weekends to allow
access to the labs. His willingness to come to the lab on his free time helped make the testing
possible in a timely manner.
iv
TABLE OF CONTENTS
PAGE
ABSTRACT…………………………………………………………………………………..ii
ACKNOWLEDGEMENTS………………………………………………………………….iii
LIST OF FIGURES…………………………………………………………………………..vi
LIST OF TABLES……………………………………………………………………………vii
SECTION
I. INTRODUCTION……………………………………………………………………..1
II. LITERATURE REVIEW………………………………………………………….…..7
III. SOLUTION…………………………………………………………………..………16
IV. RESULTS…………………………………………………………………………....28
V. CONCLUSION………………………………………………………………………40
APPENDIX
1. SOLUTION 1…………………………………………………………………………46
2. SOLUTION 2…………………………………………………………………………47
3. SOLUTION 3…………………………………………………………………………48
4. SOLUTION 4 AND 5…………………………………………………………………49
5. SOLUTION 6………………………………………………………………………….50
6. CURRENT BINDING…………………………………………………………………51
7. SOLUTION 1 COMPRESSION STRENGTH…………………………………….…..52
8. SOLUTION 2 COMPRESSION STRENGTH……………………………………..….53
9. SOLUTION 3 COMPRESSION STRENGTH…………………………….….……...54

v
10. SOLUTION 4 COMPRESSION STRENGTH……………………….……….……..55
11. SOLUTION 5 COMPRESSION STRENGTH……………………………….……...56
12. SOLUTION 6 COMPRESSION STRENGTH………………………………….…...57
13. SOLUTIONS 1 AND 2 CARTON…………………………………………………...58
14. SOLUTION 2 AND 3 CASE…………………………………………………………58
15. SOLUTION 4 CASE………………………………………………………………….59
16. SOLUTION 4 AND 5 INSERT………………………………………………………59
17. SOLUTION 5 CASE………………………………………………………………….60
18. SOLUTION 6 CASE……………………………………………………..…………..60
19. SOLUTION 6 INSERT………………………………………………………………..61
20. BINDING STRIP COMPARATIVE DATA…………………………………………62
21. HARDCOVER COMPARATIVE DATA…………………………………………….63

vi
LIST OF FIGURES
FIGURE
1. CURRENT BINDING STRIP LAYOUT……………………………………….……….3
2. COST REDUCTION IN PACKAGING LOGISTICS………………………...………..11
3. AREAS OF PACKAGING………………………………………………….……..……12
4. CONCEPT OF PROTECTIVE PACKAGING……………………………….….……...13
5. SOLUTION 1 LAYOUT…………………………………………………….……..……16
6. SOLUTION 2 LAYOUT……………………………………………………….….……17
7. SOLUTION 3 LAYOUT……………………………………………………….….…….18
8. SOLUTION 4 LAYOUT……………………………………………………….….……..19
9. SOLUTION 5 LAYOUT…………………………………………………….…….……..20
10. SOLUTION 6 LAYOUT…………………………………………………….…….…….20
11. PALLET LOAD: BINDING STRIPS……………………………………….….……….28
12. PALLET EFFICIENCY: BINDING STRIPS…………………………….……………..28
13. MANUFACTURER’S WASTE: BINDING STRIPS…………………………………..30
14. MANUFACTURER’S WASTE: HARDCOVERS……………………………………..32
15. SOLUTION 5 COMPRESSIONG GRAPH……………………………………………..33
16. PALLET LOAD: HARDCOVERS………………………………………………………34
17. PALLET EFFICIENCY: HARDCOVERS………………………………………………35
vii
LIST OF TABLES
TABLE
1. IMPORTANCE OF NEEDS………………………………………….…………………4
2. IMPORTANCE OF NEEDS TO LITERATURE……………………….………………14
3. BINDING STRIPSTEST SEQUENCE.............................................................................23
4. HARDCOVERS TEST SEQUENCE…………………………………………………….24
5. BINDING STRIPS TESTING RESULTS……………………………………………….25
6. HARDCOVERS TESTING RESULTS………………………………………………….26
7. SOLUTIONS COMPARED TO NEEDS………………………………………………..36

1
SECTION I
INTRODUCTION
Powis Parker is a book binding machine and book supply company located in Berkeley, CA.
Kevin Parker, the founder of the company, invented the Fastback binding machine to enable
book binding in an office environment. Today, Powis Parker supplies binding machines to every
branch of the U.S. government, fortune 500 companies and even the white house copy room. The
well-known company in the book community has a respected reputation to provide quality
products. A large part of their reputation revolves around the packaging that has not failed to
provide undamaged products to customers. However, the company purchases an excessive
amount of packaging material that can be costly
Problem Statement
The purpose of the project is redesigning the packaging layout for the most popular products,
which are hardcovers and binding strips. Powis Parker sells premium quality binding strips and
hardcovers in various widths and lengths. Currently the various binding strips are packaged using
multiple box components for transportation. The units are placed in a carton which is placed in a
case for shipment. In addition to the binding strips, the current layout for hardcovers includes
multiple packaging components such as different inserts for each hardcover and bubble wrap for
smaller hardcovers. Multiple inserts can increase the process time and require large storage
space.
Although the current packaging layout has not failed to protect the products during
transportation, the layout can be redesigned to maintain package performance while reducing
package materials and costs. A redesigned layout can be more time and space efficient than the
current process. The current method requires multiple box and insert set-up time which can slow
down production. If the components were simplified using less boxes or one insert to adjust to
different product sizes, then the improved packaging line will increase production rate as well as

2
reduce storage space. Furthermore, each packaging component except for the inserts has printing
which contributes to the product identification. A solution that reduces the number of packaging
components will also reduce the printing expenses which can be significantly expensive.
Hardcovers: The current process for hardcovers has a standard box for each product, but inserts
are used in order to fill the space inside the primary box. The use of different inserts is used to
avoid buying two different boxes for the two products. The alternative to using inserts would be
to purchase smaller boxes, which can be expensive to manufacture and make the current process
more complex. Therefore, the use of inserts for the different hardcovers is valuable for the new
design layout. In comparison to the 11” x 8.5” hardcover, the 8” x 10” hardcover uses multiple
inserts per product in order to fill the space within the box. If many inserts are used for a low
fragility product, the product is not optimizing space utilization. After the hardcovers are
wrapped in the corrugated insert, they are placed inside a regular slotted container (RSC) end
loading case. The current hardcovers are palletized using the end loading box without additional
boxes. This reduces the amount of material and the different inserts needed on hand for
packaging. During the visit to Powis Parker, it was observed that the packaging process for the
hardcovers has one worker with easily accessible different materials.
Binding Strips: On the other hand, binding strips are packaged in individual Solid Bleached
Sulfate (SBS) paperboard boxes that vary in size for the different types of strips. For
transportation, five SBS boxes are placed within a secondary Regular Slotted Container (RSC).
Each type of binding strip fits within the current secondary package, but there is a large amount
of headspace within the RSC box. Following this step, five of the RSC boxes are placed in a
larger RSC box, shrink wrapped and palletized for shipping. In addition, the secondary package
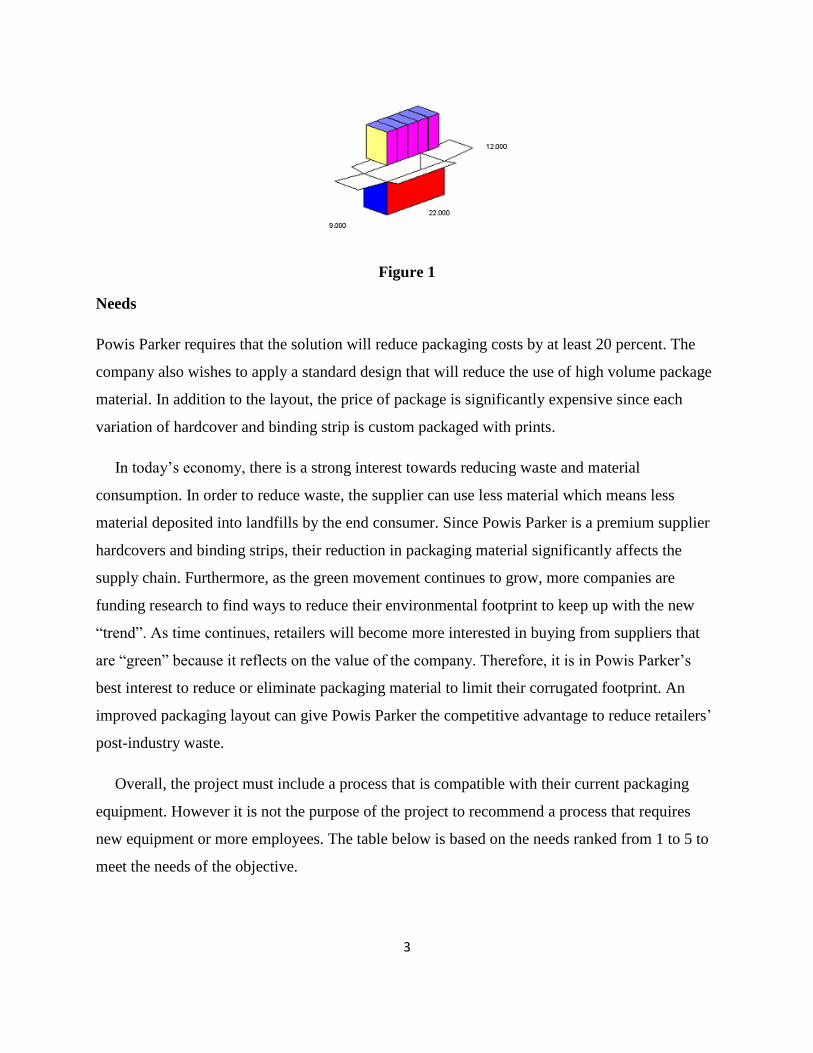
has a significant head space that is not filled by the largest binding strip. Below in figure 1 shows
the current layout for binding strips.
3
Figure 1
Needs
Powis Parker requires that the solution will reduce packaging costs by at least 20 percent. The
company also wishes to apply a standard design that will reduce the use of high volume package
material. In addition to the layout, the price of package is significantly expensive since each
variation of hardcover and binding strip is custom packaged with prints.
In today’s economy, there is a strong interest towards reducing waste and material
consumption. In order to reduce waste, the supplier can use less material which means less
material deposited into landfills by the end consumer. Since Powis Parker is a premium supplier
hardcovers and binding strips, their reduction in packaging material significantly affects the
supply chain. Furthermore, as the green movement continues to grow, more companies are
funding research to find ways to reduce their environmental footprint to keep up with the new
“trend”. As time continues, retailers will become more interested in buying from suppliers that
are “green” because it reflects on the value of the company. Therefore, it is in Powis Parker’s
best interest to reduce or eliminate packaging material to limit their corrugated footprint. An
improved packaging layout can give Powis Parker the competitive advantage to reduce retailers’
post-industry waste.
Overall, the project must include a process that is compatible with their current packaging
equipment. However it is not the purpose of the project to recommend a process that requires
new equipment or more employees. The table below is based on the needs ranked from 1 to 5 to
meet the needs of the objective.

4
Table 1: Importance of Needs
Description of Needs Importance
Recommendation is easy to implement 4
Maintain package quality while reducing costs
4
Process is simpler and faster than current
process
4
Low Manufacturing Costs 4
Maintain Product Identification 3
Environmentally conscience packaging 3
The factors of the project are to maintain package quality, compatibility, product
identification, while lowering manufacturing costs. All factors are influential when deciding
whether or not the project could be valuable to Powis Parker. In order for the project to meet the
highest expectations of the company, all factors must be heavily weighted during research and
testing. Hence the conclusion will be more valuable if the results show a solution that maintains
package quality, compatibility, product identification, while lowering manufacturing costs.
Background or Related Work
The popular use of corrugated board in the packaging industry is due to the weight to strength
ratio as well as the material’s ability to shape to the needs of the product. Powis Parker currently
uses corrugated as the primary packaging material for their packaging layout and inserts.
However the company’s current packaging layout was designed ten to twelve years ago and there
is no documented data that created the design. Their current supplier, Stephen Gould located in
Fremont, CA supplies the company the majority of corrugated packaging material and could
have contributed to the current layout. Unfortunately due to loss of records and the time that has
passed since the implementation of the design, it is difficult to be certain who created the current
layout.
Objectives
The objective of the project is to provide Powis Parker with a recommendation to improve their
packaging. The objectives include:

5
a) An efficient packaging process that reduces the current packaging costs.
b) A universal package design that can be implemented for a family of products.
c) An efficient packaging process that reduces packaging material storage space.
d) Create a secondary/tertiary package that will maximize pallet loads.
An efficient packaging process could potentially reduce the package flow time; therefore
increase product output. In order to meet these objectives, samples will be needed to simulate
packaging performance in the Packaging Dynamics Lab. The suggested packaging layout will
require cooperation with the current supplier to provide the design on a large scale. However, it
will be more of an advantage for Powis Parker to change now in order to save costs.
Contribution
A company’s packaging process can affect the company in more ways than just packaging. For
example, since the current process requires multiple steps and a number of people for the
packaging line, a simple process may need fewer workers while the other workers can work in
other areas of the company. Additionally, an improved layout can benefit retailers through Powis
Parker’s environmental impact. As a result of a redesigned layout, the end consumer or the
retailer that receives the products would receive less packaging material. As a supplier, a
reduction in material will make it easier for retailers to handle the supplier’s product and should
make their product more user friendly for the retailer. In today’s environmentally conscious
society, using less material can give Powis Parker a competitive advantage against other book
material suppliers. Furthermore, the solution could increase Powis Parker’s storage space
availability. A large amount of packaging material also means a large amount of storage space. If
the packaging material is limited to the minimal amount of material needed to protect the
product, less storage space will be needed. Therefore, the available storage space can be
consumed by other products or materials of the company or leave room for more organization.
An improved layout also means changes made to the pallet load. If the packaging volume is
exploited to its full potential, then pallet loads can be redesigned to maximize pallet load.
Overall, the project will improve the packaging process as well as reduce the current costs.

6
Scope of Project
Due to limited lab time and testing, suggestions are based on the results found in the Dynamics
lab. Unfortunately, there will be no field testing; therefore results will be determined by the
results shown in the Dynamics lab, which fulfills the ASTM D4169 standards for packaging
performance. To test the corrugated designs, product samples will be needed to observe the
package performance. Therefore the project is also limited to the product samples that are
provided; therefore dummy weights may be used to simulate a full case load. The scope of the
project will consist of the improved package design test results and the resources that provide the
necessary information to support the proposed solution. The few visits to the facility need to be
productive and valuable since Powis Parker is located in Berkeley, California. Most of the
communication made during the project will be conducted through email and phone.

7
SECTION II
LITERATURE REVIEW
The purpose of the project is providing a solution that will reduce Powis Parker’s packaging
costs. The main focus of the project is reducing costs while maintaining or improving packaging
performance. The redesigned layout will also be a universal package design for family products.
A suggested solution will optimize space utilization of the corrugated boxes used for both
hardcovers and binding strips. The literature review includes the research needed to support the
purpose of the project. Therefore, the review briefly touches the general information on
corrugated board, the current packaging problems and the ways to reduce packaging costs.
Overall, the literature review should give the reader more knowledge about package performance
and some industry methods to reduce packaging costs.
History of Corrugated
In this section, the fundamentals of corrugated material are included in the report to document
the components of the material studied in the research. According to FEFCO (2008), corrugated
board was invented during the 19th
Century to protect goods. The basic three components that
make up the corrugated board are the two sheets of paper (liners), which are glued to the fluting
(medium). In the year 1856, two Englishmen Healey and Allen used a manual flute making
machine that used two flute-shaped gears to form sheets into mediums. At first, the flute was
used for the lining of hats before its use for boxes. In 1881, the Thompson and Norris company
created the first machine to create single face liner, which consists of one sheet and one medium
(FEFCO, 2008). In the years following, the production of corrugated board grew rapidly and
became the new industrial discovery for the packaging industry. Although the basic components
of corrugated board continue to exist, many changes have been made to meet the needs for
different packaging purposes such as different flute sizes and grades of liners (FEFCO, 2008).
8
The history of corrugated is important to determine the basic functions of the material used in the
project.
Paperboard
In comparison to corrugated board, Paperboard is thin and provides a quality print surface.
Paperboard can be coated with bio-based polymers to enhance barrier properties. The current
paperboard used for the primary packaging of the binding strips is Solid Bleached Sulfate (SBS).
For example, Powis Parker’s current use of Solid Bleached Sulfate (SBS) for binding strips
provides a high quality surface to print graphics. SBS is coated with a thin layer of Koalin clay to
improve its printing capabilities (Paperboard Packaging, 2010). SBS is coated with Whey Protein
Isolate (WPI), which is a by-product formed during the cheese-making process (Andersson,
2010, p.15). The by-product, WPI is more expensive than Whey Protein Concentrate (WPC) due
to its expensive purification process. According to Caisa Andersson of Karlstad University
(2008), the water-based WPI is an excellent grease and oxygen barrier due to cross-linking of
hydrogen bonds. Furthermore, SBS paperboard has a coat weight of 15 g/m2 and oxygen
transmission rate of 918 cm3/m
2d (Andersson, 2010).
Corrugated Board Selection
According to the Association for Dressings and Sauces (2006), corrugated boxes are chosen
based on the following steps:
1. Determine the most efficient design
2. Maximize pallet efficiency
3. Maximize pallet loads
4. Total Shipping Time (time from shipment to customer)
5. Minimize product damage
6. Stacking Strength
The following factors are important to determine what type of board is needed to meet the needs
of the product. All steps listed are important to depict the most beneficial solution. For type of
flute selection, Fiber Board Association (2010) states that flutes are used because the curves

9
offer the strongest way to disperse external forces to prevent the effects of compression. Rather
than the product absorbing the weight, the flutes absorb the weight placed on the box. Moreover,
Fiber Board Association (2010) lists the five different types of flutes:
1. F-flute is the smallest flute size
2. E-flute is the second smallest flute size
3. C-flute is the most common flute size used
4. B-flute is larger than E-flute but smaller than C-flute
5. A-flute is first to be developed and the largest flute size
The different flute sizes can also be combined into layers of corrugated board in order to
customize the strength, weight and size of the box. For example, a double wall corrugate board
can have an A-flute and a C-flute for certain packaging purposes. This approach can alter the
performance of the corrugate board to meet the protection needs of the product. Deciding the
board selection for the hardcovers and the binding strips requires evaluating the current board
selection used, which is C-flute. In addition to board selection, the box dimensions must also
accommodate the needs of the product. According to the Fiber Board Association (2010), box
dimensions are written in order as length, width and depth. The inside dimensions of the box,
which does not include the thickness of the box, is the given space for a product to fit within the
box. It is also equally important to determine the outside dimension, which includes the thickness
of the corrugated box for pallet loads and transportation.
Existing Methods
In this section, other companies have found ways to redesign their packaging. According to
Business Link (2007), Terenix Ltd. which supplies film, foil, and oven bags, committed a three
year redesign program to reduce their packaging costs. Terenix Ltd. uses 177 tonnes less of
corrugate board a year to significantly reduce their contribution to waste. As a result, Terenix
Ltd. was able to save £50,000 a year on packaging. One of the concepts the company used is
replacing corrugated boxes with low-density polyethylene (LDPE) shrink wrap for secondary
packaging.

10
In addition to Terenix, Ltd., the packaging machinery company, Delkor systems from
Minneapolis, Minnesota, specializes in automated secondary packaging equipment and has seven
U.S. Patents for new packaging concepts. Their most successful design is the pad-shrink
packaging system called Spot-Pak package which replaces corrugated boxes (Sweeney, 2010).
Spot-Pak is commonly used for paperboard containers, which is the primary package for Powis
Parker’s binding strips. The concept uses temporary adhesive to stabilize pallet loads on a
corrugated pad. In between each layer, a corrugated pad is attached using adhesive. Lastly, the
pallet load is secured using shrink wrap. According to Sweeney (2010), if companies such as
Smart Balance were to use Spot-Pak, their total packaging waste would reduce by a great 82
percent. In addition to packaging waste, the Spot-Pak could reduce transportation costs by 62
percent (Sweeney, 2010). By the end of 2010, Delkor plans to install 200 Spot-Pak throughout
North America (Sweeney, 2010).
According to the author of “Logisticcs Improvement through Packaging Rationalization: A
Practical Experience”, Jesus Garcia-Arca (2005) states how package redesign can make a
company more competitive in the market through minimizing costs. Packaging redesign not only
reduces costs, but also has an impact on the company’s logistics and sales. The peer-reviewed
journal refers to the Spanish organization, called The Pescanova Group, which specializes and
commercializes frozen sea products. According to the case analysis, the redesign process is
broken down into four stages: diagnosis of the problem, evaluating the alternative designs, tests
and finally implementation (Garcia-Arca, 2005).
Cost Reduction: The total packaging costs include the cost of material for primary, secondary,
and tertiary packaging; labor and operation costs; raw material transportation; packaging
consumables; and storage costs. According to the author of “Efficient Packaging Design and
Logisitcs”, Changfeng Ge (1998, p.277) uses the following diagram for the redesigning process
shown in figure 2:

11
Figure 2
The first approach to reducing packaging costs is redesigning the primary package. One
option could be to down gauge the primary package material to use the minimal amount of
material needed to protect the product. To incorporate this approach to the primary package of
the hardcovers, the author will need to determine the minimal material that can be used to protect
the product. Currently, the total thickness of the primary package, which includes the inserts and
the primary corrugated box, could be redesigned to meet the minimal thickness needed for
protection.
As shown in the above graph, secondary package can be redesigned to a new case pattern
that uses less material for the same function. Secondary packaging is vital to protecting the
product during shipment as well as providing brand identity to the end of the supply chain. Next,
the number of primary packages placed inside each secondary package should be arranged to
maximize space. It is important to try several different layouts to maximize space. Lastly, the
tertiary package can maximize the pallet efficiency to reduce the number of containers used for
shipping. To relate the approach to Powis Parker’s binding strips, the secondary package is
placed within another box which eliminates the company’s packaging ability. Overall,
Changfeng Che (1998) divides the packaging costs into two categories: 1) packaging material
costs; 2) Packaging logistics costs.

12
Space utilization is measured by the “volume of the boxes in the container divided by the total
volume of the container” (Changfeng Ge, 1998). In comparison to using larger boxes, the
volume of smaller boxes will be closer to the volume of the container. The packaging costs of
using larger boxes will decrease, but the transportation costs will increase because fewer boxes
will be able to fit in the container. However, the cost factors greatly depend on keeping the
packaging material above the transportation costs. Once the transportation costs exceed the
packaging material costs, than the redesign layout is no longer cost efficient. Therefore it is
important to propose a layout that does not increase transportation costs.
Purpose of Packaging: According to Stephen Raper (p.335), the author of Handbook of Design,
Manufacturing and Manufacturing Systems, packaging has several cross-disciplinary areas.
Below is a wheel that shows the several areas of packaging that inter-relate:
Figure 3
The end-user in turn, is looking for packaging that is convenient and environmentally
conscience. It is important that the cross-disciplinary areas of packaging share the same goals;
for example operations wants the most efficient packaging flow, while marketing may want
complex packaging, or over packaging material to provide perceived quality. On the other hand,
purchasing could prioritize cost more than quality; therefore all areas of packaging need to have

13
a common objective. Overall, the package design must meet the projects objective while
incorporating the goals of marketing, operations, and distribution.
Over Packaging: California Polytechnic State University Professor, Dr. Jay Singh who has a
PhD in Packaging Science from Michigan State explains the profit loss of over packaging and
under packaging shown in the Concept of Protective Packaging graph:
Figure 4
The product’s package must be designed to protect the product against the effects of the
distribution environment. As shown in the above graph, over packaging products costs more
money than needed for protection, meaning loss of profit (Singh, 2010). Powis Parker currently
uses Single-Wall C-flute Corrugate Board as secondary packaging for the two most popular
product lines—binding strips and hardcovers. For the binding strips, they use two secondary
packages of single wall c-flute to ship the binding strips, essentially packaging the strips with
double wall c-flute. Therefore the proposed solution should limit over packaging by designing a
layout that can maintain package performance while reducing packaging costs.
Summary
After collecting research to support the purpose of the project, the review summarizes the
success and challenges of the different approaches used to redesign packaging layouts. The
limitations of previous studies include the space utilization of pallet loads. The secondary
package cannot be too large, otherwise palletizing the product in a larger box may be less

14
efficient than smaller boxes. Overall, the limitations presented in the review include keeping
transportation costs lower than packaging costs. Even though packaging material can be reduced
using larger shipping boxes, more shipments made to accommodate the change in size can
increase transportation costs due to poor pallet efficiency. The previous studies show that the
advantage of using alternative material such as shrink wrap instead of corrugated boxes can
decrease packaging costs. For example, Spot-Pak can save a significant percentage on packaging
costs, but it depends if Powis Parker, a high premium company will visibly ship products.
Moreover, the solution is limited to a design that incorporates minimal handling capabilities. In
addition to the work done by previous studies, the project will conclude that packaging costs can
be reduced without eliminating the use of corrugated board while maximizing the pallet loads.
The project will also ensure that transportation costs remain lower than material costs. The needs
defined in the introduction are covered by the previous studies on a scale of 1 to 5 (5 means the
need is fully covered by previous studies).
Table 2: Importance of Needs to Literature
Description of Needs Importance
Recommendation is easy to implement 3
Maintain package quality while reducing costs
4
Process is simpler and faster than current
process
4
Low Manufacturing Costs 4
Maintain Product Identification 3
Environmentally conscience packaging 4
According to the previous studies, the design may be difficult to implement if the package
changes the quality of the product. Overall, the previous studies show the different ways to
reduce packaging costs such as limiting corrugated material. The simple layout can be designed
to increase pallet efficiency. Furthermore, low manufacturing costs can result to maximize
design efficiency. However, previous studies show that reducing packaging material can lower
product identification. Lastly, reducing material shows environmentally conscious practices.

15
SECTION III
SOLUTION
The purpose of the project is suggesting a solution that can reduce the current packaging while
maintaining package performance. The best solution will offer a universal design that can be
used for similar products such as the various binding strips. Furthermore, the proposed layout
should optimize the space utilization of the corrugated boxes used for both hardcovers and
binding strips. This section describes the methodology and procedure taken to determine three
solutions for each product to meet the objectives of the project. All three solutions for each
product are compared and evaluated to determine the optimal solution for Powis Parker. The
section will include the work of calculations and standards needed to support a solution.
Solution 1: One suggested solution increases the number of units within a carton. The more units
within a carton will reduce the number of cartons needed to package the products. Increasing
units per carton will also increase the number of units within the case. Therefore, the packaging
method will increase space efficiency and allow for shipping costs to reduce per unit. The
processing speed will also increase since there will be less handling to assemble boxes. The
larger carton size is a standard RSC box that can be easily made on a large scale for Powis
Parker. The size of the carton maintains the ease of handling of products but improves space
utilization within the case. To maintain the handling capabilities, the larger carton size will allow
for more products to be grouped together. Unlike the current carton, one of the side panels will
not be folded down into the box since it is not necessary to reduce the headspace and does not
provide any additional stacking strength. Folding the side panel does not provide additional
stacking strength because the flutes run parallel to the bottom face.
Although the solution suggests using a larger carton, the current case size, 22” x 9” x 12” will
be used in this solution. This solution uses the same case to optimize pallet loads as shown in
Appendix 6. The regular slotted C-flute container is used for its printability, ease of
manufacturing, and stacking strength. After the cartons are filled with the units, the cartons are

16
placed with the length vertical. For the use of all long binding strips, the carton will contain ten
long narrow strips, eight long medium strips, and 6 long wide strips.
Although the solution reduces the amount of material used per unit, the solution has some
drawbacks. The solution suggests a larger carton to increase space utilization, but the carton will
double the number of units and change the groupings of sales. In the current cartons, there are
five long narrow strips, 4 long medium strips and 3 long wide strips. The binding strips will not
change how they are grouped in the primary box, but the carton size will change carton sale
prices. Overall, this solution will optimize the space utilized within the case and decrease the
packaging material used per unit. Another benefit of the solution is the size of the case that will
optimize pallet loads. The solution’s layout is shown in figure 5.
Figure 5
Solution 2: An alternative solution includes increasing the number of units within the carton,
and changing the case size. Similar to the above solution, the number of units within the carton
will increase, but the number of cartons within the case will double. However, the case layout is
different than the current layout in order to maximize the material reduction for binding strips.
Therefore, the number of cases used per number of cartons will reduce. The case used in the
solution will remain the same as C-flute, but the case will be 23” x 18” x 13”. The regular slotted
container (RSC) case box is a standard size that can be easily made by any large manufacturer
for large production. The larger case will also eliminate the number of boxes and packaging
material for shipping.

17
The advantages of increasing the number of units in a carton will reduce the time needed for
assembly and reduce the number of cartons in storage. The larger carton will reduce the amount
of material needed to package each unit. The cartons will be regular slotted containers (RSC) and
will be made from C-flute. The choice of material is due to the printability, stacking strength,
and ease of manufacturability. Although there are more units shipped per case, the solution will
drastically change the way the products are shipped. According to this solution, the greatest
benefit for Powis Parker is eliminating a large amount of material used for binding strips. The
solution layout is shown in figure 6.
Figure 6
Solution 3: Since Powis Parker sells their products by units per carton and case, this solution
maintains the number of units per carton. Although the number of units per carton stays the
same, the case size will increase to fit twice as many cartons; therefore the case will include ten
cartons. Inside each carton there will be five long narrow strip units, 4 long medium strips and 3
long wide strips. The large case size will be, C-flute, 23” x 18” x 13” and will reduce the amount
of packaging material per unit compared to the current case. Similar to solution 2, the larger case
size will reduce the material used per unit while maintaining the current sale process.
Due to the current sales process, the advantage of using the same carton size does not change the
purchase orders. However, the current method for the carton uses one of the top flaps of the RSC
box to fold down into the interior of the box to eliminate head space. As explained in the first
solution, the product is well protected within the primary paperboard box and folding the flap is

18
not relevant. Therefore, the change in method eliminates a step for the layout and simplifies the
current packaging process. The solution’s layout is shown in figure 7.
Figure 7
Solution 4: In addition to the binding strips, the project also focuses on the hardcover products.
The next three solutions for the 11” x 8.5” and 8” x 10” hardcovers will provide an insert and
box layout that can be used for both sizes. However, the insert in this solution suggests changing
the number of 11” x 8.5” units sold per box to 20 units per box compared to the current layout of
25 per box. This is because the two hardcovers have different thicknesses. Furthermore, the
insert becomes one universal insert that can be used for both hardcovers. The solution suggests
one box due to the compatibility of the insert to change internal space for the package. To
accommodate the 11” x 8.5” hardcover, one side of the insert is cut to fold inward to support a
hardcover with a shorter width. In addition to folding one side of the insert, bubble wrap can be
used to fill the void. The 8” x 10” hardcovers are shipped in groups of 25 per box, but the 11” x
8.5” will be shipped 20 per box. Even though the number of units sold per box decreases by five,
the benefit of reducing inserts can reduce costs by reducing the number of inserts to one.
Moreover, the use of a universal insert for both hardcovers eliminates the use of multiple
corrugated inserts, reduces storage space and material per unit. The dimensions of the case are
the same as the current design, which is 22” x 13” x 4.5”. The packaging process time for
hardcovers will be simpler and easy to implement. The design of the insert used in solution 4 is
shown in figure 8.

19
Figure 8
Solution 5: An alternative to the current hardcover solution suggests changing the layout of the
end loading box for the hardcovers. The solution will use a tongue tab lock system on both ends
to secure the hardcovers as shown in Appendix 17. Currently, the layout uses an end loading box
layout with a snap 1-2-3 bottom that can be complex and time consuming during assembly. The
advantage of using the tongue tab lock system is the security it provides and the ease of handling.
The material used for this design is C-flute due to its strength capabilities. The C-flute provides
the necessary support and strength to protect the premium products through transportation. On a
large scale production, the converter’s plant will glue the manufacturer’s edge to the box, and the
package will be manually erected by Powis Parker. The dimensions for the case are 22” x 13” x
4.5”.
During the testing procedure, the tongue locking tab will be tested for maintaining locked
security using minimal tape. The box will maintain the same dimensions as the current layout,
but there will be two tabs on both ends of the box. The simplicity of the box can increase
packaging efficiency along the assembly line. However, the disadvantage of the tongue lock
system includes the lack of security that is provided by the snap 1-2-3 bottom. The design of this
solution is shown in figure 9.

20
Figure 9
Solution 6: The last alternative solution uses an insert similar to the one in solution four but does
not include extended corner protectors. However, the insert proposed in this solution can adjust
to different lengths and widths for the different hardcovers. However, the insert does not have
the extended corners that are used in the current layout and in solution four as shown in
Appendix 19. The purpose of the project is designing an insert that does not have extended
corners that can be tested for product damage. Furthermore, the case dimensions are 20” x 14”
4.5”. This allows for more efficient primary package compared to using extended corner
protectors. Overall, the result of this solution determines if the smaller insert can provide the
same protection as the current design. Therefore, the solution will show whether or not the
hardcovers will need the extended corners. The design of this solution is shown in figure 10 to
give a visual example of the insert without extended corners.
Figure 10

21
Statistical Testing
Variables: In the process of testing the package layouts, there are a few variables present when
comparing the solutions. One of the variables is the variation in size of carton and case. The first
solution includes a case that is 23”x 9”x13” and the case size for solutions two and three has a
case size of 23”x 18”x 13”. In addition to the case size, the carton for the third solution will be
the current carton size, 12”x 8”x 4”. However, the cartons for both solutions one and two will
have the same carton size which is 12”x 8”x 7.25”. The number of units within the primary box
for the hardcover solutions four, five and six will remain the same throughout testing. Therefore,
the control is the primary package that determines if the units will experience any damages for
any solution. The solutions four and five will have a primary box with 22 inches in length, and
solution six will be 20 inches in length since it will not have corner extensions. In order to
determine the best solution, the carton and case change to determine the best performance and
material reduction. The time lapse in between the package testing can affect the results if testing
is over a period of days. The down time in between the tests is critical, so it is important to do all
testing within one day. In addition to the time needed for testing, the manpower will be one
person doing all the testing, which can add more down time to testing. Other variables include
the change in temperature and relative humidity. As the weather during testing fluctuates, it can
affect the results of the testing performance. According to ASTM D4169 the test will be
conducted at standard conditions of 73.4+/- 2°F and 50+/- 2%.
Independent Variables: The independent variables that will stay the same throughout testing
are the number of units within each primary box. Therefore, 100 long narrow strips per unit will
be tested for solutions one through three. In addition to the binding strips, 25, 8”x10” hardcovers
will be tested for solutions four through six.
After collecting the samples from Powis Parker, I will be testing solutions one through three
for the long narrow strips. The hardcover solutions four through six will be tested using the
8”x10” hardcovers. According to ASTM D4169 (2005), the number of test replications depends
on the availability of product and shipping containers. Although it was helpful for Powis Parker
to provide some product samples, the test sequence required dummy loads in order to simulate a
full case load. The ASTM D4169 (2005) states that “If a dummy load is used, it should be

22
instrumented to determine the fragility level of the actual product has been exceeded. Take care
to duplicate the load characteristics of the actual product”. Furthermore, the amount of
corrugated sheets provided for the project does not accommodate enough material for test
replications. Although replicated tests improve the reliability of the tests, ASTM D4169 does not
require it.
Comparative Data: In order to compare the solutions to the current layout, the manufacturer’s
waste of each design, the number of units per load and the pallet efficiency must be determined.
These three factors can determine the cost benefit of each solution. In order to evaluate the pallet
loads, a CAPE analysis for each solution will be evaluated to determine which solutions can
provide maximum area and cube efficiency. In addition to these three cost factors, the blank area
of the three solutions will be measured to determine if the solutions will use less material than
the current layout. This will also determine the difference in material used for each solution.
Since the best solution may suggest changing the number of units sold per case or carton, the
packaging material will be explained as the area of material per unit.
Tools: For statistical testing, the methods require designing the new layout using ArtiosCAD
software and cutting samples out on the Kongsberg machine. The samples cut out on the
Kongsberg table will be the material used for testing the package in the Cal Poly dynamics lab.
The product and package samples that are provided by Powis Parker will support accurate testing
results of the new layout. The testing will also use the product samples that are provided by
Powis Parker to ensure that the performance of the package will protect the products during
distribution. According to ASTM D4169 (2005), all suggested layouts will follow the testing
procedure for a single package environment up to 100 lb., which will fall under distribution cycle
three. Furthermore, the testing procedure will be evaluated under assurance level II for moderate
test intensity and moderate probability of occurrence.
Hypothesis: There will be one solution for binding strips and hardcovers that will be more cost
beneficial than the current layout. The compression strength of the cases can determine which
design can withstand the stacking strength if the product is stored over a period of time. In
addition to compression strength, solutions 4 and 5 will provide better package performance than
solution 6 due to the extended corner protectors. Although solution 6 is a smaller case, it will not

23
provide equal product protection. For the hardcover solutions, the 1-2-3 snap bottom design in
solutions 4 and 5 will show better dynamic testing results than solution 5. For the binding strips,
the solutions use RSC boxes for both the carton and case. The hypothesis states that the dynamic
testing will show no significant damages among the binding strip solutions.
Acceptance Criteria: According to ASTM D4169, the test sequence used is for a single package
environment up to 100 lb. using distribution cycle three. The tests should demonstrate a package
design that follows Criterion 1- Product is damage free (ASTM D4169, 2005). The tests will also
follow assurance level II under moderate conditions (ASTM D4169, 2005).
Table 3: Binding Strips Test Sequence
Schedule A Handling
(40 to 60 lb. shipping weight= 12” Drop
Height)
(20 to 40 lb shipping weight=13” Drop Height
Drop Height: 12”
1. One top face
2. Two adjacent bottom edges
3. Two diagonally opposite bottom corners
4. One bottom face
Schedule C Vehicle Stacking Solution 1: 540 lbs; Solution2: 1134lbs;
Solution 3 1400 lbs
Schedule F Loose-Load Vibration Duration: 40 minutes
Schedule E Vehicle Vibration Duration: 1 hour; Solution 1: 120lbs; Solution
2: 160 lbs; Solution 3: 200 lbs
Schedule A Handling 1. One vertical edge
2. Two adjacent side faces
3. Two one corner and one adjacent top
edge
4. One drop from bottom (height: 24”)

24
Table 4: Hardcovers Test Sequence
Schedule A Handling (40 to 60 lb. shipping
weight)
Drop Height: 12”
5. One top face
6. Two adjacent bottom edges
7. Two diagonally opposite bottom corners
8. One bottom face
Schedule C Vehicle Stacking Solution1: 540 lbs; Solution2: 1134lbs;
Solution3 1400 lbs
Schedule F Loose-Load Vibration Duration: 40 minutes
Schedule E Vehicle Vibration Duration: 1 hour; Solution 1: 120lbs; Solution
2: 160 lbs; Solution 3: 200 lbs
Schedule A Handling 5. One vertical edge
6. Two adjacent side faces
7. Two one corner and one adjacent top
edge
8. One drop from bottom (height: 24”)
The machines used in the lab are the Lansmont drop test, Lansmont compression Tester,
Lansmont Loose Load Vehicle Stacking, and Lansmont Vehicle Vibration testing. Using the
given product samples and the weight of the product, the compression testing calculation and
using ASTM D4169 (2005) assurance level II and a vehicle stacking safety factor of seven.
Overall, ASTM D4169 (2005) states, “For use as a performance test, this practice requires that
the shipping unit tested remain unopened until the sequence of tests are completed”.
Data: According to the distribution cycle as shown in tables 3 and 4, the data collected refers to
the observations made during the testing sequence. The table 5 below refers to the solutions one
through three for binding strips. The table 6 below refers to the solutions four through six for
hardcovers.

25
Table 5: Binding Strips Testing Results
Solution # Solution 1 Solution 2 Solution 3
Weight 30 lbs. 40 lbs. 50 lbs.
Schedule Handling A
(Drop Height)
13 inches 12 inches 12 inches
One top face No visible damage No visible damage No visible damage
Two adjacent bottom
edges
No visible damage;
No visible damage
No visible damage;
No visible damage
No visible damage;
minimal creasing
Two diagonally
opposite bottom
corners
No visible damage;
minimal creasing
No visible damage;
minimal creasing
No visible damage;
minimal creasing
One bottom face No visible damage No visible damage No visible damage
Schedule C Vehicle
Stacking (Load)
No failure prior to
expected load (840
lbs)
Appendix 7
No failure prior to
expected load(1134
lbs)
Appendix 8
No failure prior to
expected load(1400
lbs)
Appendix 9
Schedule F Loose
Load Vibration
No visible or audible
damage
No visible or audible
damage
No visible or audible
damage
Schedule E Vehicle
Vibration
No visible or audible No visible or audible
damage
No visible or audible
damage
Schedule A Handling 13 inches 12 inches 12 inches
One vertical edge face No visible damage No visible damage No visible damage
Two adjacent side
faces
No visible damage;
No visible damage
No visible damage;
No visible damage
No visible damage;
creasing
Two one top corner
and one adjacent top
No visible damage;
No visible damage
No visible damage;
minimal creasing
Minimal creasing; No
visible damage
One bottom face
(Double Drop Height)
No visible damage
(26 inches)
Slight scuffing on
surface (24 inches)
No visible damage
(24 inches)

26
Table 6: Hardcovers Testing Results
Solution # Solution 4 Solution 5 Solution 6
Weight 15 lbs. 15 lbs. 50 lbs.
Schedule Handling A
(Drop Height)
15 inches 15 inches 15 inches
One top face No visible damage No visible damage No visible damage
Two adjacent bottom
edges
No visible damage;
No visible damage
No visible damage;
No visible damage
No visible damage;
No visible damage
Two diagonally
opposite bottom
corners
No visible damage;
minimal creasing
No visible damage;
minimal creasing
No visible damage;
minimal creasing
One bottom face No visible damage No visible damage No visible damage
Schedule C Vehicle
Stacking (Load)
No failure prior to
expected load (945
lbs)
Appendix 10
Experienced failure
prior to expected
load(945 lbs)
Appendix 11
No failure prior to
expected load(945
lbs)
Appendix 12
Schedule F Loose
Load Vibration
No visible or audible
damage
No visible or audible
damage
No visible or audible
damage
Schedule E Vehicle
Vibration
No visible or audible
damage
No visible or audible
damage
No visible or audible
damage
Schedule A Handling 15 inches 15 inches 15 inches
One vertical edge face No visible damage No visible damage No visible damage
Two adjacent side
faces
No visible damage;
No visible damage
No visible damage;
creasing
No visible damage;
creasing
Two one top corner
and one adjacent top
Minimal damage; No
visible damage
Minimal creasing; No
visible damage
Minimal damage; No
visible damage
One bottom face
(Double Drop Height)
No visible damage
(30 inches)
No visible damage
(30 inches)
No visible damage
(30 inches)
27
SECTION IV
RESULTS
The purpose of the project is designing and testing a solution that will reduce packaging costs,
while maintaining package performance. The proposed solution depends on the tests performed
for each design. The layout’s manufacturing waste, the solution’s blank area, the CAPE analysis,
and the results of the tests are important to decide the best solution. In order to provide Powis
Parker with a solution that is fully supported, the layouts must fit the project’s needs. This
section compares the advantages and disadvantages of each solution to compare the strengths
and weaknesses.
Solution 1
This solution redesigned the layout to increase the number of units within a carton. The current
case size is used for the solution in order to maintain ease of handling. Therefore, the solution
can contain 30 units within a case.
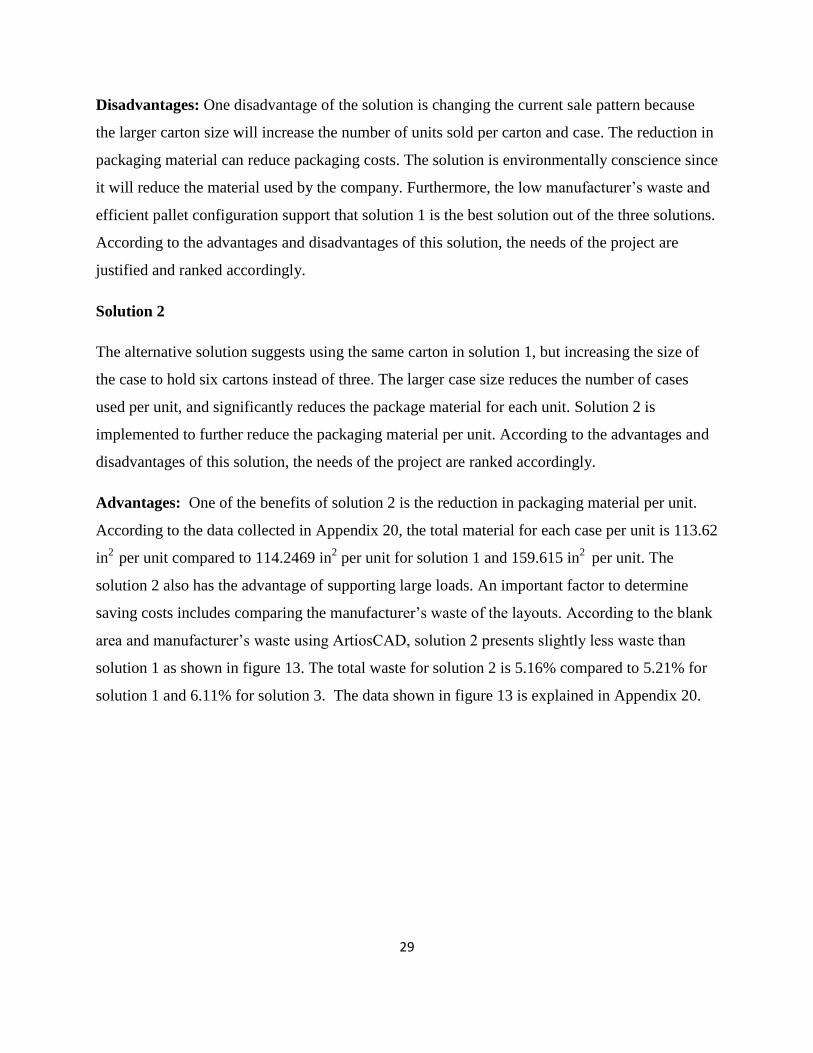
Advantages: One of the benefits of implementing the current case dimensions includes the
similar distribution pattern to the current layout. In comparison to the other two solutions for the
binding strips, the case size will maximize the pallet area and cube efficiency as shown in
Appendix 1. According to the Pallet Load graph shown in figure 11, Solution 1 allows for 1,080
units per load compared to 960 units per load for solution 2 and 800 units per load for solution 3.

28
Pallet Load: Binding Strips
1080960
800
0200400600800
10001200
Solution
1
Solution
2
Solution
3
Figure 11
Number of
Units per LoadPallet Load
Therefore, Solution 1 can support more units per pallet load, which can reduce costs. In
addition to pallet load, the pallet efficiency is important to determine the amount of unused area
on a pallet. According to Appendix 1, 2, and 3, figure 12 compares the pallet efficiencies of each
solution. On a 40” x 48” pallet the solution presents a 92.8% area efficiency and 88.6% cube
efficiency. The other two solutions present a low 86.3% area efficiency and 82.3% cube
efficiency. Therefore, solution 1 provides the most units per load and the highest pallet
efficiency.
Pallet Efficiency: Binding Strips
92.80%
86.30% 86.30%
80.00%
85.00%
90.00%
95.00%
Solution 1 Solution 2 Solution 3
Figure 12
Area Used
(%)
The larger carton size allows for more units to be shipped by the case since ten long narrow
strips can be placed in a carton compared to five units. On the other hand, the current carton can
only hold five long narrow strips. The solution can hold three cartons in a case, which are 30
units per case compared to 25 units per case. Therefore, the solution can hold about 20 percent
more than the current case size as shown in Appendix 20.
29
Disadvantages: One disadvantage of the solution is changing the current sale pattern because
the larger carton size will increase the number of units sold per carton and case. The reduction in
packaging material can reduce packaging costs. The solution is environmentally conscience since
it will reduce the material used by the company. Furthermore, the low manufacturer’s waste and
efficient pallet configuration support that solution 1 is the best solution out of the three solutions.
According to the advantages and disadvantages of this solution, the needs of the project are
justified and ranked accordingly.
Solution 2
The alternative solution suggests using the same carton in solution 1, but increasing the size of
the case to hold six cartons instead of three. The larger case size reduces the number of cases
used per unit, and significantly reduces the package material for each unit. Solution 2 is
implemented to further reduce the packaging material per unit. According to the advantages and
disadvantages of this solution, the needs of the project are ranked accordingly.
Advantages: One of the benefits of solution 2 is the reduction in packaging material per unit.
According to the data collected in Appendix 20, the total material for each case per unit is 113.62
in2
per unit compared to 114.2469 in2 per unit for solution 1 and 159.615 in
2 per unit. The
solution 2 also has the advantage of supporting large loads. An important factor to determine
saving costs includes comparing the manufacturer’s waste of the layouts. According to the blank
area and manufacturer’s waste using ArtiosCAD, solution 2 presents slightly less waste than
solution 1 as shown in figure 13. The total waste for solution 2 is 5.16% compared to 5.21% for
solution 1 and 6.11% for solution 3. The data shown in figure 13 is explained in Appendix 20.

30
3.38%
1.83%
3.38%
1.78%
4.33%
1.78%
0.00%
1.00%
2.00%
3.00%
4.00%
5.00%
6.00%
7.00%
Waste (%)
Solution 1 Solution 2 Solution 3
Figure 13
Manufacturer's Waste:Binding Strip
Secondary Package
Primary Package
Disadvantages: However, the disadvantage of this solution is the inefficient cube and area of the
pallet loads shown in Appendix 2. Even though the solution is able to withstand higher loads
than solution 1, the inefficient pallet loads can be more expensive. According to the CAPE
analysis in Appendix 2, the number of units that can be placed on a pallet is 960 long narrow
strips. Therefore, the pallet loads of the first solution can save more costs per unit than solution
2. Although the solution can be an advantage for larger loads, it is difficult to manually handle
during the testing process. Since the pallets are manually loaded, solution 2 does not support ease
of handling as much as solution 1. Overall, the solution is more difficult to implement since it
changing the way the units are sold per carton. In addition, the larger case size can make it
difficult to manually handle the boxes onto the pallet. However the process is simpler since less
boxes are assembled and the number of units per case will be more than the current layout. The
manufacturing costs will be less in comparison to the current layout since there is less packaging
material. The product also reduce the product identification since there is less material to print
but the benefit of reducing the packaging material can also save money on graphics.
Solution 3
Similar to solution 2, the pallet load is the same as shown in Appendix 3. However, the number
of units within the case is different since the solution uses the current carton size. The solution
also supports making large shipments. According to the advantages and disadvantages of the
solution, the needs of the project are ranked accordingly.

31
Advantages: The advantage of using the same carton size does not change the current sale
patterns for each product. Therefore, the advantage of maintaining the units per carton can be a
great benefit in comparison to the other two solutions. Furthermore, changing the sale pattern of
the units can take time to restructure the sales and can confuse current customers. The larger case
size reduces the number of cases per unit compared to the current process, and can accommodate
larger shipments to customers.
Disadvantages: Due to implementing the current carton layout, the solution experiences a few
drawbacks. One disadvantage is the low number of units per pallet load. As shown in the above
figure 9, the solution only supports 800 units/load compared to 960 units/load for solution 2, and
1,080 units/load for solution 1. Therefore, transportation costs can be high when shipping less
efficient loads. In addition, the increase case size only allows for 86.3% area efficiency and
82.3% cube efficiency compared to solution 1. The solution also has the highest manufacturer’s
waste percentage in the design compared to the other two solutions as shown in figure 13. This
solution leaves 6.11% waste compared to 5.16 for solution 2 and 5.26 for solution1, which is
more than the other two. Even though solution 3 does not change the current sale groupings, the
solution is the least efficient for the binding strips. The solution is easier to implement than the
other two solutions since it does not change the number of units per carton. However, the pallet
efficiency is much less than the other two solutions. Reducing the packaging material by
enlarging the case size can also maintain package quality as shown in the test results.
Additionally, the same carton size does not reduce the material as much as the other two
solutions. The process is not much faster than the current solution since the carton size is the
same and more boxes need to be assembled compared to the other two solutions. Maintaining
same number of units per carton does not significantly reduce the environmental impact since it
still uses numerous boxes to package the products.
Solution 4
The first solution suggested for the hardcovers uses a universal layout that can be adjusted to
width and length to fit the needs of the different hardcovers. The insert has extended corner
protectors that go beyond the length of the product to suspend the product from absorbing forces
during shipment. In comparison to the binding strips, the solution uses one primary box for both

32
hardcovers that is directly placed on the pallet. The needs of the project are ranked according to
the advantages and disadvantages of the solution.
Advantages: The advantages presented include limiting the number of different inserts that are
used among the hardcovers and simplifying the process to one adjustable insert. The extended
corner protectors have the advantage of providing more protection for the premium quality
hardcovers. Furthermore, the insert can be adjusted to length and width to fully meet the
specifications of the different hardcovers. In addition to the insert, the solution has the lowest
manufacturer’s waste for all three hardcover solutions. As shown in figure 14, the solution uses
34.57% total waste, 36.76% for solution 5, and 36.20% for solution 6. Therefore, the low
manufacturer’s waste can contribute to reducing packaging costs.
Manufacturer's Waste:Hardcovers
21.82% 21.82% 22.59%
12.75% 14.94% 13.61%
15.00%
20.00%
25.00%
30.00%
35.00%
Solution 4 Solution 5 Solution 6
Figure 14
Was
te (
%) Primary
Package
Insert
Disadvantages: One of the disadvantages of the solution includes using bubble wrap for the 11”
x 8.5” hardcover. The bubble wrap used to support the smaller width is an additional material
implemented in the design. However, the light material is more advantageous than using
corrugated to fill the void. Furthermore, the use of 1-2-3 snap bottom uses no tape but takes more
time during assembly. Therefore, the packaging process time can be less efficient compared to
solution 5. Overall, the solution is easy to implement since it will reduce the number of different
inserts used, and combine the two hardcovers into one package.
33
Solution 5
The second solution for the hardcovers suggests using the same dimensions for the primary box,
but using two tongue lock tabs on both ends of the end loading box. The 11” x 8.5” hardcover
will use bubble wrap to fill the void and the corrugated cut will fold down to further support the
smaller hardcover. The solution’s advantages and disadvantages rank the needs of the project to
the solution.
Advantages: The advantage of using two tongue lock tabs on both ends reduces the assembly
time of a 1-2-3 snap bottom. The two tongue lock tabs is also easy to implement because the box
design is less complex than the current layout. The solution suggests using the same insert used
in solution 4. The adjustable insert can support the needs of both hardcovers and will further
protect the hardcovers against external forces due to the extended corner protectors.
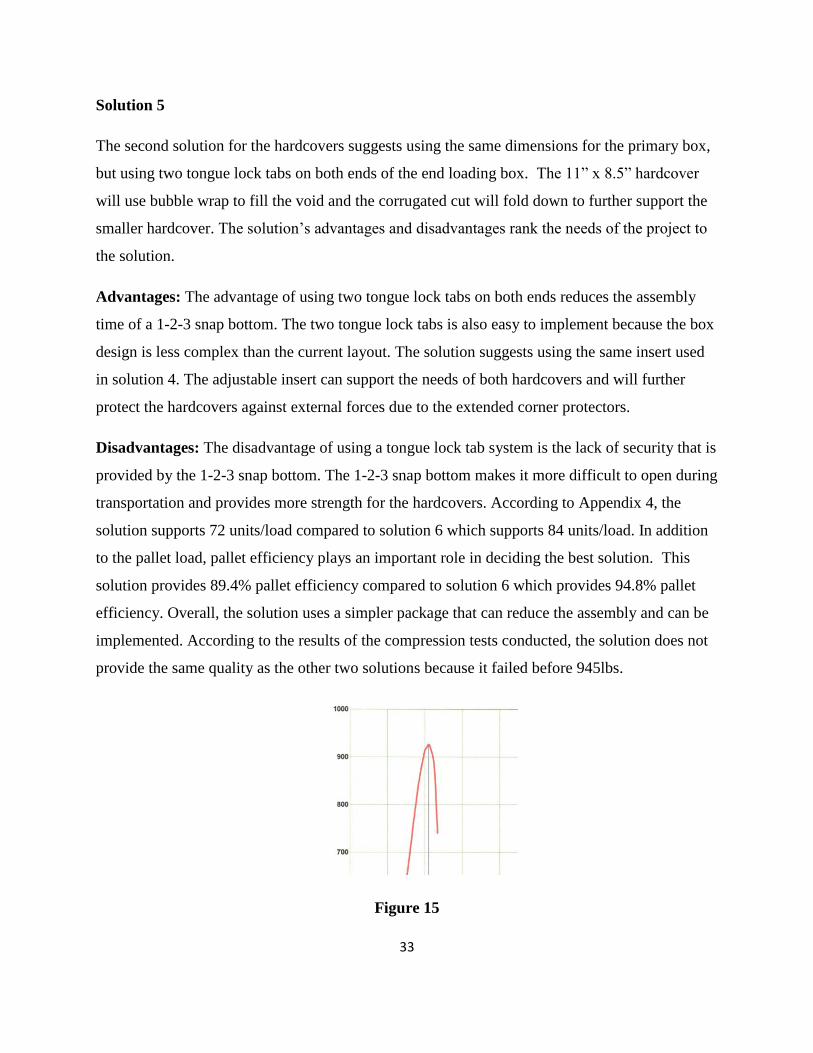
Disadvantages: The disadvantage of using a tongue lock tab system is the lack of security that is
provided by the 1-2-3 snap bottom. The 1-2-3 snap bottom makes it more difficult to open during
transportation and provides more strength for the hardcovers. According to Appendix 4, the
solution supports 72 units/load compared to solution 6 which supports 84 units/load. In addition
to the pallet load, pallet efficiency plays an important role in deciding the best solution. This
solution provides 89.4% pallet efficiency compared to solution 6 which provides 94.8% pallet
efficiency. Overall, the solution uses a simpler package that can reduce the assembly and can be
implemented. According to the results of the compression tests conducted, the solution does not
provide the same quality as the other two solutions because it failed before 945lbs.
Figure 15

34
The solution uses the same insert as the first hardcover solution, but it is tested to determine
whether or not the simpler design can maintain package performance. As a result, the solution
cannot provide the same performance as shown in figure 15.
Solution 6
The last solution for the hardcovers suggests using the same current primary box with a 1-2-3
snap bottom. However, the box will have a shorter length dimension in order to eliminate the
extra space given in the current box due to the extended corners of the inserts that are also used
in solution 4 and 5. Furthermore, the case dimensions for this solution are 20” x 13” x 4.5”.
Advantages: The advantage of using a smaller box eliminates the unused space within the box
and maximizes the pallet efficiency. One benefit of the solution is the ability to change in length
and width to support the needs of each product. Furthermore, comparing the pallet load and
pallet efficiency contributes to the cost benefits of each solution. An additional advantage of this
solution includes the efficient pallet load as shown in figure 16. According to the data collected
in Appendix 5, solution 6 can support 84 units per load compared to solutions 4 and 5 that can
carry 72 units per load. Therefore, solution 6 provides the most efficient pallet load out of the
three hardcover solutions.
Pallet Load: Hardcovers
72 72
84
65
70
75
80
85
Solution 4 Solution 5 Solution 6
# of Units
per Load
Figure 16
The pallet load configurations, the pallet efficiency of solution 6 is higher than both solution 4
and 5. As shown in figure 17, this solution presents a 94.8% area efficiency and 93.9% cube

35
efficiency. The other two solutions only present an 89.4% area efficiency and 88.6% cube
efficiency.
Pallet Efficiency: Hardcovers
89.40% 89.40%
94.80%
85.00%
90.00%
95.00%
100.00%
Solution 4 Solution 5 Solution 6
Figure 17
Area
Used (%)
Disadvantages: Even though this solution uses the least amount of material for the insert and
end loading box, it provides the least amount of support for the products when comparing both
test performances. The insert used in this solution tightly wraps the product, but it does not
suspend the product within the package like the insert used in solutions 4 and 5. Overall, the
solution is easy to implement since it will reduce the number of different inserts and it can be
easily adjusted to support the needs of the different hardcovers. The process is simpler than the
current process since it uses one insert for both hardcovers. Moreover, the smaller box size
optimizes the box space and can support the product. The pallet optimization also increases since
the box sizes are smaller. The solution is more environmentally conscience than the other
hardcover solutions to maximize space efficiency.
Needs
Below is a table that help determine which solution best fits the purpose of the project. It is
important to show how each solution meets the needs to decide the most relevant design. As
shown in the table, solutions 1 and 6 meet the needs more than the other solutions.

36
Table 7: Solutions compared to Needs
Description of
Needs
Solution 1 Solution 2 Solution 3 Solution 4 Solution 5 Solution 6
Recommendation
is easy to
implement
3 3 4 4 4 4
Maintain
package quality
while reducing
costs
4 4 4 4 3 4
Process is
simpler and
faster than
current process
4 3 3 3 4 4
Low
manufacturing
costs
4 4 3 4 3 4
Maintain product
identification
3 3 4 4 3 3
Environmentally
conscience
packaging
4 4 3 3 4 4
Best Solution
Binding Strips: According to the data collected and the statistical testing, solution 1 is the best
solution that meets the needs of the project and will provide the best results for Powis Parker. In
comparison to the other two binding strip solutions, solution 1 leaves only 5.21 percent
manufacturer’s waste. Although solution 2 leaves 5.16 percent manufacturer’s waste, the
difference between the two is minimal. In addition to the low manufacturer’s waste, solution 1

37
supports more units per load compared to the other two solutions and high pallet efficiency. The
pallet load for solution supports 1,080 units per load, and has 92.8 percent area efficiency as
shown in Appendix 6. In comparison to the current layout for the binding strips, the pallet load
supports on 900 units but maintains an area efficiency of 92.8 percent. Therefore, the solution
can support 180 more units than the current layout, which means 17 percent more units per load
than the current process which is shown in Appendix 20. In comparison to the current layout,
solution 1 uses 114.24 in2 per unit and the current layout uses 160.36 in
2 per unit. As shown in
Appendix 21, solution 1 provides 28.76 percent less material per unit and 20 percent more units
per pallet than the current layout. Therefore the solution meets the objective of the project, which
is reducing packaging costs by 20 percent. The increase in pallet load and reduction in material
per unit shows that the solution can save more than 20 percent.
In addition to the cost benefits of solution 1, the solution supports the hypothesis that states
the less complex design uses less manufacturer’s waste. The design leaves a minimal 5.21%
manufacturer’s waste since the design includes an RSC box for both the carton and case. In
comparison to the hardcover solutions, the less complex design concludes that the hypothesis is
correct. Lastly the solution supports the hypothesis that states that there will be no significant
differences in testing results. As shown in table 3 in the solution section, all three solutions did
not show any differences in performance.
Hardcovers: According to the data collected and the dynamics testing conducted, solution 6 is
the best solution to meet the needs of the project and more cost beneficial than the other two
solutions. Although solution 6 uses 36.2 percent manufacturer’s waste compared to solution 4
that uses 34.5 percent manufacturer’s waste, the pallet load and pallet efficiency of solution 6 are
more efficient than the other two solutions. According to the pallet load graph shown in figure
16, the solution can hold 84 cases per load compared to solutions 4 and 5 that support 72 cases
per load. Therefore, each pallet can ship more units per load, and can be more cost effective than
the current solution. Therefore, the solution meets the objective of the project to reduce costs by
at least 20 percent. In addition to the number of units per load, the solution also provides higher
pallet efficiency. The pallet configuration of the solution has 94.8 percent area efficiency
compared to 89.4 percent, which is one of the cost benefits of the solution. In addition to the
38
CAPE analysis and manufacturer’s waste, the solution also provides less packaging material per
unit. As shown in Appendix 21, the current layout that uses 71.15 in2 per unit compared to
solution 6 that uses 66.9 in2 per unit, which is a 7 percent material reduction. Moreover, the
solution maintains the product identification by implementing the 1-2-3 snap bottom. In
comparison to the current layout which is the same as solutions 4 and 5, the solution allows 12
more units per load. Increasing the load to 84 units equals a 16.6 percent unit increase per load.
The design also allows for a 12 percent reduction in material per unit as shown in Appendix 21.
In addition to the cost benefits, the solution accepts the hypothesis which states that the
solution that maintains a 1-2-3 snap bottom will have better results compared to solution 5.
Looking at table 4 in the solutions section, the solution 5 failed to support the expected load. It is
important to implement a design that can support the expected load in case the product sits in
storage for a period of time. Lastly, the proposed solution rejects the hypothesis that states that
the insert with the extended corner protector will provide better package performance. However,
after completing testing, the results show that the insert without corner protectors can perform
equally to solutions 4 and 5.
39
SECTION V
CONCLUSION
From the beginning of the project, the visits to Powis Parker are conducive to meeting the
objectives of the project in order to fully meet their needs. The purpose of the project is to find a
solution that will reduce the current packaging costs but maintain package quality for their most
popular products. The meetings with Powis Parker are important to fully understand the
packaging process and to find ways to reduce their packaging costs. Researching previous
studies that are similar to this project provide a clear understanding of how to approach the
report. Cal Poly’s dynamics lab provided the Lansmont machines needed to test the solutions to
ASTM D4169 standard. In addition to the Lansmont machinery, the many hours spent designing
the solutions on ArtiosCAD made it easier to visually convey the solutions. The test sequence
followed in ASTM D4169 distribution cycle three compares the solutions through a simulated
distribution cycle. After the tests were completed, the solutions were compared to the current
layout, the blank area, pallet configuration and the tests performed.
Summary of Work
In order to come to a proposed solution, the solutions were first designed using ArtiosCAD
software and the Kongsberg cutting machine. The ArtiosCAD design of each solution was
created on the Kongsberg cutting machine for testing. ASTM D4169 distribution cycle three
compares the package performance using compression graphs and visual observations. The
testing sequence was useful to prove whether or not the solution can maintain package
performance. In addition to the dynamics testing, all solutions were subject to additional
comparative analysis that included measuring the manufacturer’s waste, the material per unit and
the pallet configuration. The ArtiosCAD software calculated the waste and the material per unit
using the blank area of each packaging component. On the other hand, the pallet configurations
were compared using CAPE software to show how many units can be shipped per load and the
pallet efficiency of each solution. After the testing and data was collected, the solutions are

40
compared using their advantages and disadvantages. According to the comparative analysis, the
solution that proposes the highest cost benefit is compared to the current layout. Comparing the
proposed solution to the current layout shows the solution’s efficient pallet configuration and
material reduction.
Observations of Evidence
Each design for each solution was chosen to determine if material reduction could maintain
package performance while reducing costs. Throughout the testing, the product samples are
controlled to compare the solutions to meet the necessary package performance of the product.
However each design was created to maintain package performance using different layouts to
reduce material. Furthermore, the results of the proposed solutions support the hypothesis of the
project. The proposed solution 1 for binding strips shows that the testing showed no product
damage and maintains package performance. Hardcover solutions include an insert and a case
that maintain package performance. In addition to the binding strips, the test results of the
proposed solution 6 supports the hypothesis that states that the design will meet the expectations
of the current packaging.
Learning Outcomes
After completing the project, the author learned more about how companies similar to Powis
Parker produce, package, and ship their products. The author also learned the high value of
reducing packaging costs for a supplying company. By meeting the objective of the product to
reduce packaging costs by 20 percent, the value of the results can make a significant difference
to their finances and shipping efficiency. Another learning outcome of the project is improving
packaging design skills. The result of the project show how creative inserts and changing
shipping patterns can change the key cost factors of packaging. Throughout the design process,
the author learned that the box dimensions must include tolerances that allow room for placing
the units within the insert or the box and to account for the thickness of the material at edges. In
addition to the tolerances, the outside dimensions of the box depend on the material used. For
example, the C-flute corrugate adds 1/8” for each flap when folded and will change the inside

41
dimensions of the case. In addition to the dimensional tolerances, the inserts must allow for some
space in the box to allow for ease of handling.
During testing the solutions, the errors that occurred on the compression table could have
affected the results of the packaging. For instance, the last two hardcover solutions were initially
crushed by the compression table that had to be stopped due to problems with the machine.
However, the compression table did not have any problems other than the two incidents. The
comparison of the binding strip solutions shows that even though the design may reduce the
material, it can affect the pallet efficiency and in the long run increase shipping costs. Another
learning outcome includes comparing the insert designs for the hardcover solutions. Assuming
that the extended corner protectors of the inserts would provide better package performance than
the insert used in solution 6 was not proven in the results. Furthermore, the insert used in
solution 6 showed that the corner protectors did not provide better package performance.
Project Problems
The beginning of the testing phase was difficult to begin since the Kongsberg table was down for
a few weeks and the availability of the dynamics and packaging lab was limited. The inability to
cut out designs made a considerable delay on the project but did not affect meeting the project
deadline. In addition to the lab availability, the limited constraints of the length and width of the
corrugated material led to outsourcing the case sizes for solutions 2 and 3. Another obstacle in
the project includes the limited product samples provided by Powis Parker. If there were product
samples of the other binding strips or hardcovers, the testing would include replicated testing.
However, the testing requires using dummy weights for the other cartons to simulate a full case
load.
After visiting with Powis Parker, there were no recorded documents explaining the current
packaging procedure or recorded documents of the full package specifications. As a result, the
author based the current layout and weight from the limited product samples. Therefore, the data
collection process would be less difficult if Powis Parker documented their process. Since the
employees that run the packaging process line have worked for the company for over 10 years, it
is irrelevant to them to record the processes.

42
Future Work
If Powis Parker chooses to implement the proposed solutions, the company needs to find a
box manufacturer that can produce the proposed solution on a large scale. The value of the
solution can be determined by the manufacturer’s price given for the package layout on a large
scale. The results from the tests performed support the expected performance of the package
quality if the design is implemented. There will be no costs for installation since no machinery
will be needed to implement the layouts.
In order to fully implement the solutions, the company would need to test the same ASTM
D4169 distribution cycle three as shown in the solutions. The long wide and long medium
binding strips are compatible with the proposed solution but no testing results have been
determined. If the solution 1 is implemented, the carton can contain six long wide strips and
eight long medium strips. Therefore, the solution can be implemented for the other products but
it will change the sale patterns. Even though the sale pattern will change, the cost benefits of the
solution should be an incentive to change the carton size. In addition to binding strips, the
company would need to test the 11” x 8.5” hardcovers to the same ASTM D4169 distribution
cycle three. The solution 6 can be implemented for this hardcover, but the sale pattern would
change from 25 per case to 20 per case. However, reducing the packaging to one insert should be
an incentive to change the case size. One insert will reduce the storage space of multiple inserts
while minimizing material.
Facets of the Implementation
Although the project includes concrete data to reduce packaging costs, the solutions may be
difficult to implement if Powis Parker is hesitant to change the sale patterns. However the sale
patterns are changed in order to reduce packaging components to meet the needs of multiple
products per design. The benefits of the solutions can improve Powis Parker’s goal to change the
packaging process to increase pallet efficiency and product quality. Overall, the two proposed
solutions guide the company in the right direction to improve their packaging costs.

43
SECTION VI
REFERENCES
(2006). “Secondary Packaging and Testing”. The Association for Dressing and Sauces 10 2-5.
(2007). Save money by reducing waste: Reduce your use of raw materials. Business Link, from
http://www.businesslink.gov.uk/bdotg/action/detail?itemId=1079438549&type=RESOU
RCES, accessed on Oct. 8, 2010.
(2010). “Reduce Packaging”. Queensland Government, from
http://www.ecoefficiency.com.au/Portals/56/factsheets/foodprocess/waste/ecofoodwecof
_fsr5.pdf, accessed on Nov. 3, 2010.
(2010). “Corrugated Board”. FEFCO: European Federation of Corrugated Board Manufacturers
from http://www.fefco.org/corrugated-packaging/corrugated_board.html accessed on
Nov. 3, 2010.
Andersson, Caisa (2008). “New Ways to Enhance the Functionality of Paperboard by Surface
Treatment- a Review.” Packaging Technology and Science 21(6): 15-24.
ASTM. (2005). ASTM D4169: Standard Practice for Performance Testing of Shipping
Containers and Systems.
Fiber Board Association. (2010). "All About Corrugated." Corrugated Packaging.
Corrugated.org, from http://www.corrugated.org/Basics/AboutCorrugated.aspx
accessed on November 17, 2010.
Garcia-Arca, Jesus. (2005). “Logistics Improvement through Packaging Rationalization: A
Practical Experience”. Packaging Technology and Science 19(6): 303-308.
Ge, Changfeng (1998). “Efficient Packaging Design and Logistics”. Packaging Technology and

44
Science 9(5): 277-280.
Paperboard Packaging Alliance (2008). About Paperboard Packaging,
http://www.paperboardpackaging.org/about_paperboard/index.html, accessed on
November 17, 2010.
Raper, Stephen. “Handbook of Design Manufacturing and Automation”. University of
Minnesota 18 331-336.
Singh, Jay. (2010). “Lecture 1”. IT 475 Packaging Performance. Slides: 12.
Sweeney, Padraic. (2010). Sustainable Manufacturing Initiative. U.S. Department of Commerce,
from http://www.delkorsystems.com/articles/us-doc-packaging-machinery-
sustainability-report.pdf , accessed on Oc. 8 2010.

45
Appendix 1: Solution 1

46
Appendix 2: Solution 2

47
Appendix 3: Solution 3

48
Appendix 4: Solutions 4 and 5

49
Appendix 5: Solution 6

50
Appendix 6: Current Binding Strip Solution
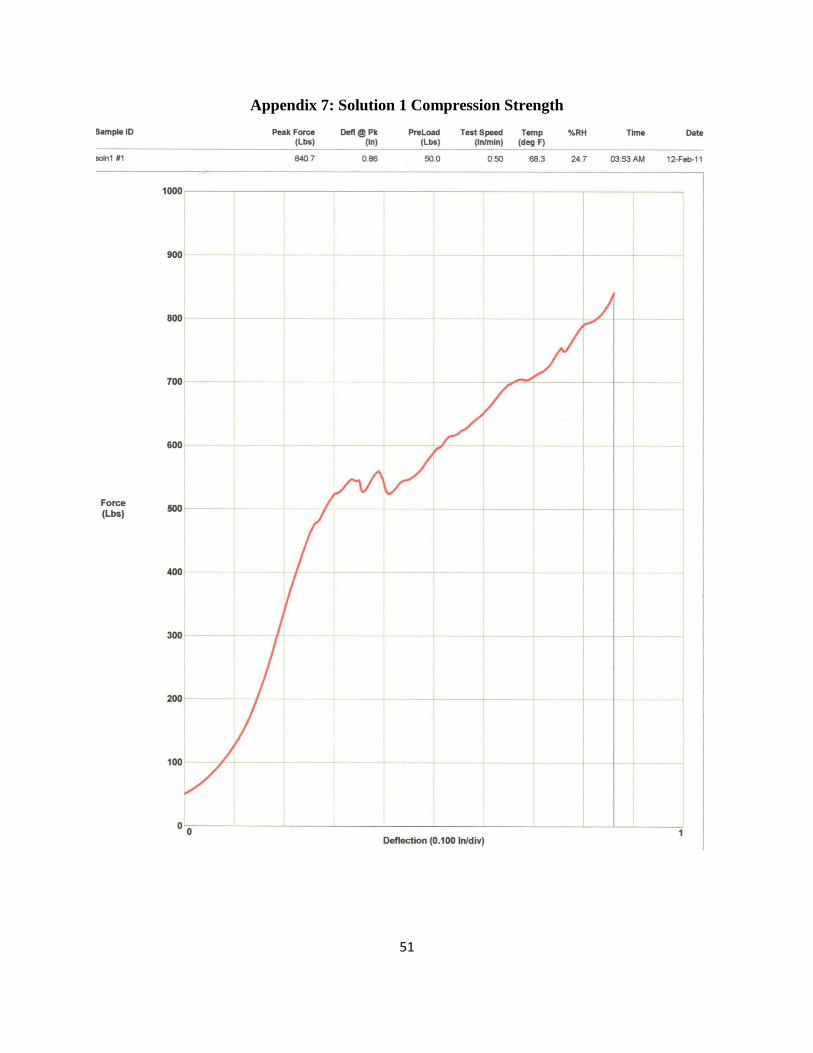
51
Appendix 7: Solution 1 Compression Strength

52
Appendix 8: Solution 2 Compression Strength

53
Appendix 9: Solution 3 Compression Strength

54
Appendix 10: Solution 4 Compression Strength

55
Appendix 11: Solution 5 Compression Strength

56
Appendix 12: Solution 6 Compression Strength

57
Appendix 13: Solutions 1 and 2 Carton
Appendix 14: Solutions 2 and 3 Case

58
Appendix 15: Solution 4 Case
Appendix 16: Solutions 4 and 5 Insert

59
Appendix 17: Solution 5 Case
Appendix 18: Solution 6 Case

60
Appendix 19: Solution 6 Insert
Appendix 20: Binding Strip Comparative Data
Current Layout Solution 1 Solution 2 Solution 3
Waste 6.16% 5.21% 6%.11
Total Material
per Case
4009.05 in2 3472.4 in
2 6817 in
2 7980.75in
2
Units/Case 25 30 60 50
Material/Unit 160.36 in2/
/unit 114.24 in2/
/unit 113.62in2/
/unit 159.615in2/
/unit
Pallet Load 900 1080 960 800
Pallet Load %
Increase
20% 6%
Material/Unit
% Reduction
28.7% 29.1% 0.04%

61
Appendix 21: Hardcover Comparative Data
Current Layout Solution 4 Solution 5 Solution 6
Waste 35.99% 34.57 36.76% 34.57%
Total Material
per Case
1778.83 in2 1758.22 in
2 1764.43 in
2 1764.43 in
2
Units/Case 25 25 25 25
Material/Unit 71.15 in2/
/unit 70.3 in2/
/unit 70.5 in2/
/unit 66.99 in2/
/unit
Pallet Load 1800 1800 1800 2100
Pallet Load %
Increase
16%
Material/Unit
% Reduction
12%
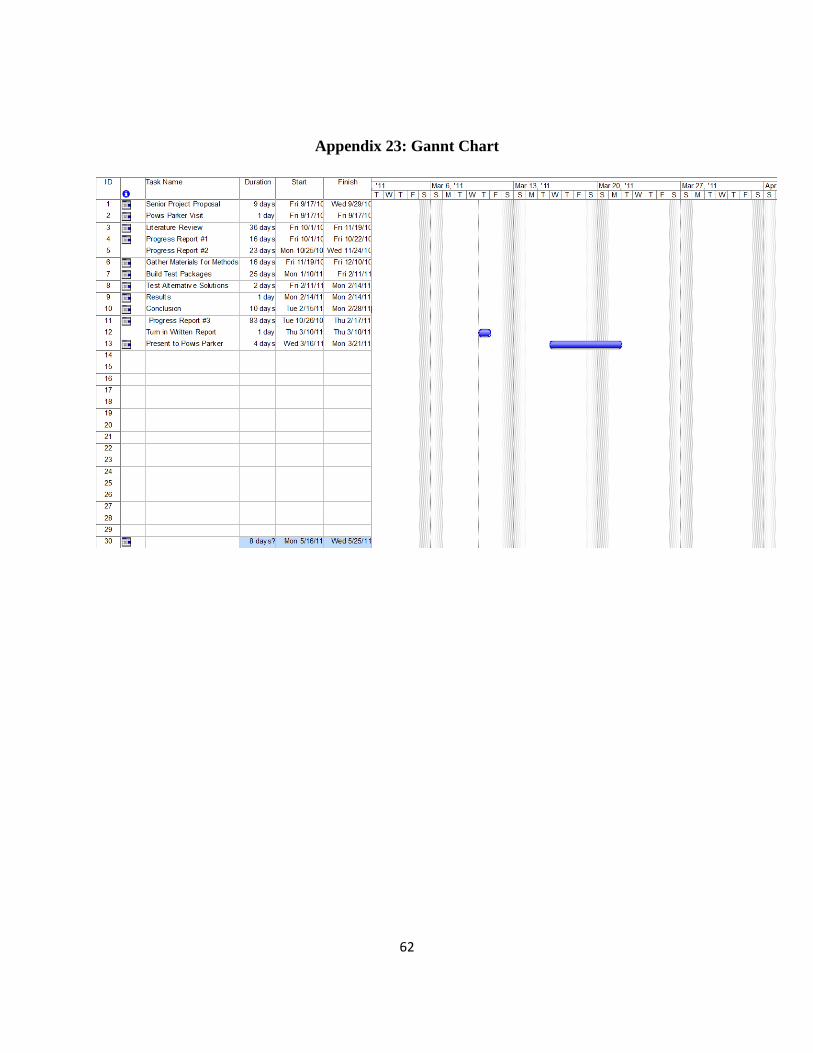
62
Appendix 23: Gannt Chart

63