Embed Size (px)
Citation preview

Redefining success
Soy 20/20
January 21st, 2004

Overview
• Where are we at now?
• How did we get here?
• What opportunities exist to change this?
• How can we make the future look different?
Soy 20/20 vision
OMAF U. ofGuelph
OSG AAFC
Soy 20/20
Refine vision Walk towards it

How did we get here?
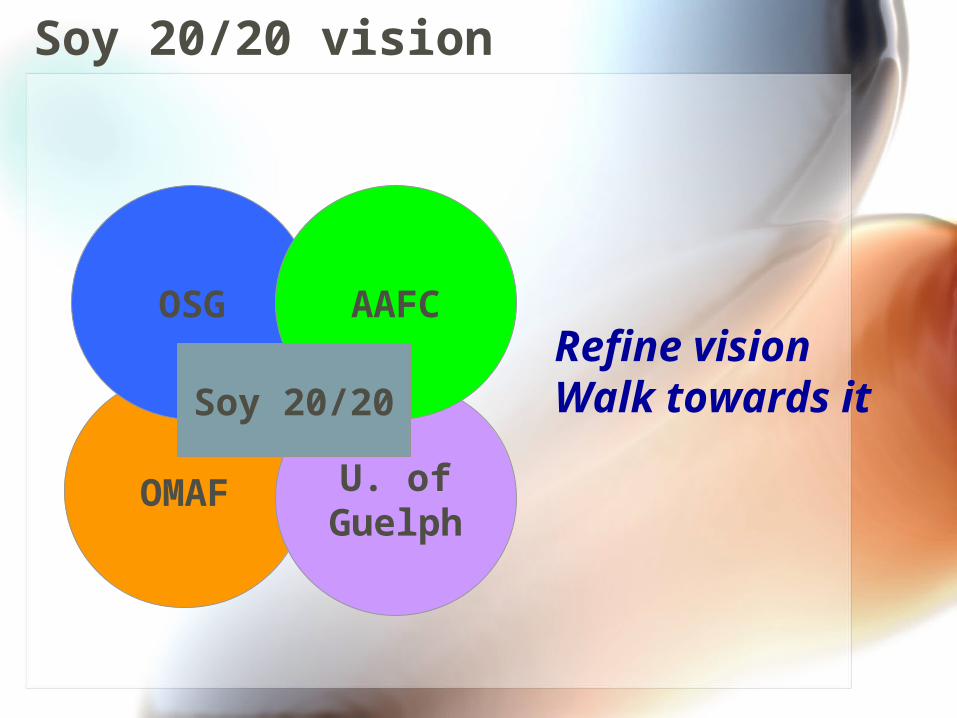
Drivers for Ontario production
0
5
10
15
1942 1952 1962 1972 1982 1992 2002
Val
ue ($
/bu)
05001000150020002500
Vol
ume
(1,0
00
acre
s)
$/bu Acres harvested
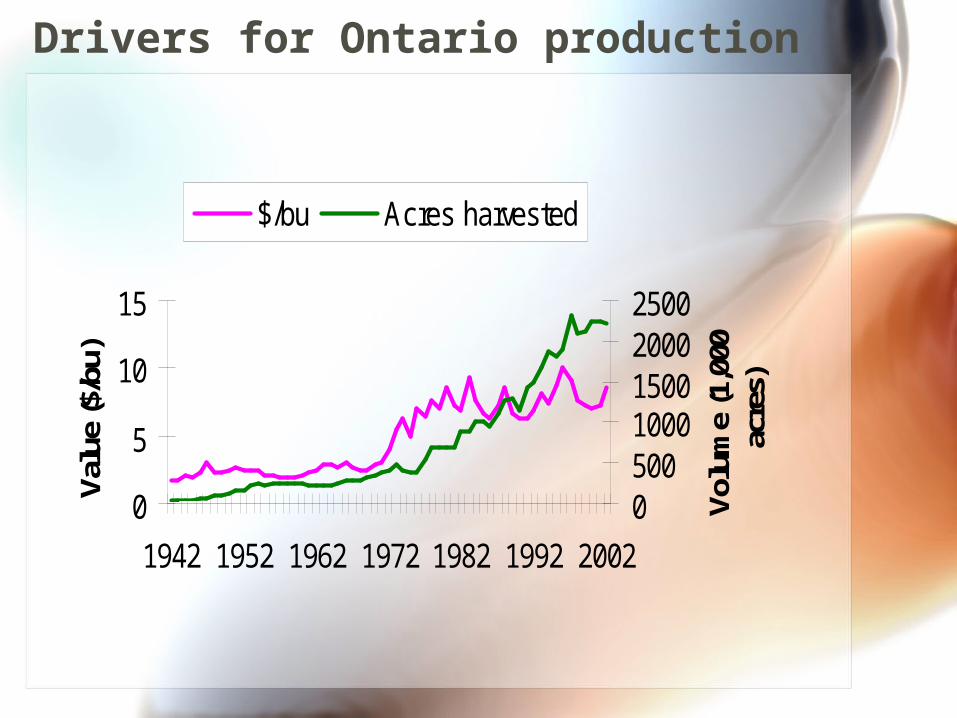
Supply/Demand = Price
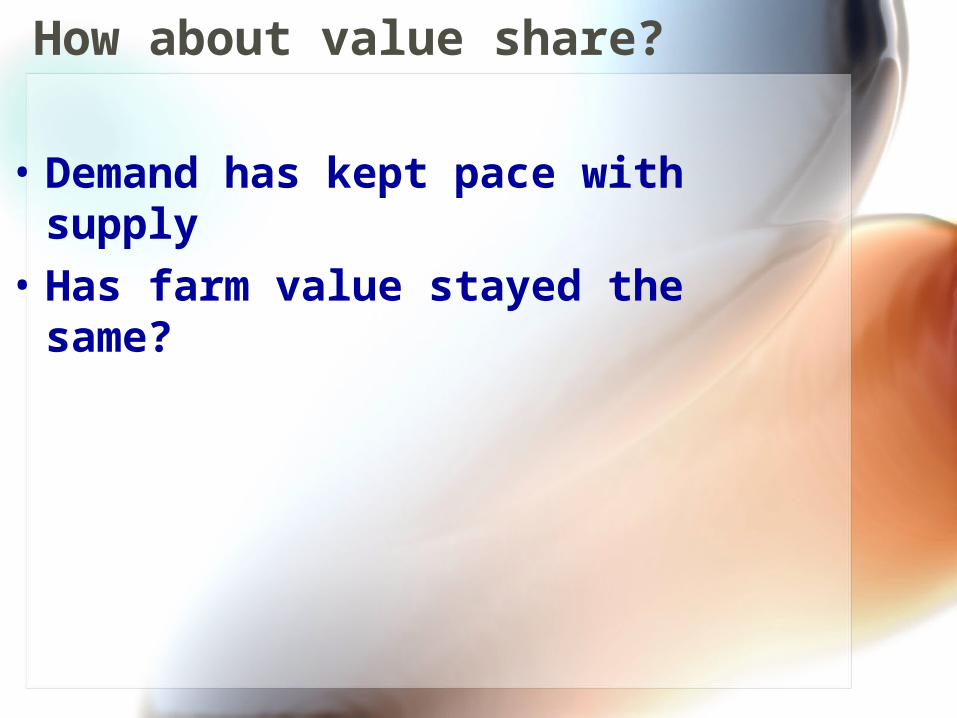
How about value share?
• Demand has kept pace with supply
• Has farm value stayed the same?
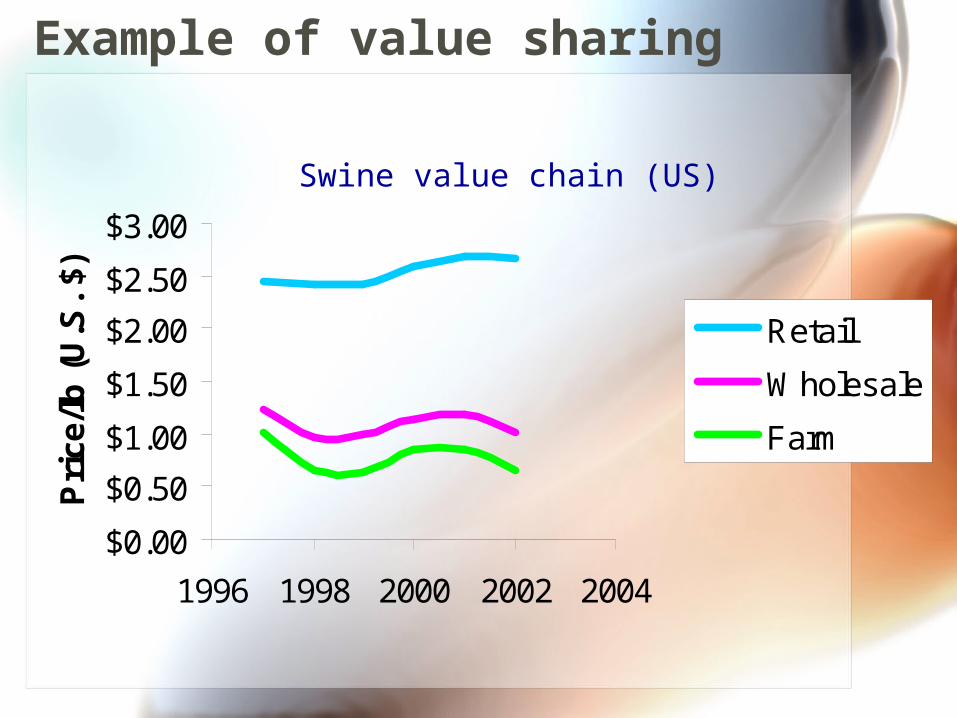
Example of value sharing
$0.00
$0.50
$1.00
$1.50
$2.00
$2.50
$3.00
1996 1998 2000 2002 2004
Pri
ce/l
b (
U.S
. $)
Retail
Wholesale
Farm
Swine value chain (US)

Farm soybean profit versus export margin.
-$2.00
-$1.00
$0.00
$1.00
$2.00
$3.00
$4.00
1988 1993 1998 2003
Val
ue/
bu
Farm profit
Export margin
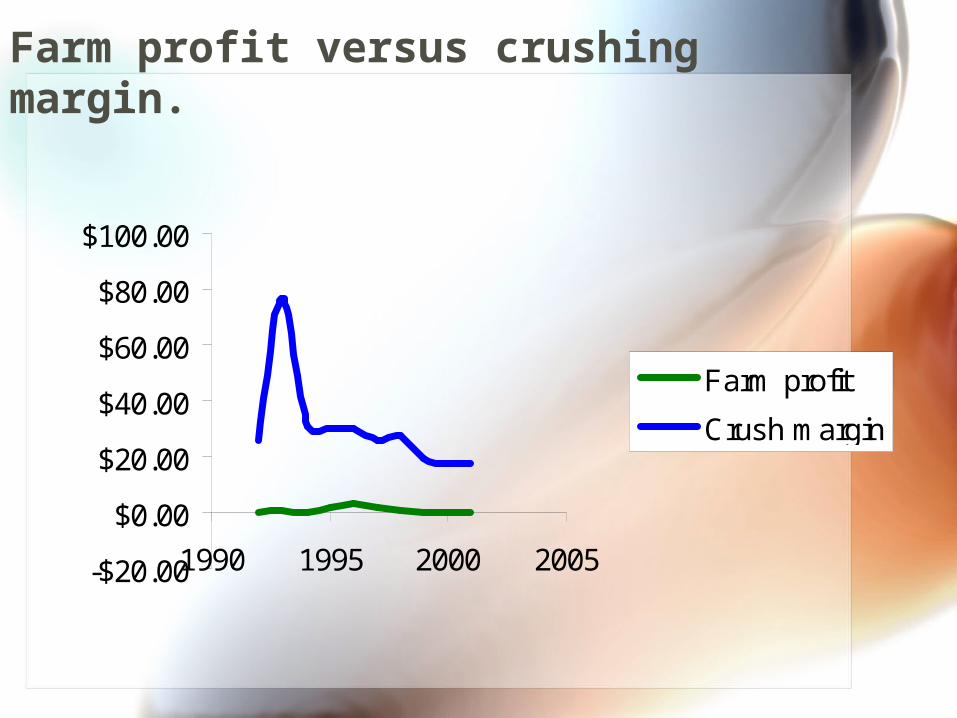
Farm profit versus crushing margin.
-$20.00
$0.00
$20.00
$40.00
$60.00
$80.00
$100.00
1990 1995 2000 2005
Farm profit
Crush margin
The closer you are to the consumer the higher the profit.

The best farm value does is maintain share.

Future projections
• Price will stay stable to improve– Argentina close to maxed out– Brazil poised for additional growth– U.S. reduced production– China is the one to watch

Industrial markets for soybeans
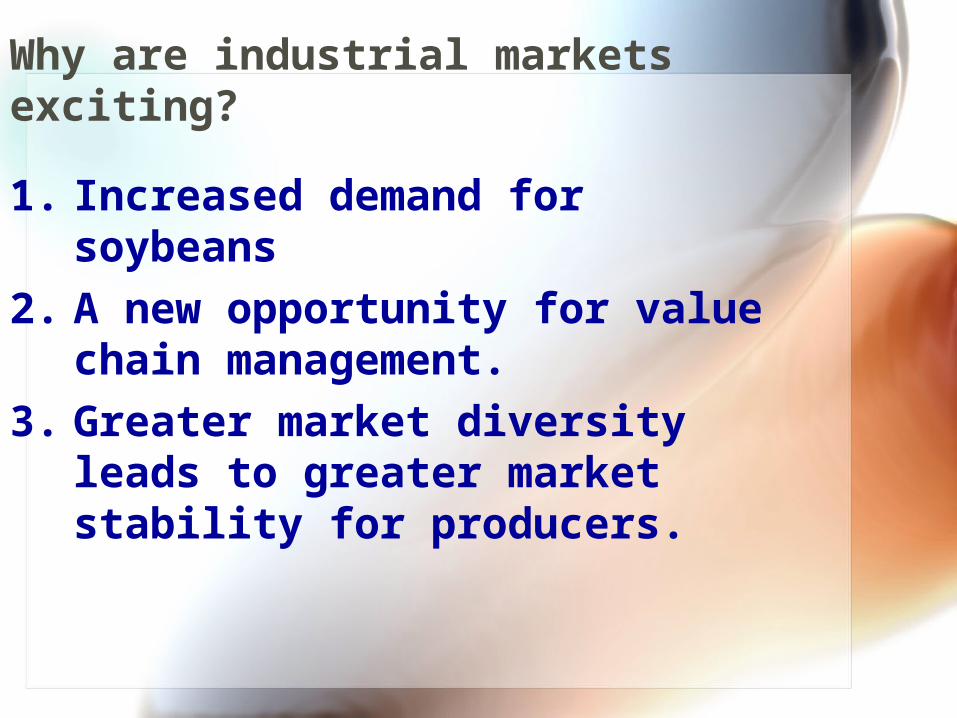
Why are industrial markets exciting?
1. Increased demand for soybeans
2. A new opportunity for value chain management.
3. Greater market diversity leads to greater market stability for producers.

We need to diversify markets for what we produce.
Producers need to diversify thecrops they produce

Food is not the best growth opportunity for agriculture.
$0$5
$10$15$20$25
GDP ($B)
Industrial sector value in Ontario.
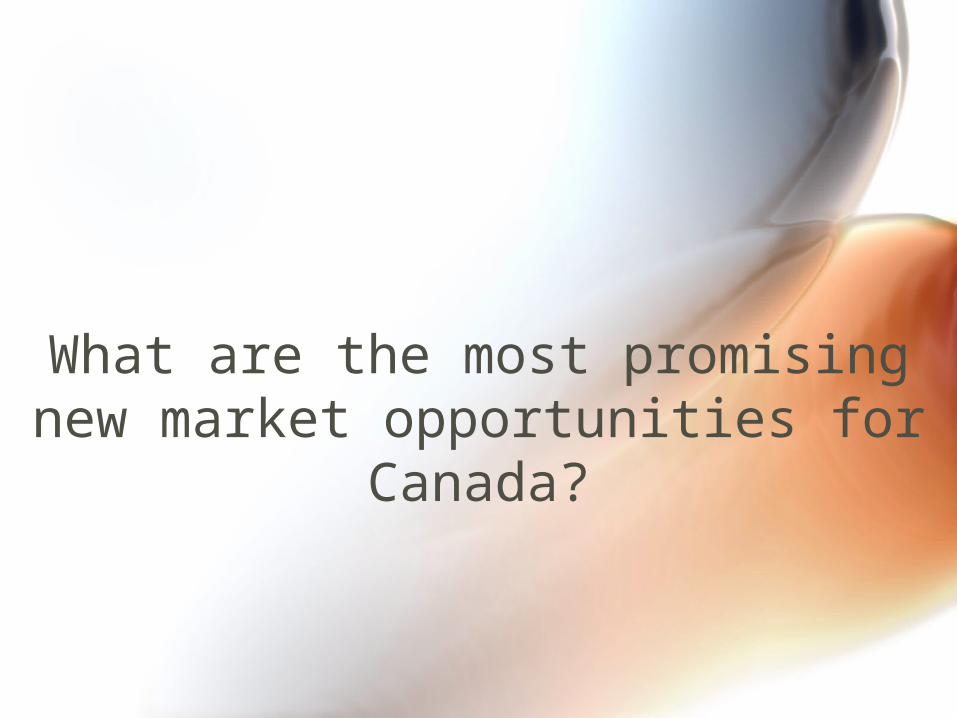
What are the most promising new market opportunities for Canada?
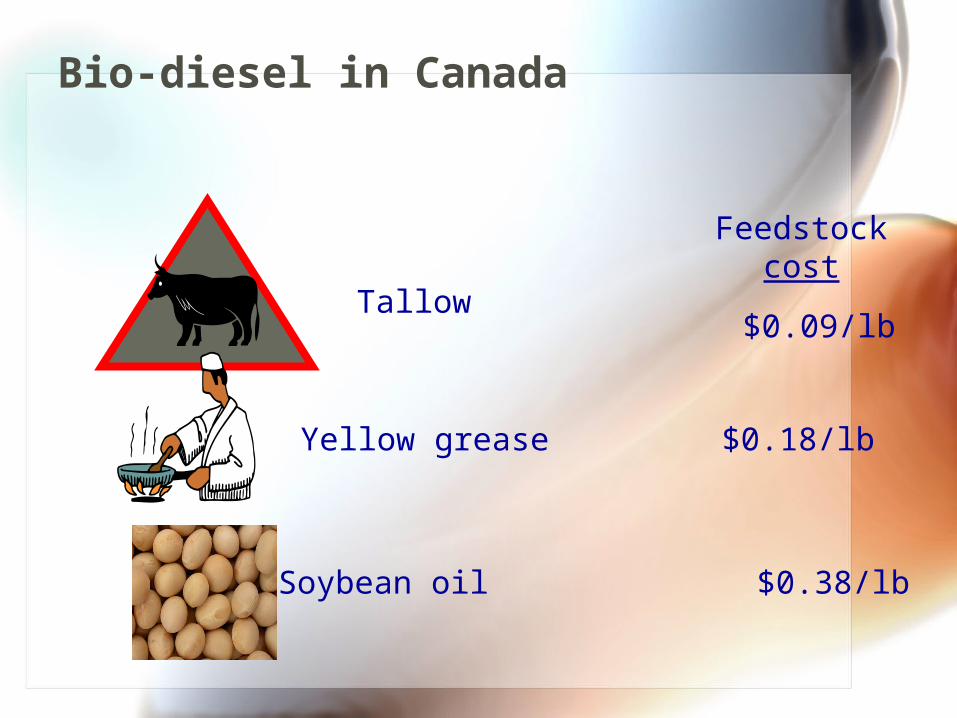
Bio-diesel in Canada
Tallow
Feedstockcost
$0.09/lb
Yellow grease $0.18/lb
Soybean oil $0.38/lb
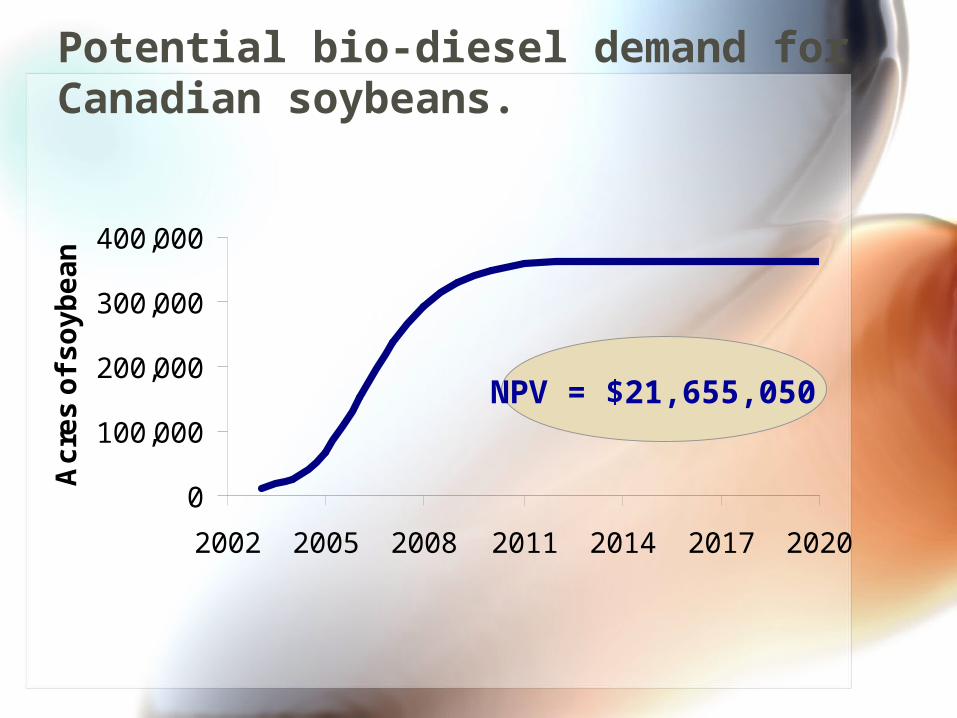
0
100,000
200,000
300,000
400,000
2002 2005 2008 2011 2014 2017 2020
Ac
res
of
so
yb
ea
nPotential bio-diesel demand for Canadian soybeans.
NPV = $21,655,050

Soybeanperoxidase
Soybean peroxidase
Phenolic resins
Phenol + Formaldehyde

Soy wax candles
Waxproducer
6,000 acres of soybean
Candle company
Candlecompany
Candlecompany
CandleCompany
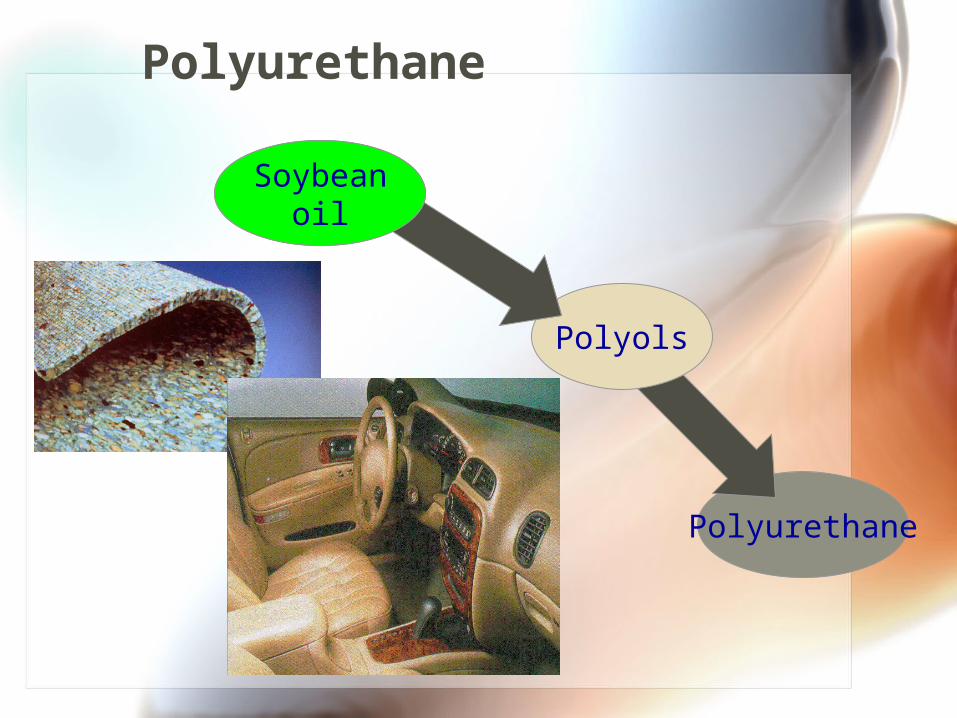
Polyurethane
Polyurethane
Polyols
PetroleumSoybean
oil
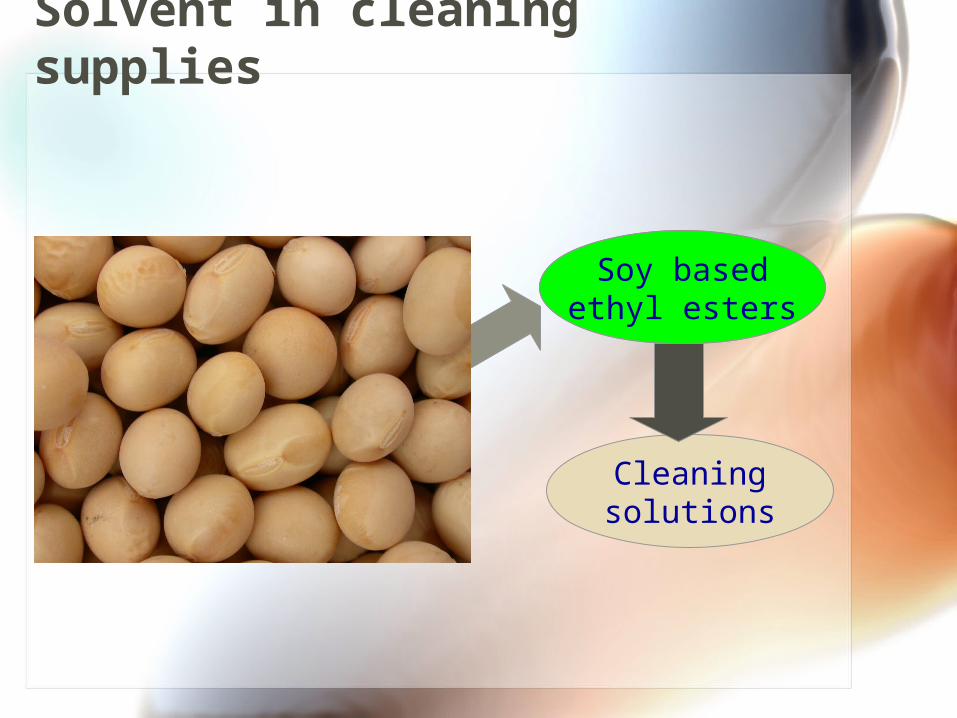
Solvent in cleaning supplies
Limonene
Cleaningsolutions
Soy basedethyl esters

How can we change the future?
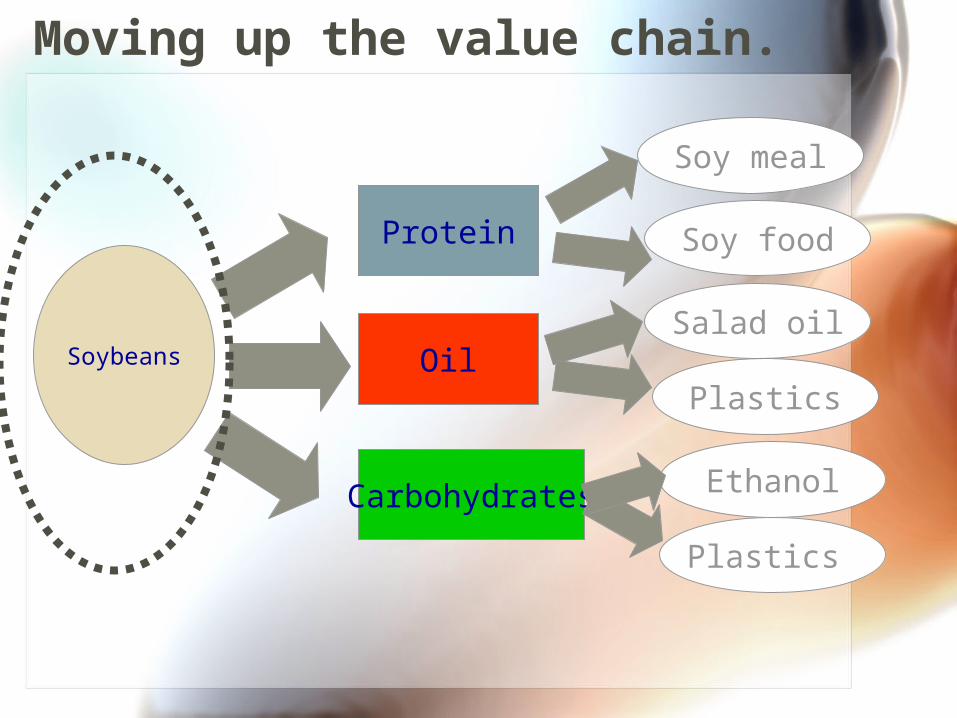
Moving up the value chain.
Soybeans
Protein
Oil
Carbohydrates
Soy meal
Soy food
Salad oil
Plastics
Ethanol
Plastics
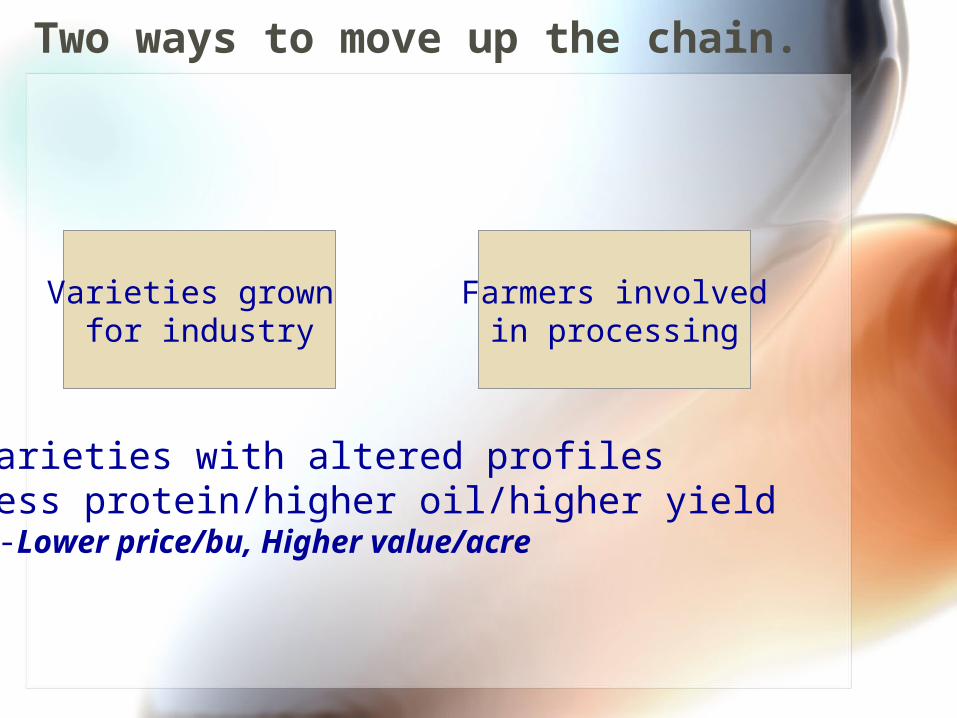
Two ways to move up the chain.
Varieties grown for industry
Farmers involvedin processing
-Varieties with altered profiles-Less protein/higher oil/higher yield
-Lower price/bu, Higher value/acre
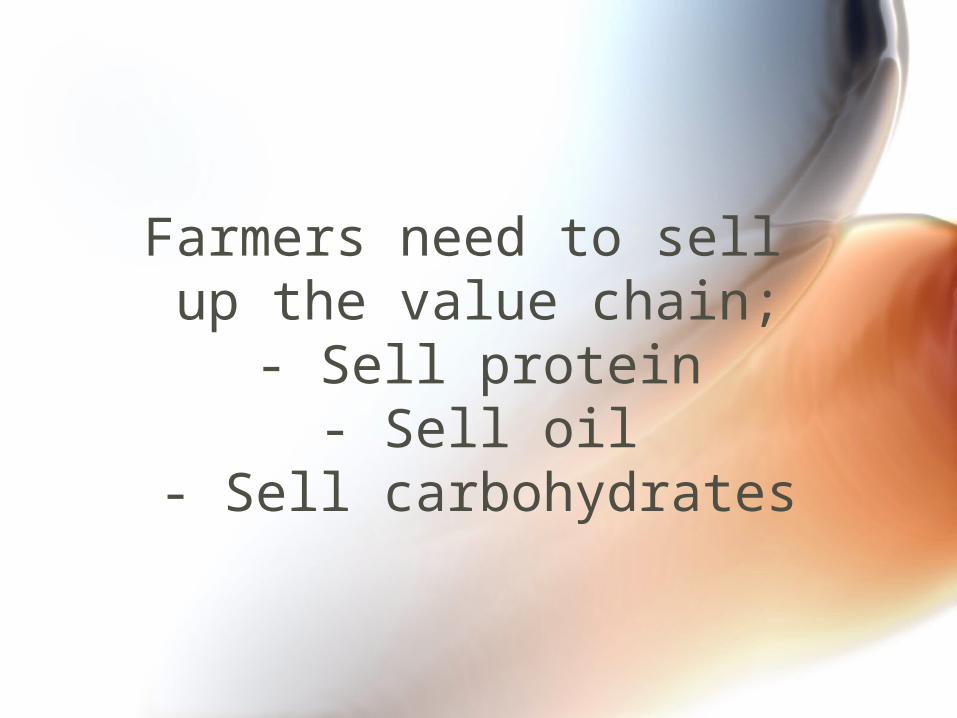
Farmers need to sell up the value chain;
- Sell protein- Sell oil
- Sell carbohydrates
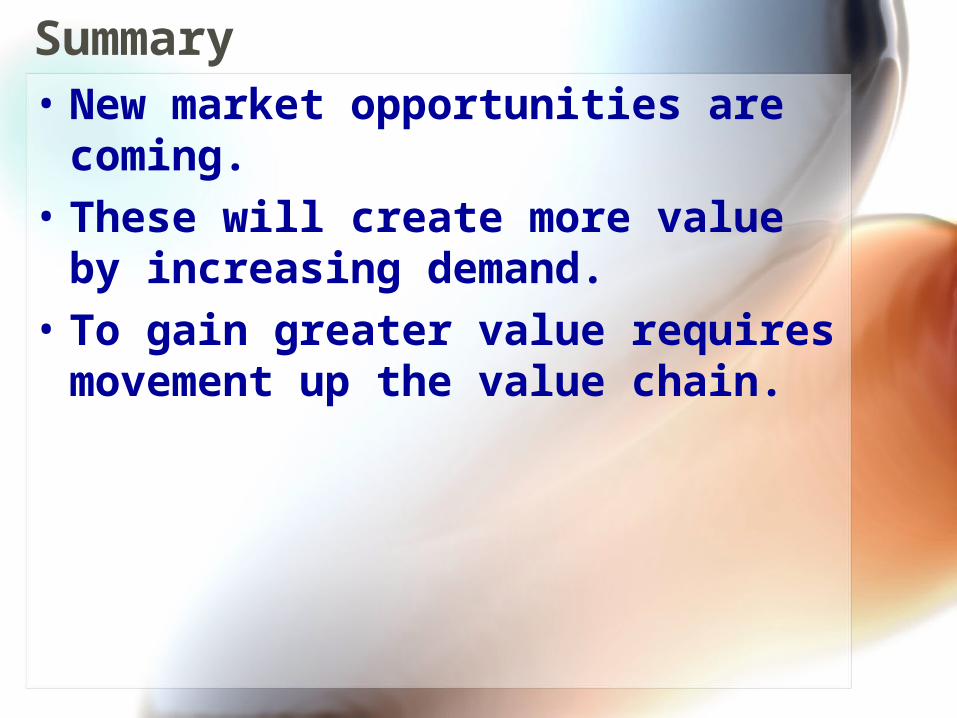
Summary• New market opportunities are
coming.
• These will create more value by increasing demand.
• To gain greater value requires movement up the value chain.

We need to imagine success beyond alleviating current
constraints.We need to imagine beautiful.