Embed Size (px)
Citation preview
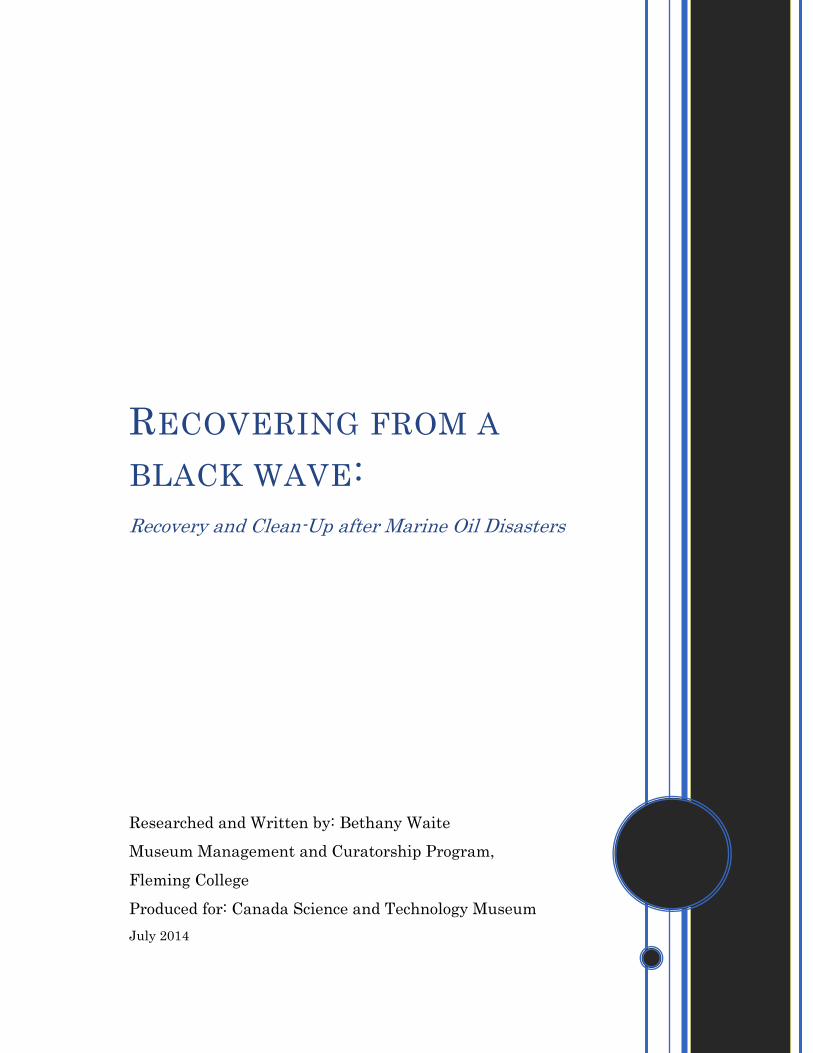
Researched and Written by: Bethany Waite
Museum Management and Curatorship Program,
Fleming College
Produced for: Canada Science and Technology Museum
July 2014
RECOVERING FROM A
BLACK WAVE:
Recovery and Clean-Up after Marine Oil Disasters

July 2014
1
RECOVERING FROM A BLACK
WAVE:
Recovery and Clean-Up after Marine Oil Disasters
Table of Contents Introduction .....................................................................................................................................3
Brief History of Marine Oil Transportation: From “Bubblin’ Crude” to the Supertanker Era ..3
Torrey Canyon: Disaster During A Movement..............................................................................5
The Accident ................................................................................................................................5
Human Error ...............................................................................................................................8
Outcomes ......................................................................................................................................9
Arrow: Oil on Canadian Soil ........................................................................................................ 10
The Accident ............................................................................................................................. 10
Task Force ................................................................................................................................. 13
Recovery .................................................................................................................................... 14
Oil Containment and Clean-Up ............................................................................................... 18
Outcomes ................................................................................................................................... 22
Kurdistan: Oil and Ice ................................................................................................................. 23
The Accident ............................................................................................................................. 23
Two Halves of a Whole ............................................................................................................. 24
Continuous Clean-Up ............................................................................................................... 26
Outcomes ................................................................................................................................... 29
Nestucca: A Foreshadowing Event ............................................................................................. 31
The Accident ............................................................................................................................. 31
Clean-Up ................................................................................................................................... 32
Outcomes ................................................................................................................................... 35
Exxon Valdez: A Pristine Catastrophe ....................................................................................... 36
The Accident ............................................................................................................................. 36
Human Error ............................................................................................................................ 38
Contingency Plan Confusion .................................................................................................... 39
July 2014
2
Oil Movement ............................................................................................................................ 40
Clean-Up ................................................................................................................................... 41
International News ................................................................................................................... 44
Outcomes ................................................................................................................................... 46
Brigadier General M.G. Zalinski: Cleaning Up the Past........................................................... 52
The Accident ............................................................................................................................. 52
Recovery .................................................................................................................................... 54
Outcomes ................................................................................................................................... 56
Conclusion..................................................................................................................................... 57
Bibliography ................................................................................................................................. 58
Acknowledgements ....................................................................................................................... 67
Appendix A: Collections Inventory.............................................................................................. 68
Artefacts .................................................................................................................................... 68
Trade Literature ....................................................................................................................... 84
Appendix B: Collections Development ........................................................................................ 85
Objects ....................................................................................................................................... 85
Oral History .............................................................................................................................. 87
Publications............................................................................................................................... 89
Conference ................................................................................................................................. 89

July 2014
3
INTRODUCTION This research project was completed for Fleming College’s Museum Management and
Curatorship Program curriculum-based summer internship implemented at Canada Science and
Technology Museum.
Recent events have led to petroleum transportation becoming a topical issue once again.
This report examined the first worldwide method used, marine transportation. Marine
transportation allowed this product to be used globally. However, this form of shipping is not
perfect and accidents occur. Marine oil disasters from tankers greatly affect the environment with
long-term consequences still unknown. History has shown that the occurrence of a disaster will
cause change to take place.
The focus of this research report is recovery and clean-up techniques following marine oil
disasters. This will include technological development of equipment used, scientific research on
the environmental impact these spills have on the coastal ecosystem, evolution of preventative
measures and changes in legislation.
Scholarly journals, books and newspaper articles were reviewed to determine what is
considered the first major oil disaster. These sources were also reviewed to determine which
disasters influenced the recovery and clean-up response. This research determined the Torrey
Canyon (1967), Arrow (1970), Kurdistan (1979), Nestucca (1988), Exxon Valdez (1989), and
Brigadier General M.G. Zalinski (sank in 1946, recovery of oil in 2013) oil spills would be
discussed in this report.
Canada Science and Technology Museum does focus on Canadian innovation, but it is
understood that petroleum transportation is an international affair. Changes that occur within this
industry affect the industry on a global scale, not just limited to Canada. This is why disasters
which took place outside of Canada are also included in this report.
BRIEF HISTORY OF MARINE OIL TRANSPORTATION: FROM
“BUBBLIN’ CRUDE” TO THE SUPERTANKER ERA The use of crude oil as an energy source began in the 1850s (Parker, 2009). However,
one problem arose. How was this resource to be transported from the remote locations it was
found in? The solution was found by turning to the water. In the 1860s the first oil tankers were
built and propelled with sails. The first steam tanker, Vanderland, was built in 1873 by the
Palmers Shipbuilding and Iron Company (Parker, 2009). In 1878 the first modern tanker,
Zoroaster, was designed and built by Ludvig Nobel of Sweden (Franks and Nunnally, 2011).
A three island design was created to increase storage capability. At the stern of the ship
was the smoke stack and crew’s quarters, the middle of the ship was the bridge and officer’s
quarters and the bow had a raised forecastle to protect against rough seas and increased storage

July 2014
4
for supplies. This was the standard ship design for tankers for over 60 years (Modern Marvels,
2004).
Ships called oilers began to be used during World War One. These ships were capable of
providing underway replenishment of fuel. This allowed Navy ships to be refueled while sailing
across the ocean. Therefore, British destroyers were refueled during a tactical operation rather
than coming into Port (Modern Marvels, 2004).
Similarly, advancements in ship building technologies arose during World War Two. This
war was highly mechanized and required more oil use, for example, oil was needed to fuel the
tanks and airplanes being used not just the Navy fleet. This made tankers a prime target for U-
boats. Therefore tankers were needed faster than U-boats could sink them. This led to the
construction of the T2 Tanker. These tankers were a standard design and could be built quickly
with segments of the ship being built onshore to be brought to the shipyard. Also, every time one
of these tankers was built the builders could learn how to build them faster (Modern Marvels,
2004).
The post-war era that followed saw a boom in Western economies, including an increase
in car ownership and development of the airline industry. To meet the new demand of oil T2
Tankers were sold to oil companies. These companies retrofitted these tankers to increase cargo
capacity (Modern Marvels, 2004).
Political instability grew in the Middle East. This eventually led to the closure of the Suez
Canal from 1956-1957 and again in 1967-1973. The Suez Canal allowed for shorter travelling
distances. The closures meant that tankers would now have to go around the Cape of Good
Hope. During the first closure, ship owners discovered it was more economical to build larger
ships for the longer journey. A study found there was a steep decrease is cost when the ship’s
size increased to 100,000 dwt (Gardiner, 1992).
During the second closure of the Suez Canal, there was a shortage of tankers and
corresponding with the increased freight rates there were an increased number of ship orders for
larger tankers. These orders were also made with disregard to the size of the Suez Canal
because ship owners predicted the instability to continue. By 1973, the tanker size increased to
250,000 dwt (Gardiner, 1992).
The increase in size led to a change in ship design. The three island structure was
combined into one superstructure at the stern of the tanker. This allowed more space in the hull
for cargo. The supertanker was born (Modern Marvels, 2004).
The large scale ordering of tankers of this size was part of a peak in the world’s
industrialized cycle. World economies were experiences rapid growth and the price of oil was at
an all-time low. Also, the oil industry was changing, for example The United States became the
world’s largest oil consumer. The industrial growth which occurred meant The United States could

July 2014
5
no longer provide enough domestic oil to meet these demands and was imported from The
Middle East (Gardiner, 1992)
The globally increased demand for oil lead to predictions if the rate of use continued as it
was, all of the world’s oil reserves would be used by the end of the century. Organization of
Petroleum Exporting Countries (OPEC) was gaining strength. The Energy Crisis of the 1970s
collapsed the need for large tankers, including tankers still being built to fulfill orders made during
the Suez Canal closure. Some of these orders were cancelled while other were converted to
combination or bulk carriers or ship owners had the delivery delayed (Gardiner, 1992).
The Energy Crisis ended in 1979 and the demand for oil once again increased. The size
of the tankers carrying crude oil also increased. Universe Ireland was the first Ultra Large Crude
Carrier (ULCC) with a capacity of over 300,000 dwt (Modern Marvels, 2004).
TORREY CANYON: DISASTER DURING A MOVEMENT
The Accident The 1960s influenced the world in many ways. Following the publication of Silent Spring
by Rachel Carson and the threat of nuclear fallout public awareness surrounding environmental
issues rose (McCormick, 1991). Public sensitivity to environmental issues was catalyzed by a
series of environmental disasters during 1966-1972 (McCormick, 1991).
On 18 March 1967, the Torrey Canyon ran aground on Seven Stones reef while making
her way to Milford Haven in Wales after hitting Pollard Rock (Duff, 2010). She was travelling at a
speed of approximately 15.75 knots (McGurren, 1971). The tanker was then stuck between
Land’s End and the Isles of Scilly on the southwest tip of England (McCormick, 1991). Torrey
Canyon was carrying 119,328 tons of crude oil and this accident ruptured six starboard tanks and
crude oil began to leak, Figure 1 (McGurren, 1971). By 20 March approximately 30,000 tons of
oil had spilled into the sea affecting 100 miles of British coastline within a week (McGurren,
1971). On 26 March, another 30,000 tons of crude oil was released from the wreck due to high
seas and strong winds (McGurren, 1971).

July 2014
6
Figure 1: Oil spilling from Torrey Canyon (Source: Environment & Society Portal, 2012)
It was during the recovery and clean-up that it was realized how little the United Kingdom
was ready for this type of disaster with the lack of government preparedness. It was also realized
how little scientific research and scientific advice was available (McCormick, 1991).
Attempts were made to re-float the tanker; however this resulted in the death of a Dutch
salvage engineer, Captain H B Stal. He was the only casualty during the accident. His death was
caused by an explosion when a falling piece of wreckage created a spark which ignited fumes
from the engine room. The ship then began to break up and split in two, sending more crude oil
into the channel (Duff, 2010).
Different techniques were tried during the recovery and clean-up stage, known as
“Operation Mop Up”. These included the use of detergents to break down and sink the oil, the use
of ‘fences’ which used floating booms to prevent the spread of oil and using special nets in thick
areas to scoop up the oil. The latter two techniques were preferred by oyster fishermen who were
rightfully worried about the impact sunken oil would have on the Fal riverbed. It was later proven
that it was the chemicals of the detergents which had a greater impact on the environment due to
their high toxicity (Duff, 2010).
As a last resort the British government used the Royal Air Force to bomb the spill with the
intention of burning the remaining oil (McGurren, 1971). Eight Navy Buccaneer jets flew over the
area of the wreck and dropped 42 bombs (Duff, 2010). This was also unsuccessful in the media’s
opinion as reports were made that only 75% of the bombs were on target, even though the aim of

July 2014
7
the mission was achieved (Duff, 2010). Royal Air Force jets also dropped aviation fuel and
napalm onto the oil to ignite the burn, Figure 2 (Duff 2010).
Figure 2: Oil ignited after Royal Air Force dropped bombs on the spills (Source: Hanlon, 2010)
The public not only criticized the government for their delayed response but were now
aware of the personal cost associated with pollution. Not only were British coastlines damaged
and marine life affected, but there was a financial cost to the public. The 6 million pound clean-up
bill was impressed upon the British taxpayers (McCormick, 1991).
Torrey Canyon was the largest oil spill anywhere in the world at that point in time; it still
remains the largest spill to occur in the United Kingdom (Holmes, 2011). The coastlines of
England were not the only ones to be impacted resulting in the death of 100,000 seabirds, seals
and other marine life (Utton, 1968). But approximately 50,000 tons of crude oil were also blown
across to the coastline of France, impacted the beaches of Brittany and some crude oil also
washed ashore the island of Guernsey, Figure 3 (Holmes, 2011).

July 2014
8
Figure 3: Map indicating the spread of the oil slick from site of the Torrey Canyon wreck (Source: Tankers,
Big Oil and Pollution Liability, unknown)
Human Error
Human error was determined to be the cause of the Torrey Canyon grounding (Harrald et
al, 1998). Rothbum et al (2002) examined the four key factors which contributed to the human
error.
The first consideration is economic pressure from management placed on the Master to
stay on schedule. The Captain had been notified of decreasing tides at Milford Haven by a
shipping agent. The Captain then had to decide to stay the course to try and make high tide, or
wait 5 days for the next high tide for sufficient water depth to enter the terminal. He continued
(Rothbum et al, 2002).
The second factor is influenced by the first, the captain’s vanity surrounding the ship’s
appearance. Cargo should have been transferred to balance out the ship’s draft. This could have
taken place while on route, but there was concern over the ship’s appearance as performing this
transfer would have increased the risk of spilling a little oil on the decks. Instead, the Captain
decided to rush past the Scillies and into Milford Haven and make the transfer there. This only
increased the pressure to meet the schedule (Rothbum et al, 2002).
The third error occurred when the master decided to go through Scilly Islands, rather than
around them, as a means to save time. However, he did not have a copy of the Channel Pilot for
that area and was not familiar with the area either (Rothbum et al, 2002).
The fourth error lied with equipment design. The steering selector switch was left on
autopilot. An error occurred by the manufacturer as the steering selector unit did not give any
indication of the setting at the helm. Therefore when the captain ordered a turn into the western

July 2014
9
channel through the Scillies the helmsman was unable to turn the wheel. In the time it took to
figure out the issue and switch the steering selector back to manual it was too late to make the
turn resulting in the collision with Pollard Rock (Rothbum et al, 2002).
Outcomes Torrey Canyon made international headlines. It also drew attention to the need for
changes in legislation to create more preventative measures amongst the oil shipping industry to
prevent future accidents and a system to address the cost responsibility of oil spill clean-up
(McGurren, 1971).
Prior to this accident, the international 1954 Convention for the Prevention of Pollution of
the Sea by Oil developed “Contiguous Zone” that extended 50 miles from the coast where ships
were prohibited from discharging oil into the sea with penalties being issued by signatory states
(Utton, 1968). However, this was directed at the day-by-day discharge of oil from ships.
On the national scale, different countries had similar legislation aimed at punishing the
discharge of oil. The United States had the U.S. Oil Pollution Act of 1924 and British legislation
such as the Oil in Navigable Waters of 1955 and 1963 (Utton, 1968). But these pieces of
legislation were addressing the issue of intentional pollution and with the possibilities of accidents
not being addressed.
Utton (1968) discussed that this issue was brought to international attention and began to
be addressed by the Inter-Governmental Maritime Consultative Organization to determine steps
to be taken to improve maritime safety and developing protective and preventative measures:
through the establishment and enforcement of sea lanes;
should large ships carrying certain cargo be prohibited completely in certain areas and on
certain routes;
if ships carrying hazardous cargo should be required to have additional navigational aids;
what shore-to-radio installations are required;
should particular types of ships within specified distances from land or in high traffic area
be given speed restriction;
should periodic testing of ship-borne navigation equipment occur;
determine if prescribing international standards for training and qualifications of officers
and crew on ships carrying hazardous material is appropriate
The United Kingdom also established new national legislation following the criticism that
followed Torrey Canyon. The government created the Royal Commission on Environmental
Pollution in 1969 (McCormick, 1991).
Torrey Canyon has paved the way for scientific research on the impact of oil on the
marine environment. For example, Blumer (1971) published Scientific Aspects of the Oil Spill
Problems in the Boston College Environmental Affairs Law Review. This paper discusses the

July 2014
10
need to address and assess the impact of oil as oil pollution is inevitable when living in an oil
dependent world. Not only does Blumer (1971) research focus on oil disasters making reference
to Torrey Canyon but also the smaller amount of oil which entered the environment through
regular oil transport practices. The focus of this research not only explored the environmental
impact but also the health risk these spills pose to humans.
Due to the lack of clean-up response following the spill the impact can still be seen in
wildlife in Guernsey today, Figure 4 (McCormick, 1991).
Figure 4: (left) a quarry on Guernsey that presently oil from Torrey Canyon; (right) a bird killed from oil in the
Guernsey quarry (Source: The Guardian, 2010).
ARROW: OIL ON CANADIAN SOIL
The Accident Arrow was on the end of its journey from Aruba to Point Tupper with 3 million gallons of
Bunker-C heavy crude oil (Green Island Lighthouse, unknown). Arrow was going the speed of 70
miles per hour. On 4 February 1970, the 524 foot oil tanker ran aground following a collision with
Cerberus Rock in Chedabucto Bay, Nova Scotia (Crowley, unknown). Chedabucto Bay is
approximately 30 miles long and 8 to 10 miles wide, separating Cape Breton from the mainland of
Nova Scotia, Figure 5 (Green Island Lighthouse, unknown). Cerberus Rock is a well known
navigational hazard in this area as four other ships were its victim prior to this disaster (Green
Island Lighthouse, unknown).
Poor winter weather conditions contributed to the grounding as well as poor functioning
equipment. Captain George Anastasopolous was aware of the dangers in this area and was on
the lookout for buoys. However, it was not realized that winter protocol had the large buoys
replaced with smaller spars which could not cope with the ice conditions (Green Island

July 2014
11
Lighthouse, unknown). The equipment onboard was also a problem as the navigation equipment,
radar, gyro and echo sounder did not function properly (Green Island Lighthouse, unknown).
Due to the unreliability of the equipment the radar was ignored when an echo of a very
large object was captured at 8:30 that morning. This resulted in the Captain returning to the
practice of a visual search by crew members after reducing speed (Green Island Lighthouse,
unknown).
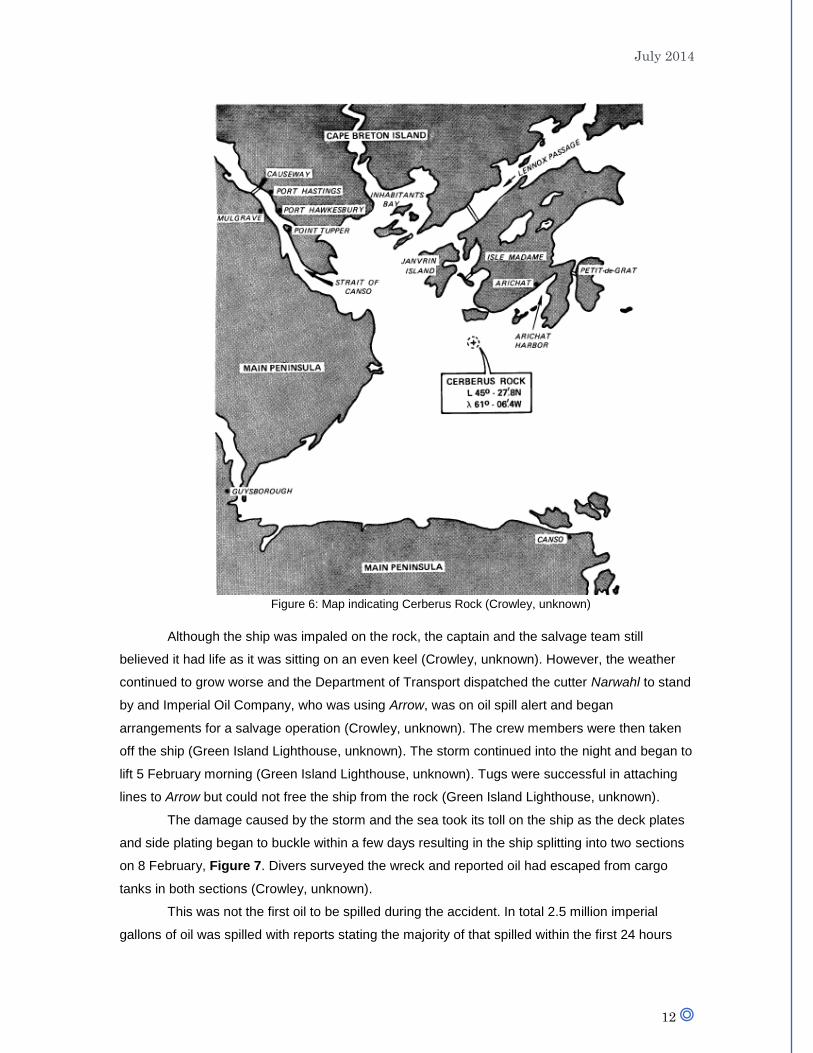
One hour later, Cerberus Rock was struck, Figure 6. The impact drove the forward
section of the tanker into the rock formation wedging the starboard side against the rock spire
(Crowley, unknown). The engines were put in reverse and a distress call was made to the Canso
station as well as a request that the ship owners be notified and the Search and Rescue Center
at Halifax (Green Island Lighthouse, unknown). Halifax was 150 miles southwest of Cerberus
Rock (Crowley, unknown).
Figure 5: Map of Chedabucto Bay area (Source: Crowley, unknown)
July 2014
12
Figure 6: Map indicating Cerberus Rock (Crowley, unknown)
Although the ship was impaled on the rock, the captain and the salvage team still
believed it had life as it was sitting on an even keel (Crowley, unknown). However, the weather
continued to grow worse and the Department of Transport dispatched the cutter Narwahl to stand
by and Imperial Oil Company, who was using Arrow, was on oil spill alert and began
arrangements for a salvage operation (Crowley, unknown). The crew members were then taken
off the ship (Green Island Lighthouse, unknown). The storm continued into the night and began to
lift 5 February morning (Green Island Lighthouse, unknown). Tugs were successful in attaching
lines to Arrow but could not free the ship from the rock (Green Island Lighthouse, unknown).
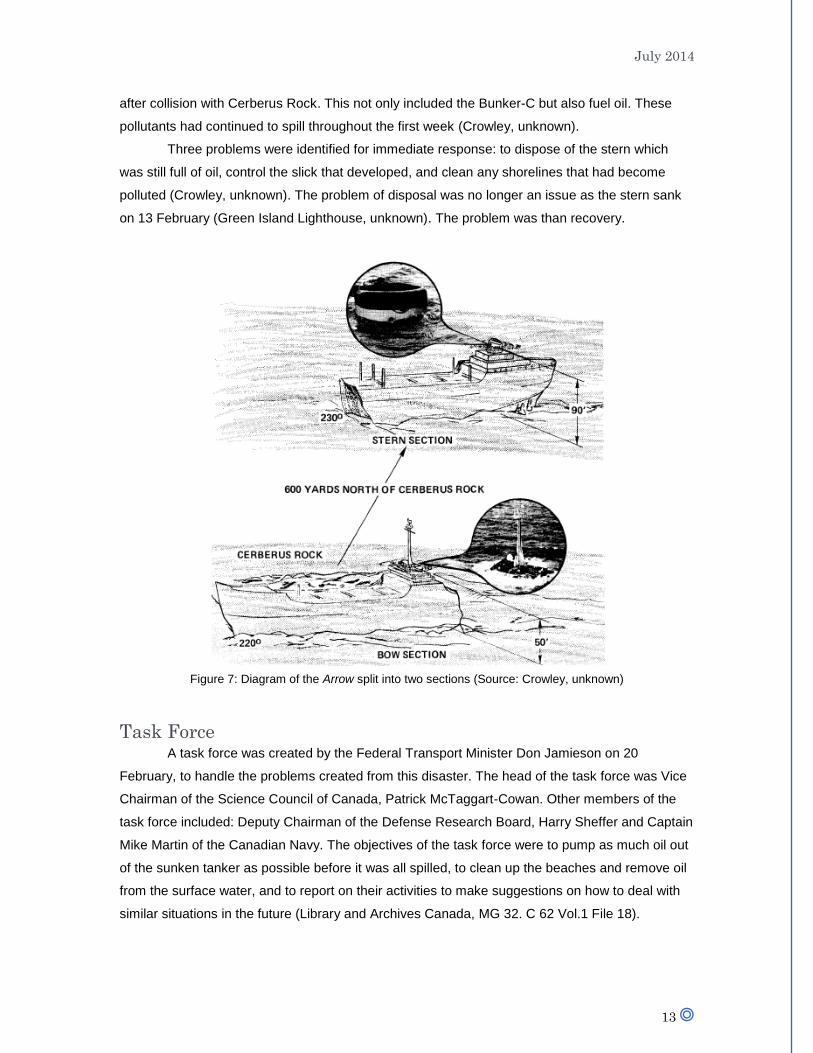
The damage caused by the storm and the sea took its toll on the ship as the deck plates
and side plating began to buckle within a few days resulting in the ship splitting into two sections
on 8 February, Figure 7. Divers surveyed the wreck and reported oil had escaped from cargo
tanks in both sections (Crowley, unknown).
This was not the first oil to be spilled during the accident. In total 2.5 million imperial
gallons of oil was spilled with reports stating the majority of that spilled within the first 24 hours
July 2014
13
after collision with Cerberus Rock. This not only included the Bunker-C but also fuel oil. These
pollutants had continued to spill throughout the first week (Crowley, unknown).
Three problems were identified for immediate response: to dispose of the stern which
was still full of oil, control the slick that developed, and clean any shorelines that had become
polluted (Crowley, unknown). The problem of disposal was no longer an issue as the stern sank
on 13 February (Green Island Lighthouse, unknown). The problem was than recovery.
Figure 7: Diagram of the Arrow split into two sections (Source: Crowley, unknown)
Task Force A task force was created by the Federal Transport Minister Don Jamieson on 20
February, to handle the problems created from this disaster. The head of the task force was Vice
Chairman of the Science Council of Canada, Patrick McTaggart-Cowan. Other members of the
task force included: Deputy Chairman of the Defense Research Board, Harry Sheffer and Captain
Mike Martin of the Canadian Navy. The objectives of the task force were to pump as much oil out
of the sunken tanker as possible before it was all spilled, to clean up the beaches and remove oil
from the surface water, and to report on their activities to make suggestions on how to deal with
similar situations in the future (Library and Archives Canada, MG 32. C 62 Vol.1 File 18).
July 2014
14
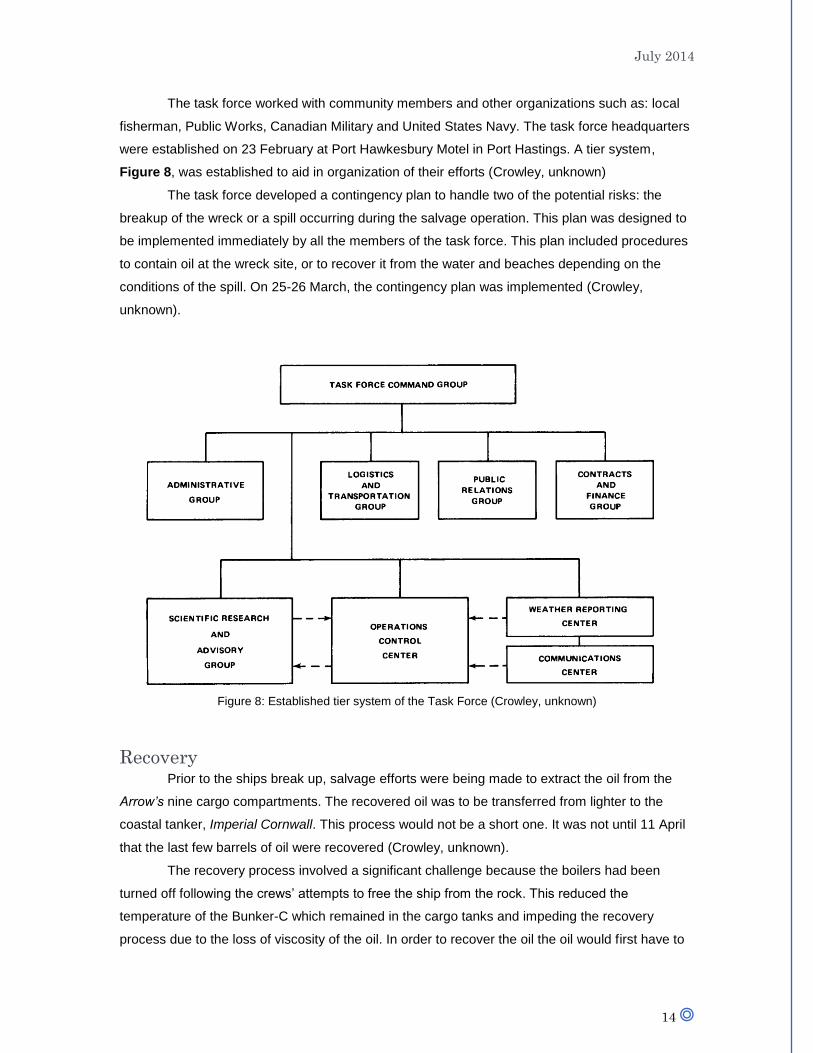
The task force worked with community members and other organizations such as: local
fisherman, Public Works, Canadian Military and United States Navy. The task force headquarters
were established on 23 February at Port Hawkesbury Motel in Port Hastings. A tier system,
Figure 8, was established to aid in organization of their efforts (Crowley, unknown)
The task force developed a contingency plan to handle two of the potential risks: the
breakup of the wreck or a spill occurring during the salvage operation. This plan was designed to
be implemented immediately by all the members of the task force. This plan included procedures
to contain oil at the wreck site, or to recover it from the water and beaches depending on the
conditions of the spill. On 25-26 March, the contingency plan was implemented (Crowley,
unknown).
Figure 8: Established tier system of the Task Force (Crowley, unknown)
Recovery Prior to the ships break up, salvage efforts were being made to extract the oil from the
Arrow’s nine cargo compartments. The recovered oil was to be transferred from lighter to the
coastal tanker, Imperial Cornwall. This process would not be a short one. It was not until 11 April
that the last few barrels of oil were recovered (Crowley, unknown).
The recovery process involved a significant challenge because the boilers had been
turned off following the crews’ attempts to free the ship from the rock. This reduced the
temperature of the Bunker-C which remained in the cargo tanks and impeding the recovery
process due to the loss of viscosity of the oil. In order to recover the oil the oil would first have to

July 2014
15
be heated to a temperature that would increase the viscosity to allow the oil to be somehow lifted
from the wreck (Crowley, unknown).
A precedent did not exist for the task force to refer to as oil had ever been recovered from
a sunken tanker before, in mid-February the solution found. The process decided upon was hot
tapping. This process had been used in oil refineries (Crowley, unknown)
Hot-tapping involved a rotary cutter, known as a “hot tap machine” when used in this
way. One of these machines was available in the area, as well as an operator. The RCN Diving
School conducted experiments to test if this machine could be used underwater. A steel plate
was successfully cut in 30 feet of water. This success demonstrated hot tapping was a viable
method to extract oil from the wreck (Crowley, unknown).
The application of this method required the cutting operation be conducted through a
gate valve attached to the deck above the cargo tank. The gate valve provided control over the
opening in the deck to prevent upward discharge of oil that could result from the difference in
pressure between Bunker-C and the sea water. The base of the gate valve sat on a spool piece
that was bolted to the tanker’s deck. A suction hose was connected to the gate valve with a 90o
elbow fitting after the drilling rig was removed (Crowley, unknown).
The divers carrying out this process faced challenges. The divers had to overcome near-
freezing temperatures and frequent storms. Another challenge faced was the oil seeping out of
the wreck. This oil affected their face masks, regulators and suits. Oil saturation would cause their
wetsuits to lose the insulating ability. These factors made following a routine schedule difficult as
modifications were required (Crowley, unknown).
The hot tap method required the oil to be lifted with pumping stations. These stations
were placed on the barge Irving Whale to help with the salvage operation. There was an
estimated 30,000 to 50,000 barrels of oil left in the Arrow’s tanks with the possibility of among 13
different tanks. It was determined 6 pumping stations aboard the barge were needed. The
equipment needed to fulfill 6 pumping stations was not available until 16 March; therefore from
13-16 March a partial capability pumping system was developed for the initial attempts. During
the peak of the salvage attempts, four pumps were operated simultaneously (Crowley, unknown).
The fully capable pumping system was built around two steam power plants. The fuel and
electricity from the barge were used to support the initial power plant. The following power plant
was more elaborate and had its own fuel and electrical supply. “Feed water was stored in the
barge’s peak tank and pumped to feed water tanks on deck that fed the two boilers. The boilers
supplied steam to reciprocating salvage pumps that were set up in pumping stations amidships.
The recovered oil was pumped directly into the [Irving Whale’s] cargo tanks”, Figure 9 (Crowley,
unknown).

July 2014
16
Figure 9: Schematic of the pumping system aboard Irving Whale (Source: Crowley, unknown)
Canadian innovation also came into play as a means to recover oil from the slick before
more oil could reach the shores. This resulted in the invention of the “Slick Licker”, this piece of
equipment “takes oil slicks from the surface of the water by way of an endless [conveyor] belt and
squeezes it into [drums]” (Library and Archives Canada, MG 32. C 62 Vol.1 File 18). Four slick

July 2014
17
lickers were extensively used in late March to pick up oil remnants close to the shore (Crowley,
unknown). Three were smaller portable machines and the fourth was a larger machine called the
“super” Slick Licker which was designed to be permanently mounted in a catamaran-like platform,
durable for use at sea, Figure 10 (Crowley, unknown).
Special steam washers were also developed to wash oil soaked equipment, as well as
special gravel and sand remover for beaches. Chemistry and physic studies of oil in salt water
were quickly completed by the Bedford Institute in the Maritimes and other universities to gain the
knowledge needed to develop this equipment (Library and Archives Canada, MG 32. C 62 Vol.1
File 18).
Despite the technology developed to recover oil spilled, much of the oil was able to be
recovered manually. Rakes and shovels were used during the tedious manual labour to collect oil
to be disposed of. Clay-based areas were selected as disposal sites because clay is impervious
to Buncker-C (Crowley, unknown).
Aerial spraying of dispersants was considered by the task force to aid in breaking up the
oil slick. In order to reduce risk of shoreline toxicity due to the chemical dispersants they were not
sprayed within 5 miles of shore. Biologists had objected to the use of dispersants because of the
toxicity. This was the same reason the decision was made not to sink oil in the bay area
(Crowley, unknown).
Burning the oil was also a technique attempted briefly but proved ineffective. Flame
throwers released nalpalm into straw covered oil in an attempt to ignite it. Ignition did not occur
(Crowley, unknown).

July 2014
18
Figure 10: (top) Slick licker recoverying Bunker C from a lagoon in Inhabitants Bay; (bottom) the Super slick
licker (Source: Crowley, unknown)
Oil Containment and Clean-Up It was estimated that 350 km of coastline received varying degrees of pollution (Owens
and Drapeau, 1973). The areas primarily affected were Petit-de-Grat, Arichat, Janvrin Island,
Inhabitants Bay and the beaches of Canso (Crowley, unknown). On 11 February, 40 miles per
hour winds shifted the movement of the oil from northeast to southeast (Green Island Lighthouse,
unknown). This caused the slick to blow back to the shore rather than out to sea. The stormy

July 2014
19
weather contributed not only to the breakup of the Arrow but also to the distribution of the oil on
the shore. The high waves that occurred during these storms pushed the oil further inshore than it
would have reached during calm waters (Owens and Drapeau, 1973).
The main method of containment was the placement of floating booms to enclose inlets
and coves where the oil had reached the beaches. This contained the oil from being blown back
out to sea to later settle in another area. Booms were also placed along harbour entrances, fish
plants and other critical areas of the region. Imperial Oil obtained the first set of booms at a
reported cost of $140,000. The Army later took over boom fabrication and placement as the
operation continued (Crowley, unknown).
Army engineers also determined fir trees were capable of absorbing more than 3 times
their own weight in Bunker-C. Brush booms made with oil drums and lined with spruce and fir
foliage were heavily used, Figure 11. Commercial booms that floated with buoys were used in
sheltered areas because waves and tidal currents can overcome them easily. Booms were not
used in open seas because the booms which are not easily damaged by the sea are expensive
and require elaborate construction (Crowley, unknown).
Figure 11: Brush boom between a jetty and a shoreline to trap oil (Source: Crowley, unknown)
Fir tree foliage was not the only natural material used in the clean-up process. Peat moss
was used as an absorbent, Figure 12. Large quantities were readily available and it was found to
be able to absorb 8 times its own weight. The peat moss obtained was placed on the Irving
Whale for contingency use. A dispersing machine was used to spread the plant material over the

July 2014
20
side of rubber boats to absorb oil from the slick. It was also used extensively ashore to make the
Bunker-C that had reached the coast manageable. Dry sawdust and straw were also used as
absorbents on these beaches (Crowley, unknown).
Figure 12: Peat Moss being spread on oil by RCN divers (Source: Crowley, unknown)
Causeways were constructed at four principal locations, Figure 13. The most elaborate
design was the design of two causeways across Lennox Passage (Crowley, unknown). This
causeway was constructed during the week of 13-20 February and used 22,000 tons of rockfill
(Green Island Lighthouse, unknown). The purpose of this causeway was to prevent ice entrapped
with oil from moving along the Cape Breton coast when the ice broke up in early spring (Crowley,
unknown). When completed it was 1800 feet in length and became a permanent installation
(Crowley, unknown). Studies during construction were completed as causeways can significantly
change the ecology of the area. Social considerations were also taken into account; it was found
the public had wanted a causeway in this area (Crowley, unknown).
Temporary causeways were also built, including: the construction of one on the south
side of the bay, west of Canso to block oil infiltration along a water to Canso Harbour; causeways
were installed near Janvrin Island and at a river inlet on Inhabitants Bay to block further infiltration
of the Bunker-C (Crowley, unknown).

July 2014
21
Figure 13: Map indicating where causeways were constructed and where booms were deployed (Source:
Crowley, unknown)
The contingency plan required fish nets to be used for new spills from the Arrow’s hulk. It
was thought fine mesh netting might be able to contain the oil long enough to allow for burning or
pumping to occur. The cost of the fish nets limited their use as general purpose containment
devices; for example nets used for herrings cost up to $25,000 (Crowley, unknown).
This caused concern for the fishermen of the bay area as it would impact their catch and
ultimately their livelihood. A solution was found based on a suggestion made by a citizen of Truro,
Nova Scotia who owns a dry cleaning business. The task force established a laundromat that
effectively cleaned the soiled fish nets. The laundromat was controlled by the Fisheries
Department and operated on a regular schedule. It was then used at the end of the salvage
operation to clean fouled mooring lines (Crowley, unknown).
Heavy Equipment Operations occurred during the shoreline clean-up. Piers and jetties
were cleaned with machines capable of dispensing steam and high pressure water. Commercial
pumping trucks used for cleaning septic tanks were used to pump the oil trapped by booms. The
July 2014
22
use of these methods was dependent on the accessibility of the area. This left large areas unable
to be reached. The cleaning of this area was to be done by natural process over a long period of
time (Crowley, unknown).
Outcomes The Arrow oil disaster brought the risk of marine transport of oil to Canadian shores.
Canadian innovations made during the recovery stages such as adapting the hot-tap method
succeeded in transferring 1.3 billion gallons of the 2 million gallons of Bunker-C to the salvage
barge. The development of the Slick Licker enabled waters close to shore to be cleaned and
several similar machines began to be designed by other organizations in different countries
(Library and Archives Canada, MG 32. C 62 Vol.1 File 18).
The accident brought emergency response and the impact of oil spills to Parliamentary
attention. MP Gordon H. Aiken (Parry Sound), visited Chedabucto Bay and Port Hawberbury on
15 April 1970. During the trip he noted that further research was required in the following areas:
low temperature chemistry of petroleum products, biological effects of ingesting the emulsion of
petroleum and water, and finding an oil dispersant that is non-toxic to fish. He also noted there
is a shortage of salvage operations on the East Coast. As well as the need for the Federal
Government to set up guidelines the provinces could carry out (Library and Archives Canada,
MG 32. C 62 Vol.1 File 18).
Aiken (1970) wrote the need to discuss regulations that should be considered. This
included installing emergency equipment above every compartment on tankers so that oil can
be easily pumped out. As well as regulations that oil should not be carried adjacent to the hull of
the ship to reduce risk in the event of the hull being broken or damaged as was the case with
the Arrow (Library and Archives Canada, MG 32. C 62 Vol.1 File 18).
The question was also raised by other politicians such as Guysborough MLA Angus
MacIsaac, St. John’s East MP James McGarth and federal opposition leader Robert Stanfield.
These individuals sought information and action to determine who is responsible. They wanted
policies and regulations put in place so this question could be answered in possible future
disasters (Green Island Lighthouse, unknown).
One result of the Arrow disaster was the development of the Regional Environmental
Emergencies Teams (REET). REET unites different agencies across different disciplines
specializing in environmental emergencies. This team is to provide consolidated and
coordinated environmental advice, information and assistance should an environmental
emergency occur. The establishment of REET as a responsibility of Environment Canada as it
was included in the Canada Shipping Act (Environment Canada, 2008).
Also, scientific research completed following the accident provided new information to the
scientific community in regards to the aftermath of oil spill disasters. For example, a study made
field observations during the 20 months that followed the accident to determine the effects of the

July 2014
23
natural cleaning process. It was found that there are four principal factors that control this
cleaning process: 1) physico-chemical characteristics of oil, 2) nature of polluted seashores, 3)
hydrodynamics of the environment and 4) climatic conditions prevailing when oil reached the
seashore.
Ecological studies explored the impact of sand and gravel removal during clean-up. Soil
profiles were created to demonstrate this impact, for example Owens and Drabeau (1973),
Drabeau (2011) and Owens (2011).
The impact on the shoreline resulted in birds dying at a rate of 90 per mile (Green Island
Lighthouse, unknown). There was also concern over the loss of marine life, particularly the fish
and lobsters as many people in this area relied on those industries for their livelihood (Green
Island Lighthouse, unknown). In July 1970, the task force director announced marine life below
tide were healthy and that fishing and lobstering would not impacted as those species were in
hibernation during the time of accident which helped to protect them (Crowley, unknown).
However, it was determined that 25% of the clams were killed in the early part of the season
because of the spill (Crowley, unknown).
KURDISTAN: OIL AND ICE
The Accident The 30,000 dwt, motor tanker Kurdistan left Port Tupper in Nova Scotia to go to Baie de
Sept-Iles, Quebec on 15 March 1979 (Center for Tankship Excellence, 1979). The tanker was
carrying 30,000 tonnes of Bunker-C fuel oil (Cedre, 2010). The conditions during this voyage
were not ideal as violent winds were suffered in ice-infested waters (Cedre, 2010). When the
tanker was 93 km north-east of Sydney, Nova Scotia, fractures began to occur below the water
line in one of the lateral tanks which held 10,000 tonnes of the cargo, and oil rapidly began to
escape (Cedre, 2010). It would later be determined these fractures were caused by a welding
defect that occurred during repair prior to the voyage and was aggravated by wave impacts on
the bow at the water’s low temperature (Center for Tankship Excellence, 1979).
The initial response by the CCG onboard Sir William Alexander instructed the
commanding officer of Kurdistan to slowly head towards the closest port, Sydney, Nova Scotia
(Cedre, 2010). However, this move was not completed as the tanker broke in two, spilling 7,000
tonnes of Bunker-C into largely ice covered waters of the Cabot Strait (Vandermeulen and
Buckley, 1985). CCG’s Sir William Alexander then began a rescue mission and evacuated the 41
crew on the stern section (Center for Tankship Excellence, 1979).
The Environmental Protection Service (EPS) immediately initiated Regional
Environmental Emergencies Teams (REET) with CCG acting as On-Scene-Commander (OSC).
July 2014
24
This team included representatives from: the Department of Fisheries and Oceans, Department
of Energy, Mines and Resources, Canadian Wildlife Services, Atmospheric Environment
Services, and the Environmental Protection Services of the Department of the Environment
(Duerden and Swiss, 1981).
Three clearly definable task were identified and REET was divided into three sections,
each one responsible for a different task: 1) the bow section which remained afloat with 7,000
tonnes of Bunker-C, 2) the stern section which contained 16,000 tonnes of Bunker-C and 3)
clean-up of oil already spilled (Cedre, 2010).
Two Halves of a Whole The Bow Section Advisory Group decided sinking was the best option following
considerations of possible extraction of the oil (Drueden and Swiss, 1981). It became their
responsibility to determine the appropriate disposal site; the selected location was chosen
45°55.02'N, 60°58.00'W (Drueden and Swiss, 1981). This location was selected based on the
following criteria: “it was located between two currents (the Gulf Stream and the Labrador
Current), the water was less than 4,755 m deep, not much birdlife was present, it was far from
fishing areas, and it was far from the shoreline of Nova Scotia and Sable Island reducing the
probability of contamination of these shores in the event of a subsequent spill” (Cedre, 2010).
On 1 April, the bow was towed to this location and scuttled with gunfire from the HMSC
Maragree, Figure 14 (Center for Tankship Excellence, 1979). Dr. D. McKeown, from the Bedford
Institute of Oceanography, was onboard Maragree during the sinking operation and arranged for
a radiotransponder and other tracking equipment to be placed on the bow section of Kurdistan as
an attempt to keep contact with the bow to its final sunken position (Vandermeulen and Buckley,
1985).
Prior to the scuttling, concerns were expressed over the possibility of oil slicks being
created from the bow. To address these concerns, slick trajectories were calculated by Dr. D.
Lawrence, AOL, with P. Galbraith from Atmospheric Environment Services who used existing and
modified computer programs. It was determined that the likelihood of these slicks reaching the
Nova Scotia shoreline or the inshore waters was very small based on specially developed wind-
file data (Vandermeulen and Buckley, 1985).

July 2014
25
Figure 14: Sinking of the bow section of Kurdistan (Source: Maritime Museum of the Atlantic, unknown)
The Stern Advisory Group was created to provide advice to the OSC to determine the
best course of action in regards to the stern. On 18 March, following onboard investigations by
salvage experts, it was decided the stern was salvageable. Following further investigation to
determine where the stern would be towed, the Advisory Group recommended Port Hawkesbury,
Table 1, to recover the remaining oil. This operation occurred during 28-30 March (Drueden and
Swiss, 1981).

July 2014
26
(Source: Drueden and Swiss, 1981)
Continuous Clean-Up The oil slick that developed was unique. The oil was blocked from immediately reaching
the shores due to an ice barrier in the water. This barrier provided the response teams enough
buffer time to find solutions for the bow and the stern before making clean-up a top priority
(Cedre, 2010). However, the oil was spilled into ice infested waters creating interaction not seen
before and making the oil more difficult to track.
Initial helicopter reconnaissance flights began on 23 March (Vandermuelen and Buckley,
1985). The first oil mixtures were also seen 23 March and moved northwest during the next two
days at a rate of 8 to 10 miles per day with oil first reaching the shore on 28 March (Center for
Tankship Excellence, 1979).
To better track the slick, an airplane with specially fitted remote-sensing devices
developed through Environment Canada’s Arctic and Marine Oilspill Program (AMOP) were used
(Drueden and Swiss, 1981). AMOP was created in March 1978 to develop a knowledge base of
technology used to handle oil spills in the arctic and marine environment (Environment Canada,
2014). “This aircraft operated in cooperation with the Center for Cold Ocean Resources
Engineering at Memorial University in Newfoundland and the Canada Centre for Remote
Sensing” (Drueden and Swiss, 1981). These images were used to predict the slicks trajectories
as a way to protect the currently unaffected areas in the oil slick’s path (Vandermeulen and
Buckley, 1985).

July 2014
27
Challenges arose while using this technology to track the slick. It was often difficult to see
the oil in the aerial photos obtained as both water and oil appeared black (Cedre, 2010). To make
it more difficult the oil would often be below the surface level of the water (Drueden and Swiss,
1981). This also made it difficult for fisheries officers and park wardens who were asked to report
any floating oil they saw (Drueden and Swiss, 1981).
As time passed, the ice began to melt which brought more oil to shores along the coast. It
was planned to clean-up the oil from the ice before it reached shore; to do this a barge was towed
to areas of oil in ice and attempts were made to scoop the oil from the water. This was partially
successful, but the oil had spread to a large area that it was not effective. One report even stated
that some oil from the Kurdistan had settled on top of oil spilled during the Arrow disaster
(Cleaves, 1979).
Onshore clean-up had to begin. Clean-up crews were using rakes, shovels, and
pitchforks to remove oil. The viscosity of the oil in the cold temperatures made it easily removable
and put into plastic bags for disposal. The EPS also provided environmental information on beach
clean-up and protection methods to crew members. These reports were based on existing maps,
charts, aerial photographs and other relevant information available (Vandermeulen and Buckley,
1985). Areas were also given priorities based on environmental importance and offshore islands
needed special attention, Figure 15 (Drueden and Swiss, 1981).
Clean-up and communication centres were established at Low Point and Mulgrave, Nova
Scotia as a way to coordinate the environmental aspects of the clean-up, equipment, crews and
provided a base for helicopters that participated in surveillance. However, as the summer
continued and the oil spread south-east along the coast, a centre was established in Halifax with
representatives from Low Point and Mulgrave to answer requests for environmental advice. This
communication network allowed for information to be spread throughout the region to the
onscene environmental coordinator (Drueden and Swiss, 1981).
Over 550 miles of coastline were cleaned following the spill resulting in almost 1,500
barrels of oily debris, Figure 16. In the beginning, the waste was disposed of at municipal
landfills but once more and more waste was accumulated an alternative solution had to be found
as municipalities voiced their concerns. Hadleyville, Forchu and St. Peter’s on Cape Breton Island
were chosen because of their accessibility, soil characteristics, ground-water levels, and proximity
to clean-up locations. These sites were then landscaped following Nova Scotia Department of
Lands and Forests (Drueden and Swiss, 1981).

July 2014
28
Figure 15: Environmental sensitivity determined along the Nova Scotia shoreline (Source: Drueden and
Swiss, 1981)
Figure 16: Collected oiled debris in 45 gallon drums along Big Glace Bay Lake (Source: Vandermeulen and
Buckley, 1985)
July 2014
29
Similarly to the Arrow disaster fish nets were oiled during the spill. A laundromat was
again established as a means to clean the nets (Cedre, 2010). This solution was once again
successful; almost 100 nets were cleaned as well as clean-up equipment such as booms
(Drueden and Swiss, 1979).
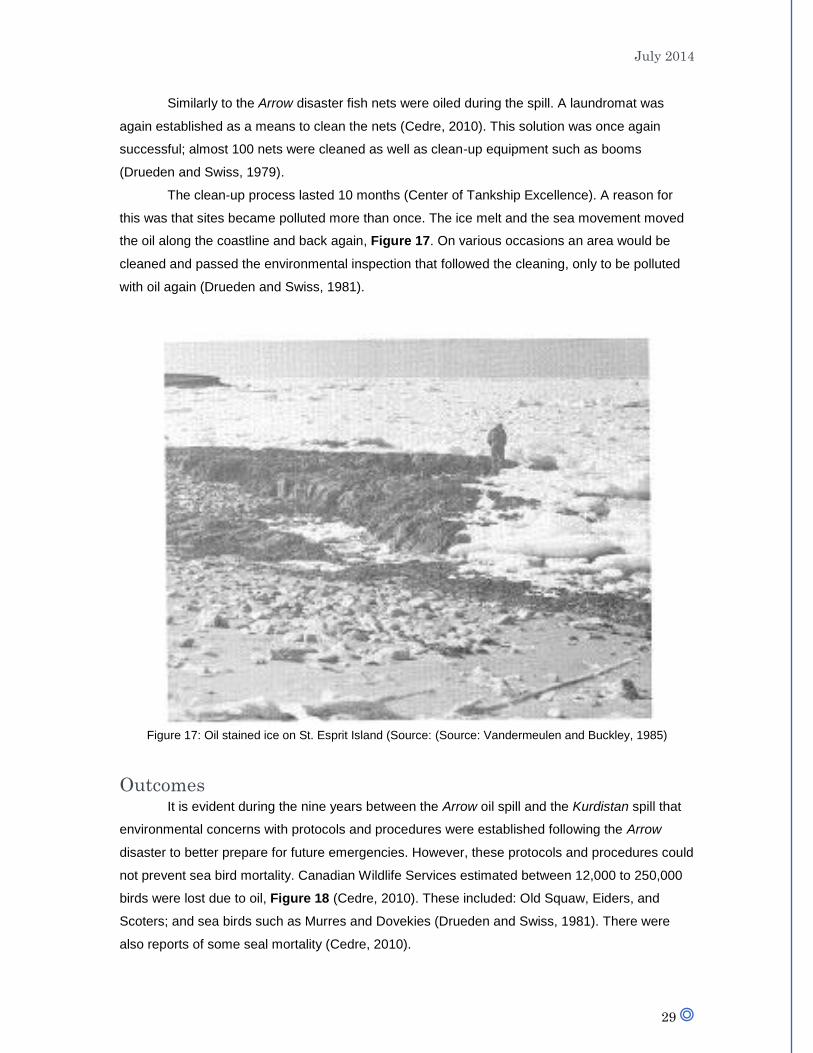
The clean-up process lasted 10 months (Center of Tankship Excellence). A reason for
this was that sites became polluted more than once. The ice melt and the sea movement moved
the oil along the coastline and back again, Figure 17. On various occasions an area would be
cleaned and passed the environmental inspection that followed the cleaning, only to be polluted
with oil again (Drueden and Swiss, 1981).
Figure 17: Oil stained ice on St. Esprit Island (Source: (Source: Vandermeulen and Buckley, 1985)
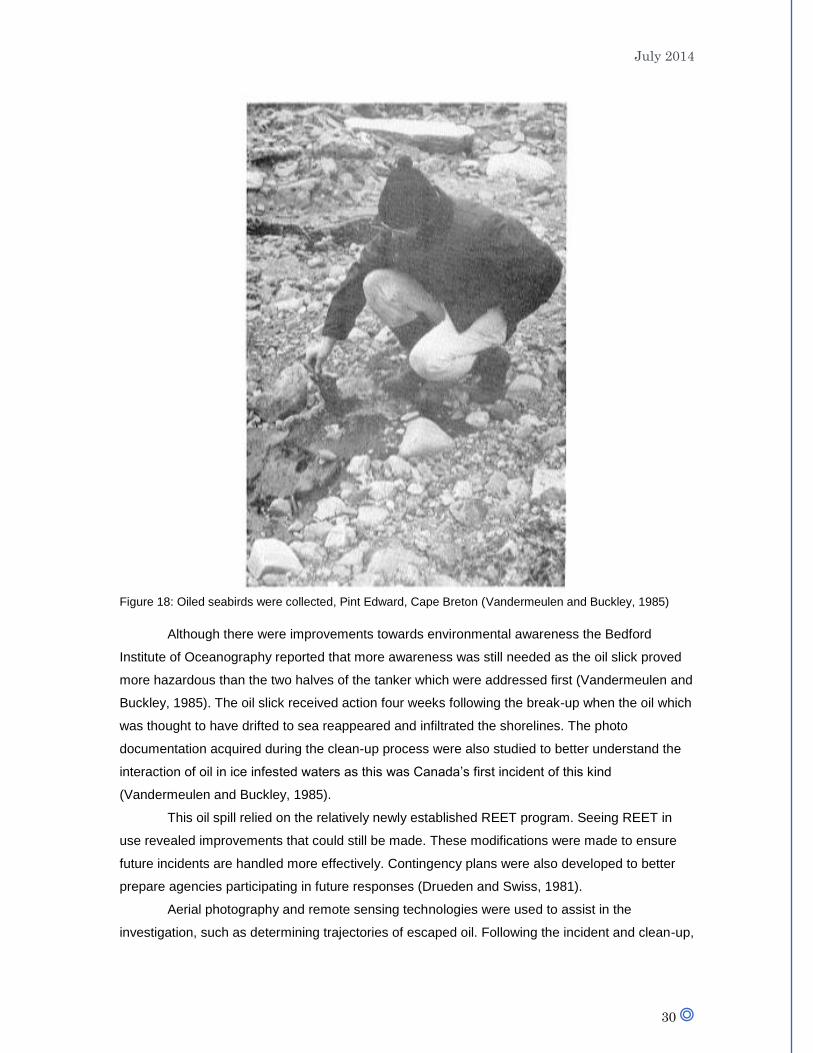
Outcomes It is evident during the nine years between the Arrow oil spill and the Kurdistan spill that
environmental concerns with protocols and procedures were established following the Arrow
disaster to better prepare for future emergencies. However, these protocols and procedures could
not prevent sea bird mortality. Canadian Wildlife Services estimated between 12,000 to 250,000
birds were lost due to oil, Figure 18 (Cedre, 2010). These included: Old Squaw, Eiders, and
Scoters; and sea birds such as Murres and Dovekies (Drueden and Swiss, 1981). There were
also reports of some seal mortality (Cedre, 2010).
July 2014
30
Figure 18: Oiled seabirds were collected, Pint Edward, Cape Breton (Vandermeulen and Buckley, 1985)
Although there were improvements towards environmental awareness the Bedford
Institute of Oceanography reported that more awareness was still needed as the oil slick proved
more hazardous than the two halves of the tanker which were addressed first (Vandermeulen and
Buckley, 1985). The oil slick received action four weeks following the break-up when the oil which
was thought to have drifted to sea reappeared and infiltrated the shorelines. The photo
documentation acquired during the clean-up process were also studied to better understand the
interaction of oil in ice infested waters as this was Canada’s first incident of this kind
(Vandermeulen and Buckley, 1985).
This oil spill relied on the relatively newly established REET program. Seeing REET in
use revealed improvements that could still be made. These modifications were made to ensure
future incidents are handled more effectively. Contingency plans were also developed to better
prepare agencies participating in future responses (Drueden and Swiss, 1981).
Aerial photography and remote sensing technologies were used to assist in the
investigation, such as determining trajectories of escaped oil. Following the incident and clean-up,

July 2014
31
the Bedford Institute of Technology recommended these technologies be used to locate and
monitor the oil immediately following the incident, which did not occur with Kurdistan
(Vandermeulen and Buckley, 1985). These efforts needed to be included in the contingency plans
as it would involve more overflight time and development of remote sensing technologies
(Vandermeulen and Buckley, 1985). In November 1995, Canada launched RADARSAT which is
used to monitor environmental emergencies including oil spills (Canadian Space Agency, 2014).
NESTUCCA: A FORESHADOWING EVENT
The Accident In the early morning of 23 December 1988 the tug Ocean Services collided with its tow,
the tanker barge Nestucca after the barge broke loose (Ministry of Environment, unknown). This
accident occurred approximately 3 km off the coast of Washington State near Gray’s Harbour,
Figure 19 (Ministry of Environment, unknown). Nestucca was towed 40 km off the mouth of the
Columbia River where temporary repairs were made (Library and Archives Canada, 1989).
Nestucca was carrying 11 million litres of N0. 6 fuel oil; the collision resulted in 875,000
litres spilled along the Washington coast. The oil spread northwards, and first reported on the
southwest coast of Vancouver Island, British Columbia on 31 December, 175 km from the
collision location (Owens, 1991). Reports of oil on Vancouver Island continued to be made during
the following three weeks at sporadic locations over 500 km of coastline (Owens, 1991).

July 2014
32
Figure 19: Location of the Nestucca accident, near Gray’s Harbour Washington (Source: Ministry of
Environment, unknown)
Clean-Up To understand the extent of affected shorelines a Shoreline Evaluation Team (SET) was
established and based at Ucluelet Coast Guard command centre. Their responsibility was to
conduct shoreline surveys, evaluate the degree of oiling, and recommend appropriate clean-up
methods. Representatives were present from On-Scene-Command, REET and the Nuu-Chah-
Hulth Tribal Council (NTC), Figure 20. To maintain consistency in reports the same team was
kept together (Owens, 1991).
The initial area focused on was the coast between Ucluelet and Pacific Rim National
Park, and Tofino. These areas were accessible by road. However, as the oil spread a second
SET was established, based in Port Hardy, to focus on the north-west and north coasts of
Vancouver Island (Owens, 1991).
The winter weather conditions created challenges for these teams as well as the complex
shoreline configuration and lack of road access. To survey the oil patches in inaccessible areas
SET relied on helicopter overflights. Ground surveys were completed by a boat-based Shoreline
Surveillance Team (SST) to provide information on the inhabited and more accessible areas of

July 2014
33
southwest Vancouver Island (Owens, 1991). However, the availability of fuel sources for both air
and sea vessels was a limiting factor in the operation (Owens, 1991).
Figure 20: Organization of the environmental emergency response (Source: Owens, 1991)
Oil tracking and reconnaissance occurred on a regular basis. The Department of
Fisheries and Oceans’ Institute of Ocean Sciences (IOS) provided morning and evening trajectory
projections gathered through the AES Marine Desk at their Vancouver headquarters. These
projections aided in the reconnaissance completed in the field to set the daily priorities and
agendas for the crews to follow (Library and Archives Canada, 1989).
The distribution of oil was extremely patchy and varied from site to site. The command
centre would often receive reports from volunteers or individuals from the area that were
incomplete, with phrases such as “little oil” or “truckloads of oil”. This made the development of a
clean-up strategy challenging as individuals had different perspectives. To improve the
communication between these individuals and SET, categorization classes were developed to
describe the oil found ashore, Table 2 (Owens, 1991).

July 2014
34
Table 2: Shoreline oil classification used for Nestucca response (Source: Owens, 1991)
Containment was not attempted during the response. Booms were determined to not be
effective in the areas contaminated due to high seas and current velocities. Since booms were
not used as a method of containment, recovery techniques such as skimmers also were not used
(Library and Archives Canada, R12730-0-X-E Vol.15 File 5).
There were three instances where environmental protection was considered. The first
was the re-oiling of beaches which was predicted to occur on 11 January 1989 and was observed
the next day. It was considered to leave the oil to reduce the cost of having to re-clean the
shorelines, but this was decided against and as much oil as possible was removed. The second
was when the spill trajectory predicted oil slicks were moving towards Bunsby Islands. This area
was an Ecological Reserve. The protective measures considered were chemical dispersants or
sinking agents, but these measures would have been ineffective to oil that had been weathered
by the sea for three weeks, no preventative measures were taken. The third was consideration on
how to protect the wintering waterfowl at Cape Scott; the potential use of booms was determined
to be ineffective (Library and Archives Canada, R12730-0-X-E Vol.15 File 5).

July 2014
35
Since no preventative measures were taken, the focus remained on clean-up.
Conventional manual methods were used to remove oil from sand and gravel beaches, Figure
21. Oil was raked into plastic bags and taken to temporary storage (Library and Archives Canada,
R12730-0-X-E Vol.15 File 5). Oil was also scrapped off of boulders and beach logs. Petromesh,
oil snares and oil absorbing pom-poms were also used to scrape and absorb oil from boulders
and cobbles (National Oceanic and Atmospheric Administration, 1992). Construction equipment,
such as backhoes, was used to remove oil from accessible beaches (Library and Archives
Canada, 1989). All the oil and oil-contaminated debris was stored in steel containers and shipped
to the Ladysmith incinerator for burning (Library and Archives Canada, R12730-0-X-E Vol.15 File
5). Clean-up was completed on 22 March 1989 (Library and Archives Canada, R12730-0-X-E
Vol.15 File 5).
Figure 21: Shoreline clean-up using convention methods (Source: Ministry of Environment, unknown)
Outcomes The environmental impacts of this oil spill lead to the mortality of 56,000 seabirds, many
crab and shellfish populations were oiled as well as herring spawning areas (Ministry of
Environment, unknown). The polluted shoreline also affected traditional native fishing practices
(Ministry of Environment, unknown). In 1995, the U.S. Fish and Wildlife Service and Western
Washington Fish and Wildlife Office developed a Restoration Plan for the affected areas. In 2004,
the Final Plan was completed (U.S. Fish and Wildlife Services and Western Washington Fish and
Wildlife Office, 2004).
July 2014
36
An article published in the Vancouver Sun on 23 January 1989 discussed the accident
and how it demonstrated the risk posed to the British Columbia coastline from the oil transport
traffic on route from Alaska to Washington. Anderson (1989) argued that the safest times of oil
transport were in the past, especially with the increased frequency of use in this route.
Anderson (1989) not only suggested accepting the economic cost it would take to reduce
the risk but to also improve the response to spills through better coordination of federal and
provincial governments. It is also recommended that research which began in the 1970s be
resumed since it came to a standstill during the 1980s (Library and Archives Canada, R12730-0-
X-E Vol. 18 File 28).
It is difficult to distinguish any significant outcomes from the Nestucca spill alone. Two
days after clean-up was complete on the Vancouver Island shorelines a more catastrophic event
occurred in Alaska. The close timing of these two spills created changes that reference both
disasters as the inciting incident. These outcomes will be discussed in the following section.
EXXON VALDEZ: A PRISTINE CATASTROPHE
The Accident On 24 March 1989 a catastrophic spill occurred in Prince William Sound, Alaska. The
supertanker Exxon Valdez ran aground after colliding with an easily avoidable hazard, Bligh Reef.
At 9:12 pm on 23 March the Exxon Shipping Company’s tanker left the Alyeska Pipeline Terminal
carrying 53,094,510 gallons of crude oil with no problems suspected. This disaster demonstrated
the breakdown of safety and prevention in marine transport systems (Alaska Oil Spill
Commission, 1990).
Investigations were completed following the disaster; two of these investigations were:
The National Transportation Safety Board Marine Accident Report (1990) and the Alaska Oil Spill
Commission’s Final Report (1990). These reports included a detailed timeline discussing all the
events that occurred aboard Exxon Valdez leading up to and following the grounding. The details
provided in these reports were extensive. The following provides a summary of the accident.
The vessel was piloted by expert pilot, William Murphy, who was to manoeuvre the 986-
foot vessel through the Valdez Narrows. He was in control of the wheelhouse with Captain Joe
Hazelwood beside him and Helmsman Harry Claar was steering. Following the passage through
Valdez Narrows, Murphy left the vessel and Hazelwood took over at the wheelhouse
(Encyclopaedia of Earth, 2013).
The shipping lanes contained icebergs and Hazelwood ordered Claar to take Exxon
Valdez out of the shipping lanes to avoid the ice, Figure 22. Control was then handed to Third
Mate Gregory Cousins with order to turn back into the shipping lanes when the vessel had

July 2014
37
reached a certain point. At this time Helmsman Robert Kagan replaced Claar. Cousins and
Kagan failed to return to the shipping lanes and hit Bligh Reef at 12:04 am on 24 March. At this
time Hazelwood was in his quarters (Encyclopaedia of the Earth, 2013).
Figure 22: Valdez tanker shipping lanes (Source: Alaska Oil Spill Commission, 1990).
The National Transportation Safety Board investigation concluded there were 5 probable
causes of the grounding: “1) The third mate failed to properly manoeuvre the vessel, possibly due
to fatigue and excessive workload; 2) the master failed to provide a proper navigation watch,
possibly due to impairment from alcohol; 3) Exxon Shipping Company failed to supervise the
master and provide a rested and sufficient crew for the Exxon Valdez; 4) the U.S. Coast Guard
failed to provide an effective vessel traffic system; and 5) effective pilot and escort services were
lacking” (Encyclopaedia of Earth, 2013).

July 2014
38
Human Error At 7:48 pm on 23 March, the Third Mate completed the required testing of “the steering
system, navigation lights, whistle and engine order telegraph and ensured that the following
equipment was operating properly: compasses, course recorder, radars, radios, fathometers and
speed logs. The oil containment book was still in place encircling the vessel, making it unsafe to
turn the propeller. All equipment tests were found to be operating properly” (National
Transportation Safety Board, 1990), this left the actions of the crew to be examined.
The actions of Captain Hazelwood on 23 March 1989 would become public knowledge
during the course of a state criminal prosecution and created a media sensation once it was
determined the cause of the disaster was not due to faulty navigational equipment (Alaska Oil
Spill Commission, 1990).
On the night of 22 March, Exxon Valdez reached the port in Valdez and the following day,
Hazelwood conducted the regular requirements of ship business, according to testimony, at lunch
he drank non-alcoholic beverages with the other officers, but later in the afternoon he began to
drink alcoholic beverages while relaxing in a Valdez bar. Testimony then was given by the taxi
driver and gate security guard who stated no one in the party appeared intoxicated. However, a
ship’s agent who met with Hazelwood following his return to the ship said it appeared Hazelwood
“may have been drinking because his eyes were watery,” but she could not smell alcohol on his
breath. The ship’s pilot, Murphy, later said he could smell the odor on Hazelwood’s breath
(Alaska Oil Spill Commission, 1990).
Hazelwood’s behaviour was not just used as a means to explain the Exxon Valdez oil
spill but also demonstrate the complacency within the shipping industry. Oversights were being
made on the progress previously achieved in ship safety following other disasters around the
world (Alaska Oil Spill Commission, 1990).
The Exxon Shipping Co. (ESC) contributed to the disaster by not adhering to the
established company policy. ESC Policy states that “employees who acknowledge their own
dependency and are willing to undergo rehab will be offered the opportunity to do so free of fear
of Company sanction”, it continues to state “if an employee request for rehab is made after the
discovery of a violation of the Policy, the Company may take disciplinary action, including
termination.” Yet, there was no evidence that Hazelwood sought Company assistance and
entered rehab secretly and then the Company discovered the situation (Library and Archives
Canada, R12730-0-X-E. Vol 15 File 11).
Rather than following the protocols established in the Policy, ESC devised a new system
which allowed Hazelwood to continue working. Hazelwood would participate in Alcoholics
Anonymous as well as be subject to a supervisory system which included scheduled meetings
with Hazelwood by two supervisors. These meetings occurred while Hazelwood was in the lower
forty-eight states and no attempts were made to visit him while he was aboard Exxon Valdez. The

July 2014
39
supervisors also did not attempt to verify Hazelwood was not drinking during the six months he
was off-duty. Hazelwood was only observed for 12 days out of the year. The system was to also
include random searches and medical evaluation, but these were never done (Library and
Archives Canada R12730-0-X-E. Vol 15 File 11).
These failures indicated the culpability of shipping companies. It was ESC’s responsibility
to ensure a Master of an oil tanker is fit to operate such a vessel. This is where ESC failed the
State of Alaska and its citizens, by not following the policy The Company created (Library and
Archives Canada, R12730-0-X-E. Vol 15 File 11).
Also, in 1984 ESC successfully reduced vessel manning standards by noting “other
ships, mostly foreign flag ships, have successfully operated at such low levels”. Further crew
reductions had subsequently been made to the US federal government. However, little was
mentioned about ship safety or crew fatigue as a result of reduced crew members. Crew
reductions were done as a means to reduce cost. The Exxon Valdez was required to have 14
officers and crew, excluding stewards. A radioman and two stewards and two oilers were also
onboard (Library and Archives Canada R12730-0-X-E. Vol 15 File 11). This is opposed to crews
of 40-42, in the 1950s who worked on tankers carrying 6.3 million gallons of oil (Alaska Oil Spill
Commission, 1990). The argument was that new technologies allowed for fewer crew members to
be needed (Alaska Commission Report, 1990).
Contingency Plan Confusion Preventative measures were not the only measures which had broken down, so to had
response measures. 10.8 million gallons of crude oil began to enter Prince William Sound and it
appeared ever party involved was unprepared as the oil spread to approximately 1,244 miles of
Alaskan coastline (Alaska Oil Spill Commission, 1990).
Confusion began to surface in the early stages of the clean-up response. There is a
requirement in Alaska that oil terminal facilities and tank vessels have a State-approved oil
discharge contingency plan; the approval process being a responsibility of The Alaska
Department of Environmental Conservation and the plan is reviewed every three years. Alyeska
Pipeline Service Company acted as an agent for seven Owner Companies, including Exxon
Pipeline Company, however ESC was not included. Alyeska did have a contingency plan
approved by The State (Library and Archives Canada, R12730-0-X-E, Vol. 16 File 4).
This plan provided the details of oil containment and clean-up procedures, coordination
efforts of the clean-up and a communication plan, clean-up equipment required, procedure of
chemical use in the clean-up process and detailed response and clean-up times in Prince William
Sound as well as sensitive areas to be protected. However, the financial costs of utilizing this plan
was not transparent, nor were the terms of access to the equipment listed, in some cases it would
have been impractical for some of the companies who this plan is an agent for to actually use
(Library and Archives Canada, R12730-0-X-E, Vol. 16 File 4).
July 2014
40
The president of ESC testified that Exxon implemented its own plan and assumed
Alyseka’s clean-up responsibilities on 25 March 1989. However, the Alyeska plan did not have
any indication that ESC would be able to assume the responsibilities and that Alyeska would
maintain “full responsibility and control in the event of an oil spill unless relieved of its duties by a
government agency.” This meant that the ESC efforts to mobilize equipment, material and
manpower were not compliant to a state approved contingency plan (Library and Archives
Canada, R12730-0-X-E, Vol. 16 File 4).
Oil Movement The majority of the 11 million gallons of oil was spilled within the first 6 hours of Exxon
Valdez’s grounding. The initial movement of the oil from the point of origin was in a southwest
direction. The first two days of the disaster found the oil largely concentrated in a patch near Bligh
Island. However a storm generated winds of 70 mph in William Sound on 26 March and
weathered most of the oil. This changed the oil into a mousse and tarballs spreading it over a
large area. Within the next four days, the oil extended 90 miles from the spill site. The oil slick
would extend to over 470 miles southwest of the Chignik village on the Alaska Peninsula, Figure
23 (Encyclopedia of Earth, 2013).
The oil was also impacted by the spring tidal fluctuations of almost 18 feet. This meant oil
was deposited onto shorelines above the normal zone of wave actions. Also, the shorelines
affected were diverse in composition; this lead to a variety of oiling conditions. For example,
access for clean-up was difficult when oil was present on sheer rock faces, or rocky beaches with
grain size ranging from coarse sand to boulders allowing oil to penetrate to a sub-surface level.
Both sheltered and exposed shorelines were affected. And once oil reached a shoreline, it could
be floated off during the next high tide, carried to and landed in a different location. This
movement made tracking the oil movement and impact on shorelines difficult. By mid-summer
1989, the oil migration ceased, leaving the clean-up of shorelines to be completed. These
operations also occurred during the summer months of 1990 and 1991 (Encyclopedia of Earth,
2013).

July 2014
41
Figure 23: Blue area represents the spread of the oil, over 470 miles (Source: Encyclopedia of Earth, 2013)
Clean-Up Immediately following the collision, the Alyeska Pipeline Service Company was notified
and a tug was sent to help in the stabilization of the tanker and their oil spill response barge did
not arrive at the scene until 3:00 pm on 24 March as it was out of service to be re-outfitted. The
magnitude of the spill had overwhelmed Alyeska. On 25 March, Exxon took over full responsibility
for the spill and clean-up effort (Encyclopedia of Earth, 2013).
A boom was deployed around the tanker within 35 hours of the grounding and Exxon
conducted successful testing of dispersant on 25 and 26 March. Permission was granted to apply
the dispersants after five dispersant trails took place. However, the Regional Response Team
(RRT) determined they would no longer that with the storm that occurred dispersants were no
longer practical (Encyclopedia of Earth, 2013).
A test of in-situ burning of oil was done on 25 March. A 3M Fire Boom towed behind two
fishing vessels collected 15,000 to 30,000 gallons of oil and was ignited. The burn lasted 75
minutes and reduced the oil to about 300 gallons of residue which could be collected more easily.
July 2014
42
Similar to the use of dispersants, burns were no longer effective following the storm
(Encyclopedia of Earth, 2013).
It was estimated that a total of 100 miles of booms were deployed during the peak of the
containment efforts. There are a variety of booms available on the market and almost all varieties
were used in these efforts. RRT determined which areas were given highest priority for protection
including fish hatcheries and salmon streams. Areas protected by booms included: five fish
hatcheries in Prince William Sound, two in the Gulf of Alaska. Sawmill Bay hatchery in Prince
William Sound had the largest amount of boom deployed (Encyclopedia of Earth, 2013).
Problems began to arise with the booms used. The size of the spill required
inexperienced volunteers to be relied on to deploy and tend to booms, booms would then be
incorrectly used or handled. Booms would sink due to improper deployment, infrequent tending,
or leakage. Other problems included: fabric tears from debris, tears at anchorage points from
waves, if during boom recovery were lifted by ballast chain the boom could be torn (Encyclopedia
of Earth, 2013).
Skimmers were the primary method for oil recovery, Figure 24. The Marco sorbent lifting-
belt skimmers supplied by the U.S. Navy were most frequently used. There were difficulties off-
loading the oil, therefore other vacuum equipment was required to unload the collected oil.
Generally, Marco skimmers were not used close to the shoreline. To clean-up this area, the
paddle belt and rope mop skimmers were used. Most skimmers became less useful as the oil
spread, emulsified and mixed with debris.
To locate where use of booms and skimmers were needed, aerial surveillance was used
to track the oil. Visual overflight observations were done as well as ultraviolet/infrared (UV/IR)
surveys conducted by the United States Coast Guard and Exxon. Satellite imagery was
attempted as a method to track oil. However, it was not effective because satellite pass over
Prince William Sound infrequently, every 7 to 8 days, as well as because of the cloud cover and
long turnaround time for the results (Encyclopedia of Earth, 2013).

July 2014
43
Figure 24: An oil skimmer near Latouche Island on 1 April 1989 (Source: NBC News, 2009)
Typically, sorbents were not used in the clean-up process because they are labour
intensive and created additional waste. However sorbent booms were used to collect oil between
the primary and secondary layers of offshore boom as well as oil released from the beach when
tidal flooding occurred. These booms were made of rolled pads which were more useful than
other booms made of individual particles because they absorbed less water and did not break
into small particles if they fell apart (Encyclopedia of Earth, 2013)
Due to lack of storage space for recovered oil, water was decanted from skimmers or
tanks into a boomed area before it was off-loaded. This made the remaining oil difficult to off-load.
This process took 6 to 8 hours. To complete the transfer of oil, grain pumps were the most
successful (Encyclopedia of Earth, 2013).
Biological remediation (bioremediation) was another clean-up technique tested. The RRT
approved this method based on research from the Environmental Protection Agency (EPA).
Bioremediation was applied to 5800 yards of shoreline on Green and Seal Islands in Prince
William Sound during the summer of 1989 (Environmental Protection Agency, 2014).
Bioremediation is the addition of fertilizers to enhance the growth of bacterial naturally
occurring in the environment, which degrade certain toxic hydrocarbons in oil. The applications of
fertilizers increase the availability of nitrogen and phosphorus for bacteria to utilize the
hydrocarbons as a food source. The EPA recommended the use of fast and slow release
fertilizers. As well as monitor the total hexane-extractable hydrocarbons in the water column,
nitrogen and phosphorous nutrient, plankton chlorophyll, total aromatic hydrocarbons
July 2014
44
bioaccumulated in mussels, and water same toxicity using a standard effluent toxicity test
program. If any of those parameters demonstrated adverse environmental effects the application
of the fertilizer was to be terminated (Environmental Protection Agency, 2014).
Cameras were used to observe the bioremediation process in the experimental plots. An
observable difference was seen. One observer stated “within two weeks it really cleaned the rock
off. It looked like someone brought in a new rock” (Library and Archives Canada, R12730-0-X-E
18-27).
International News Media attention surrounded every aspect of this disaster. This disaster was viewed
globally as destruction of one of the world’s last natural wonders. Exxon was not the only
company to receive criticism, it was extended to Alyeska Pipeline service Company, United
States Coast Guard, the Alaska Department of Environmental Conservation (DEC) and “Big Oil”.
Demonstrations, gasoline boycotts, shareholder protests, congressional hearings and criminal
indictments all occurred. Top executives at Exxon had to manage a public relations nightmare
over the summer and hundreds of volunteers from not just America, but from across the world
flocked to Alaska who tried to save oiled wildlife (Alaska Oil Spill Commission, 1990).
Canadian news outlets covered this disaster extensively, including editorial cartoons,
Figures 25-27. Anderson (1989) wrote an article in the Global and Mail which discussed how a
few months prior another spill occurred which reached Canadian shorelines. This article called for
action to be taken and for prevention to be considered before another disaster occurs. The article
also notes that technological advances such as radar, echo soundings, radio signals and
satellites have the ability to pin point a ship’s location. Technology had become so sophisticated
that it can also pin point a person’s location on such a large tanker. It is argued that with these
advances disasters such as Exxon Valdez should not occur (Library and Archives Canada,
R12730-0-X-E Vol. 18 File 28).

July 2014
45
Figure 25: Editorial cartoon drawn by Canadian cartoonist Roy Carless “You can Mop Up at Your End and I’ll
Mop Up at Mine!” (Source: Library and Archives Canada, 1992-472-101)
Figure 26: Editorial cartoon drawn by Canadian cartoonist Dan Murphy, “Crime and Punishment” (Source:
Library and Archives Canada, R10823-7)
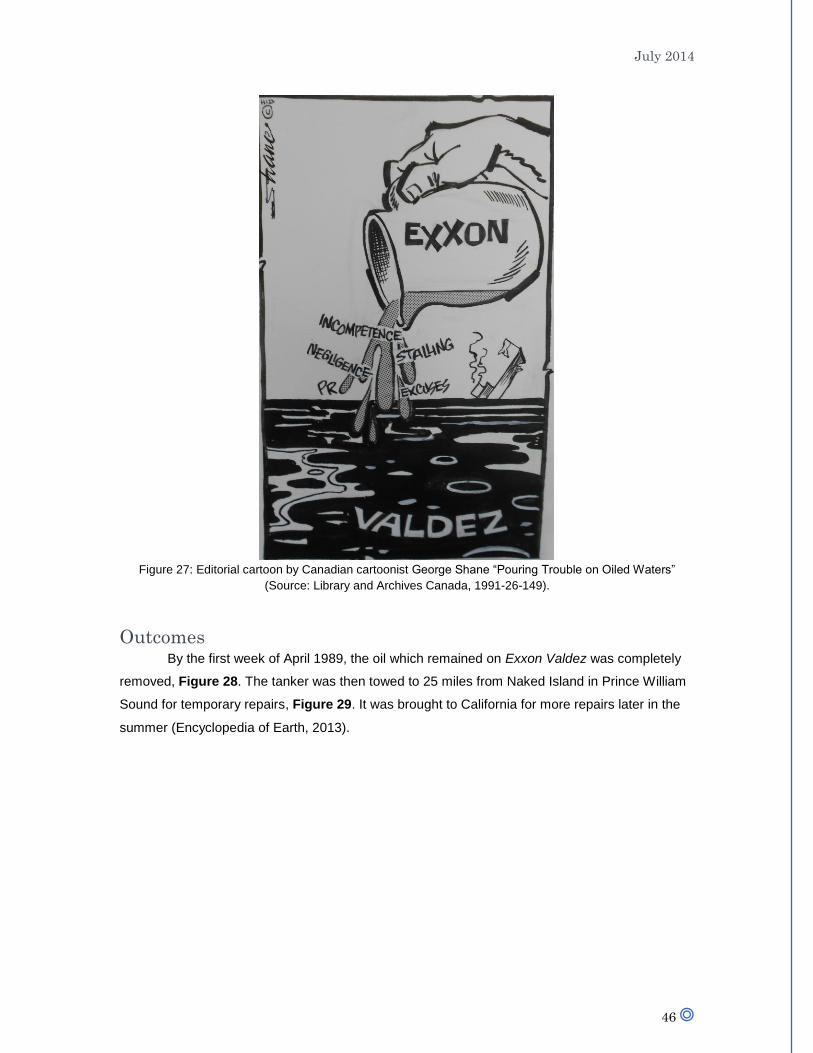
July 2014
46
Figure 27: Editorial cartoon by Canadian cartoonist George Shane “Pouring Trouble on Oiled Waters”
(Source: Library and Archives Canada, 1991-26-149).
Outcomes By the first week of April 1989, the oil which remained on Exxon Valdez was completely
removed, Figure 28. The tanker was then towed to 25 miles from Naked Island in Prince William
Sound for temporary repairs, Figure 29. It was brought to California for more repairs later in the
summer (Encyclopedia of Earth, 2013).

July 2014
47
Figure 28: Three tugs (right) push oil tanker Exxon San Francisco (centre) beside Exxon Valdez (left) to off-
load remaining crude oil (Source: NBC News, 2009).
Figure 29: Exxon Valdez towed to Naked Island in Prince William Sound for temporary repairs (Source: NBC
News, 2009)

July 2014
48
The Exxon Valdez oil spill was the largest environmental disaster of this kind to occur
during this time period, 11 million gallons of oil was spilled (NBC News, 2009). The ecosystem
has yet to fully recover from damage caused by this oil spill (Encyclopedia of Earth, 2013). The
wildlife mortality which followed the spill included (Horton, 2008):
250,000 seabird
2,800 sea otters
300 harbor seals
250 bald eagles
22 killer whales
Many lawsuits were pursued following the disaster. Exxon paid $900 million dollars to settle
these suits. Meanwhile, Captain Hazelwood faced criminal charges. He was accused and then
acquitted on the charge of being drunk at the time of the accident. However, he was convicted of
a misdemeanor for the negligent discharge of oil. Hazelwood was sentenced to a $50,000 fine
and 1,000 hours of community service (NBC News, 2009).
Due to the confusion caused while attempting to carry out a contingency plan, the Alaskan
Legislature realized changes needed to be made. Several bills were passed in 1989 and 1990.
These changes represented the progress in contingency plan development and requirements.
Included in these changes were improvements to the criteria used to evaluate and approve
contingency plans (Library and Archives Canada, R12730-0-X-E, Vol. 16 File 4). These bills were
not the only legal developments made.
Following the Exxon Valdez, The United States passed the Oil Pollution Act in 1990. This
was “an act to establish limitations on liability for damages resulting from oil pollution, to establish
a fund for the payment of compensation for such damages, and for other purposes.” The areas
addressed in the act were (US Senate, 1990):
Oil Pollution Liability and Compensation
Conforming Amendments
International Oil Pollution Prevention and Removal
Prevention and Removal
Removal and Penalties
Penalties and Miscellaneous
Prince William Sound Provisions
Miscellaneous
Oil Pollution Research and Development Program
Trans-Alaska Pipeline System
Penalties
Provisions Applicable to Alaska Natives
Amendments to Oil Spill Liability Trust Fund, etc.
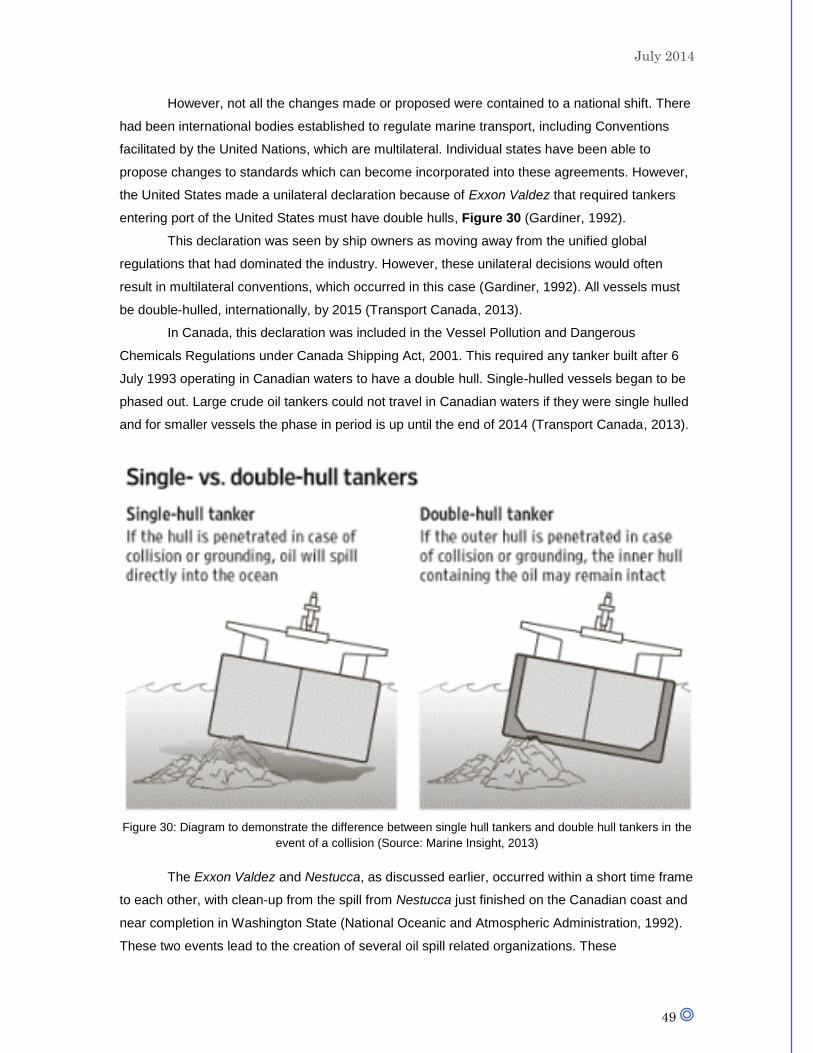
July 2014
49
However, not all the changes made or proposed were contained to a national shift. There
had been international bodies established to regulate marine transport, including Conventions
facilitated by the United Nations, which are multilateral. Individual states have been able to
propose changes to standards which can become incorporated into these agreements. However,
the United States made a unilateral declaration because of Exxon Valdez that required tankers
entering port of the United States must have double hulls, Figure 30 (Gardiner, 1992).
This declaration was seen by ship owners as moving away from the unified global
regulations that had dominated the industry. However, these unilateral decisions would often
result in multilateral conventions, which occurred in this case (Gardiner, 1992). All vessels must
be double-hulled, internationally, by 2015 (Transport Canada, 2013).
In Canada, this declaration was included in the Vessel Pollution and Dangerous
Chemicals Regulations under Canada Shipping Act, 2001. This required any tanker built after 6
July 1993 operating in Canadian waters to have a double hull. Single-hulled vessels began to be
phased out. Large crude oil tankers could not travel in Canadian waters if they were single hulled
and for smaller vessels the phase in period is up until the end of 2014 (Transport Canada, 2013).
Figure 30: Diagram to demonstrate the difference between single hull tankers and double hull tankers in the
event of a collision (Source: Marine Insight, 2013)
The Exxon Valdez and Nestucca, as discussed earlier, occurred within a short time frame
to each other, with clean-up from the spill from Nestucca just finished on the Canadian coast and
near completion in Washington State (National Oceanic and Atmospheric Administration, 1992).
These two events lead to the creation of several oil spill related organizations. These

July 2014
50
organizations were established as non-profit organizations in Canada or through the federal and
state governments in The United States. Task Force was also established which included
representatives from both countries.
In 1989, the Wildlife Rehabilitators Network of British Columbia (WRNBC) was founded.
This is a non-profit, volunteer-run organization whose members include: licensed rehabilitation
facilities, individual representatives, veterinarians and other animal care personnel as well as
interested members of the public. The purpose of this organization is to educate and increase
public understanding of wildlife issues, provide programs and guides to promote protection and
preservation of wildlife and enhance care of injured wildlife standards, provide bursaries to
students pursuing an area of study that will benefit wildlife, provide venues for members to
communicate with government and other organizations and to give wildlife rehabilitators a chance
to discuss issues which affect their work (Wildlife Rehabilitators Network of British Columbia,
2013).
A similar organization was created in The United States. In 1994 the Department of Fish
and Game’s Office of Spill Prevention and Response (OSPR) established the Oiled Wildlife Care
Network (OWCN) in response to Exxon Valdez in Alaska and American Trader in Huntington
Beach, California. This organization has more than 30 different Member Organizations including:
world-class aquaria, universities, scientific organizations and rehabilitation groups. There are four
core areas OWCN focuses on: 1) readiness by providing continual training and drilling facilities
and personnel to improve wildlife contingency plans; 2) response by providing access to
permanent wildlife rehabilitation to give care to wildlife affected by oil; 3) research, examining
improvements to methods for collecting and caring for wildlife to ensure best medical therapies
during rehabilitation; and 4) reaching out, internationally sharing knowledge and resources with
the public and other professionals in the field (Oiled Wildlife Care Network, 2013).
The Oil Spill Recovery Institute (OSRI) located in Prince William Sound, Alaska, was
created in 1989 by Congress following Exxon Valdez under the Oil Pollution Act of 1990. The
Congressional mandate: “1) to identify and develop the best available techniques, equipment and
materials for dealing with oil spills in the Arctic and sub-Arctic marine environment; and, 2) to
complement federal and state damage assessment efforts and determine, document, assess and
understand the long-range effects of Arctic and sub-Arctic oil spills on the natural resources of
Prince William Sound, and the environment, the economy and the lifestyle and well-being of the
people who are dependent on those resources” (Oil Spill Recovery Institute, 2014). Amendments
have since been made in 1996 and 2004, extending the original mandate to 2012. In 2005,
legislation assured OSRI’s research program would continue as long as oil exploration and
development occurs in Alaska. OSRI will be holding a workshop, dependent on receiving funding,
on the topic of Oil Spill Technology (Oil Spill Recovery Institute, 2014).

July 2014
51
Nestucca and Exxon Valdez highlighted the vulnerability of the West Coast from marine
traffic; this lead to the establishment of the Pacific States/British Columbia Oil Spill Task Force.
The Task Force was the result of a memorandum signed by governors of Alaska, Washington,
Oregon, California and the premier of British Columbia. Hawaii later joined in 2001. The Task
Force includes representatives from the following agencies: Alaska Department of Environmental
Conservation, Ministry of Environment (British Columbia), Office of Spill Prevention & Response
(OSPR – California Department of Fish & Game), Hawaii State Department of Health, Oregon
Department of Environmental Quality, and Department of Ecology Spill Prevention, Preparedness
& Response Program (Washington State) (Oil Spill Task Force, 2013).
The focus of the Task Force is to “shar[e] information and resources, coordinat[e]
regional oil spill prevention projects, and fost[er] regulatory compatibility. Evolving trends in
energy development are also impacting [the] field of concern”, as well as support policy and
legislative initiatives that help prevent oil spills, and engage industry partners through outreach
and communication. Marine oil spills prompted the creation of the Task Force, but the Task Force
has broadened the scope to include prevention of oil spills from pipelines, onshore facilities,
vehicles and railroads (Oil Spill Task Force, 2013).
These organizations all include reference to research within their mandate and/or core
focus. The areas affected by Exxon Valdez became provided areas to the scientific community to
study the long-term effects of oil spills. This research was done by members of the Prince William
Sound community as they formed an Advisory Committee (Stephens, 1994). This committee not
only examined the impact on their environment but also continued to bring attention to the need
for tanker safety and for compliancy not to be reached again. This included recommendation that
more legislation be passed and not reduced.
Another study assessed the long-term effect of Exxon Valdez as a means to demonstrate
the need to address ecological risk assessment models of oil. This study synthesized 14 years of
research completed in the spill environment created by Exxon Valdez. The study discusses how
laboratory experiments were not sufficient to study the ecological impact, whereas field studies
expanded the scope to include chronic, delayed and indirect the oil had. These results could then
be applied to a risk assessment model for future use (Peterson et al, 2003).
Awareness was also raised in British Columbia in the need to improve oil spill clean-up
technologies. Proposals began to be submitted to Premier William N. Vander Zalm, for example,
Sea-Link Marine Services Ltd. suggested a tug-barge combination vessel (Library and Archives
Canada R12730-0-X-E Vol. 18 File 26). Other proposals included the production of a GIS Based
Oil Response Atlas for the entire British Columbia Coast-line and the development of Marine Oil
Movements Data Management System by DF Dickens Associates; and the adoption of the EROS
oil spill recovery system by EROS Environmental Technologies, Inc. (Library and Archives
Canada, R12730-0-X-E Vol. 18 File 26).
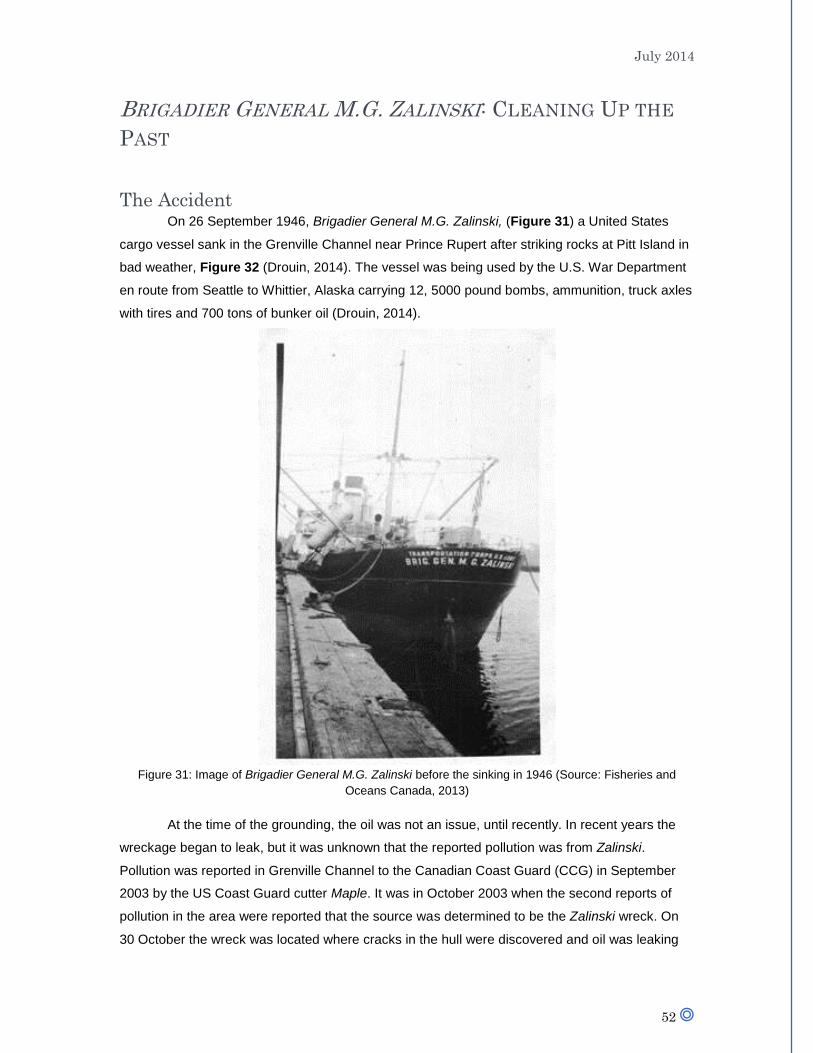
July 2014
52
BRIGADIER GENERAL M.G. ZALINSKI: CLEANING UP THE
PAST
The Accident On 26 September 1946, Brigadier General M.G. Zalinski, (Figure 31) a United States
cargo vessel sank in the Grenville Channel near Prince Rupert after striking rocks at Pitt Island in
bad weather, Figure 32 (Drouin, 2014). The vessel was being used by the U.S. War Department
en route from Seattle to Whittier, Alaska carrying 12, 5000 pound bombs, ammunition, truck axles
with tires and 700 tons of bunker oil (Drouin, 2014).
Figure 31: Image of Brigadier General M.G. Zalinski before the sinking in 1946 (Source: Fisheries and
Oceans Canada, 2013)
At the time of the grounding, the oil was not an issue, until recently. In recent years the
wreckage began to leak, but it was unknown that the reported pollution was from Zalinski.
Pollution was reported in Grenville Channel to the Canadian Coast Guard (CCG) in September
2003 by the US Coast Guard cutter Maple. It was in October 2003 when the second reports of
pollution in the area were reported that the source was determined to be the Zalinski wreck. On
30 October the wreck was located where cracks in the hull were discovered and oil was leaking

July 2014
53
out. The CCG contracted divers to patch the vessel and in January and March 2004 mariners
were informed to not anchor or fish near the wreck site (Drouin, 2014).
Figure 32: Location of the sunken wreck in the Grenville Channel (Fisheries and Oceans Canada, 2014)
The site was monitored by CCG with Transport Canada’s National Aerial Surveillance
Program and with help from the local First Nations. There was no further pollution until April 2012.
Once again, CCG contracted divers to patch the vessel. The patches were done using
commercial epoxy that cures and hardens underwater. More patches were applied again in
January and March of 2013 when more upwelling of oil were reported. Also, the earlier patches
from 2003 were being to deteriorate (Drouin, 2014).
Dive footage was gathered. This footage indicated corrosion of the metal rivets and the
hull was buckling. The structural integrity of the sunken vessel was being lost. A permanent
solution was needed to prevent more environmental harm (Drouin, 2014).
July 2014
54
Recovery On 26 July 2013, Public Works and Government Services Canada submitted requests for
proposals from a third party to conduct the oil removal and spill response services (Fisheries and
Oceans Canada, 2013). The primary contractor chosen was Mammoet Salvage Americas, and
the sub-contractor Global Diving & Salvage Inc. (Drouin, 2014). Community partners were also
involved in the project including the province of British Columbia and local First Nations groups, to
provide feedback on the operation (Fisheries and Oceans Canada, 2013). Other federal
government departments involved were Environment Canada, Health Canada, Transport
Canada, and the Department of Defense (Fisheries and Oceans Canada, 2013).
Incident Command System (ICS) was used for this project as it allowed for participation in
decision-making, discussions and planning by all parties involved. This system was adapted on
18 March 2013 by CCG to improve the ability to respond to oil spills in future years (Fisheries and
Oceans Canada, 2013).
In addition to encouraging participation ICS provides organization, ICS provided
organization for people, equipment, operations and communication activities to effectively
manage the emergency. ICS is an internationally accepted practice and has been adopted by
various municipal, provincial and federal governments as well as private organizations (Fisheries
and Oceans Canada, 2013).
To begin the recovery process infrastructure was placed during the summer and fall of
2013 with the recovery process taking place 19 November 2013 to 2 December 2013. The wreck
was located in 130 feet of water, upside down on a rocky shelf, Figure 33. The precarious
position was a concern for the salvage team (Drouin, 2014).
The original plan was to use a process called hot tapping. CCG first made inquiries
requesting information from the international marine salvage industry about hot tapping in 2007
(Fisheries and Oceans Canada, 2013). Hot tapping was recommended by three independent
marine salvage experts as the most cost effective way to remove the oil from Zalinski, Figure 34
(Fisheries and Oceans Canada, 2013).
However, once recovery began this procedure had to be altered. The internal structure of
the vessel had deteriorated in such a way that the tank tops had rusted away. Oil had migrated to
high places in the vessel. To accommodate this, “pumps and hoses were connected to each of
the hot tap locations and the bunker was sucked out of the hull. This resulted in the added
recovery of 84,391 (US) gallons of oily water which was drawn up with the oil. Both the oil and
oily water were recovered and pumped into large tanks on the surface.” Dan Bate, CCG
spokesperson (Drouin, 2014).

July 2014
55
Figure 33: The position of the wreck on a submerged rocky cliff (Source: Fisheries and Oceans Canada,
2013)
Figure 34: The red sections represent the fuel tanks of the Zalinski, potential locations for hot tapping and
the yellow represents cargo hold (Source: Fisheries and Oceans Canada, 2013)

July 2014
56
Additional concern centred on the unexploded bombs and ammunition which remained
aboard the wreck. To make the holes, divers were unable to use the usual cutting and burning
techniques with welding. This required other cutting methods to be used.
Another issue which needed to be considered was buoyancy. “Normally the divers exhale
their breath into the water column and the bubbles just go out their hat.” David DeVilbiss, Vice
President of Marine Casualty and Emergency Response Services at Global Diving. Special
equipment had to be designed to have the exhaled breath rise to the surface through a second
hose.
The environmental conditions also made the recovery process difficult. Bas Coppes,
President and Director at Mammoet Salvage Americas had said “The very high tidal currents
made the diving very challenging and time-consuming. We did it in the worst season, the winter.
We had snow and freezing temperatures and all that kind of stuff – pretty tough conditions.” The
cold water also impacted the viscosity of the oil making it difficult to pump.
Outcomes ICS was adopted as the national incident management system. The adoption of ICS by
CCG is within the timeline of this recovery, however a clear connection between the adoption of
this system and the Zalinski recovery and clean-up is not known.
However, the system was successfully used during the clean-up. As it is now the national
incident management system it will be used for future oil spills. Personnel working for the CCG
will be trained coast-to-coast-to-coast in ICS.
The recovery and clean-up from this sunken vessel demonstrates technological
developments in oil retrieval processes that could be applied to other sunken vessels which could
pose a similar environmental threat in the future. It shows that clean-up and oil spill response
plans are not limited to spills as they occur but be can effective in cleaning-up wrecks of the past.
While this can be presented as a “good news story”, there is one argument that has been
made which does not share this sentiment. The criticism comes from the timing. Citizens have
criticized the federal government believing action was only taken as a means to demonstrate the
abilities available to clean-up a spill should a spill occur from pipelines which are highly debated
(CBC News, 2013).
Also, the timing of the project has been criticized, as stated earlier, the winter months do
not have the most amiable weather conditions for this type of project, yet it was the time of year
the project was carried out. This timeframe coincided with the National Energy Board’s decision
on the Gateway pipeline (CBC News, 2013).
Another point of tension surrounding this project was the use of foreign companies and
employee. There are Canadian companies and workers who are capable of completely this work,
yet they were not chosen. When CBC contacted Mammoet and Global Diving to comment on a
story, their calls were not returned (CBC News, 2014).

July 2014
57
Although the local First Nations participated in the process they too remain skeptical.
That skepticism is based on the fact that this wreck had been within their territory for 60 years
and it is not until now that the federal government takes action to remove the threat completely
(CBC News, 2014).
CONCLUSION In conclusion, this report was completed for Canada Science and Technology Museum
as a research project for Fleming College’s Museum Management and Curatorship Program
summer internship. This report discussed the progression of recovery and clean-up techniques
following marine oil disasters. Included in this topic is the change that arose from these disasters
and the realization that prevention methods were needed as well as legislative changes. The
disasters discussed were: Torrey Canyon (1967), Arrow (1970), Kurdistan (1979), Nestucca
(1988), Exxon Valdez (1989), and Brigadier General M.G. Zalinski (sank in 1946, recovery of oil
in 2013). These disasters were identified as significant following a review of scholarly journals,
books and news articles. Further research could be completed on other marine oil disaster not
discussed in this report as well as research of oil disasters from other forms of transportation.
July 2014
58
BIBLIOGRAPHY
Alaska Oil Spill Commission. 1990. Spill: The Wreck of the Exxon Valdez: Implications for Safe
Transportation of Oil. Accessed from:
<http://docs.lib.noaa.gov/noaa_documents/NOAA_related_docs/oil_spills/spill_wreck_Ex
xonValdez_1990.pdf>. Accessed on: 4 June 2014.
This report was completed following the Exxon Valdez disaster. It discusses the events leading
up to the accident, including the actions of Captain Hazelwood and accompanying testimonies of
witnesses. The report also provides an extensively detailed timeline of the accident as well as a
detailed account of the clean-up response. There is very good information provided in this
resource, however the language can be technical and difficult for the reader.
Barkham, P. 2010. Oil Spills: The Legacy of the Torrey Canyon. Accessed from:
<http://www.theguardian.com/environment/2010/jun/24/torrey-canyon-oil-spill-deepwater-
bp>. Accessed on: 29 May 2014.
Blumer, Max. 1971. Scientific Aspects of the Oil Spill Problem. Boston College Environmental
Affairs Law Review. Vol 1(1). pp. 54-73.
The source explores how the scientific community began to complete research surrounding oil
spills and their negative impact on the environment. It also presented evidence that proves
contaminants in oil are harmful to human health. This was an excellent source as it helped to
demonstrate the scientific frame of mind following the first major oil spill to make international
headlines.
Canada Space Agency. 2014. RADARSAT-1. Accessed from: <http://www.asc-
csa.gc.ca/eng/satellites/radarsat1/>. Accessed on: 2 June 2014.
CBC News. 2014. B.C. Shipwreck’s Oil Clean Up Makes Waves. Accessed from:
<http://www.cbc.ca/news/canada/british-columbia/b-c-shipwreck-s-oil-cleanup-makes-
waves-1.2125796>. Accessed on: 15 May 2014.
Cedre. 2010. Kurdistan. Accessed from: <http://www.cedre.fr/en/spill/kurdistan/kurdistan.php>.
Accessed on: 16 June 2014.
Center for Tankship Excellence. 1979. Kurdistan. Access from:
<http://www.c4tx.org/ctx/job/cdb/precis.php5?key=19790315_001>. Accessed on 16
June 2014.
Cleaves, H. “Kurdistan oil cleanup under way”. Bangor Daily News, 7 May 1979. Accessed from:
<http://news.google.com/newspapers?nid=2457&dat=19790507&id=8gQ1AAAAIBAJ&sji
d=H08KAAAAIBAJ&pg=3492,2581617>. Accessed on: 16 June 2014.
Crowley, Richard W. Unknown. Arrow. Department of the Navy Naval Ship Systems Command,
Washington D.C. Potomac Research, Washington, D.C.

July 2014
59
This report provided detailed information regarding the steps taken to recover and clean-up oil
that polluted the Nova Scotia coast. The Canadian equivalent was not found therefore this report
was very useful to further elaborate on the process that occurred.
Drapeau, G. 2011. Natural Cleaning of Oil Polluted Seashores. Coastal Engineering Proceedings.
1(13). pp. 2557-2575.
Drouin, Michael. 2014. Mammoet, Global Diving remove oil from US. Army ship that wrecked in
1946 British Columbia coast. Professional Mariner: The Journal of Professional
Seamanship. Iss. 179. pp.40-42.
This article discussed the recent recovery of oil from the sunken wreck Brigadier General M.G.
Zalinski. This provided a summary of the operation as well as quotes from those directly involved
in the developing the strategy as well as those responsible for the recovery.
Duerden, C.F. and J.J. Swiss. 1981. Kurdistan—An Unusual Spill Successfully Handled.
International Oil Spill Conference Proceedings. 1981:1, pp. 215-219.
This article outlined the primary goals of taken by REET while handling the Kurdistan oil spill. This
article was very useful as it was well written and used reader-friendly language but not using
scientific jargon. The article was concise yet provided great detail.
Duff, J. 2010. Remembering the Torrey Canyon disaster. National Maritime Museum Cornwall.
Accessed from:
<http://www.nmmc.co.uk/index.php?/collections/featured_pictures/remembering_the_torr
ey_canyon_disaster>. Accessed on: 14 May 2014.
This article described the Torrey Canyon disaster and addressed what that disaster meant on an
international scale. This information was presented by the National Maritime Museum Cornwall
which demonstrated how museums can effectively write about disaster without being
disrespectful.
Encyclopaedia of Earth, The. 2013. Water Pollution: Exxon Valdez Oil Spill. Accessed from:
<http://www.eoearth.org/view/article/152720/>. Accessed on: 04 July 2014.
This source provided summary detail of the Exxon Valdez disaster. The information provided is
from the National Transportation Safety Board investigation but written using less technical
language. This helped to provide the summary of the accident required while including only the
essential details. Information regarding the clean-up process that followed the accident is also
provided in this source.
Environment & Society Portal. 2012. Why Europe Responded Differently from the United States.
Accessed from: <http://www.environmentandsociety.org/exhibitions/silent-spring/why-
europe-responded-differently-united-states>. Accessed on: 29 May 2014.
Environment Canada. 2008. Regional Environmental Emergencies Teams (REET). Accessed
from: <http://www.glslcities.org/voice-of-mayors/REET.pdf>. Accessed on: 26 June 2014.

July 2014
60
This presentation defined REET and described what the role and responsibilities of this system
are. The presentation also stated that REET was established following the Arrow disaster. This
served to show REET as an example of one of the outcomes achieved following that disaster.
Environment Canada. 2014. Arctic and Marine Oilspill Program (AMOP). Accessed from:
<http://ec.gc.ca/amop/default.asp?lang=En&n=F3B23C26-1 >. Accessed on: 30 June
2014.
This website describes the role of the Arctic Marine Oilspill Program and the history of its
establishment. This provided information on the development of technology later used in the
Kurdistan oil spill.
Environmental Protection Agency. 2014. Bioremediation of Exxon Valdez Oil Spill: EPA Press
release- July 31, 1989. Accessed from: <http://www2.epa.gov/aboutepa/bioremediation-
exxon-valdez-oil-spill>. Accessed on: 08 July 2014.
Fisheries and Oceans Canada. 2013. Canadian Coast Guard Announces Significant
Environmental Protection Operation. Accessed from:<http://www.dfo-
mpo.gc.ca/media/infocus-alaune/2013/zalinski/zalinski-eng.htm>. Accessed on: 13
May 2014.
This website introduces the operation undertaken to recover oil from Brigadier General M.G.
Zalinski. It was an excellent source that provided links to additional resources that were helpful in
understanding the steps taken to plan this operation as well as the actions that occurred during
the operation, such as hot tapping.
Franks S. and S. Nunnally. 2011. Barbarians of Oil: How the World’s Oil Addiction Threatens
Global Prosperity and Four Investments to Protect Your Wealth. John Wiley & Sons.
Hoboken, NJ.
This resource discusses the history of oil in society. It was used to provide historical information
regarding the beginning of the marine transport industry and how shipping vessels evolved.
Gardiner, Robert; ed. 1992. Conway’s History of the Ship: The Shipping Revolution: The Modern
Ship. Conway Maritime Press Ltd, London, United Kingdom.
This resource describes the evolution of the shipping industry in the 20th Century. This includes
the progression of international trade and the growing dependence on oil products throughout the
world. The increase demand and how that impacted tanker design as well as the underlying
politics of the oil industry between countries is also discussed. This resource will be used to
provide the background information required to explain the need for larger vessels to be built and
the therefore growing threat of increased impact for any oil disaster.
Global Security. 2011. Military: T2 AO-36 Kennebec / T2-A AO-41 Mattaponi; T2-SE-A1 AO-49
Suamico / AO-65 Pecos; T2-SE-A2 AO-80 Escambia / AO-111 Mission Buenaventura /
AW-3 Pasig. Accessed from: <http://www.globalsecurity.org/military/systems/ship/t2-
tanker.htm>. Accessed on: 11 June 2014.
July 2014
61
Green Island Lighthouse. Unknown. Arrow Disaster. Accessed from:
<http://www.greenislandlighthouse.com/map.php >. Accessed on: 16 May 2014.
Hanlon, M. 2010. When Disaster Strikes, the U.S. will Never Take the Blame. Accessed from:
<http://www.dailymail.co.uk/news/article-1285731/GULF-OIL-SPILL-When-disaster-
strikes-US-NEVER-blame.html>. Accessed on: 29 May 2014.
Harrald, J.R., Mazzuchi, T.A., Spahn, J., Van Dorp, R. Merrick, J., Shrestha, S., and Grabowski
M. 1998. Using System Simulation to Model the Impact of Human Error in a Maritime
System. Safety Science. 30. pp. 235-247.
This article discussed the role human play in the cause of marine disasters by presenting case
studies. One of the case studies used was Torrey Canyon. This provided detail on how human
error resulted in the disaster and argued this is something that needs to be taken into
consideration prior to a voyage beginning and that the responsibility does not lie with the
individual alone but with the way the marine shipping industry operates presently.
Holmes, N. 2011. “A Super Tanker Aground”. Accessed from:
<http://www.humanities360.com/index.php/a-supertanker-aground-12375/>. Accessed
on: o5 Jun 2014.
Horton, J. 2008. What is the worst environmental disaster in history?. Accessed from:
<http://science.howstuffworks.com/environmental/green-science/environmental-
disaster1.htm>. Accessed on: 08 July 2014.
International Tanker Owners Pollution Federation Limited, The. 2013. Documents and Guides.
Accessed from: <http://www.itopf.com/knowledge-resources/documents-guides/>.
Accessed on: 18 June 2014.
This website provided very detailed information surrounding various aspects of an oil spill,
observation, response, recovery, and clean-up techniques. It provided useful technical
information on how SAR can be used to obtain images of a spill. Information was also available to
describe the different types of booms available for oil containment.
Library and Archives Canada. MG 32. C 62 Vol. 1 File 18. Oil Spill from Tanker ARROW,
Chedabucto Bay, N.S. Aiken, Gordon Harvey Fonds. Notes from Chedabecto Bay and
Port Hawerbury. 15 April 1970.
This source provided the notes taken by MP Gordon Aiken during visit to the Chedabucto Bay
following the Arrow spill. He noted the Canadian innovation that occurred during the response as
well as the areas that needed further research. This source also included a letter where Aiken
discussed the Task Force as well as Aiken discussing water pollution at The House of Commons.
Library and Archives Canada. R9359-0-4-E. Roy Carless fonds. “You Mop Up at Your End and
I’ll Mop Up at Mine”. No date.
This is a political cartoon drawn by a Canadian artist. This artwork is used to demonstrate Exxon
Valdez making international news and depicted in Canadian media.

July 2014
62
Library and Archives Canada. R11008-0-X-E. George Shane fonds. “Pouring Trouble on Oiled
Waters”. 1989.
This is a political cartoon drawn by a Canadian artist. This artwork is used to demonstrate Exxon
Valdez making international news and depicted in Canadian media.
Library and Archives Canada. R10823-0-2-E. Dan Murphy fonds. “Crime and Punishment.” 1989.
This is a political cartoon drawn by a Canadian artist. This artwork is used to demonstrate Exxon
Valdez making international news and depicted in Canadian media.
Library and Archives Canada. R12730-0-X-E Vol.15 File 5. Nestucca Oil Spill Report- prepared
by Canadian Coast Guard. 1989. Nestucca Oil Spill Report. Canadian Coast Guard.
Transport Canada.
This report was written by the Canadian Coast Guard to review the Nestucca oil spill. This report
described the accident as well as clean-up method used to clean-up the Canadian coastline
affected by the spill.
Library and Archives Canada. R12730-0-X-E. Vol 15 File 11. Exxon Valdez Oil Spill- report
“Proposed Probable Cause, Findings and Recommendations of the State of Alaska.
1989.
This report outlined the policy Exxon Service Co. had set in place to address staff members who
experience problems with alcohol. It also discusses how The Company handled the situation
once The Company became aware of the problems Captain Hazelwood had. This included the
supervisory system that was established. The report explains how this system broke down and
was not effective. The report also discusses the previous efforts Exxon Service Co. made to
lower crew requirements for oil tankers.
Library and Archives Canada. R12730-0-X-E, Vol. 16 File 4. Exxon Valdez Oil Spill- Oil Spill
Contingency Plans in Alaska. Current Regional Approval Criteria for Oil Spill Contingency
Plans in Alaska. Bennett Environmental Consultants Ltd. July 1990.
This source discusses the Alyeska Contingency Plan and the associated confusion following the
slow response of the Exxon Valdez oil spill. This source also explains how the confusion lead to
legislative changes required for future contingency plans. These changes are outlined in this
source.
Library and Archives Canada. R12730-0-X-E Vol. 18 File 26. Oil Cleaning Technologies-
correspondence. 1989. Proposal from Sea-Link Marine Services Ltd, DF Dickens and Associates,
and EROS Environmental Technologies, Inc.
This source contains proposals made the British Columbia Premier regarding oil spill clean-up
technologies. These proposals include details of the project and diagrams. The purpose of the
proposal was also to seek funding for the project.

July 2014
63
Library and Archives Canada. R12730-0-X-E Vol. 18 File 27. Bioremediation- clippings, articles,
telexes. 1989. Anchorage Daily News. 07 August 1989. Medred, Craig. Bacteria devour
spiller oil.
This source is a newspaper article published following the Exxon Valdez oil spill. This article
discusses the observation made at the experimental bioremediation plots on oil contaminated
shorelines.
Library and Archives Canada. R12730-0-X-E Vol. 18 File 28. Tanker Traffic – clippings. 1989.
Vancouver Sun on 23 January 1989. Anderson, David.
This source is a newspaper article written following the Nestucca oil spill. The focus of the article
was to awareness of the increased tanker traffic occurring between Alaska and Washington
State. This route puts British Columbia at risk if another spill were to occur.
Marine Insight. 2013. Single Hull vs Double Hull. Accessed from:
<http://www.marineinsight.com/marine/marine-news/headline/single-hull-vs-double-hull-
tankers/>. Accessed on: 26 May 2014.
Maritime Museum of the Atlantic. Unknown. Kurdistan - 1979. Accessed from:
<http://novascotia.ca/museum/wrecks/gallery/photo.asp?ID=61>. Accessed on: 11 June
2014.
McCormick, J. 1991. Reclaiming Paradise: The Global Environmental Movement. Indiana
University Press. Bloomington, IN, USA. pp. 47-69.
This book discusses the events that lead to the environmental movement, including the
occurrence of environmental disasters. In particular this resource was used to discuss the impact
Torrey Canyon had in creating this movement due to the lack of preparedness and poor public
relations by the British government.
McGurren, H. J. 1971. The externalities of a Torrey Canyon Situation: An Impetus for Change in
Legislation. Natural Resources Journal. Vol 11. pp. 349-372.
This study examines the measures in place to assess liability of oil. This article uses economic theory to explain the different approaches that can be taken to determine who is responsible for the oil spill and who is then responsible for the oil recovery. This study was done following the Torrey Canyon oil spill which occurred in 1967. This article argues that those who are shipping oil are participating in the risk and should therefore be responsible to pay for the recovery. The article also discusses some of the insurance process of oil shipping. This article concludes with determining legislative change is required to better outline where the liability and responsibility lies with discussion of the Water Quality Improvement Act of 1970. This study was used to provide a basis on the continuing need for legislative change following an oil disaster.
Ministry of Environment. Unknown. Nestucca Barge Oil Spill. Accessed from:
<http://www.env.gov.bc.ca/eemp/incidents/earlier/nestucca_88.htm>. Accessed on: 04
July 2014.
Modern Marvels. 2004, 4 August. Oil Tankers. History Channel.

July 2014
64
National Oceanic and Atmospheric Administration. 1992. Oil Spill Case Histories 1967-1991:
Summaries of Significant U.S. and International Spills. Accessed from:
<http://response.restoration.noaa.gov/sites/default/files/Oil_Spill_Case_Histories.pdf>.
Accessed on: 08 July 2014.
National Oceanic and Atmospheric Administration. 2014. Booms, Beams, and Baums: The
History Behind the Long Floating Barriers to Oil Spills. Accessed from:
<http://response.restoration.noaa.gov/about/media/booms-beams-and-baums-history-
behind-long-floating-barriers-oil-spills.html>. Accessed on: 30 June 2014.
This source discusses the use of boom in oil containment. It was used to provide historical
information about the use of booms in oil spills as well as describe the different booms available.
National Transportation Safety Board. 1990. Marine Accident Report: Grounding of the U.S.
Tankship Exxon Valdez on Bligh Reef, Prince William Sound Near Valdez, Alaska March
24, 1989. Accessed from:
<http://docs.lib.noaa.gov/noaa_documents/NOAA_related_docs/oil_spills/marine_acciden
t_report_1990.pdf>. Accessed on: 02 July 2014.
This report was written following the investigation of the Exxon Valdez disaster. This report details
the accident, clean-up response and probable causes of the accident. The report provides
technical details to explain those aspects of the accident. Understandably it is written in great
detail. While the full scope of the disaster is addressed thoroughly, creating a summary of the
accident was difficult from this source.
NBC News. 2009. Oil Plagues Sound 20 Years After Exxon Valdez. Accessed:
<http://www.nbcnews.com/id/29838444/ns/us_news-environment/t/oil-plagues-sound-
years-after-exxon-valdez/#.U8LKdPldVu4>. Accessed on: 17 June 2014.
Oil Spill Recovery Institute. 2014. Our Story. Accessed from: <http://www.pws-osri.org/>.
Accessed on: 07 July 2014.
Oil Spill Task Force. 2013. About Us. Accessed from: <http://oilspilltaskforce.org/about/>.
Accessed on: 07 July 2014.
Oiled Wildlife Care Network. 2013. OWCN Overview. Accessed from:
<http://www.vetmed.ucdavis.edu/owcn/about_us/index.cfm>. Accessed on: 07 July 2014.
Owens Coastal Consulting. Unknown. Home Page: Welcome. Accessed from:
<http://www.owenscoastal.com/Index.html>. Accessed on: 02 July 2014.
Owens, E.H. 1991. Shoreline Evaluation Methods Developed During the Nestucca Response in
British Columbia. International Oil Spill Conference Proceedings: March 1991, 1991(1).
pp. 177-179.
This study discussed the shoreline evaluation method created during response to the Nestucca
oil spill. This evaluation system was needed as volunteers would provide site descriptions that

July 2014
65
could be interpreted subjectively. This system created classifications. The study also provided a
flow chart to demonstrate the structure of the response team.
Owens, E.H. 2002. Profile: Editorial Board Member. Spill Science & Technology Bulletin. 7(5-6).
pp. 189-191.
Owens, E. 2011. The Cleaning of Gravel Beaches Polluted by Oil. Coastal Engineering
Proceedings. 1(13). pp. 2549-2556.
Owens, E.H. and Drapeau, G. 1973. Changes in Beach Profiles at Chedabucto Bay, Nova Scotia,
Following Large-scale Removal of Sediments. Canadian Journal of Earth Sciences. 10.
pp. 1226-1232.
Parker, A. 2009. How Oil Tankers Work. Accessed from:
<http://science.howstuffworks.com/transport/engines-equipment/oil-tanker.htm>.
Accessed on: 15 May 2014.
Peterson, C.H., Rice, S.D., Short, J.W., Esler, D., Bodkin, J.L., Ballachey, E., and Irons, D.B.
2003. Long-Term Ecosystem Response to the Exxon Valdez Oil Spill. Science. 302. pp.
2082-2086.
Rothblum A.M., Wheal D., Withington S., Shappell S.A., Wiegmann D.A., Boehm W., and
Chaderjian M. 2002. Human Factors in Incident Investigation and Analysis. Proceedings
of the 2nd International Workshop on Human Factors in Offshore Operations (HFW200),
held April 8-10, 2002, in Houston, TX.
This resource explained the effect human error has on causing marine accidents. The article
discussed how organizations, technology and environment play a role in human behaviour adding
pressure which will lead to these accidents. Two examples are presented in this resource, one of
the examples being that of the Torrey Canyon oil spill. The factors leading to the accident are
outlined and explained.
Shayt, David H. 2006. Artifacts of Disaster: Creating the Smithsonian’s Katrina Collection, Technology and Culture 47(2): 357-368.
This article is a case study of collecting artefacts from disasters for The Smithsonian. The article begins with a brief discussion collecting artefacts previously, following 9/11 from The World Trade’s Centre, The Pentagon and the Pennsylvanian field. The focus of this case study is the collection of artefacts following Hurricane Katrina. The article identifies the sensitivity in collecting these pieces but acknowledges the necessity to do so in order to preserve the history of those events for the future. The article also discusses how it is the human story attached to these objects which make them significant and valuable additions to a museum collection. This is an important case study to refer to when proposing objects to be collected by Canada Science and Technology Museum to tell the story of marine oil disasters.
Stephens, Stan. 1995. Then & Now: Changes Since the Exxon Valdez Oil Spill. Prevention,
Response & Oversight: Five Years after the Exxon Valdez Oil Spill. Alaska Sea Grant
Report 1994. Pp. 301-310.

July 2014
66
Swindells, N.S. 1997. Glossary of Maritime Technology. The Institute of Marine Engineers,
London, United Kingdom.
Tanker, Big Oil and Pollution Liability. Unknown. Salvage Effort. Accessed from:
<http://www.oilpollutionliability.com/salvage-efforts/>. Accessed on: 29 May 2014.
Transport Canada. 2013. Spill Prevention: National Aerial Surveillance Program. Accessed from:
<https://www.tc.gc.ca/eng/marinesafety/oep-ers-nasp-2195.htm>. Accessed on: 10 June
2014.
This source describes the National Aerial Surveillance Program and its role in the reduction of oil
pollution along Canadian coasts. This included the type of airplane used to carry-out the
observations, the DASH-8. There is a model of this plane in The Museum’s collection.
U.S. Fish and Wildlife Services and Western Washington Fish and Wildlife Office. 2004. Final
Nestucca Oil Spill Revised Restoration Plan. Accessed from:
<http://www.doi.gov/restoration/library/casedocs/upload/WA_barge_Nestucca_RP_10-
04.pdf>. Accessed on: 17 June 2014.
Utton, A. E. 1968. Protective Measures and the “Torrey Canyon”. Boston College Law Review.
Vol 9(3). pp: 613-632. Accessed from:
<http://lawdigitalcommons.bc.edu/bclr/vol9/iss3/4>. Accessed on: 14 May 2014.
Vandermeulen, J.H. and D.E. Buckley (Editors). 1985. The Kurdistan oil spill of March 16-17,
1979: Activities and observations of the Bedford Institute of Oceanography response
team. Canadian Technical Report of Hydrography and Ocean Science. 35. pp. 1-190.
This report outlined the activities of the response team to the Kurdistan spill. The report contained
a map depicting when the accident occurred which will be used to provide a visual aid when
discussing this spill. The report provided a breakdown of the organizations who participated in the
response. The report also provided details of what occurred in the accident, for example the
tanker spilt in two halves. This information is also essential to establish how the accident
occurred.
Wildlife Rehabilitators Network of British Columbia. 2013. The Network. Accessed from:
<http://www.wrnbc.org/the-network/>. Accessed on: 07 July 2014.
Wreck Site. 2009. Wreck Site. Accessed from: <http://www.wrecksite.eu/Wrecksite.aspx>.
Accessed on: 15 May 2014.

July 2014
67
ACKNOWLEDGEMENTS Appreciation goes to Anna Adamek and Sharon Babaian at Canada Science and
Technology Museum for being my supervisors during this research project. I also appreciate
everyone at Canada Science and Technology Museum for making me feel welcome and for
sharing their knowledge with me. Special thanks are extended to Cindy Colford who was the
Fleming College Intern Liaison. I would also like to thank Gayle McIntyre at Fleming College for
her assistance in the preparation of the internship during Semester 2 of the Museum
Management and Curatorship Program.
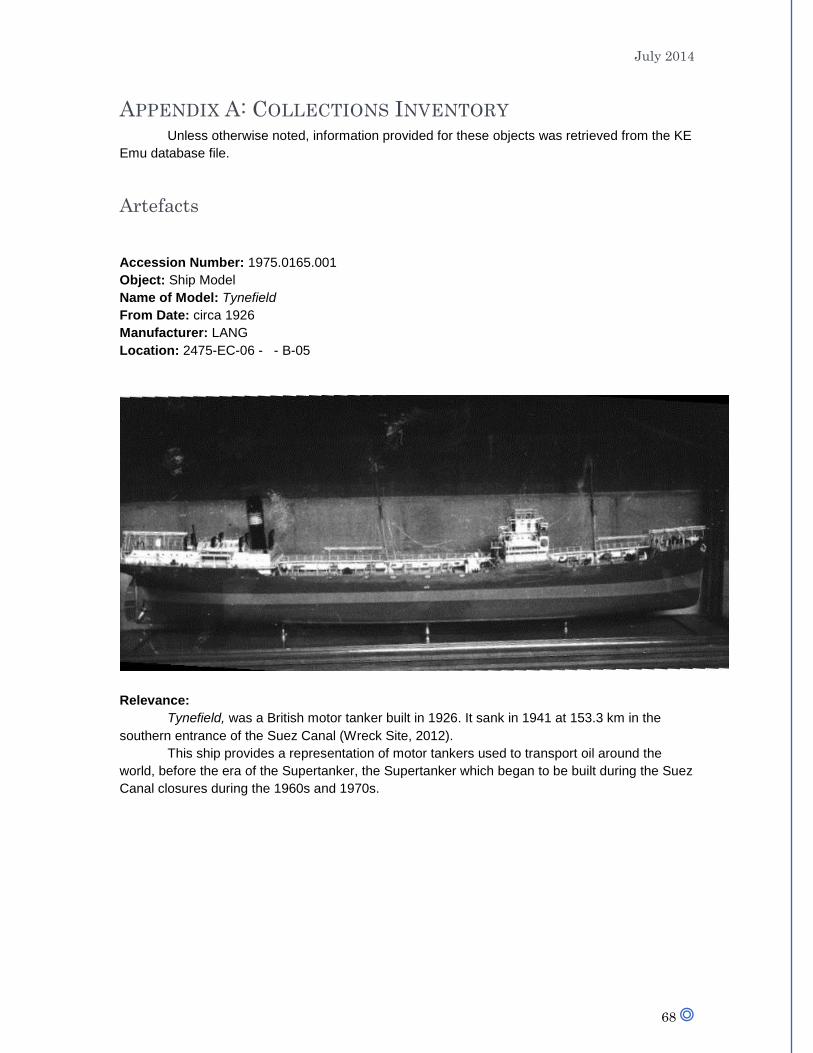
July 2014
68
APPENDIX A: COLLECTIONS INVENTORY Unless otherwise noted, information provided for these objects was retrieved from the KE
Emu database file.
Artefacts
Accession Number: 1975.0165.001
Object: Ship Model
Name of Model: Tynefield
From Date: circa 1926
Manufacturer: LANG
Location: 2475-EC-06 - - B-05
Relevance:
Tynefield, was a British motor tanker built in 1926. It sank in 1941 at 153.3 km in the
southern entrance of the Suez Canal (Wreck Site, 2012).
This ship provides a representation of motor tankers used to transport oil around the
world, before the era of the Supertanker, the Supertanker which began to be built during the Suez
Canal closures during the 1960s and 1970s.

July 2014
69
Accession Number: 1975.0170.001
Object: Ship Model
Name of Model: Silverbrook
From Date: circa 1953
Manufacturer: Unknown
Location: 2475-MAIN-ME------07-FL
(Source: Waite, 2014)
Relevance:
Silverbrook was a motor tanker used to transport oil. This model represents the era of
tankers before Supertankers were built. The three island structure is visible in this model.
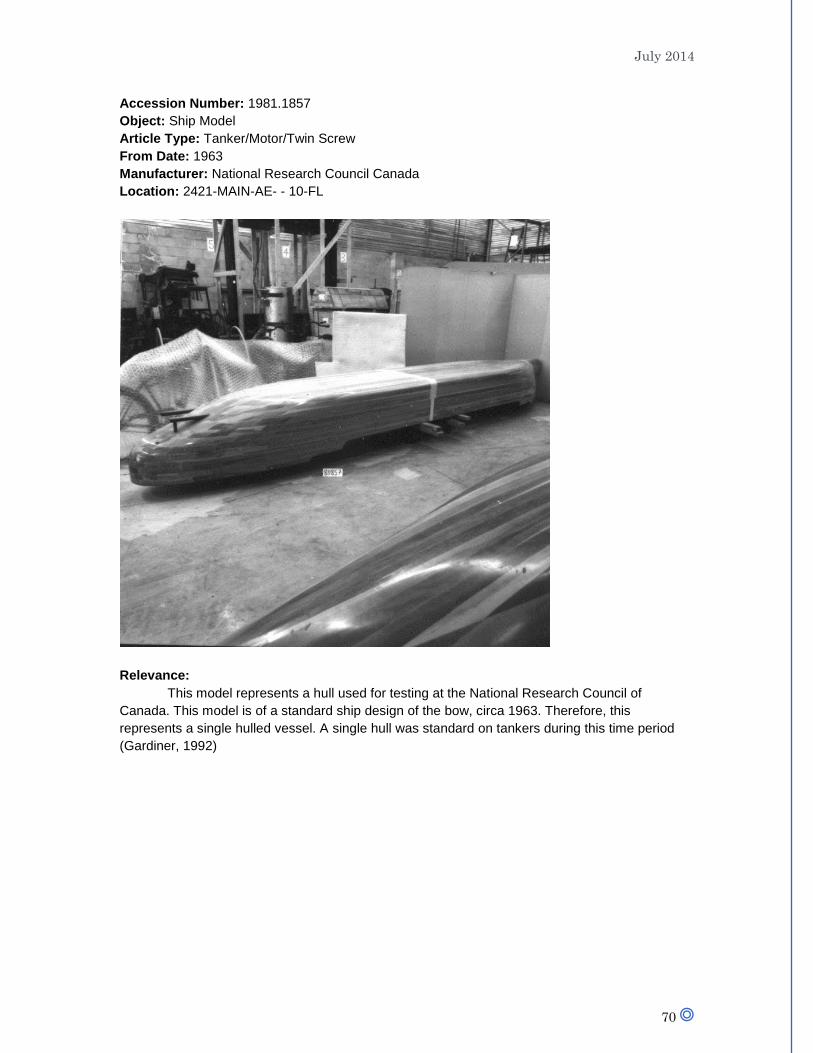
July 2014
70
Accession Number: 1981.1857
Object: Ship Model
Article Type: Tanker/Motor/Twin Screw
From Date: 1963
Manufacturer: National Research Council Canada
Location: 2421-MAIN-AE- - 10-FL
Relevance:
This model represents a hull used for testing at the National Research Council of
Canada. This model is of a standard ship design of the bow, circa 1963. Therefore, this
represents a single hulled vessel. A single hull was standard on tankers during this time period
(Gardiner, 1992)
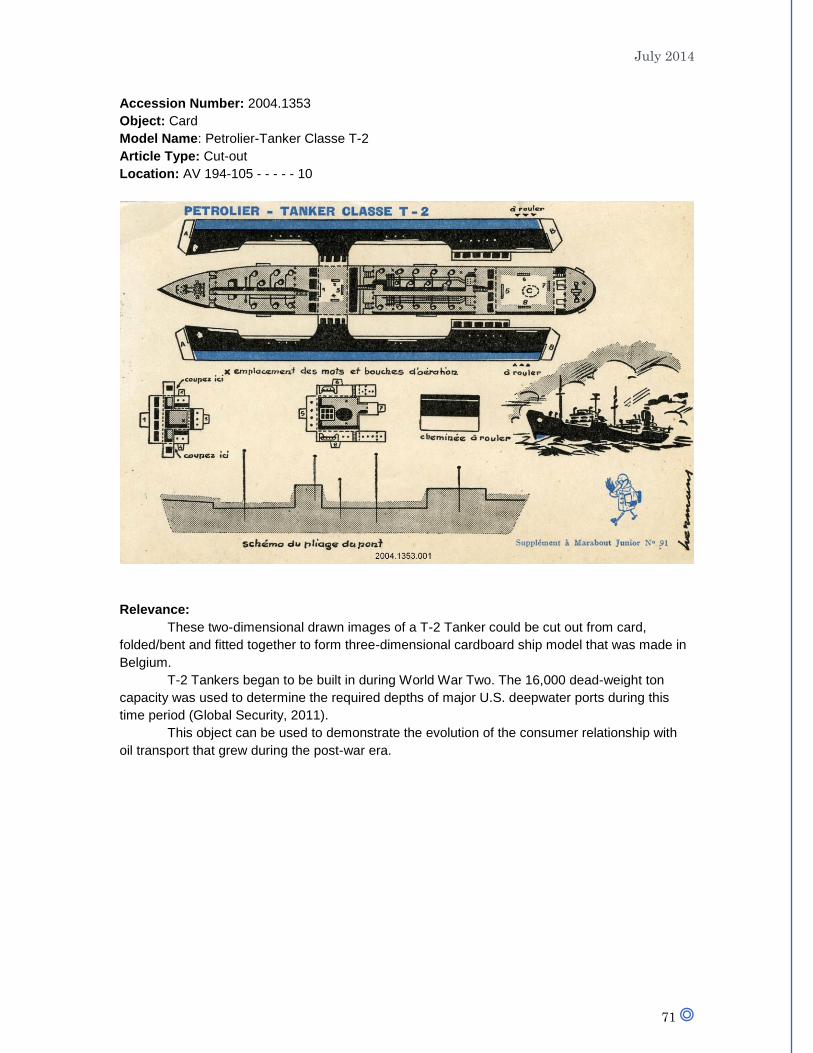
July 2014
71
Accession Number: 2004.1353
Object: Card
Model Name: Petrolier-Tanker Classe T-2
Article Type: Cut-out
Location: AV 194-105 - - - - - 10
Relevance:
These two-dimensional drawn images of a T-2 Tanker could be cut out from card,
folded/bent and fitted together to form three-dimensional cardboard ship model that was made in
Belgium.
T-2 Tankers began to be built in during World War Two. The 16,000 dead-weight ton
capacity was used to determine the required depths of major U.S. deepwater ports during this
time period (Global Security, 2011).
This object can be used to demonstrate the evolution of the consumer relationship with
oil transport that grew during the post-war era.

July 2014
72
Accession Number: 1999.0051.001
Object: Compass, gyro
Name of Model: C-3 MK.23
From Date: Unknown
Manufacturer: Sperry Gyroscope Co. of Canada Ltd.
Location: 2475-MAIN-I-N-08-B
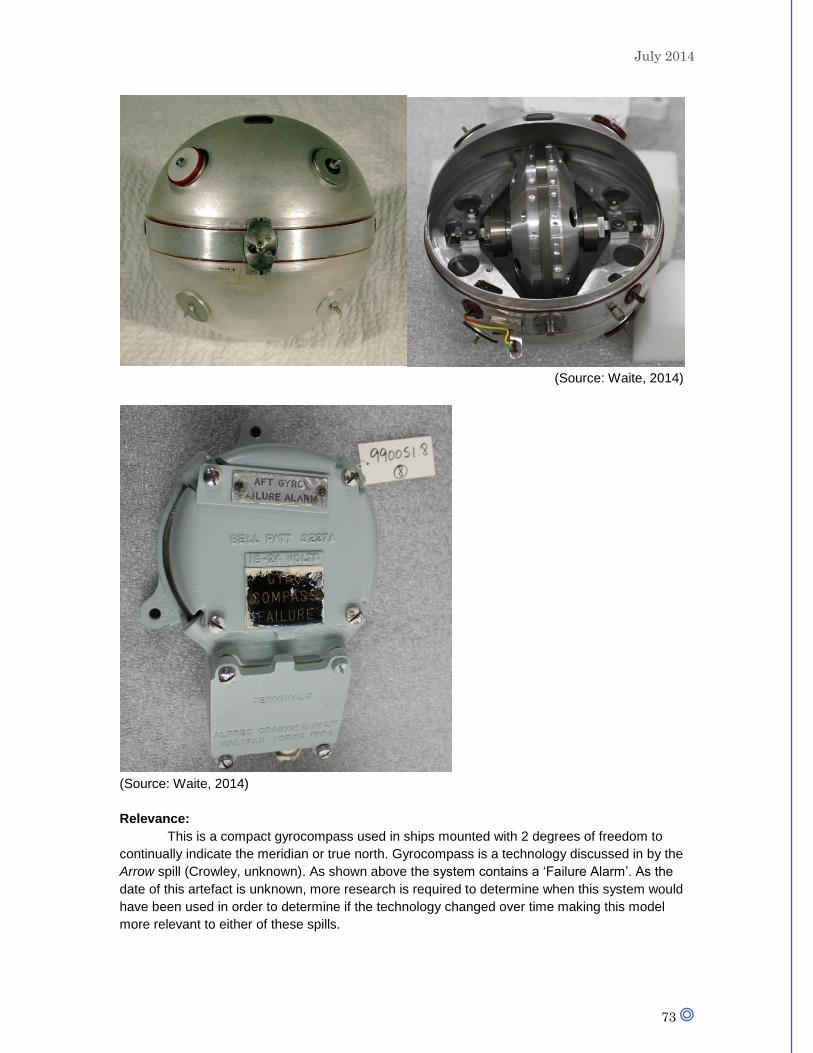
July 2014
73
(Source: Waite, 2014)
(Source: Waite, 2014)
Relevance:
This is a compact gyrocompass used in ships mounted with 2 degrees of freedom to
continually indicate the meridian or true north. Gyrocompass is a technology discussed in by the
Arrow spill (Crowley, unknown). As shown above the system contains a ‘Failure Alarm’. As the
date of this artefact is unknown, more research is required to determine when this system would
have been used in order to determine if the technology changed over time making this model
more relevant to either of these spills.
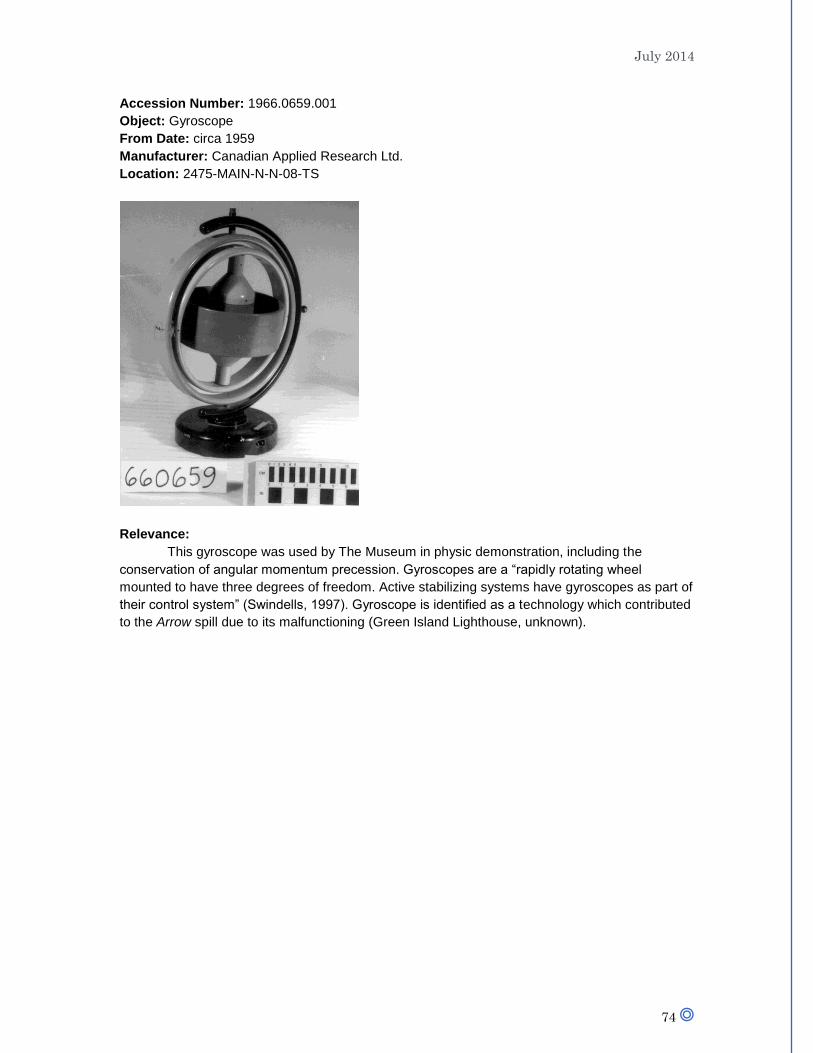
July 2014
74
Accession Number: 1966.0659.001
Object: Gyroscope
From Date: circa 1959
Manufacturer: Canadian Applied Research Ltd.
Location: 2475-MAIN-N-N-08-TS
Relevance:
This gyroscope was used by The Museum in physic demonstration, including the
conservation of angular momentum precession. Gyroscopes are a “rapidly rotating wheel
mounted to have three degrees of freedom. Active stabilizing systems have gyroscopes as part of
their control system” (Swindells, 1997). Gyroscope is identified as a technology which contributed
to the Arrow spill due to its malfunctioning (Green Island Lighthouse, unknown).
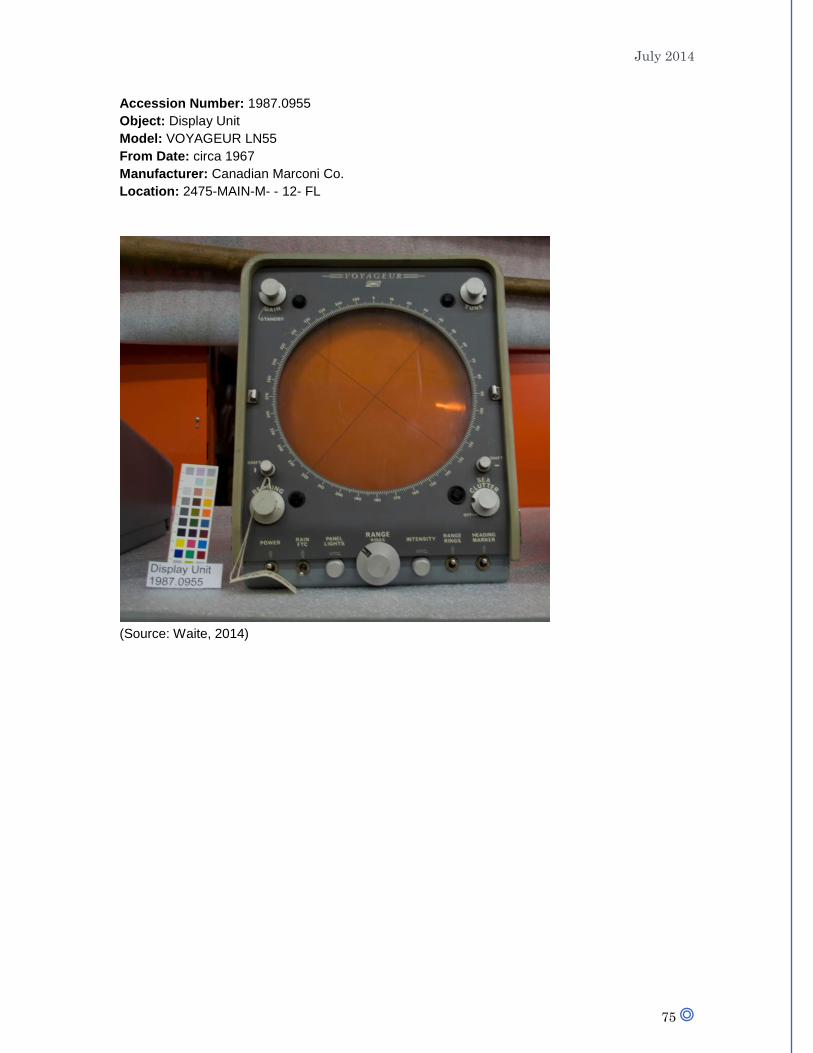
July 2014
75
Accession Number: 1987.0955
Object: Display Unit
Model: VOYAGEUR LN55
From Date: circa 1967
Manufacturer: Canadian Marconi Co.
Location: 2475-MAIN-M- - 12- FL
(Source: Waite, 2014)

July 2014
76
(Source: Waite, 2014)
Relevance:
This is a display unit for a radar system. Radar was one of the technologies discussed in
various oil spills. This system is circa 1969 which is around the time of the Arrow spill. That spill
made note of the malfunctioning technologies onboard the tanker, including radar.
Radar is used to determine the distance and the bearing of objects within the ship’s
range and provide an indication of the size and shape. If the system is not working properly or
ignored by the crew operating the tanker potential threats of collision are missed.
Swindells (1997) explains Radar has “navigational radio waves of a very short
wavelength sent out as narrow beams by highly directional aerial. The aerial rotates sending a
beam out through a full 360o. Any solid object of reasonable size will reflect the beam and be
detected on the radar screen as a bright spot.”

July 2014
77
Accession Number: 1987.0956
Object: Display Unit
Model: VOYAGEUR LN55
From Date: 1969
Manufacturer: Canadian Marconi Co.
Location: 2475-MAIN-M- - 12- FL
(Source: Waite, 2014)
(Source: Waite, 2014)
Relevance:
This is a display unit for a radar system. Radar was one of the technologies discussed in
various oil spills in this report. This system is circa 1965 which is around the time of the Arrow
spill. That spill made note of the malfunctioning technologies onboard the tanker, including radar.
Radar is used to determine the distance and the bearing of objects within the ship’s
range and provide an indication of the size and shape. If the system is not working properly or
ignored by the crew operating the tanker potential threats of collision are missed.
Swindells (1997) explains Radar has “navigational radio waves of a very short
wavelength sent out as narrow beams by highly directional aerial. The aerial rotates sending a
beam out through a full 360o. Any solid object of reasonable size will reflect the beam and be
detected on the radar screen as a bright spot.”

July 2014
78
Accession Number: 1987.0957
Object: Transceiver, radar
Model: VOYAGEUR LN55
From Date: circa 1965
Manufacturer: Canadian Marconi Co.
Location: 2475-MAIN-M- - 12- FL
(Source: Waite, 2014)
Relevance:
This is a display unit for a radar system. Radar was one of the technologies discussed in
various oil spills in this report. This system is circa 1967 which is around the time of the Arrow
spill. That spill made note of the malfunctioning technologies onboard the tanker, including radar.
Radar is used to determine the distance and the bearing of objects within the ship’s
range and provide an indication of the size and shape. If the transmitter is not is not working
properly, for example signals are lost, potential threats of collision are missed. Swindells (1997)
explains Radar has “navigational radio waves of a very short wavelength sent out as narrow
beams by highly directional aerial. The aerial rotates sending a beam out through a full 360o. Any
solid object of reasonable size will reflect the beam and be detected on the radar screen as a
bright spot.”

July 2014
79
Accession Number: 1991.0019
Object: Navigation system, marine
Model: PINS 9000/CD351
From Date: circa 1990
Manufacturer: Barco Industries
Location: 2475-MAIN-R-N-19-A
(Source: Waite, 2014)
Relevance:
This is a Marine Grounding Avoidance System. PINS 9000 system continually monitors a
vessel’s progress and alerts the user to any discrepancies between monitoring equipment and
the system’s prepared charts. This system is a Canadian designed high technology marine
navigation system and regarded as the best and most advance system of its kind.
This demonstrates the technological advancements made in marine navigation and alarm
systems. This type of system has been installed on ships around the world.
There are two accidents that have been pre-programmed into the system that
users are able to view. One of these accidents is Exxon Valdez. The user is able to watch the
route this tanker took on 23-24 March 1989, including the moment of impact with Bligh Reef, as
seen below.
(Source: Waite, 2014)
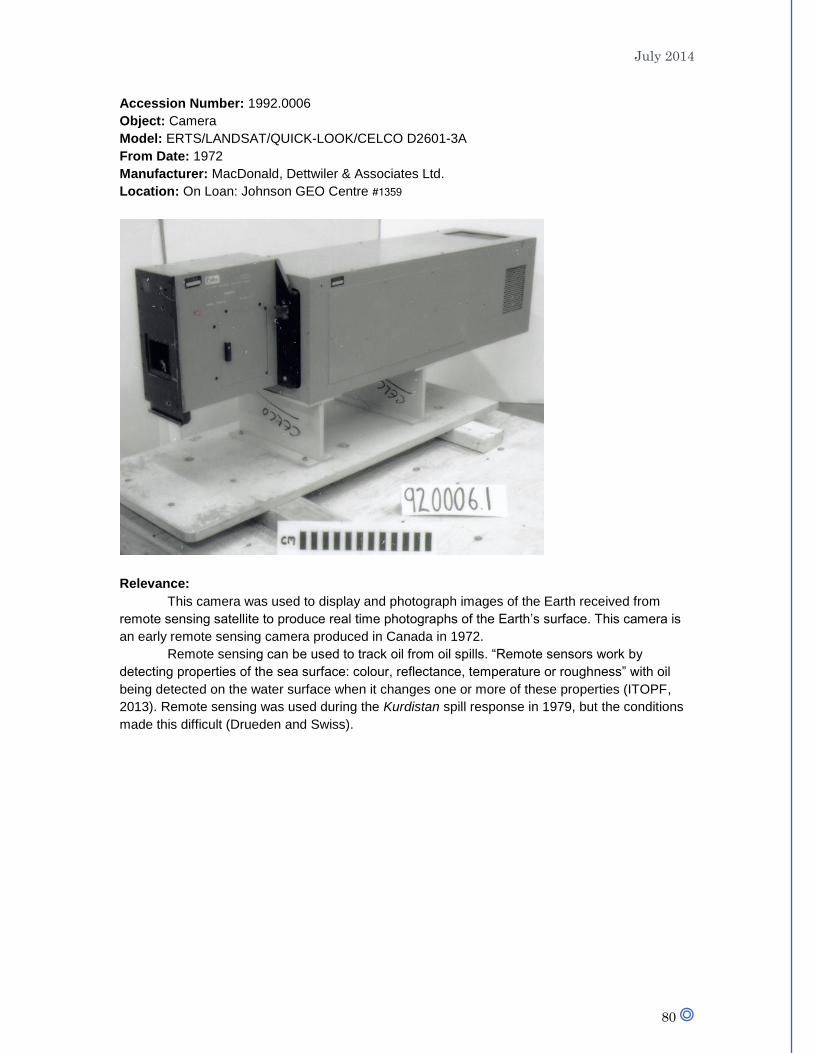
July 2014
80
Accession Number: 1992.0006
Object: Camera
Model: ERTS/LANDSAT/QUICK-LOOK/CELCO D2601-3A
From Date: 1972
Manufacturer: MacDonald, Dettwiler & Associates Ltd.
Location: On Loan: Johnson GEO Centre #1359
Relevance:
This camera was used to display and photograph images of the Earth received from
remote sensing satellite to produce real time photographs of the Earth’s surface. This camera is
an early remote sensing camera produced in Canada in 1972.
Remote sensing can be used to track oil from oil spills. “Remote sensors work by
detecting properties of the sea surface: colour, reflectance, temperature or roughness” with oil
being detected on the water surface when it changes one or more of these properties (ITOPF,
2013). Remote sensing was used during the Kurdistan spill response in 1979, but the conditions
made this difficult (Drueden and Swiss).

July 2014
81
Accession Number: 1991.0509.001
Object: Satellite Model
Name of Model: RADARSAT
From Date: circa 1990
Manufacturer: Advanced Scale Models, Inc.
Location: On Loan: Johnson GEO Centre #1359
Relevance:
This is a model of RADARSAT, which was launched by Canada in November 1995. The
images can be obtained from RADARSAT day or night and without being restricted by cloud
cover. For this reason RADARSAT is able to be used for a variety of reason, including monitoring
an oil spill (Canada Space Agency).
This satellite contains the world’s first operational spaceborne Synthetic Aperture Radar
(SAR). This can be used for aerial observation during oil spills. Unlike, Side-Looking Airborne
Radar (SLAR), and downward looking thermal infra-red (IR) and ultra-violet (UV) detectors or
imaging systems, SAR relies on visible light and may be supplemented by airborne sensors
which can detect oil outside of the visible spectrum. SAR is also not restricted by cloud-cover like
other aerial imaging systems. Highly trained individuals are needed to operate this equipment.
(International Tanker Owners Pollution Federation Ltd, 2013).

July 2014
82
Accession Number: 1997.0024.001
Object: Airplane Model
Name of Model: De Havilland DHC-8 DASH 8
Date: between 1996-1997
Manufacturer: Dean, David J.
Location: AV 194-105-15 ------ D-04
Relevance:
This model represents a DASH-8 airplane. This type of plane currently is used by the
National Aerial Surveillance Program (NASP). In 2003, Transport Canada assumed responsibility
of this program which monitors the Canadian coastlines for oil pollution. Regular aerial
surveillance flights have led to a decrease in oil discharges by ships (Transport Canada, 2013)
NASP consists of three modernized planes. These planes include two DASH-8s (as seen
below), located in Moncton, NB and Vancouver, BC and one DASH-7 which is located primarily in
Ottawa, ON, but is collocated to Iqaluit NU during the Arctic shipping season. Other aircrafts are
contracted by other Government Departments to supplement NASP (Transport Canada, 2013).
This program was used to monitor the Brigadier General M.G. Zalinski wreck (Fisheries
and Oceans, 2013).
(Source: Transport Canada, 2013)
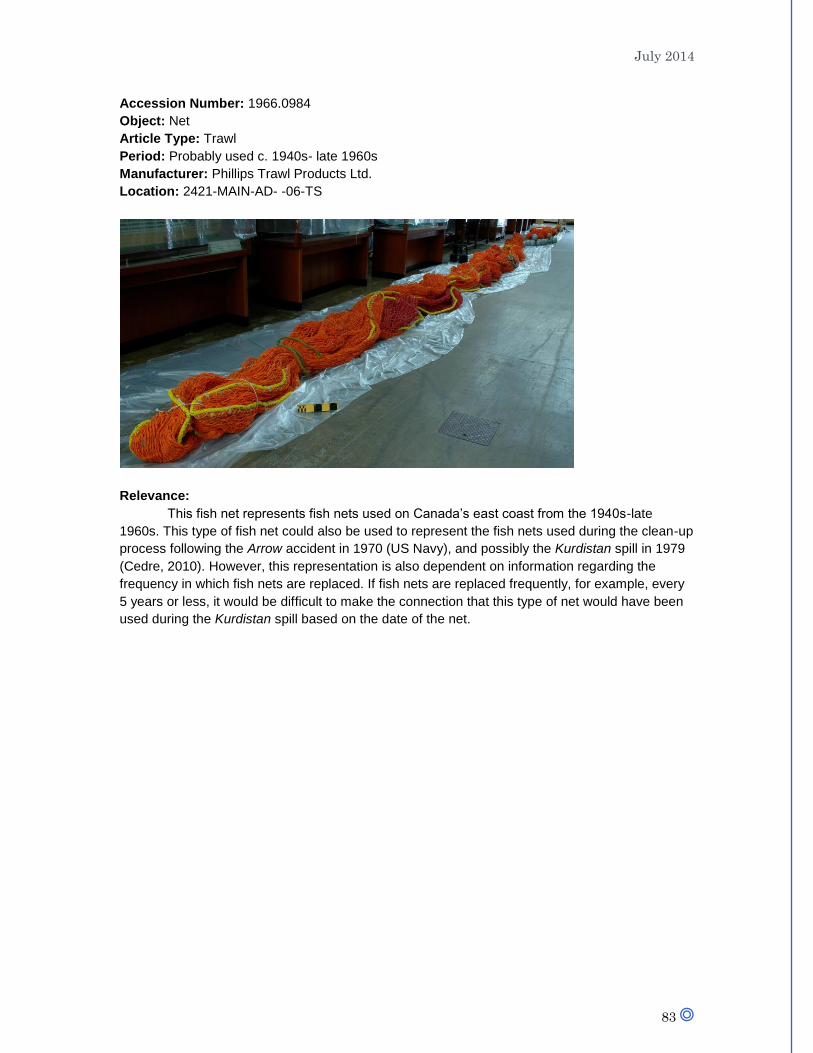
July 2014
83
Accession Number: 1966.0984
Object: Net
Article Type: Trawl
Period: Probably used c. 1940s- late 1960s
Manufacturer: Phillips Trawl Products Ltd.
Location: 2421-MAIN-AD- -06-TS
Relevance:
This fish net represents fish nets used on Canada’s east coast from the 1940s-late
1960s. This type of fish net could also be used to represent the fish nets used during the clean-up
process following the Arrow accident in 1970 (US Navy), and possibly the Kurdistan spill in 1979
(Cedre, 2010). However, this representation is also dependent on information regarding the
frequency in which fish nets are replaced. If fish nets are replaced frequently, for example, every
5 years or less, it would be difficult to make the connection that this type of net would have been
used during the Kurdistan spill based on the date of the net.

July 2014
84
Trade Literature
Catalogue No.: L45774
Call No.: MARIN
Title: Seafarer 5: echo sounder dual range depth indication and alarm facility to 30 metres (16
fathoms) nominal
Publication Date: 1984
Type: Advertisement
Manufacturer: Seafarer Navigation International Ltd.
Relevance:
An echo sounder was included as a technology aboard Exxon Valdez (National
Transportation Safety Board, 1990). Additional research is required to determine the company of
the echo sounder as this is still unknown.
Catalogue No.: L45775
Call No.: MARIN
Title: Seafarer 700 multi-function echo sounder: more depth information, more security, more
peace of mind
Publication Date: circa 1984
Type: Advertisement
Manufacturer: Seafarer Navigation International Ltd.
Relevance:
An echo sounder was included as a technology aboard Exxon Valdez (National
Transportation Safety Board, 1990). Additional research is required to determine the company of
the echo sounder as this is still unknown.
Catalogue No.: L31118.001
Call No.: EXPL
Title: EASI/PACE Remote Sensing Software
Publication Date: circa 1996
Type: Advertisement
Manufacturer: PCI Remote Sensing Corp.
Relevance:
Remote sensing is a method used to track oil slicks following spills (International Tanker
Owners Pollution Federation Limited, 2013).

July 2014
85
APPENDIX B: COLLECTIONS DEVELOPMENT Museum collections built around disasters can be an unsettling notion to the public.
However, disasters are a part of human history; which is the foundation of museum collections. It
is the museum’s responsibility to be aware of this sensitivity when seeking to develop a collection
of this kind (Shayt, 2006).
While this is understood, the objects recommended below are not necessarily associated
with a specific disaster. These items were not used at a specific oil disaster but provide a
representation of technologies developed to aid in oil spill response.
Other items discussed below include oral histories from those who participated in oil spill
recovery and clean-up. These oral histories provide a first-hand account of the event that
occurred and develop a better understanding of the actions that were taken to handle the
recovery and response for specific situations as each oil disaster is unique.
Objects
Object: Ship Model of a Supertanker
Rationale:
The Museum has acquired a large ship model collection. This collection includes two
models of motor tankers to demonstrate the changes in Western ship building. In order to further
demonstrate these changes, it is recommended a model of a supertanker be acquired as would
represent the stage of ship building that followed the motor tanker.
The era of the supertanker meant the end of the three island structure visible on both
motor tanker models. This had been the standard in tanker design for over 60 years (Modern
Marvels, 2004).

July 2014
86
Object: Boom
Rationale:
Booms have been used as oil containment measures since at least the 1950s (Figure 1).
There are different three main types of booms described by National Oceanic and Atmospheric
Administration (2014):
“Hard boom is like a floating piece of plastic that has a cylindrical float at the top and is weighted at the bottom so that it has a "skirt" under the water. If the currents or winds are not too strong, booms can also be used to make the oil go in a different direction (this is called "deflection booming");
Sorbent boom looks like a long sausage made out of a material that absorbs oil. If you were to take the inside of a disposable diaper out and roll it into strips, it would act much like a sorbent boom. Sorbent booms don't have the "skirt" that hard booms have, so they can't contain oil for very long; and
Fire boom is not used very much. It looks like metal plates with a floating metal cylinder at the top and thin metal plates that make the "skirt" in the water. This type of boom is made to contain oil long enough that it can be lit on fire and burned up”
Figure 1: “An early oil containment boom design from the archives U.S. Patent and Trademark
Office (National Oceanic and Atmospheric Administration, 2014).
Alternative:
Companies that supply booms were researched and a low estimated cost is over $600
from AbsorbsentOnline.com. If it is determined this cost is too high or storage space is not
available depending on the size of the boom, an alternative object to acquire would be absorbent
pads or mats. These are less expensive and smaller in size.
July 2014
87
Object: Oil Skimmer
Rationale:
Oil skimmers have been used in clean-up response measures following oil spills. More
research is required to determine the first use of skimmers to remove oil. Oil Skimmers are now
produced by a variety of companies with different designs.
Oral History
Oral History: Dr. E.H. Owens
Rationale:
Dr. E.H. Owens was a Research Officer with the Canadian Hydrographic Service when
Arrow ran aground in 1970. He was seconded to the “Operation Oil” response team to help with
shoreline clean-up. The years following the Arrow spill, Dr. Owens has been involved in a range
of oil-spill related activities including: on-site operational support, training, the development of
field response manuals, and academic research. He provided technical support following the
Nestucca oil spill, designing a systematic shoreline oil documentation procedure for Environment
Canada. After the Exxon Valdez disaster, he was the Technical Advisor to Exxon’s Shoreline
Clean-up Advisory team (SCAT) for three years (Owens, 2002).
Over 200 courses on 5 continents have been taught by Dr. Owens on oiled shoreline
response. He pioneered the use of aerial videotape surveys in the 1980s for shore zone mapping,
coastal inventories and oil spill countermeasures planning. He has also written field guides for
shoreline protection and treatment. Dr. owns has also developed spill response strategies for
remote operations (Owens, 2002).
Presently, Dr. Owens is President of Owens Coastal Consultants (OCC). This is company
is part of a large international network and provides scientific and technical support for spill
response operations and spill response training and planning (Owens Coastal Consultants,
unknown).
Contact Information:
Owens Coastal Consultants
755 Winslow Way East, Suite 205
Bainbridge Island, Washington 98110 USA
Edward H. Owens, Ph.D.
Mobile: 206-369-3679
Phone: 206-451-4818
Email: [email protected]

July 2014
88
Oral History: David DeVilbiss and/or Bas Coppes
Rationale*:
David DeVilbiss is Vice President of Marine Casualty and Emergency Response Services
at Global Diving, one of the companies contracted to assist with oil recovery from Brigadier
General M.G. Zalinski in 2013. The recovery of oil from a vessel which sank 67 years prior was a
unique operation not done in Canada before.
Bas Coppes is the President and Director of Mammoet Salvage Americas. This company
was also involved in the recovery operation. Bas Coppes has been quoted by Drouin (2014)
discussing difficulty of pumping the oil from the wreck.
Associated Oral History:
The oral history of at least diver should also be collected. This would provide a first-
person account of the experience the diver had during this operation. The names of individual
divers are unknown. David DeVilbiss might be able to provide this information
Associated Archival Material:
This operation also required special breathing equipment had to be designed for divers. It
would be assumed design drawings were created during the development of this apparatus. If
these designs are available, it is recommended The Museum acquire them as well.
Contact Information:
Global Diving & Salvage Inc.
David DeVilbriss
Email: [email protected]
Mammoet Salvage Americas
(Only a general email address is available)
E-mail: [email protected]
*It would be preferred that a Canadian Coast Guard team member’s oral history be collected,
however during the research process the Canadian Coast Guard spokesperson, Dan Bate, was
quoted in interviews. While this person could be contacted it is unknown how involved he was in
this recovery operation.

July 2014
89
Publications
Publication: Popular Science
Apr 1970
158 pages
Vol. 196, No. 4
ISSN 0161-7370
Rationale:
This issue includes the article “Anti-Pollution Machine Laps Up Oil Slicks”. This article
discusses a machine called the Oilevator, this is a slick-licker. The article references the inventor
Richard Sewell, the scientific officer for the Canadian Defence Research Board in Esquimalt,
British Columbia. The notes produced by M.P. Gordon Aiken during his visit to Chedabucto Bay
following the Arrow oil spill referenced Richard Sewell as the inventor of the slick-licker (Library
and Archives Canada,)
The article discusses how the machine functions and its use in oil spills. The article also
included information about the Oilevator being commercial available by the Vancouver company,
Bennett International Services Ltd, for $7,500.
Conference
Conference: Oil Spill Technology Workshop
Rationale:
The Oil Spill Recovery Institute will be hosting this workshop one year following the
anticipated funding is received; funding is expected to begin 01 July 2014. “The objective is to
support a workshop that brings together developers, spill responders, response coordinators, and
oversight agency personnel to identify mechanisms that can improve the probability that new
technology and research efforts lead to a product that will be adopted for spill response” (Oil Spill
Recovery Institute, 2014).
It is recommended that at least staff member attend this workshop. This provides the
opportunity for the continuation of this research and to explore state-of-the-art technologies
currently being developed.
Contact Information:
More information regarding this workshop may be obtained from:
Oil Spill Recovery Institute
P.O. Box 705
Cordova, AK 99574
Dr. Scott Pegau
OSRI Research Program Manager
Phone: 907-424-5800 x222
Email: [email protected]