Embed Size (px)
Citation preview
Receptiveness to Advice, Cognitive Ability, andTechnology Adoption ∗
Bradford L. Barham Jean-Paul Chavas Dylan FitzLaura Schechter
December 7, 2017
Abstract
We construct a model of technology adoption with agents differing on two dimen-
sions: their cognitive ability and their receptiveness to advice. While cognitive ability
unambiguously speeds adoption, receptiveness to advice may speed adoption for indi-
viduals with low cognitive ability, but slow adoption for individuals with high cognitive
ability. We conduct economic experiments measuring US farmers’ cognitive ability and
receptiveness to advice and examine how these characteristics impact their speed of
adoption of genetically modified (GM) corn seeds. The empirical analysis shows that
early adopters are those who are both quite able cognitively and not receptive to advice.
Keywords: technology adoption, learning, receptiveness to advice, responsiveness to
advice, advice-taking, cognitive ability, economic experiments, genetically modified seeds.
JEL: D22, D83, O33.
∗The first, second, and fourth authors are professors at UW Madison’s Agricultural and Applied Eco-nomics department while the third author is a professor at Lawrence University’s Economics Department.We thank Anukriti, Rachel Heath, Melanie Khamis, Annemie Maertens, Mark Rosenzweig, Chris Udry,Shing-Yi Wang, Eric Weese, and seminar participants at Oxford, Stanford-SITE, University of Connecticut,University of Georgia, University of Houston, University of Maryland, University of Toronto, Wesleyan, andYale for thoughtful comments. We thank Vanessa Rıos-Salas for help programming and running the games.We are grateful for a USDA AFRI grant and a USDA Hatch grant for funding this research. Correspondingauthor: Laura Schechter, [email protected], Phone: 608-262-9482, Fax: 608-262-4376.
1

1 Introduction
The diffusion of new technologies is a key contributor to economic growth, and differences in
technology use account for much of cross-country inequality (Comin & Hobijn 2010, Klenow
& Rodrıguez-Clare 1997). Limited access to credible information has been shown to be a
major deterrent to technology adoption (Jack 2013). And yet, recent studies also find that
increased advice and information sometimes have small impacts on technology adoption
(Karlan et al. 2015, Ryan 2015).
The potential under-performance of advice and information provision may, in part, arise
because individuals are unable to process information effectively and/or they are not recep-
tive to advice. How these two dimensions interact is not well understood. Previous studies
focus on how adoption is shaped by the identity of the advice-giver (Banerjee et al. 2013,
Beaman et al. 2015, Kim et al. 2015, Maertens 2017) and how best to incentivize advice-givers
(BenYishay & Mobarak 2015).
While there is significant research looking at the ideal identity and incentives of advice-
givers, there is much less research on differential receptiveness of advice-receivers. Coffman
& Niehaus (2015) find that the literature’s focus on the advice-givers (in their setting these
are the sellers) may not be well-placed. They find that “buyer fixed effects explain more
of the variation in our data than do seller fixed effects, product fixed effects, and order
effects combined.” Given this result, they argue that “it may be as important to understand
what makes a person persuadable as to understand what makes them persuasive” and “the
evidence for persuadable types is stronger than the evidence for persuasive types” (emphasis
as in the original). Recent papers in the experimental literature have shown that individual-
level receptiveness to advice is stable across settings (Ambuehl & Li 2015, Buser et al. 2016,
Coffman & Niehaus 2015) but technology adoption studies have not explored this character
trait.
This article addresses this gap by examining which individuals are most receptive to ad-
vice and how receptiveness interacts with cognitive ability to shape the patterns of adoption
of a profitable technology. Specifically, we present a Bayesian technology adoption model
in which individuals vary on two dimensions: cognitive ability and receptiveness to advice.
Individuals with high cognitive ability are good at ‘learning from doing,’ which in the model
means they interpret the signals they get from experimentation with higher precision. Indi-
viduals who are highly receptive to advice are good at ‘learning from advice,’ which in the
model means they have a subjective belief that the advice signal they receive is more precise.
Advice influences technology adoption when individuals respond to advice. Thus, when
2

analyzing advice taking, we distinguish between two related concepts: responsiveness, a
measure of how much the individual changes his prior when presented with advice; and
receptiveness, the focus of this paper, a measure of how precise an individual believes advice
to be. Our model shows that responsiveness to advice depends on both cognitive ability and
receptiveness, and so our paper focuses on those two traits as more fundamental determinants
of technology adoption.
Consistent with previous empirical findings on schooling and cognitive ability (Aldana
et al. 2011, Feder et al. 1985, Foster & Rosenzweig 2010), the model predicts that high cog-
nitive ability individuals will adopt before low cognitive ability individuals. The model also
reveals that being receptive to advice can slow adoption for high cognitive ability individu-
als, because these individuals have greater incentives to wait for additional information from
others.
As in Liu’s (2013) research on GM cotton diffusion in China, we combine experimental
evidence gathered from farmers with survey data on their technology adoption practices to
test the model’s predictions empirically. We designed a game that allows us to estimate both
cognitive ability and receptiveness to advice. This incentivized game is a variant of a typical
“advice-taking” experiment found in the industrial and organizational psychology literature.
Bonaccio & Dalal (2006) offer a review of this class of games.
First, to measure the farmer’s cognitive ability, we have him play multiple rounds of an
individual learning game in which he learns about how a signal translates into an outcome.
All else equal, individuals who have higher cognitive ability (i.e., those who are better at
learning from doing and those who interpret their signals with more precision in the individ-
ual learning game) will have more accurate predictions by the end of the first game. Next,
to measure responsiveness and receptiveness to advice, we have each participating farmer
play multiple rounds of an advice-taking game in which he predicts the outcome, is given
the prediction of a more experienced player, and is given the opportunity to change his
prediction.
Many studies compare actual behavior with optimal behavior and show that individuals
are not as receptive to advice as they ought to be (Stone & Zafar 2014, Weizsacker 2010).
Other studies measure receptiveness multiple times or in multiple ways and show that it is a
stable character trait which varies across people. Ambuehl & Li (2015), Buser et al. (2016),
and Peterson et al. (1965) find that individuals have heterogeneous levels of receptiveness to
information that is consistent within individual across games.1 In Buser et al. (2016) this trait
1Similarly Moore & Healy (2008) find that overprecision (excessive precision in one’s beliefs) has high
3
predicts entry into a competitive task. Receptiveness to advice is correlated with personality
traits such as agreeableness and dependency (Dalal & Bonaccio 2010), expressivity (Feng &
MacGeorge 2006), and autonomy (Koestner et al. 1999). Consistent with our results, others
find that women are more responsive to advice than men2 (Dalal & Bonaccio 2010, Feng
& MacGeorge 2006, Mesoudi et al. 2014), providing further evidence that receptiveness to
advice has a substantive ‘fixed’ component.
We find that individuals with higher cognitive ability are less responsive to advice, as
predicted by the theory; but they are more receptive to advice (a relationship about which
there is no theoretical prediction). This result stresses the importance of distinguishing
between responsiveness (how much the individual’s beliefs change in response to advice) and
receptiveness to advice (how precise the individual believes the advice to be).
The empirical results support the predictions of the model showing that, conditional on
farmers’ underlying cognitive ability, being receptive to advice does not necessarily speed
adoption of a good technology. While it tends to speed adoption for low cognitive ability
individuals, it also slows adoption for high cognitive ability individuals.
We are not the only researchers to suggest that being receptive to information has a
differential effect on low versus high cognitive ability individuals. In a very different setting,
Buser et al. (2016) show that being ‘conservative’ (the opposite of being receptive to infor-
mation) increases the payoffs of high cognitive ability subjects but decreases the payoffs of
low cognitive ability subjects.
For research purposes, focusing on the timing of adoption for a technology which is su-
perior for virtually all decision-makers is an ideal setting. In the United States, genetically
modified (GM) corn fits that description. Since the introduction of GM corn seeds in 1996,
there has been almost universal adoption by US farmers (Fernandez-Cornejo 2010) with al-
most no sustained disadoption. GM technology has contributed substantively to agricultural
productivity, increasing mean yields and reducing variability (Chavas et al. 2014, Qaim 2009,
Shi et al. 2013). It has also reduced time and management costs associated with pest and
weed control. While GM technology generated significant improvements over traditional
seeds, it remains an open question why some farmers jumped in immediately yet others
waited years to adopt.
test-retest reliability. Cesarini et al. (2009) find that overconfidence (in this case the difference betweenactual rank on a cognitive ability test and the individual’s estimate of his rank) is correlated within bothmonozygotic and dizygotic twin pairs suggesting overconfidence is due to both genetic and environmentalfactors (with more due to genetics).
2Relatedly Niederle & Vesterlund (2007) and references therein show women are less overconfident thanmen.
4

Farmers get information from a myriad of sources including agricultural extension agents,
seed dealers, and their peers. Most research in this area focuses on one specific information
source. Birkhaeuser et al. (1991) review the impacts of agricultural extension agents (which
are usually publicly provided by the state) and find mixed but generally positive impacts,
though the endogeneity of engaging with extension makes many of the results hard to in-
terpret. A later review by Picciotto & Anderson (1997) encourages increasing the role of
private sources of information. Other papers find that individuals learn from peers in the
adoption and management of new technologies (Banerjee et al. 2013, Conley & Udry 2010,
Dupas 2014, Foster & Rosenzweig 1995, Miguel & Kremer 2007).
We only know of one other paper exploring which farmers are most likely to seek out and
use advice. Cole & Fernando (2016) find that more educated Indian farmers are more likely
to seek out advice from a mobile-phone based agricultural consulting service. They take this
as evidence of a digital divide since it may be easier for more educated farmers to navigate
the service. Farmers do change their behavior after receiving the consulting services, but
observed changes in behavior do not vary with education. The fact that more educated
individuals are more likely to use the service but are no more likely to actually change their
behavior may suggest that, conditional on using the service, less educated individuals are
more likely to change their behavior.
Our empirical analysis offers new insights into the role of advice in technology adoption.
Our approach is novel in several ways. First, instead of studying how endogenous choices
such as conversations with seed dealers or placement of extension agents impact adoption,
we look at farmers’ underlying receptiveness to advice. Second, we investigate how farmers
incorporate information more generally rather than focusing on one specific source (e.g.,
seed dealers, extension agents, or peers). This makes it easier to identify the role played by
receptiveness to advice. Finally, while much of the most relevant adoption literature is from
developing countries, we use farm-level data from the developed world where education levels
and school quality are relatively high. This reduces the potential range of variation in our key
experimental measures likely to be accounted for by differences in participants’ educational
backgrounds. Based on these unique features, this paper makes new contributions to our
understanding of the process of technology adoption.
We investigate the linkages between these experimental measures of cognitive ability and
receptiveness to advice and the timing of GM corn adoption in the real world. One of our
key findings relates to the interactions between cognitive ability and advice receptiveness. As
predicted by the theoretical model, our empirical evidence shows that the earliest adopters
5

have high cognitive ability. We also find that for high cognitive ability individuals, being an
advice taker actually slows adoption.3
The paper is organized as follows. Section 2 presents a model of technology adoption,
with a focus on the roles of cognitive ability and receptiveness to advice. Section 3 presents
the GM technology, games, and survey data. Section 4 discusses the measurement of both
cognitive ability and receptiveness to advice in our games. Section 5 analyzes the link be-
tween cognitive ability and receptiveness to advice in the experiment and actual adoption
decisions made by the farmers on their farms. Section 6 probes correlations between ex-
perimental measures of receptiveness to advice and answers to survey questions regarding
information use and on-farm experimentation. Finally, section 7 concludes.
2 Model and Intuition
We present a model of technology adoption which shows how cognitive ability and receptive-
ness to advice interact to influence timing of adoption. Specifically, this model predicts that
having high cognitive ability speeds adoption for all individuals. Having a high receptiveness
to advice may slow adoption for high cognitive ability individuals, but speed adoption for
lower ability individuals.
The intuition behind the result is that individuals exhibiting high cognitive ability but low
receptivity to advice rely more on their own experimentation to give them a relatively clear
idea about the new technology. Because these individuals believe that external advice will
be relatively uninformative, their main way to reduce uncertainty about the most profitable
way to implement the new technology is to learn by doing. Thus they jump in early.
On the other hand, individuals exhibiting high cognitive ability and high receptivity to
advice believe that they will receive informative advice signals in the future from which they
can learn the best way to implement the new technology. They are then more likely to
strategically wait, free ride and learn more about the idiosyncrasies of the technology from
the earlier adopters. When they do finally adopt after a delay, they will use the technology
3We did not pre-register our experiments both because we did not run an RCT and because this was notcommon back in 2011. But, in looking to our original grant application we list the following two testablehypotheses: “1, cognitive ability contributes to hasten learning and stimulate adoption” and “2, sociallearning is more effective than individual learning among individuals with lower cognitive ability.” Thusthe focus on the interactive effects of cognitive ability and receptiveness to advice follow directly from ouroriginal hypotheses. The fact that ‘social learning’ (being receptive to advice) is not only more effective forindividuals with low cognitive ability, but slows adoption for high cognitive ability individuals was discoveredin the data and in the model ex-post.
6

more profitably without having to engage in as much low productivity experimentation.
Thus, for individuals with high cognitive ability, those who are receptive to advice will delay
more than those who are not.
For farmers with low cognitive ability, opposite results can hold. Low-ability individuals
know that their own experimentation will yield low information content and so they rely on
advice signals to decide when it is worthwhile adopting. Less receptive individuals do not
believe these external signals to be very informative, so they learn very slowly about the crop
and are late adopters. On the other hand, low-ability high-receptive individuals believe that
they are receiving relatively precise advice signals and so incorporate information regarding
the crop more quickly. For individuals with low cognitive ability, being receptive to advice
may speed adoption.
Our conceptualization of ‘learning from advice’ differs slightly from the ‘learning from
others’ analyzed in Foster & Rosenzweig (1995) and Bandiera & Rasul (2006). In those
models, when a farmer’s neighbors plant the crop, the farmer can observe his neighbors’
input and output and deduce the target from that. This may be reasonable in developing
countries such as India and Mozambique where farmers live nearby one another and can
easily monitor their neighbors’ plots, but this does not necessarily mirror how farmers in the
US receive information. Farmers in the US do not directly observe the inputs and outputs of
neighboring farmers. Instead they receive advice from a myriad of sources including extension
agents and neighbors. Thus, we study ‘learning from advice’ and assume individuals receive
one piece of advice from external sources at the end of each growing season.
2.1 Model Set-Up
This model follows the target-input model first laid out by Jovanovic & Nyarko (1996) and
Foster & Rosenzweig (1995). Here we closely follow the formulation in Bardhan & Udry
(1999) and Bandiera & Rasul (2006). A farmer must decide whether to continue to use a
traditional technology or to adopt a new technology. If used correctly, the new technology is
known to produce higher output than the traditional technology. But, there is one parameter
of the production function of the new technology, here called the target, which is unknown.
Output of farmer i in period t is higher the closer the farmer’s input, kit, is to the unknown
target, κit, with output defined as qit = 1 − (kit − κit)2. After the crop is harvested, the
farmer can deduce the value of κit in that period. The target is a random variable defined
by κit = κ∗ + µit where µit ∼ i.i.d. N(0,σ2ui
). We assume, as does the rest of the literature,
that while κ∗ is unknown, σ2ui
is known. We also make the simplifying assumption that the
7

input is costless.
In period 0, before the new technology is available commercially, the farmers have beliefs
about κ∗ which are distributed N(κ∗0, σ2κ0
). Once the technology is available, there are two
ways in which the farmer can learn. One is ‘learning by doing.’ The farmer can plant the
new technology himself and learn from his own experimentation. In every period in which
the farmer plants the new technology and harvests output, he gains one observation of κit
which has variance σ2ui
. The other way the farmer can learn is ‘learning from advice.’ For
every period in which the seed is commercially available, the farmer receives an advice signal
κit. The farmer subjectively believes this signal to have variance σ2vi.
In terms of ‘learning from doing,’ we model individuals with high cognitive ability as
having a lower σ2ui
. This means that they interpret the signals from their own experimentation
with more precision. High cognitive ability individuals are better able to calculate and
interpret the signal which derives from their experimentation and so their signal is more
precise.
In terms of ‘learning from advice,’ we model individuals who are highly receptive to
advice as having a lower σ2vi
. We consider it to be a fixed character trait in the same way
Ambuehl & Li (2015) do; more receptive farmers perceive the signal they receive from others
to be more informative. It will become clear as the exposition progresses that it would be
isomorphic to instead assume that everyone receives an advice signal with the same precision
but that more receptive individuals receive more of these signals. Throughout the model,
the number of advice signals received is multiplied by the precision of those advice signals.
So, more receptive individuals can either receive more signals, or believe the signals to be
more precise, or both.
Assuming Bayesian updating, the variance of farmer i’s beliefs at the beginning of period
t is
σ2κit
=1
ρ0 + It−1ρui + St−1ρvi. (1)
Here ρ0 = 1σ2κ0
, ρui = 1σ2ui
is the precision of the signal associated with ‘learning by doing’
(cognitive ability), ρvi = 1σ2vi
is the precision of the signal associated with ‘learning from
advice’ (receptiveness to advice), It−1 is the number of previous periods in which the farmer
himself planted the new technology, and St−1 is the number of previous periods in which the
new technology was commercially available and so the farmer received an advice signal.
8

2.2 Expected Output
If the farmer adopts the new technology, he chooses as his input level his expectation of the
target, so he chooses kit = Et(κit).4 Expected output is Et(qit) = 1 − Et[Et(κit) − κit]2 =
1 − σ2κit− σ2
ui. We can take first derivatives of expected output with respect to different
quantities to gain useful insights. First we see that learning by doing increases expected
output.∂Et(qit)
∂It−1=
ρui(ρ0 + It−1ρui + St−1ρvi)
2> 0 (2)
Similarly, learning from advice also increases expected output.
∂Et(qit)
∂St−1=
ρvi(ρ0 + It−1ρui + St−1ρvi)
2> 0 (3)
We can also look at the effects of two individual characteristics: cognitive ability and recep-
tiveness to advice. We see that both individuals with higher cognitive ability and individuals
who are more receptive to advice have higher expected output
∂Et(qit)
∂ρui=
1
(ρui)2
+It−1
(ρ0 + It−1ρui + St−1ρvi)2> 0 (4)
∂Et(qit)
∂ρvi=
St−1(ρ0 + It−1ρui + St−1ρvi)
2> 0. (5)
2.3 Farmer’s Adoption Decision
Although we have shown that both cognitive ability and receptiveness to advice lead to
higher expected output, it does not necessarily follow that they will speed adoption. We
now evaluate the effects of these individual characteristics on timing of adoption. At the
beginning of each period, the farmer faces a discrete choice to plant his farm in the new crop,
in which case ait = 1, or to plant the traditional crop, in which case ait = 0. The traditional
crop has known riskless returns q. In any period t the farmer faces the following problem:
Vt[It−1, St−1] = maxait∈{0,1}
(1− ait)q + aitEtqt[It−1, St−1] + δVt+1[It, St] (6)
4In section 4.2, when we estimate, ρvi , our empirical measure of receptiveness to advice, we will takeadvantage of the fact that with a normal distribution the expectation of the target equals a weighted sumof the farmer’s posterior beliefs and the signals he receives, and the weights are functions of the precisionsof the two.
9
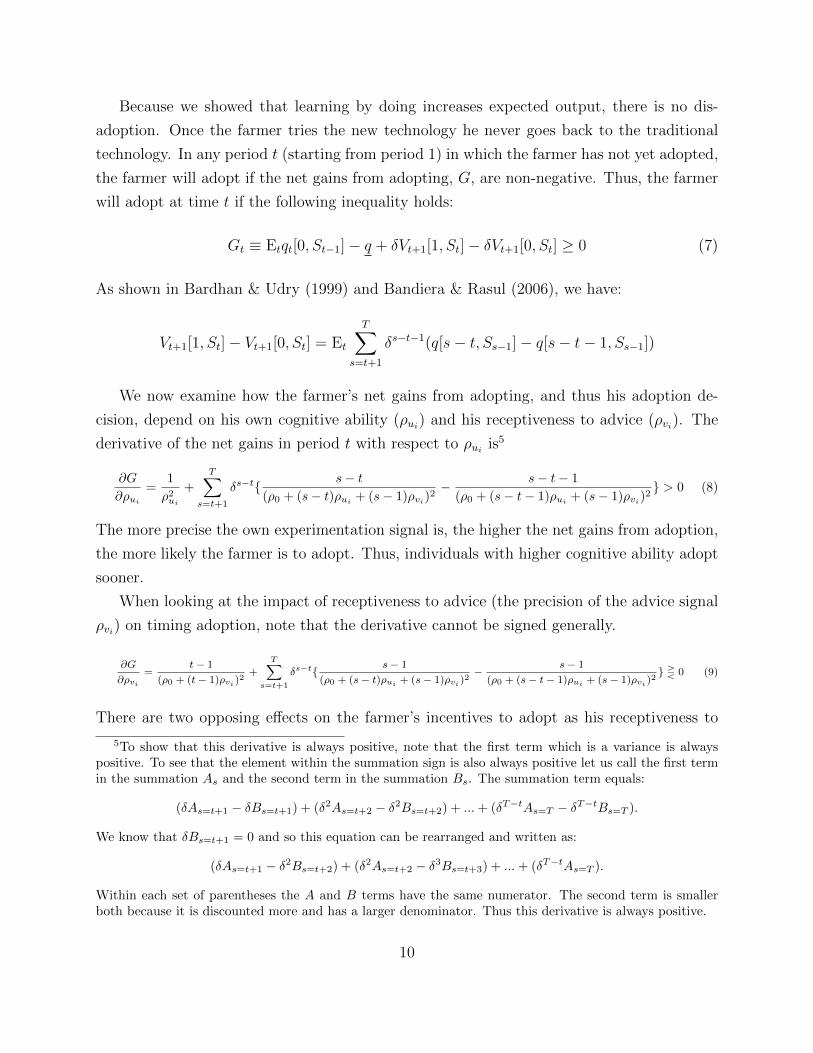
Because we showed that learning by doing increases expected output, there is no dis-
adoption. Once the farmer tries the new technology he never goes back to the traditional
technology. In any period t (starting from period 1) in which the farmer has not yet adopted,
the farmer will adopt if the net gains from adopting, G, are non-negative. Thus, the farmer
will adopt at time t if the following inequality holds:
Gt ≡ Etqt[0, St−1]− q + δVt+1[1, St]− δVt+1[0, St] ≥ 0 (7)
As shown in Bardhan & Udry (1999) and Bandiera & Rasul (2006), we have:
Vt+1[1, St]− Vt+1[0, St] = Et
T∑s=t+1
δs−t−1(q[s− t, Ss−1]− q[s− t− 1, Ss−1])
We now examine how the farmer’s net gains from adopting, and thus his adoption de-
cision, depend on his own cognitive ability (ρui) and his receptiveness to advice (ρvi). The
derivative of the net gains in period t with respect to ρui is5
∂G
∂ρui
=1
ρ2ui
+
T∑s=t+1
δs−t{ s− t(ρ0 + (s− t)ρui
+ (s− 1)ρvi)2− s− t− 1
(ρ0 + (s− t− 1)ρui+ (s− 1)ρvi)
2} > 0 (8)
The more precise the own experimentation signal is, the higher the net gains from adoption,
the more likely the farmer is to adopt. Thus, individuals with higher cognitive ability adopt
sooner.
When looking at the impact of receptiveness to advice (the precision of the advice signal
ρvi) on timing adoption, note that the derivative cannot be signed generally.
∂G
∂ρvi=
t− 1
(ρ0 + (t− 1)ρvi )2+
T∑s=t+1
δs−t{s− 1
(ρ0 + (s− t)ρui + (s− 1)ρvi )2−
s− 1
(ρ0 + (s− t− 1)ρui + (s− 1)ρvi )2} R 0 (9)
There are two opposing effects on the farmer’s incentives to adopt as his receptiveness to
5To show that this derivative is always positive, note that the first term which is a variance is alwayspositive. To see that the element within the summation sign is also always positive let us call the first termin the summation As and the second term in the summation Bs. The summation term equals:
(δAs=t+1 − δBs=t+1) + (δ2As=t+2 − δ2Bs=t+2) + ...+ (δT−tAs=T − δT−tBs=T ).
We know that δBs=t+1 = 0 and so this equation can be rearranged and written as:
(δAs=t+1 − δ2Bs=t+2) + (δ2As=t+2 − δ3Bs=t+3) + ...+ (δT−tAs=T ).
Within each set of parentheses the A and B terms have the same numerator. The second term is smallerboth because it is discounted more and has a larger denominator. Thus this derivative is always positive.
10
advice increases. On the one hand, the more receptive he is, the higher his profitability
will be in the current period which encourages him to adopt. On the other hand, the more
receptive he is, the greater are his strategic incentives to delay adoption and wait to receive
more advice signals. A farmer with high cognitive ability who is not receptive will not see
his uncertainty regarding the correct level of the target input decrease if he delays adoption.
Thus, he might as well begin to experiment with the new technology to benefit from learning
by doing. In contrast, a farmer with high cognitive ability who is receptive to advice can learn
more by delaying and waiting to get advice from others. This will reduce his uncertainty
about the correct level of the target input, and make his adoption decision a more profitable
one at a later date.
This derivative can be positive for low levels of cognitive ability (ρui) and negative for high
levels of cognitive ability. This would imply that being receptive to advice slows adoption for
high cognitive ability individuals but speeds adoption for low cognitive ability individuals.
3 The Setting, Games, and Survey
Experimental and survey data were collected in early 2012 from farmers at the Wisconsin
Corn and Soybean Conferences and the Wisconsin Corn/Soy Expo. Using the list of partici-
pants invited to and/or signed up for these events, we recruited farmers through the mail and
with phone calls. The Corn and Soybean Conferences are half-day events conducted by UW
Extension in locations across the state. The Corn/Soy Expo is a two-day event sponsored
by the Wisconsin Corn Growers’ Association and the Wisconsin Soybean Association and
conducted in the Wisconsin Dells. Farmers come from across the state and may bring their
family to enjoy a vacation as well as the educational opportunities and the industry trade
show.
The farmers in our sample are more likely to be full time farmers than the average
Wisconsin farmer and they manage more acres of cropland than the average. This is likely
due to the fact that these farmers were recruited at events put on by extension agents and
growers’ associations to keep farmers up-to-date. Although our sample may not represent the
general population of Wisconsin farmers, which includes a larger share of part-time farmers,
our participants are more representative of the full-time commercial farmers who dominate
acreage and production and whose decisions are most important when we consider adoption
and total output from US agriculture.
Before showing the summary statistics of our sample in section 3.4, we discuss GM corn
11

technologies in section 3.1, the games in section 3.2, and the survey in section 3.3.
3.1 GM Corn Seed Technology
As noted in the introduction, since 1996 GM technology has had a significant impact on
agricultural productivity. GM corn seed is an ideal technology to study because over the
course of twenty years, adoption rates went from 0% to close to 100%. This implies that
adoption was the ex-post optimal choice. Moreover, widespread adoption of GM corn was
not associated with major shifts in the composition or agrarian structure on US corn farms.
There was substantial heterogeneity in terms of how long different farmers took to adopt,
and yet the transition from no to full adoption took place within the lifetime of farmers. GM
seeds were released commercially in 1996. As measured by area planted, the US adoption
rate for GM corn was 25 percent in 2000, 52 percent in 2005, and was estimated at 93 percent
in 2014 (Fernandez-Cornejo 2010).
While the universal adoption of GM corn seeds suggests that the technology is better
than conventional seed, academic studies have analyzed how GM changes the distribution
of output. Shi et al. (2013) find that GM corn yields have lower variance, higher skewness
(lower downside risk), and lower kurtosis (thinner tails). Qaim (2009) reviews the literature
and finds that GM seeds tend to increase yields and decrease spending on inputs (such as
labor, pesticides, and fuel).
Surveys of Wisconsin farmers undertaken in 2001 and 2003 by researchers at the Program
on Agricultural Technology Study (PATS) provide complementary evidence on farmers’ views
of GM corn technologies at the time (Chen et al. 2001, Merrill et al. 2005). Adopting farmers
reported that yield gains; reduced pesticide, herbicide, and labor costs; and improved pest
and weed management were key motivations for adopting. Recommendations from seed
dealers, consultants, neighbors, and extension agents were also cited as reasons for adopting.
For this study, we assume that the adoption decision made by farmers is based on produc-
tion/profit considerations and does not involve anti-GM sentiment or concerns. Although
there is some negative opinion towards GM among consumers, this is not the case among our
sample of producers. In our survey not a single farmer disagreed somewhat or strongly with
the following statement, and only 7% said they were neutral: “Agricultural biotechnology
makes most farm families better off.”
Of course this is what they say now, but what might be more relevant is what they
thought when these technologies first became available. In his frequent newsletters, Joe
Lauer, a WI extension agent and one of the premier experts on corn seed performance in
12

the state, only discussed concerns regarding difficulties selling GM seeds in a single year. In
1999, he stated that all GM varieties can be used as feed and are accepted in the US but
not all are acceptable for export, and thus some elevators may not be accepting GM corn.
Much of the corn grown in Wisconsin is used as feed for livestock, so this would be less of a
worry for those farmers. In the 2001 and 2003 PATS surveys mentioned above, non-adopters
were asked reasons they didn’t adopt. The most common reasons were the high price of the
seeds, and not anticipating having problems with pests or weeds. Lack of familiarity with
the seeds, and difficulties marketing GM seeds were also mentioned by some farmers.
3.2 Games
All participating farmers attended a session consisting of two parts. First were the incen-
tivized games, with a series of games measuring risk aversion, ambiguity aversion, cognitive
ability, and receptiveness to advice. The farmers also completed a digit span exercise to
provide an additional measure of cognitive ability. The games were conducted on computers
programmed with the software z-Tree (Fischbacher 2007). The second part was a pen and
paper survey on demographic and farm characteristics and a history of GM seed use. The
session generally took less than 2 hours to complete and farmers earned an average of $51
from the choices they made in the games and were reimbursed for travel costs on top of that.
Upon arrival, the 10% of farmers who were not familiar with computers or wanted a
refresher received a brief computer training which consisted of instruction regarding how to
point and click and how to type responses to questions. During the sessions, instructions were
read aloud and also appeared on the farmers’ computer screens. All farmers participated in
the games at the same time and they were not allowed to communicate with one another.
We also provided paper-based copies of the instructions for farmers to refer to. We did not
supply pens until the surveys were handed out after the completion of the games. The games
were incentivized and payoffs were determined after the completion of all of the games.
For the learning game, we built upon a game designed by psychologists Harvey & Fischer
(1997).6 We first ran an individual learning game before introducing the opinion of an advisor
in order to study receptiveness to advice. The entire game protocol can be found in Appendix
6Before the learning and advice-taking games, the farmers participated in a multiple-price list experimentmeasuring risk aversion. Though this is not the focus of our paper, we do include risk aversion as a controlin the regressions since it has often been hypothesized to be a determinant of technology adoption. Everyfarmer had to make 10 decisions between a sure payoff and a lottery. These decisions were made all at oncerather than sequentially. The sure thing involved a certain payoff of $10 while the payoff for the lotterydepended on the color of chip drawn out of a bag. Only one decision per game affected their earnings andthat decision was determined at the end of the session.
13

A. More details follow, but the basic setup of the game is as follows. Farmers looked at circles
of differing sizes and colors and had to guess the numerical outcome measure. They did this
with 25 different circles and after each circle they were told the right answer so that they
could learn more about the deterministic algorithm which related the circle to the outcome
measure. Subsequently they played a slightly different game, involving the same algorithm,
with another 25 circles. This time, after looking at the circle the farmer first stated his own
perception of the outcome. Next he was told the perception of a more experienced player
and was given the chance to change his answer. All answers were incentivized such that
players earned more money the closer their answer was to the true outcome.
As in Harvey & Fischer (1997), we framed the game by stating that there is a disease
outbreak killing cattle. We focus on cattle because it is something with which the farmers in
our study are familiar, while also not being too close to the crop-based focus of our survey.
Farmers were told that the severity of the outbreak depended on the color and size of a circle
presented on the screen. The government makes an inspection to determine how many cattle
will die in order to determine farmer compensation and this is what the farmers are learning
to do.7
In the first round, the farmers knew nothing about how the number of dead cattle was
determined other than the ranking of the three colors from least to most dangerous. Based on
each circle, farmers provided a guess of the number of cattle they thought would die from the
disease outbreak and after each round the farmer was told how many cattle actually died. In
this way the farmers could learn more about how the disease worked. The true relationship
was calculated using the following deterministic equation Dead Cattle = Color ∗ πr2 where
Color=2, 1, 0.5 for red, green, and blue, respectively and r is the radius of the circle. The
farmers were not told that the number of dead cattle is a linear function of the area of the
circle. All farmers saw the same series of predetermined circles which did not depend on
previous responses.
Participants were not informed of the underlying algorithm but were able to improve their
estimates based on the feedback they were given when told the correct answer. This was
repeated for 25 rounds, which provided sufficient opportunity for figuring out the underlying
algorithm. Results in Harvey & Fischer (1997) suggest that participants figure out the
7One might worry that if farmers take the framing seriously they may inflate their estimates so that thefarmers receive higher compensation. This seems unlikely both because they know the game is fictitious andbecause they are incentivized such that they earn more money the closer their guess is to the correct answer.As a robustness check in our empirical analysis we do control for whether livestock are part of the farmer’senterprise.
14

average relationship by the third block of ten rounds. In our games, the players figure out
the relationship more quickly, with improvements slowing after fifteen rounds. The faster
calibration in our games is most likely due to the fact that we told the players the ordering
of the colors from most to least severe. It may also be due to differences in screen quality,
familiarity with computers and computer games, and the specific circles chosen. In Harvey
& Fischer (1997), after practice the participants reach an average absolute percentage error
(APE - or the absolute difference between the prediction and the truth, divided by the truth)
of approximately 30%. Our farmers do better, with an average APE of around 20% by the
fifteenth round. Figure 1 depicts the average APE among all farmers for each round.8 As
expected, we see that the average APE decreases over time as farmers guesses improve. After
approximately fourteen rounds, the error rate appears to plateau.
The game was incentivized and one of the 25 rounds was chosen to count for payoffs.
The payoffs were such that a correct estimate earned $50 while an incorrect estimate earned
$50 divided by the absolute difference between the estimate and the truth.9 The farmer was
told exactly how payoffs would be determined at the beginning of the game, and after each
round the farmer was shown the correct number of cattle that perished and the payoffs he
would receive if that round were chosen. The average winnings in this game were $11.50 and
ranged from 57¢ to $50.
Following this individual learning game, we completed an advice-taking game that utilized
the same context and the same algorithm translating the signal (circle size and color) to state
(number of dead cattle) with two major differences: we no longer provided correct answers,
thus ending the learning process, and we introduced a recommendation from an advisor in
order to enable the measurement of receptiveness to advice.
In our advice-taking game, participants were told the following: “In this second part
8Figure 1 excludes round 1 of the individual learning game due to the fact that individuals had noinformation before this round and so guesses were pure noise. APEs for round 1 are an order of magnitudehigher than for subsequent rounds. The uptick in round 25 is probably due to the fact that the circle inround 25 was the largest which appeared over the course of the entire 50 rounds but for the least dangerouscolor, and a handful of individuals performed extremely badly.
9We chose this scoring rule because it is always positive and it is easy to understand. Many other morecommon scoring rules would not have consistently yielded non-negative payoffs. For example, a quadraticscoring rule has many good properties and yields strictly non-negative payoffs when the belief being elicitedis a probability which is bounded between 0 and 1. In our case, such a rule might pay the farmer $50 minusthe square of the difference between the estimate and the truth which could be negative since the numberof cattle which die is not bounded from above. Our scoring rule places a heavy incentive on supplying anumber which is within one of the truth, since the player earns $50 for such answers, and payoffs quicklydecline as the answer gets further from the truth. A good rule of thumb for the farmer might be to guessthe mode of his beliefs.
15
of the game, you will use your training to make forecasts of how many cattle will die in
current outbreaks. Obviously you can receive no information about the accuracy of these
assessments because cattle are still dying. However, after making your assessment, you will
be told the views of someone who participated in a similar game with us on an earlier day,
but who received 100 rounds of training with this type of exercise rather than the 25 rounds
of training you received. After getting this information, you will be given the opportunity
to revise your original forecast. Do not feel obliged to make use of this information. It is up
to you whether you take it into account.”
Thus, in this advice-taking game, a different circle was again presented, individuals made
an initial guess regarding how many cattle they thought died, the advisor’s guess for that
specific circle was offered, and individuals then made a final guess. This was again repeated
for 25 rounds but the correct answers were no longer provided, meaning that there was no
further learning during these rounds and that we could isolate a measure of receptiveness to
advice.10 The screen shots shown in Appendix A may help clarify how the game worked. In
this second game the average winnings were $17.44 and ranged from 5¢ to $50.
Figure 1 showed that learning plateaus by Round 14, and so a participant might not
expect the predictions of an advisor who received 100 rounds of training to be any better than
his own predictions having received 25 rounds of training. Even so, the farmer’s prediction
and the advisor’s prediction are two noisy signals regarding the true number of cattle which
perished. An individual using Bayesian updating should incorporate both numbers when
making his final guess.
We did not tell the participants any additional details about the individual whose advice
we showed them. In fact, we had twenty faculty, staff, and graduate students play this game
for 100 rounds in which they were told the correct answers, and then a subsequent 25 rounds
in which they were not. The circles the farmers saw were those used in the final 25 rounds.
The advice given to the farmers came from the individual who performed best on average
across the 25 circles. We later show evidence that, on average, no farmer outperforms the
advisor. The advice in the game was not intended to mimic real-world advice which comes
specifically from an expert (e.g., a crop consultant or extension agent) or from a peer (e.g.,
a neighboring farmer). Instead, it was meant to mimic externally provided advice from any
source.
10Bikhchandani et al. (1998) review models of learning from choices made by peers. When an advisorreceives a signal and makes a decision (as in our game), the participant will only learn from the advisor’sdecision if the participant does not also see the signal. In our case because the participant views the signalitself, he will not learn anything additional from the advisor’s decision.
16

Many psychology papers study how experimental variations shape the propensity of par-
ticipants to take advice. The advisor’s level of experience, the advisor’s level of confidence,
the number of advisors, the incentives associated with the decision, and whether the par-
ticipant solicited the advice all shape the degree to which advice is taken into account (see
Bonaccio & Dalal (2006) for an overview).
3.3 Survey Data
After the games, all farmers completed a survey which, in addition to asking about demo-
graphic and farm characteristics, included retrospective questions about the farmers’ use
of GM seed in corn production. In particular, farmers were asked in what year they first
adopted GM corn.11
Participants also performed a digit span exercise testing short-term or working memory.
In this exercise, they saw a number for the same number of seconds as the quantity of digits
of that number. Then, they were asked to re-enter the number they had just seen. This
exercise started with three-digit numbers and continued up to a maximum of 11 digits. If
a farmer made a mistake at a certain level, he was given a second chance with a different
number. After the second mistake at the same level, the exercise ended. Digit span is a sign
of sequential processing ability that measures how able a person is to take in and process
information in an orderly fashion (Dempster 1981). It is a standard measure of cognitive
ability because it is relatively easy to measure. But, it is not the main measure used in
our empirical analysis below both because it cannot be directly compared to the measure
of receptiveness to advice and because our measure captures how individuals take in and
process new information rather than pure memorization. In section 4.3 we do, however,
examine its correlation with our experimental measure of cognitive ability.
3.4 Summary Statistics
Table 1 provides summary statistics of the survey and cognitive information among the
farmers in our final sample.12 All of these farmers have planted corn and 96% of them have
planted GM corn. This adoption rate (at the farmer level) is comparable to the state average
11The specific question was: “In what year did you first plant genetically modified (GM) corn? (Pleaseenter a number between 1996 and 2011.)” Thus no dates were reported before 1996. Farmers often plantmultiple types of corn and so this does not imply the farmer exclusively planted GM corn.
12One farmer cheated on the digit span, writing down the numbers on a piece of paper by his side with apen he had brought. He is dropped in regressions when digit span is included.
17

(at the acreage level), which in 2011 was 86% (Fernandez-Cornejo 2010). In 2011, farmers
in our sample had planted GM corn for an average of 10.9 years.
There has been almost no disadoption. Of the 127 farmers in our sample who had
previously planted GM corn, there are three who planted only non-GM corn in 2011. We
do not know if this is a permanent disadoption, or if this is a temporary choice due to crop
rotation since we only ask about the most recent year (2011) and the first year of adoption.
Farmers in our sample operated an average of 947 acres of cropland in 2011; 15% of those
surveyed report that in 2011 farming was not their principal occupation; and the average
years that participants have made decisions on the farm is 26.13 The average age of our
participants is 51, there are four females, and the average household size at the time of the
survey is three. A quarter of participants (26%) received a high school degree or less and
went no further. The average digit span is 7.5 with a standard deviation of 1.6, which is
on-par with Miller’s (1956) findings that an average adult has a digit-span of seven (plus or
minus two).
4 Measuring Cognitive Ability and Receptiveness to
Advice
Learning is at the heart of the process of technology adoption. Before a new technology is
available, individuals have no or scant information. As time goes, they learn about the new
technology. As noted above, there are two main avenues for learning: learning from doing,
where agents use the new technology and learn from the results; and learning from advice
by which they receive advice from relevant professionals and peers.
In the following subsections of section 4 we will first discuss issues of measurement: how
we measure cognitive ability and receptiveness to advice. Next we will look at how cognitive
ability and receptiveness to advice are related to one another and to survey measures of
education and cognitive ability. In section 5 we will look at how the two correlate with
real-world technology adoption of GM corn.
13For comparison, in the 2012 Wisconsin Census of Agriculture, 50% of farmers report that farming is nottheir principal occupation and the average cropland among all farmers is 131 acres.
18
4.1 Cognitive Ability
In each round t the farmer becomes better at translating the given color severity and circle
area x into a numeric determination of how many cattle died, Y . The farmer’s prediction is
determined by: Yt = βtxt + ut. With each subsequent round the farmer can better calibrate
the value of the true β. In each round there is an error, u, for example because the farmer
converts the signal to his belief of the outcome incorrectly. If we assume that β and u are
uncorrelated, which seems reasonable, then: var (Y ) = x2var (β) + var (u). As the farmer
gets better at calibration, x2var (β) will go to 0 and so after enough periods the variance in
the prediction will equal the variance of the error term (var (Y ) = var (u)). Thus, according
to the model, the variance of the prediction error after the farmer has determined β would
summarize farmer cognitive ability.14 In Section 2 we modeled cognitive ability as being
the precision of the individual signal, ρu = 1/σ2u or one over the variance, and here we will
proceed similarly.
We calculate our measure of cognitive ability as follows. We create the error term ut by
subtracting the true number of cattle which died from the farmers’ guesses in the individual
learning game. The farmer knows exactly what this error is, because at the end of each
round he is told the true number of cattle which died and is reminded of his answer. We
calculate the variance of this error for each farmer in the last ten rounds of the learning
game, after they have determined β.15 We then take the inverse as our measure of cognitive
ability and precision, ρu (and multiply by 100 for scaling). As seen in Table 1, the average
own precision in the last ten rounds is 0.40 and is distributed as shown in the histogram in
Figure 2a where higher precision signifies higher cognitive ability.
4.2 Receptiveness to Advice
We combine the individual learning game and the advice-taking game to calculate a measure
of receptiveness to advice for each individual. In the model in section 2, ρv is the perceived
precision of advice. By comparing the farmer’s initial guess in the advice-taking game, the
advice he receives, and his final guess, we can calculate the Bayesian weight the farmer
places on advice, which we call the farmer’s responsiveness to advice. According to Bayesian
updating with a normal distribution, this weight equals αv = ρv/(ρv + ρu). From this it is
14We have explored farmer heterogeneity in the round the variance plateaus, but this measure of calibrationspeed is not significant in predicting technology adoption.
15In the first session (affecting 20 out of 132 observations) the circle for round 24 did not appear on thescreen. Thus we exclude this round, and create our measure using rounds 15 to 23 and 25 for all farmers.
19
clear that individuals with high cognitive ability (high ρu) will be less responsive to advice
(because their own prior is quite precise), while more receptive individuals (high ρv) will
change their guess by more (because they believe the advice signal to be quite precise). Here
we distinguish between receptiveness to advice, ρv, which we define as the character trait
such that a person believes that the precision of advice is high; and responsiveness to advice,
αv, which we define as the choice the individual makes regarding by how much to change his
initial guess in response to advice.
Before calculating our measures of responsiveness and receptiveness to advice, we first
show that farmers would be well-served by taking the advice. We show that the APE error
rate of the advice is quite low and the precision of the advice is quite high. The average APE
over all players and over all 25 rounds before receiving advice is 0.20, and after receiving
advice is 0.10. The advisor’s average APE over all 25 rounds is 0.06. Table 1 showed that the
average precision over all farmers is 0.4 with a maximum of 2.9, while the advisor’s precision
is 3.3.
While some individuals outperform the advisor in certain rounds, no individual’s initial
guess APE mean is lower than that of the advisor. Thus, on average, before receiving advice,
no individual performs better than the advisor. However, after taking advice, 11 individuals
do achieve lower average APEs than the advisor. Appendix Figure 1 shows the APEs for
each of the 25 rounds for the advice itself, for the farmers’ initial guesses, and for the farmers’
final guesses. Collectively, this provides evidence that the advisor is worth paying attention
to and that individuals stand to improve their performance if they take advice.
To measure responsiveness to information, we estimate the weight placed on advice using
the Bayesian framework laid out in Section 2. According to Bayesian updating, the final
estimate (F ) should be a weighted average of the initial estimate (I) and the advice (A). The
two weights should sum to 1. We estimate these weights using a regression-based approach
similar to that employed by Lim & O’Connor (1995).16 We make a 25 round panel for
each participant in the advice-taking game and regress the final estimate (F) on the initial
estimate (I) and the advice (A):
Ft = αuIt + αvAt + εt
where t denotes rounds and αu and αv capture the weights on initial guesses and advice
16Bonaccio & Dalal (2006) also describe several papers that utilize regression-based models in similarcontexts, including Phillips (1999) and Brehmer & Hagafors (1986).
20

respectively. We restrict αu and αv to sum to 1 and to each be between 0 and 1.17
Once we have estimates of ρu (from the individual learning game as discussed in the pre-
vious subsection) and αv (from the advice-taking game as discussed above) for each farmer,
we can solve for each farmer’s receptiveness to advice using this equation αv = ρv/(ρv + ρu).
There are two individuals who always place 100% weight on the advice signal, making it
impossible to solve for ρv since ρu is never zero. For these two individuals we set their
receptiveness to advice to equal that of the farmer with the highest solvable receptiveness
measure.
Table 1 summarizes the measures of responsiveness (Bayesian advice weight) and recep-
tiveness (perceived precision) to advice. The average responsiveness is 0.62, indicating that
individuals place slightly more weight on the advice than their own initial guesses. Two
individuals (out of 132) place all weight on their initial guesses while two individuals place
all weight on the advice, and the remaining individuals have intermediate values. The fact
that only two individuals just copied the advice and two individuals stuck to their initial
guess suggests that individuals were engaging with the games and putting effort into the
task.
Figure 2b presents a histogram of responsiveness. In terms of specific decisions, in 4%
of cases the initial guess, the advice, and the final estimate are all equal. In 8% of cases
the player switches away from his (different) initial estimate to have a final estimate equal
to the advice, and in 22% of cases the player sticks with his initial estimate even though
the advice is different. In the remaining cases the individual either gives a final guess which
is somewhere between his initial guess and the advice (63% of the time), or gives a final
guess which is outside of the range of his initial guess and the advice (3% of the time).
Table 1 shows that the average perceived precision of advice is 1.24, approximately three
times higher than the own precision. The advice’s true precision is 3.3, with most players
underestimating the precision of the advice. We will show in section 6 that our experimental
measure of receptiveness to advice is correlated with survey measures of receptiveness in the
real-world.
To calculate the Bayesian weight and the perceived precision of advice, we use data from
all 25 rounds of the advice-taking game under the assumption that the perceived precision of
advice does not change over the 25 rounds. Participants never learn the correct value in this
game so they cannot learn whether the advice is of good quality. Still, their perception of
17Gars et al. (2015) also construct a similar measure of advice utilization. They find that both farmingability and the precision of farmers’ prior beliefs (what they call confidence) determine how farmers changetheir inputs in response to receiving recommendations resulting from soil tests.
21

the advice might change over the 25 rounds. We explore whether the weight the respondent
puts on the advice increases or decreases over time and find that for 41% of the people
the weight decreases and for 59% of the people it increases over time. When combining all
individuals, the slope is slightly positive but far from significant. Thus, in our main analysis
we assume that individuals’ perceptions of the quality of advice does not change over time,
and we focus on their average weighting of advice. We run robustness checks which exclude
either earlier or later rounds or which use our measure or responsiveness (the advice weight)
rather than our measure of receptiveness. For a more detailed discussion of the absence of
learning in the measure of receptiveness to advice and the results of the robustness checks,
see Appendix B.
The benefit of our measure of receptiveness to advice, ρv, is that it is directly linked with
the model in section 2 and that it nets out the fact that individuals with high cognitive
ability may be disinclined to follow advice since the precision of their own prior is high. On
the other hand, the functional form relies on the assumption of the normality of the error
term. Thus, we also run robustness checks using the measure of responsiveness to advice,
αv, which is just the weight placed on the advice when updating, and does not rely on any
assumptions.
4.3 Linking Cognitive Ability and Receptiveness to Advice
We now evaluate the correlates of cognitive ability and receptiveness to advice. We start in
columns (1) and (2) of Table 2 by looking at the correlation of cognitive ability as measured
using own precision in the experiment with our survey based measures of education and
cognitive ability. Attending college is not significantly correlated with the precision of the
prior measured in the games but farmers who perform better in the digit span exercise have a
more precise prior in the individual learning game, with a one standard deviation increase in
the digit span leading to a 0.24 standard deviation increase in the precision of their prior. In
column (3) we add many additional control variables including demographics, land size, and
risk aversion and find that none of the control variables are significantly correlated with our
experimental cognitive ability measure, nor do they detract from the significant correlation
22

between digit span and our ability measure.1819
These results suggest that our experiment does measure cognitive ability and also suggests
that, at least for Wisconsin farmers, schooling is not as useful a measure of ability as more
specific measures of cognitive ability. In fact, in results not shown here we tried other
measures of education including having a two-year college degree, having a four-year college
degree, and having received some post-graduate education. The education variable we show
here (an indicator variable for having a high school diploma or less) is the one which comes
closest to being significantly correlated with ability and, later, with technology adoption.
While many papers in a developing country context find that education is correlated with
ability and technology adoption (Foster & Rosenzweig 2010), this correlation may be less
strong in developed countries where farmers have higher average education levels.
In columns (4) through (6) we look at correlates of our measure of responsiveness to advice
(Bayesian weight placed on advice) while in columns (7) through (9) we look at correlates of
our measure of receptiveness to advice (perceived precision of advice). In columns (5) and
(6), we find evidence that women are more responsive to advice, a finding which matches the
literature mentioned previously (though one should remember our sample includes only four
women). There is also evidence that older individuals are more responsive to advice, with an
increase in age of ten years leading to a 0.28 standard deviation increase in responsiveness
to advice. We see no significant correlation between acres operated (potentially a proxy for
wealth) and willingness to take advice.
In column (6), we regress responsiveness to advice on own precision while including other
controls. As we suspected, individuals who have a more precise prior do weight advice less
heavily, with a one standard deviation increase in the precision of the farmer’s prior leading
to a 0.25 standard deviation decrease in the weight he places on advice. Strong learners may
be disinclined to follow advice because their own prior is more precise. If individuals are
Bayesian updaters, then those who performed better at the individual learning task should
rationally put a lower weight on the advisor’s advice and a higher weight on their own initial
guess. This aligns with Schiebener et al. (2014) who find that those who perform worse on an
18Given the literature documenting declines in the brain’s processing ability with age, the insignificantimpact of age may be surprising. Note that these regressions simultaneously control for the digit spanmeasure of cognitive ability. When that measure is excluded, the coefficient on age becomes negative andsignificant.
19Risk aversion is commonly posited as a strong determinant of technology adoption, although it onlytangentially enters into our hypotheses regarding the speed of adoption. For all regressions with controls,risk aversion is included. In addition, in Appendix Table 1 we show the correlates of our measure of riskaversion. Neither cognitive ability nor receptiveness or responsiveness to advice is correlated with riskaversion. Males are significantly less risk averse.
23

experimental task, and those with lower levels of working memory and executive functioning,
are most responsive to advice on that task.
Once we account for this by creating our measure of receptiveness, we find in column (9)
that the correlation goes in the opposite direction. Those with higher cognitive ability (higher
own precision) also have higher receptiveness to advice. In this case, a one standard deviation
increase in the precision of the farmer’s prior leads to a 0.30 standard deviation increase in
his receptiveness to advice. It is also the case that those with higher cognitive ability as
measured by the digit span perceive advice to be more precise. It may seem surprising when
looking at columns (7) through (9) how few variables are correlated with receptiveness to
advice. This mirrors findings in Buser et al. (2016) who find that receptiveness is a stable
character trait, but that it is correlated with very few other variables they collected.
As a final set of experimental variables, we categorize individuals as having either high or
low cognitive ability and having high or low receptiveness to advice. These categorizations
are formed using the median value as the cutoff, and they will be useful below when analyzing
real-world technology adoption. Summary statistics in Table 1 show that it is slightly more
common for people to be high in both areas or low in both areas (67% of the population),
though it is also quite common for individuals to have a high value in one field and a low
value in the other (33% of the population).
5 Results: Learning and Technology Adoption
Effective technology adoption relies on learning. However, researchers are limited in their
ability to analyze the impact of learning on technology adoption since learning is highly
individualized and difficult to observe (Barham et al. 2015). By combining experimental
measures of cognitive ability and receptiveness advice with survey data on real-life decisions,
this paper provides an important contribution.
5.1 Survival Model
We use data on the year of adoption of GM corn to estimate survival models that predict
the probability that someone who has not yet adopted subsequently decides to adopt in each
time period. There are two main advantages of modeling the adoption timing decision as a
survival analysis. First, survival analysis takes into account the fact that not all farmers in
our sample had begun making decisions by 1996 when GM technologies first became available.
Second, survival analysis takes into account the fact that not all farmers had adopted GM
24

technologies by the time we collected data, after the 2011 harvest. In robustness checks
described later, we dispense with the survival analysis set-up.
The hazard function, λ(z, t), measures the adoption rate at time t conditional on not
having adopted before time t and conditional on a vector of covariates z. Different specifica-
tions of the hazard function have been proposed in the literature. We focus on the Weibull
distribution because it is commonly used in the literature on technology adoption (Liu 2013,
Saloner & Shepard 1995) but we also show that the main results hold under different distri-
butional assumptions. The Weibull assumes λ(z, t) = e−zβk[e−zβt](k−1) where β is a vector
of parameters capturing the effects of z on the hazard rate. We choose this specific func-
tion because it allows the probability of adoption to either increase or decrease over time.
It includes the exponential distribution as a special case when k = 1, which restricts the
probability of adopting to be constant over time. Evidence that k is greater than 1 implies
that the probability of adopting increases with time.
In our analysis, t represents years in which a farmer could have adopted GM corn. The
first farmers using GM corn adopted in 1996 yet the younger farmers in our sample were not
yet farming at that time. For those who were already farming by 1996, we set the earliest
possible year of GM adoption to be 1996. For those who began farming after 1996, their
first year making decisions on a farm was treated as the earliest possible adoption year.
The survival analysis takes into account that the data are censored, in that not all farmers
have adopted by 2012, since it estimates a probability of adoption in each year. We include
fixed effects for calendar year to control for climatic events and news which came out about
the seeds at different points in time. We also include crop reporting district (CRD) fixed
effects to control for local agro-climatic conditions that may influence the adoption decision.
Standard errors are robust to heteroskedasticity.
Our survival analysis models the probability of adopting in any year, with a higher
value reflecting earlier predicted adoption. In Table 3 we show the hazard ratios (which are
necessarily positive) for the different control variables and test whether these hazard ratios
are significantly different from one. A hazard ratio greater than one signifies that the variable
hastens adoption, while a hazard ratio of less than one is associated with slower adoption.20
We present several model specifications in Table 3. In columns (1) and (2), we include
only the survey measures of cognitive ability: education and digit span. In column (3)
we control for the two experimental measures: the own precision and the advice perceived
20This is different from other regression techniques such as ordinary least squares where tables presentcoefficients and tests of whether they are significantly different from zero.
25
precision, to capture the impact of an individual’s cognitive ability and his receptiveness to
advice. We re-run these estimations in column (4) adding standard covariates in adoption
models such as individual demographic variables, farm size, and risk aversion.
We study the interplay between receptiveness to advice and cognitive ability in two ways.
We control for the interaction of the two continuous variables in columns (5) and (6). Because
of difficulties in interpreting the hazard ratio on the interaction of two continuous variables
we use the categorization of individuals into four groups and control for the individuals’
category (with low cognitive ability/low receptiveness to advice being the excluded category)
in columns (7) and (8) (Greene 2010).
The fact that results are robust to this categorization eases concerns on two fronts.
The histograms in Figure 2 show that there are some outliers with respect to the continuous
measures of cognitive ability and receptiveness to advice. In addition, in column (9) of Table
2 we saw that cognitive ability is correlated (significant at the 10% level) with receptiveness to
advice. This might make one worry that the interaction term could be picking up an inverted-
U shaped relationship in cognitive ability. The fact that the results when including the binary
categorization measures mirror the results when including the continuous measures and their
interaction shows that the results are due neither to outliers nor to a non-linear impact of
cognitive ability.21
5.2 Results
We now use the data to test the hypotheses which come from our model. First, individuals
with higher cognitive ability are predicted to adopt earlier since their initial prior will be most
precise. Second, being receptive to advice will slow adoption for those with high cognitive
ability, since they are inclined to wait to incorporate advice in their decision making. Third,
being receptive to advice will speed up adoption for low cognitive ability individuals since
they will learn more about the technology in a shorter time span.
Table 3 provides evidence linking farmer characteristics to the timing of the adoption of
GM corn. Individuals with higher schooling are earlier adopters. Our experimental measure
of cognitive ability (own precision) also speeds adoption. There is robust evidence that
cognitive ability is a determinant of the timing of GM corn adoption, while receptiveness to
advice does not seem to have a significant impact on adoption when included on its own.
21We do also show in the next subsection that the results are robust to replacing cognitive ability andreceptiveness to advice with log-like transformations to limit the impact of outliers, and are robust to theadditional inclusion of quadratic terms.
26

Table 3 presents hazard ratios. A hazard ratio greater than one suggests the characteristic
speeds adoption; a hazard ratio less than one suggests the characteristic slows adoption; and
hazard ratios can not be negative.
Cognitive ability and receptiveness to advice are continuous variables whose scales are
not necessarily easy to interpret. Imagine two farmers who have not yet adopted GM corn.
According to the estimates in column (3) of Table 3, if one farmer’s cognitive ability is one
standard deviation higher than that of the other, his likelihood of adopting in a given year
will be 54% higher. If one farmer’s receptiveness to advice is one standard deviation higher
than the other, his likelihood of adopting in a given year will be 10% lower (though this
second impact is not significant).
In columns (5) and (6) we interact the two variables and show that, as hypothesized,
the interaction is significant. Because it is difficult to interpret hazard ratios on interactions
of continuous variables, we show the relationship graphically in Figure 3 as suggested by
Greene (2010). There one can see the impact of receptiveness to advice on the hazard
ratio of adopting for three different values of cognitive ability: the fifth percentile (0.06),
the fiftieth percentile (0.21), and the ninety-fifth percentile (1.72). The figure shows that
being receptive to advice has a steep negative impact on adoption for high cognitive ability
individuals. On the other hand, being receptive to advice has almost no impact on adoption
for low cognitive ability individuals.
Panel A of Appendix Table 2 shows that our results are robust to the inclusion of either
a quadratic term in cognitive ability or a quadratic term in receptiveness to advice. When
including both quadratic terms at the same time, the hazard ratio on the interaction of
interest is no longer significantly different from one at conventional levels, with the p-value
going up to 14%. But, the magnitude of the hazard ratio remains similar. Given the
small sample sizes and multicollinearity we are confident that the interaction term is not
simply picking up an inverted-U shaped impact of cognitive ability on adoption. Panel A of
Appendix Table 2 also shows results when we replace the measures of cognitive ability and
receptiveness to advice with their inverse hyperbolic sine, a transformation similar to the log
transformation but which accommodates values of 0. This suggests that the results are not
due to outliers.
To look at the interaction between these two variables in a simpler manner, in Columns (7)
and (8) of Table 3 we instead include indicator variables for different categories of individuals.
Here we see the same qualitative results as when using the interaction, but in an easier to
interpret format. These columns provide evidence that individuals with high cognitive ability
27
who are not receptive to advice (high own / low advice perceived precision) are the earliest
adopters. All low cognitive ability individuals, as well as high ability individuals who are
receptive to advice are later adopters, with much smaller differences in adoption probability
amongst themselves.
The bottom of the table shows p-values for the one-sided χ2 inequality tests that, for
those with high cognitive ability, those who are less receptive to advice adopt sooner; and
that for those with low cognitive ability, those who are more receptive to advice adopt sooner.
We can reject that highly receptive high ability individuals adopt sooner than do their low
receptive counterparts. But, we can not reject that low receptive low ability individuals
adopt later than do their more highly receptive counterparts.
Our main results modeled adoption timing using survival analysis and assuming a Weibull
distribution for the hazard function, as is common in the literature on technology adoption.
In Panel B of Appendix Table 2 we show that our results are robust to other distributional
assumptions.
As another robustness check (results shown in Appendix Table 3) instead of using survival
analysis, we use linear OLS methods. To do so, we drop the 27% of individuals who either
began making decisions after 1996 or who never adopted GM corn. (There are 25% of
farmers who began making decisions after 1996 and 4% who never adopt, with 2% of farmers
being in both groups.) We can then run a linear OLS regression in which the dependent
variable is years since adopting. While the sample sizes in these regressions are quite a bit
smaller, the evidence that cognitive ability speeds adoption remains strong. When treated
as an interaction in columns (5) and (6) the relationship between cognitive ability and
receptiveness to advice maintains the predicted sign but loses significance. When farmers
are put in categories in columns (7) and (8) the fastest adopters are still those who have
high cognitive ability but low receptiveness to advice.
One might wonder whether the individual who responded to the survey is the one who
has the power to make adoption decisions. We asked the respondents their role on their
farm and 67% claimed to be the primary farm operator, 30% claimed to be a joint operator,
partner, or one of several key decision makers, 1% claimed to be the spouse of the key
decision maker, and 2% claimed to be a hired farm manager with no ownership interest. As
can be seen in Panel A of Appendix Table 4, the qualitative results do not change if one
excludes the 3% in the last two categories, or if one limits the analysis to the 67% in the first
category. The small sample size makes it difficult to delve more deeply into heterogeneity on
this dimension. Future researchers may want to explicitly consider differences between sole
28
and joint decision-making processes.
As another robustness check (results shown in columns (1) and (2) of Appendix Table
5) we consider the full sample but look at an alternate outcome. Rather than timing of
adoption, we look at the answer to the question: “In the past, have you tried new corn seeds
on small plots or parcels?” Similar to results on adoption, it is those who have high cognitive
ability but are not receptive to advice who are most likely to try new seeds on small plots.
A few caveats regarding the results are in order. First, one might worry about reverse
causality. Our analysis uses receptiveness to advice as measured in 2012 to explain adoption
decisions made up to 16 years earlier. A story could be told such that the timing of adoption
of GM seed caused farmers to realize that it is good (or bad) to take advice, thus influencing
their future receptiveness to advice. We think it is unlikely that the experience of adopting
GM corn would lead farmers to change their receptiveness to advice in this experimental
setting, but we cannot prove this with our current data.
Second, there is always a potential for omitted variable bias. In our main regressions
we control for farm and farmer characteristics that are commonly incorporated in adoption
models (education, age, sex, acres of cropland operated, farming not principal occupation,
and years of experience) as well as several additional less common variables (comfort with
computers and risk aversion) and our results are robust to their inclusion. In columns (7) and
(8) of Panel A of Appendix Table 4 we include additional control variables, some of which
may potentially be ‘bad’ controls due to the fact that they are endogenous. We include
household size to proxy for labor availability, an indicator for whether livestock or dairy are
25% of farm income due to the fact that the game was framed around a livestock disease,
acres of cropland owned which should be correlated with wealth, an indicator for whether
the household purchased crop insurance as another measure of risk aversion, total household
income, and the share of household income which came from farming. The results after
adding those additional controls remain strong. Time preference is another variable which
plays a role in the model in Section 2 but for which we do not have a measure. The best
we can do is to control for variables which have found to be correlated with time preference
such as income, sex, education, and age.
Additionally, we might think that heterogeneity in the profitability of GM would affect
timing of adoption. (This is similar in spirit to what is found by Suri (2011) for hybrid
maize adoption in Kenya.) We don’t have a measure of heterogeneous GM profitability per
se, though we do control for crop-reporting district fixed effects which should take care of
much geographic variation. Farm size might proxy for expected profits per acre from GM
29

corn which varies at the farmer level, for example if there is a fixed cost to learning about
the new technology. Still, Table 2 shows that farm size is not correlated with receptiveness
to advice or cognitive ability, which suggests that this source of omitted variable bias should
not impact the hazard ratios on those variables in the adoption regressions.
6 Identifying Real-World Correlates of Receptiveness
to Advice
We have found that our two experimental measures are highly correlated with timing of
adoption. Our experimental measure of cognitive ability was shown to be correlated with
digit span in Table 2. On the other hand, in that same table our experimental measure of
receptiveness to advice was not found to be correlated with any of the common demographic
variables we included. Are there survey measures of receptiveness to advice which correlate
with this experimental measure?
Farmers were asked to rate their confidence in six fixed sources of information. The
options ranged from 1 to 4 with 1 signifying “no confidence at all” and 4 signifying “a great
deal of confidence.” Every farmer rated at least one of the six sources with a 3 or higher.
We create a measure of the farmer’s confidence in external sources which equals the number
of sources in which he places confidence level 3 or 4.22
Columns (3) to (5) of Appendix Table 5 shows that this measure is significantly positively
correlated with receptiveness to advice both when no other control variables are included and
as we add subsequently more controls. Farmers with more confidence in external information
sources are more responsive to advice. That said, in results not shown here, neither the survey
measure itself nor the survey measure interacted with own precision is correlated with timing
of adoption. Thus, while it appears possible to collect similar, simple variables in surveys to
measure individuals’ receptiveness to advice, experimental measures are preferable.
22The sources of information were: a) Other growers or producers; b) Extension agents or state specialists;c) Farm supply or chemical dealer, crop consultant, or advisor; d) Growers’ association; e) Print and electronicinformation sources (internet, newspapers, etc.); and f) Special events, demonstration projects, or F.I.R.S.T.plots.
30

7 Conclusion
New technologies come online continually and individuals who respond most efficiently to
these new advances will be more profitable than those who do not. Individuals can choose to
adopt based on their own perceptions and/or they can rely on advice gathered from external
sources such as their peers or extension agents. These decisions shape the productivity,
growth rate, and income distribution of an economy.
We construct a model of technology adoption in which farmers differ in terms of their
cognitive ability and their receptiveness to advice. This model yields three testable hypothe-
ses. The first is unsurprising; farmers with higher cognitive ability will adopt earlier. The
second and third are perhaps more interesting; being receptive to advice may slow adoption
for high cognitive ability individuals, but speed adoption for low cognitive ability individ-
uals. We combine experimental measures of cognitive ability and receptiveness to advice
with survey measures of the timing of adoption of GM corn to test these hypotheses. As the
model predicts, we find that the earliest adopters are those who have both high cognitive
ability and also are not receptive to advice. It is the interaction of these two characteristics
which is most important, compared to the isolated impact of either characteristic alone.
Maertens (2017) finds that farmers learn most from progressive farmers who adopt im-
mediately without waiting to see what their peers do. But who are these progressive farmers
who adopt without waiting to take advice or learn from others’ experiences? Our results
suggest they are individuals who have high cognitive ability and who have a low receptive-
ness to advice. This is in accord with Lapple & Van Rensburg (2011) who find that early
adopters (‘pioneers’) of organic farming in Ireland are less likely to use advisory information
sources and have less interest in gathering information than do late adopters (‘laggards’).
These results have important implications for targeting promotion efforts in a variety of
contexts. In agriculture, extension agents and seed salesmen should make explicit efforts
to reach out to those farmers with lower cognitive ability who are receptive to advice. Al-
though identifying individuals with these characteristics might require repeated interactions,
repeated interactions are not unlikely given the nature of the promoters’ occupations. In the
context of GM corn and other robust technologies, this could increase income and stimulate
aggregate productivity. Therefore, it would be worthwhile for promoters to build into their
relationships with local farmers ways of identifying the aforementioned traits.
Public health and conservation are two other contexts where promotion efforts could be
informed by this study. In both of these realms, promoters encourage individuals to use new
technologies, change common practices, or undertake additional actions aimed at improving
31

the welfare of their families and community. Identifying individuals who would need and be
likely to use the information is generally a challenge for promoters. However, it is not hard
to imagine incorporating into initial screening conversations tests of receptiveness to advice.
If, as both previous research and the results above suggest, an individual’s receptiveness to
advice has a substantive fixed’ component to it, then these efforts could sharpen the efforts
of health and conservation promoters to target people with lower cognitive skills and higher
receptiveness.
Finally, we offer two reflections for future research. First, our game focuses on recep-
tiveness to advice when advice is given out freely and participants have no choice but to
receive it. We do not look at the relationship between receptiveness to advice and advice
seeking, which may be another fruitful avenue for future research. Second, we studied GM
seeds, a technology that turned out to be advantageous for all and early adopters happened
to have been correct. It is hard to know what we would have found if we were looking at a
new technology which was less positive. Perhaps these farmers would have figured out not
to jump in early, or perhaps they would have adopted quickly and then disadopted quickly.
It would be interesting to study both the adoption and disadoption decisions for a range of
technologies or practices, some of which are highly attractive and others of which are less so.
References
Aldana, U., Foltz, J. D., Barham, B. L. & Useche, P. (2011), ‘Sequential adoption of package
technologies: The dynamics of stacked corn adoption’, American Journal of Agricultural
Economics 93(1), 130–143.
Ambuehl, S. & Li, S. (2015), Belief updating and the demand for information. Unpublished
Manuscript.
Bandiera, O. & Rasul, I. (2006), ‘Social networks and technology adoption in northern
Mozambique’, Economic Journal 116(514), 869–902.
Banerjee, A., Chandrasekhar, A. G., Duflo, E. & Jackson, M. (2013), ‘The diffusion of
microfinance’, Science 341(6144).
Bardhan, P. & Udry, C. R. (1999), Development Microeconomics, Oxford University Press,
Oxford, chapter 12, pp. 152–167.
32

Barham, B. L., Chavas, J.-P., Fitz, D., Rıos-Salas, V. & Schechter, L. (2015), ‘Risk, learning,
and technology adoption’, Agricultural Economics 45, 1–14.
Beaman, L., BenYishay, A., Magruder, J. & Mobarak, A. M. (2015), Can network theory
based targeting increase technology adoption? Unpublished Manuscript.
BenYishay, A. & Mobarak, A. M. (2015), Social learning and incentives for experimentation
and communication. Unpublished Manuscript.
Bikhchandani, S., Hirshleifer, D. & Welch, I. (1998), ‘Learning from the behavior of oth-
ers: Conformity, fads, and informational cascades’, Journal of Economic Perspectives
12(3), 151–170.
Birkhaeuser, D., Evenson, R. E. & Feder, G. (1991), ‘The economic impact of agricultural
extension: A review’, Economic Development and Cultural Change 39(3), 607–650.
Bonaccio, S. & Dalal, R. S. (2006), ‘Advice taking and decision-making: An integrative lit-
erature review, and implications for the organizational sciences’, Organizational Behavior
and Human Decision Processes 101, 127–151.
Brehmer, B. & Hagafors, R. (1986), ‘The use of experts in complex decision-making: A
paradigm for the study of staff work’, Organizational Behavior and Human Decision Pro-
cesses 38, 181–195.
Buser, T., Gerhards, L. & van der Weele, J. J. (2016), Measuring responsiveness to feedback
as a personal trait. Unpublished Manuscript.
Cesarini, D., Lichtenstein, P., Johannesson, M. & Wallace, B. (2009), ‘Heritability of over-
confidence’, Journal of the European Economic Association 7, 617–627.
Chavas, J.-P., Shi, G. & Lauer, J. (2014), ‘The effects of GM technology on maize yields’,
Crop Science 54(4), 1331–1335.
Chen, L., Barham, B. L. & Buttel, F. (2001), Update on the adoption and de-adoption
of GMO crop varieties in Wisconsin, Wisconsin Farm Research Summary 6, Program on
Agricultural Technology Studies, University of Wisconsin, Madison.
Coffman, L. & Niehaus, P. (2015), Pathways of persuasion. Unpublished Manuscript.
33
Cole, S. A. & Fernando, A. N. (2016), Mobile’izing agricultural advice: Technology adoption,
diffusion and sustainability. Unpublished Manuscript.
Comin, D. & Hobijn, B. (2010), ‘An exploration of technology diffusion’, American Economic
Review 100(5), 2031–2059.
Conley, T. G. & Udry, C. (2010), ‘Learning about a new technology: Pineapple in Ghana’,
American Economic Review 100(1), 35–69.
Dalal, R. S. & Bonaccio, S. (2010), ‘What types of advice do decision-makers prefer?’,
Organizational Behavior and Human Decision Processes 112(1), 11–23.
Dempster, F. N. (1981), ‘Memory span: Sources of individual and developmental differences’,
Psychological Bulletin 89(1), 63–100.
Dupas, P. (2014), ‘Short-run subsidies and long-run adoption of new health products: Evi-
dence from a field experiment’, Econometrica 82(1), 197–228.
Feder, G., Just, R. E. & Zilberman, D. (1985), ‘Adoption of agricultural innovations in
developing countries: A survey’, Economic Development and Cultural Change 33(2), 255–
98.
Feng, B. & MacGeorge, E. L. (2006), ‘Predicting receptiveness to advice: Characteristics
of the problem, the advice-giver, and the recipient’, Southern Communication Journal
71(1), 67–85.
Fernandez-Cornejo, J. (2010), Adoption of genetically engineered crops in the U.S., ERS,
USDA, http://www.ers.usda.gov/Data/BiotechCrops/.
Fischbacher, U. (2007), ‘z-Tree: Zurich toolbox for ready-made economic experiments’, Ex-
perimental Economics 10(2), 171–178.
Foster, A. D. & Rosenzweig, M. R. (1995), ‘Learning by doing and learning from others: Hu-
man capital and technical change in agriculture’, Journal of Political Economy 103, 1176–
1209.
Foster, A. D. & Rosenzweig, M. R. (2010), ‘Microeconomics of technology adoption’, Annual
Review of Economics 2, 395–424.
34

Gars, J., Kishore, A. & Ward, P. (2015), Confidence and information usage: Evidence from
soil testing in India. Unpublished Manuscript.
Greene, W. (2010), ‘Testing hypotheses about interaction terms in nonlinear models’, Eco-
nomics Letters 107(2), 291–296.
Harvey, N. & Fischer, I. (1997), ‘Taking advice: Accepting help, improving judgment, and
sharing responsibility’, Organizational Behavior and Human Decision Processes 70, 117–
133.
Jack, K. (2013), Market inefficiencies and the adoption of agricultural technologies in de-
veloping countries, Literature review, Agricultural Technology Adoption Initiative, J-PAL
(MIT) and CEGA (UC Berkeley).
Jovanovic, B. & Nyarko, Y. (1996), ‘Learning by doing and the choice of technology’, Econo-
metrica 64(6), 1299–1310.
Karlan, D., Knight, R. & Udry, C. R. (2015), ‘Consulting and capital experiments with mi-
croenterprise tailors in Ghana’, Journal of Economic Behavior and Organization 118, 281–
302.
Kim, D. A., Hwong, A. R., Stafford, D., Hughes, D. A., O’Malley, A. J., Fowler, J. H.
& Christakis, N. A. (2015), ‘Social network targeting to maximize population behavior
change: A cluster randomized controlled trial’, The Lancet 386(9989), 145–153.
Klenow, P. J. & Rodrıguez-Clare, A. (1997), ‘Economic growth: A review essay’, Journal of
Monetary Economics 40(3), 597–617.
Koestner, R., Gingras, I., Abutaa, R., Losier, G. F., DiDio, L. & Gagne, M. (1999), ‘To
follow expert advice when making a decision: An examination of reactive versus reflective
autonomy’, Journal of Personality 67(5), 851–872.
Lapple, D. & Van Rensburg, T. (2011), ‘Adoption of organic farming: Are there differences
between early and late adoption?’, Ecological Economics 70(7), 1406–1414.
Lim, J. S. & O’Connor, M. (1995), ‘Judgmental adjustment of initial forecasts: Its effective-
ness and biases’, Journal of Behavioral Decision Making (8), 149–168.
Liu, E. (2013), ‘Time to change what to sow: Risk preferences and technology adoption
decisions of cotton farmers in China’, Review of Economics and Statistics 95, 1386–1403.
35

Maertens, A. (2017), ‘Who cares what others think (or do)? Social learning and social pres-
sures in cotton farming in India’, American Journal of Agricultural Economics . Forth-
coming.
Merrill, J., Goldberger, J. & Foltz, J. D. (2005), The adoption of genetically engineered crop
varieties in Wisconsin, PATS Research Report 13, Program on Agricultural Technology
Studies, University of Wisconsin, Madison.
Mesoudi, A., Chang, L., Murray, K. & Lu, H. J. (2014), ‘Higher frequency of social learning
in China than in the West shows cultural variation in the dynamics of cultural evolution’,
Proceedings of the Royal Society of London B 282.
Miguel, E. & Kremer, M. (2007), ‘The illusion of sustainability’, Quarterly Journal of Eco-
nomics 122(3), 1007–1065.
Miller, G. A. (1956), ‘The magical number seven, plus or minus two: Some limits on our
capacity for processing information’, Psychological Review 63, 81–97.
Moore, D. & Healy, P. J. (2008), ‘The trouble with overconfidence’, Psychological Review
115(2), 502–517.
Niederle, M. & Vesterlund, L. (2007), ‘Do women shy away from competition? Do men
compete too much?’, Quarterly Journal of Economics 122(3), 1067–1101.
Peterson, C. R., Schneider, R. J. & Miller, A. J. (1965), ‘Sample size and the revision of
subjective probabilities’, Journal of Economic Psychology 69(5), 522–527.
Phillips, J. M. (1999), ‘Antecedents of leader utilization of staff input in decision-making
teams’, Organizational Behavior and Human Decision Processes 77, 215–242.
Picciotto, R. & Anderson, J. R. (1997), ‘Reconsidering agriculture extension’, World Bank
Research Observer 12(2), 249–259.
Qaim, M. (2009), ‘The economics of genetically modified crops’, Annual Review of Resource
Economics 1, 665–694.
Ryan, N. (2015), Is there an energy-efficiency gap? Experimental evidence on the returns to
efficiency investments for Indian plants. Unpublished Manuscript.
36

Saloner, G. & Shepard, A. (1995), ‘Adoption of technologies with network effects: An empiri-
cal examination of the adoption of automated teller machines’, Rand Journal of Economics
26(3), 479–501.
Schiebener, J., Pawlikowski, M., Wegmann, E. & Brand, M. (2014), ‘Supporting decisions
under risk: Explicit advice differentially affects people according to their working memory
performance and executive functioning’, Neuroscience of Decision Making 1, 9–18.
Shi, G., Chavas, J.-P. & Lauer, J. (2013), ‘Commericalized transgenic traits, maize produc-
tivity and yield risk’, Nature: Biotechnology 31, 111–114.
Stone, D. F. & Zafar, B. (2014), ‘Do we follow others when we should outside the lab?
Evidence from the AP Top 25’, Journal of Risk and Uncertainty 49(1), 73–102.
Suri, T. (2011), ‘Selection and comparative advantage in technology adoption’, Econometrica
79(1), 159–209.
Weizsacker, G. (2010), ‘Do we follow others when we should? A simple test of rational
expectations’, American Economic Review 100, 2340–2360.
37
38
A Screen Shots from the Experiments
1. Introductory screen:
Following this screen one experiment measuring ambiguity aversion and one experiment
measuring risk aversion were played.

39
2. Screens that participants see in the individual learning game:
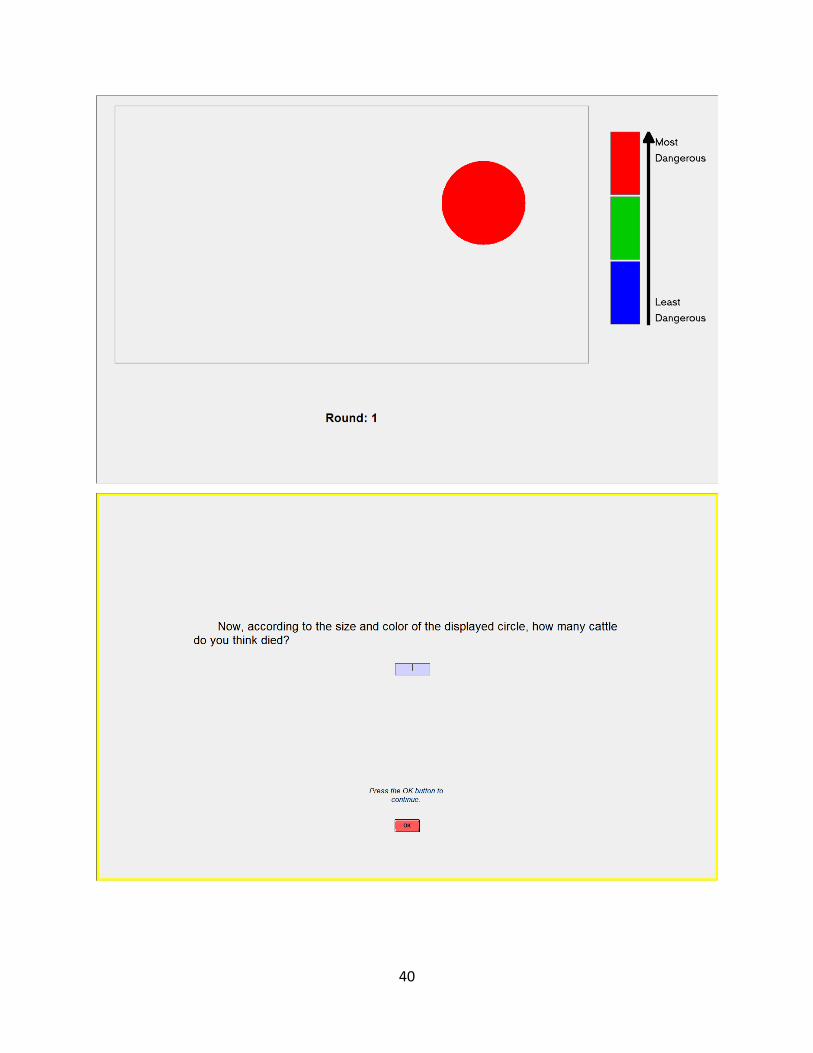
40

41
This was repeated for 25 rounds.

42
3. Screens that participants see in the advice-taking game:

43
This was repeated for 25 rounds.

B Learning in the Advice-Taking Game
We postulate that the advice perceived precision we measure captures an underlying person-
ality trait which is receptiveness to advice. We use all 25 rounds of the advice-taking game
to create this measure, and assume that the weight placed on the advice in each round is
an independent draw, and that the player is not learning about the quality of advice over
the 25 rounds. We tell the players that the advice is the estimate made by somebody who
had played 100 training rounds, but we do not specify that in fact the advice comes from
somebody who had played 100 training rounds and was quite good at the game. One might
worry that as the 25 rounds progress, the player figures out that the advice is in fact of quite
good quality and put a larger weight on it as time goes on. We think this is unlikely for
several reasons.
First, the design of the advice-taking game does not allow for learning since the players
are never told the correct number of cattle which died. So, for example, the player may
estimate that 60 cows died. Then, he might be told that the advisor estimated that 80 cows
died. The player might then split the difference and make a final estimate that 70 cows died.
But, the player then moves on to the next circle and is not told how many cattle actually
died. Thus, the player does not learn whether 60 or 70 or 80 was a more accurate estimate,
and so does not learn about the quality of the advice.23
Second, we explore whether the advice weight changes significantly over the course of the
25 rounds. Remember that the advice weight comes from a regression of the final estimate
(F ) on the initial estimate (I) and the advice (A). The regression is run separately for each
individual, using all 25 rounds of the advice game:
Ft = (1− αv)It + αvAt + εt (B-1)
One could instead construct an advice weight for each individual in each round, αv = (F −I)/(A− I), and then regress this weight on a time trend separately for each individual. We
do this and find that the number of significant time trends is not much higher than one
would have expected by chance. Of the 132 individuals in our sample, 2% have a time trend
which is significant at the 1% level, 7% have a time trend which is significant at the 5% level,
and 12% have a time trend which is significant at the 10% level. We find that 41% of the
time trends are negative, and 59% are positive. Of those significant at the 5% level, three
23Of course if the advisor were to estimate that 6032 cattle perished, the player would learn that the advicewas not good. But, within a range of reasonable estimates the player will not be able to deduce the degreeof quality of the advice.
44

are negative and five are positive. Thus, there is no evidence that the players’ perceptions
of the advice is changing over time.
Third, if in fact individuals are learning over time that the advice we are giving them is
quite good, we would expect decisions in the early rounds of the advice-taking game to reveal
their receptiveness to advice from advisors whose quality they know little about, whereas
later rounds of the advice-taking game would reveal their receptiveness to advice from an
advisor they believe to be giving good advice. We can estimate equation (B-1) using play
from only the first five rounds of the advice-taking game, or using only the last ten rounds
of the advice-taking game to get different measures of the advice weight. Combining those
with the measure of own precision, we can back out the advice perceived precision.
If there is in fact no learning, then the results using these measures should not be qualita-
tively different, though these measures should contain more noise than our original measure
which takes advantage of all 25 rounds. Panel B of Appendix Table 4 shows the GM corn
adoption regressions with varied measures of receptiveness to advice. Columns (1) and (2)
use the original advice weight and replicate the results in columns (6), and (8) of Table 3.
The next two columns use the perceived advice precision from the first five rounds while the
subsequent two columns use the advice perceived precision from the final ten rounds. We see
that the qualitative results are quite similar no what measure we use, though we sometimes
lose significance.
Finally, we note that all adoption regressions simultaneously control for cognitive ability
and receptiveness to advice. Thus, even if it were the case that individuals with higher
cognitive ability were also better able to figure out that we were giving them good advice,
we are exploring the effect of receptiveness to advice conditional on cognitive ability.
A different option we could have employed - which would have avoided the possibility
that individuals learn about the quality of advice over time - would have been to have the
advice be a computer-generated signal with known noise parameters. But, it would be hard
to interpret the weight the farmer put on the signal as their responsiveness to advice, given
that in that case the signal is not actually advice per se. In addition, it is hard to imagine
that all farmers would know how to interpret this advice, and again it could be the case
that higher cognitive ability individuals would be better able to understand the computer’s
data-generating process.
A different worry one might have about our measure of receptiveness to advice, the advice
perceived precision, is that it depends heavily on the structural form of Bayesian updating
under normality. We could instead look at responsiveness to advice, the advice weight itself
45

(αv). We do this in the final two columns of Panel B of Appendix Table 4 and find similar
results yet again.
46

Table 1: Summary StatisticsVariables Obs Mean Std. Dev. Min Max
Demographic Characteristics
Age 132 51.31 14.46 22 83
Gender: Female 132 3.03%
Household size in 2011 132 2.79 1.27 1 7
Household income before taxes in 2011 (Thousands)2 132 116.7 64.8 0 210
Share of household income from farming in 2011 132 66.6 30.4 0 100
Requested computer training 132 12.12%
Cognitive Characteristics
High school diploma or less 132 25.76%
Digit span score 131 7.53 1.59 3 11
Number of risky choices made in risk game 132 5.08 2.71 0 10
Farming Characteristics
Farming is not the principal occupation in 2011 132 15.15%
Acres of cropland operated in 2011 132 947 1007 30 6500
Acres of cropland operated and owned in 2011 132 414 495 0 3000
Years farmer has made decisions on farm 132 26.23 14.56 2 57
Corn
Have planted conventional but never GM corn 132 3.79%
Have ever planted GM corn 132 96.21%
Years planting GM corn (up through 2011) 132 10.89 4.46 0 16
Bought crop insurance for corn in 2011 132 79.55%
Livestock/dairy yielded at least 25% of farm income in 2011 132 27.27%
Experimentally‐Measured Characteristics
Cognitive ability (own precision, ρu)1 132 0.40 0.52 0.04 2.90
Receptiveness (advice perceived precision, ρv)1 132 1.24 2.44 0 11.58
Responsiveness (advice weight, αv)1 132 0.62 0.23 0 1
High own / low advice perceived precision 132 16.7%
Low own / high advice perceived precision 132 16.7%
High own / high advice perceived precision 132 33.3%
Low own / low advice perceived precision 132 33.3%
Survey‐Measured Characteristics
# of information sources in which have confidence in 2011 132 4.31 1.36 1 6
Has ever tried new corn seeds on small plots 132 76.5%
1 In this and all other tables the precisions are mulitplied by 100 for scaling.
2 Income is approximated as the midpoint of the chosen income category.
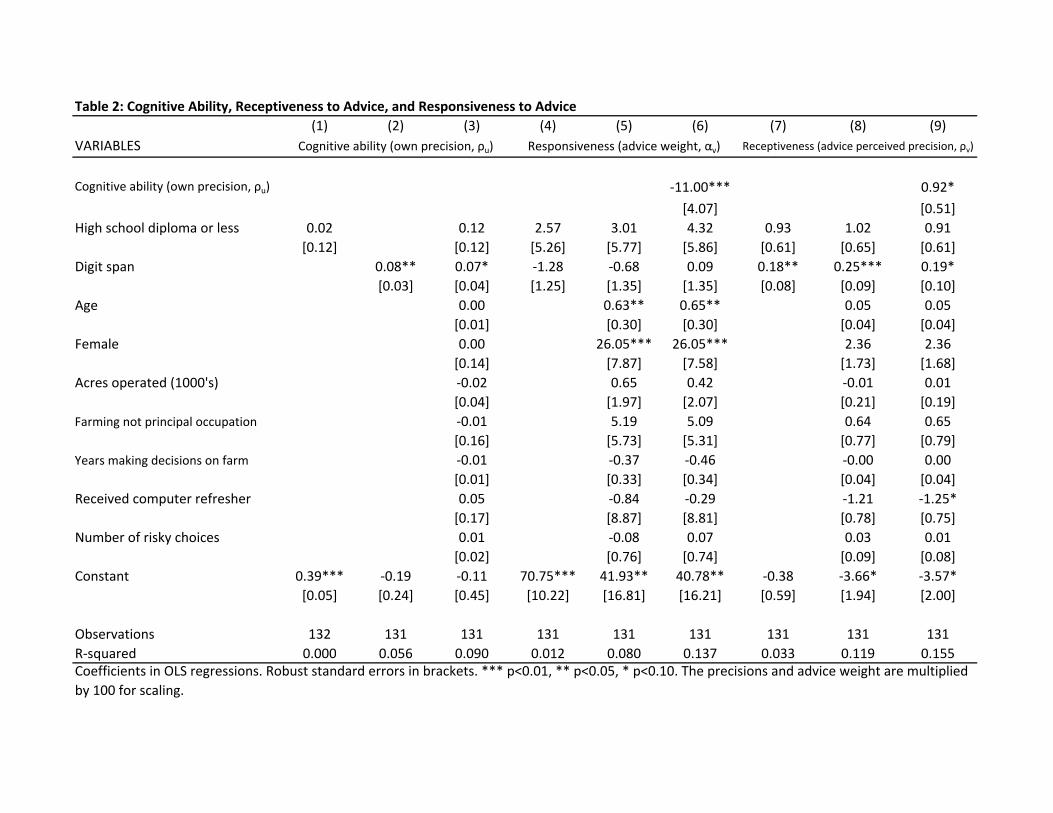
Table 2: Cognitive Ability, Receptiveness to Advice, and Responsiveness to Advice
(1) (2) (3) (4) (5) (6) (7) (8) (9)
VARIABLES
Cognitive ability (own precision, ρu) ‐11.00*** 0.92*
[4.07] [0.51]
High school diploma or less 0.02 0.12 2.57 3.01 4.32 0.93 1.02 0.91
[0.12] [0.12] [5.26] [5.77] [5.86] [0.61] [0.65] [0.61]
Digit span 0.08** 0.07* ‐1.28 ‐0.68 0.09 0.18** 0.25*** 0.19*
[0.03] [0.04] [1.25] [1.35] [1.35] [0.08] [0.09] [0.10]
Age 0.00 0.63** 0.65** 0.05 0.05
[0.01] [0.30] [0.30] [0.04] [0.04]
Female 0.00 26.05*** 26.05*** 2.36 2.36
[0.14] [7.87] [7.58] [1.73] [1.68]
Acres operated (1000's) ‐0.02 0.65 0.42 ‐0.01 0.01
[0.04] [1.97] [2.07] [0.21] [0.19]
Farming not principal occupation ‐0.01 5.19 5.09 0.64 0.65
[0.16] [5.73] [5.31] [0.77] [0.79]
Years making decisions on farm ‐0.01 ‐0.37 ‐0.46 ‐0.00 0.00
[0.01] [0.33] [0.34] [0.04] [0.04]
Received computer refresher 0.05 ‐0.84 ‐0.29 ‐1.21 ‐1.25*
[0.17] [8.87] [8.81] [0.78] [0.75]
Number of risky choices 0.01 ‐0.08 0.07 0.03 0.01
[0.02] [0.76] [0.74] [0.09] [0.08]
Constant 0.39*** ‐0.19 ‐0.11 70.75*** 41.93** 40.78** ‐0.38 ‐3.66* ‐3.57*
[0.05] [0.24] [0.45] [10.22] [16.81] [16.21] [0.59] [1.94] [2.00]
Observations 132 131 131 131 131 131 131 131 131
R‐squared 0.000 0.056 0.090 0.012 0.080 0.137 0.033 0.119 0.155
Receptiveness (advice perceived precision, ρv)Cognitive ability (own precision, ρu) Responsiveness (advice weight, αv)
Coefficients in OLS regressions. Robust standard errors in brackets. *** p<0.01, ** p<0.05, * p<0.10. The precisions and advice weight are multiplied
by 100 for scaling.

Table 3: Hazard Ratios, Survival Model for GM Corn Adoption
(1) (2) (3) (4) (5) (6) (7) (8)
VARIABLES
High school diploma or less 0.686* 0.781 0.807 0.836
[0.155] [0.208] [0.214] [0.237]
Digit span 1.092 0.963 0.944 1.034
[0.066] [0.066] [0.064] [0.075]
Cognitive ability (own precision, ρu) 2.171*** 2.351*** 2.894*** 3.185***
[0.369] [0.432] [0.662] [0.759]
Receptiveness (advice perceived precision, ρv) 0.947 0.961 0.997 1.014
[0.038] [0.048] [0.037] [0.045]
Cognitive ability x Receptiveness 0.922*** 0.917***
[0.025] [0.029]
High ability / Low receptiveness (HL) 1.866*** 1.729**
[0.433] [0.461]
Low ability / High receptiveness (LH) 0.760 1.162
[0.281] [0.384]
High ability / High receptiveness (HH) 1.250 1.162
[0.296] [0.293]
Age 0.998 0.997 0.996
[0.019] [0.018] [0.020]
Female 0.838 0.822 0.919
[0.229] [0.213] [0.287]
Acres operated (1000's) 1.415*** 1.407*** 1.359***
[0.145] [0.147] [0.136]
Farming not principal occupation 0.563 0.539 0.594
[0.214] [0.204] [0.219]
Years making decisions on farm 0.984 0.987 0.982
[0.020] [0.019] [0.020]
Received computer refresher 1.036 0.899 1.322
[0.431] [0.387] [0.550]
Number of risky choices 0.952 0.959 0.959
[0.034] [0.035] [0.033]
k 1.356*** 1.377*** 1.412*** 1.685*** 1.442*** 1.708*** 1.378*** 1.625***
[0.136] [0.136] [0.132] [0.157] [0.139] [0.162] [0.136] [0.152]
Number of farmers 132 131 132 131 132 131 132 131
χ2 Inequality Tests
HL‐HH>0 0.039** 0.088*
LH>0 0.771 0.324Hazard ratios for survival models. We test whether they are significantly different from 1 (not 0) at * – 10%, ** – 5%, and *** – 1% levels. A
hazard ratio below 1 implies that the variable makes adoption less likely. Robust standard errors in brackets. All regressions assume a
Weibull survival distribution and include year and crop‐reporting district fixed effects. In Columns 7 and 8, "Low ability / Low receptiveness"
is the excluded category. The precisions are multiplied by 100 for scaling. The χ2 inequality tests show the p ‐values for one‐sided tests of
the hypothesis that the coefficient on High ability / Low receptiveness is greater than or equal to that on High ability / High receptiveness,
and the hypothesis that the coefficient on Low ability / High receptiveness is greater than or equal to 0 (i.e., testing that the hazard ratio is
greater than or equal to 1).

Figure 1: Average APE over Time
This figure depicts the average absolute percentage error (APE) over all farmers in each round
except the first. It is overlaid with an exponential fit line.
.1.2
.3.4
.5A
vera
ge
abso
lute
pe
rcen
tage
err
or (
AP
E)
200 5 10 15 25Rounds 2 to 25 of individual learning game

Figure 2a: Cognitive Ability (Own Precision, ρu) Figure 2c: Receptiveness (Advice Perceived Precision, ρv)
Figure 2b: Responsiveness (Advice Weight, αv)
0.0
5.1
.15
.2.2
5F
ract
ion
0 2 4 6 8 10 12Advice perceived precision
0.0
5.1
.15
Fra
ctio
n
0 .2 .4 .6 .8 1Advice weight
0.0
5.1
.15
.2F
ract
ion
0 1 2 3Own precision
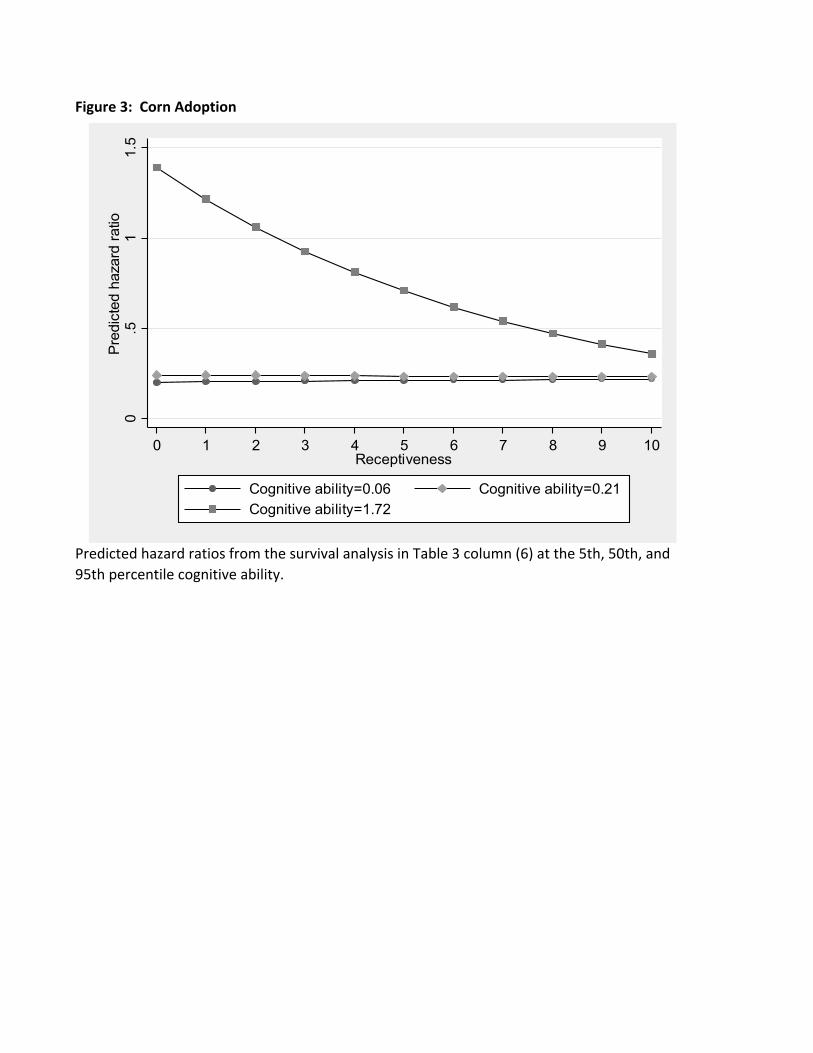
Figure 3: Corn Adoption
Predicted hazard ratios from the survival analysis in Table 3 column (6) at the 5th, 50th, and
95th percentile cognitive ability.
0.5
11.
5P
redi
cted
haz
ard
ratio
0 1 2 3 4 5 6 7 8 9 10Receptiveness
Cognitive ability=0.06 Cognitive ability=0.21
Cognitive ability=1.72

Appendix Table 1: Risk Aversion Regressions
(1) (2) (3) (4) (5) (6) (7)
VARIABLES
Cognitive ability (own precision, ρu) 0.51 0.36 0.38
[0.43] [0.48] [0.49]
Receptiveness (advice perceived precision, ρv) 0.05 0.02
[0.10] [0.11]
Responsiveness (advice weight, αv) ‐0.34 0.10
[1.07] [1.09]
High school diploma or less 1.09* 1.02 0.96 0.97
[0.59] [0.66] [0.66] [0.65]
Digit span 0.26* 0.26* 0.23 0.23
[0.14] [0.15] [0.16] [0.16]
Age 0.02 0.02 0.02
[0.04] [0.04] [0.04]
Female ‐2.39*** ‐2.41*** ‐2.40***
[0.71] [0.70] [0.72]
Acres operated (1000's) 0.28 0.29 0.29
[0.24] [0.24] [0.24]
Farming not principal occupation 0.75 0.74 0.75
[0.73] [0.71] [0.72]
Years making decisions on farm ‐0.01 ‐0.00 ‐0.00
[0.04] [0.04] [0.04]
Received computer refresher 0.32 0.33 0.30
[0.82] [0.84] [0.82]
Constant 4.88*** 5.02*** 5.29*** 2.86** 1.79 1.88 1.78
[0.31] [0.27 [0.71] [1.10] [1.67] [1.66] [1.80]
Observations 132 132 132 131 131 131 131
R‐squared 0.010 0.002 0.001 0.041 0.083 0.088 0.088
Number of risky decisions
Coefficients in OLS regressions. Robust standard errors in brackets. *** p<0.01, ** p<0.05, * p<0.10. The precisions
are multiplied by 100 for scaling.
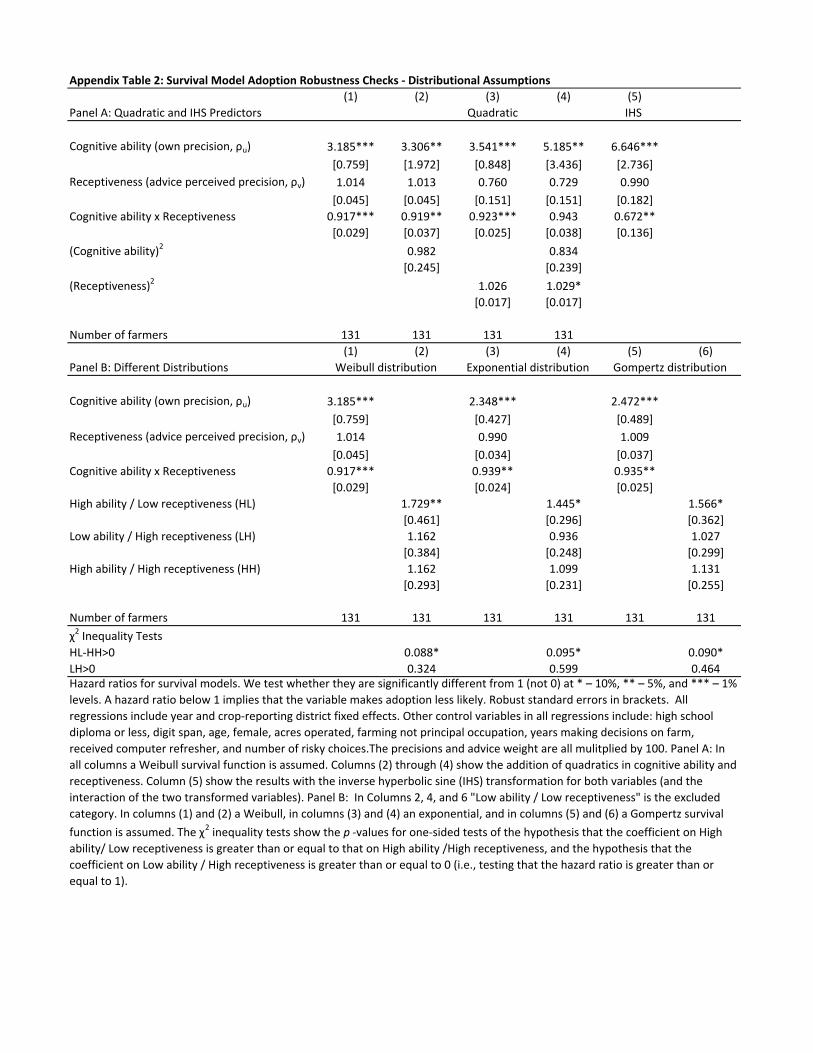
Appendix Table 2: Survival Model Adoption Robustness Checks ‐ Distributional Assumptions
(1) (2) (3) (4) (5)
Panel A: Quadratic and IHS Predictors IHS
Cognitive ability (own precision, ρu) 3.185*** 3.306** 3.541*** 5.185** 6.646***
[0.759] [1.972] [0.848] [3.436] [2.736]
Receptiveness (advice perceived precision, ρv) 1.014 1.013 0.760 0.729 0.990
[0.045] [0.045] [0.151] [0.151] [0.182]
Cognitive ability x Receptiveness 0.917*** 0.919** 0.923*** 0.943 0.672**
[0.029] [0.037] [0.025] [0.038] [0.136]
(Cognitive ability)2 0.982 0.834
[0.245] [0.239]
(Receptiveness)2 1.026 1.029*
[0.017] [0.017]
Number of farmers 131 131 131 131
(1) (2) (3) (4) (5) (6)
Panel B: Different Distributions
Cognitive ability (own precision, ρu) 3.185*** 2.348*** 2.472***
[0.759] [0.427] [0.489]
Receptiveness (advice perceived precision, ρv) 1.014 0.990 1.009
[0.045] [0.034] [0.037]
Cognitive ability x Receptiveness 0.917*** 0.939** 0.935**
[0.029] [0.024] [0.025]
High ability / Low receptiveness (HL) 1.729** 1.445* 1.566*
[0.461] [0.296] [0.362]
Low ability / High receptiveness (LH) 1.162 0.936 1.027
[0.384] [0.248] [0.299]
High ability / High receptiveness (HH) 1.162 1.099 1.131
[0.293] [0.231] [0.255]
Number of farmers 131 131 131 131 131 131
χ2 Inequality Tests
HL‐HH>0 0.088* 0.095* 0.090*
LH>0 0.324 0.599 0.464Hazard ratios for survival models. We test whether they are significantly different from 1 (not 0) at * – 10%, ** – 5%, and *** – 1%
levels. A hazard ratio below 1 implies that the variable makes adoption less likely. Robust standard errors in brackets. All
regressions include year and crop‐reporting district fixed effects. Other control variables in all regressions include: high school
diploma or less, digit span, age, female, acres operated, farming not principal occupation, years making decisions on farm,
received computer refresher, and number of risky choices.The precisions and advice weight are all mulitplied by 100. Panel A: In
all columns a Weibull survival function is assumed. Columns (2) through (4) show the addition of quadratics in cognitive ability and
receptiveness. Column (5) show the results with the inverse hyperbolic sine (IHS) transformation for both variables (and the
interaction of the two transformed variables). Panel B: In Columns 2, 4, and 6 "Low ability / Low receptiveness" is the excluded
category. In columns (1) and (2) a Weibull, in columns (3) and (4) an exponential, and in columns (5) and (6) a Gompertz survival
function is assumed. The χ2 inequality tests show the p ‐values for one‐sided tests of the hypothesis that the coefficient on High
ability/ Low receptiveness is greater than or equal to that on High ability /High receptiveness, and the hypothesis that the
coefficient on Low ability / High receptiveness is greater than or equal to 0 (i.e., testing that the hazard ratio is greater than or
equal to 1).
Weibull distribution Exponential distribution Gompertz distribution
Quadratic

Appendix Table 3: OLS years since GM Corn Adoption
(1) (2) (3) (4) (5) (6) (7) (8)
VARIABLES
High school diploma or less ‐0.906 ‐0.980 ‐0.947 ‐0.651
[0.768] [0.747] [0.754] [0.761]
Digit span ‐0.051 ‐0.208 ‐0.221 ‐0.097
[0.197] [0.201] [0.202] [0.216]
Cognitive ability (own precision, ρu) 1.568*** 2.101*** 2.085** 2.651***
[0.553] [0.562] [0.792] [0.732]
Receptiveness (advice perceived precision, ρv) ‐0.075 ‐0.057 ‐0.028 ‐0.007
[0.120] [0.091] [0.138] [0.100]
Cognitive ability x Receptiveness ‐0.119 ‐0.128
[0.090] [0.083]
High ability / Low receptiveness (HL) 1.482** 1.242*
[0.708] [0.716]
Low ability / High receptiveness (LH) ‐0.544 ‐0.507
[1.150] [1.082]
High ability / High receptiveness (HH) ‐0.048 0.110
[0.828] [0.962]
Age ‐0.008 ‐0.009 ‐0.018
[0.079] [0.080] [0.084]
Female ‐0.133 ‐0.117 0.206
[0.818] [0.802] [0.989]
Acres operated (1000's) 0.657** 0.644** 0.564*
[0.273] [0.275] [0.299]
Farming not principal occupation ‐2.014 ‐2.128 ‐1.860
[1.468] [1.484] [1.590]
Years making decisions on farm 0.027 0.028 0.025
[0.074] [0.074] [0.077]
Received computer refresher ‐0.863 ‐0.935 ‐0.718
[1.206] [1.231] [1.214]
Number of risky choices ‐0.173 ‐0.162 ‐0.165
[0.123] [0.124] [0.128]
Observations 97 97 97 97 97 97 97 97
R‐squared 0.131 0.117 0.156 0.302 0.161 0.307 0.150 0.260
χ2 Inequality Tests
HL‐HH>0 0.016** 0.085*
LH>0 0.682 0.680Coefficients in OLS regressions. All regressions include crop‐reporting district fixed effects. Regressions drop farmers who started farming
after 1996 or who never adopted GM corn. In Columns 7 and 8, "Low ability / Low receptiveness" is the excluded category. The precisions
are multiplied by 100 for scaling. Robust standard errors in brackets. Significantly different from 1 at * – 10%, ** – 5%, and *** – 1%
levels. The χ2 inequality tests show the p ‐values for one‐sided tests of the hypothesis that the coefficient on High ability / Low
receptiveness is greater than or equal to that on High ability / High receptiveness, and the hypothesis that the coefficient on Low ability /
High receptiveness is greater than or equal to 0 (i.e., testing that the hazard ratio is greater than or equal to 1).

Appendix Table 4: Survival Model Adoption Robustness ‐ Different Samples, Controls, and Advice Measures
(1) (2) (3) (4) (5) (6) (7) (8)
Panel A: Different Samples/Controls
Cognitive ability (own precision, ρu) 3.185*** 3.040*** 6.422*** 3.172***
[0.759] [0.745] [2.637] [0.832]
Receptiveness (advice perceived precision, ρv) 1.014 1.017 1.005 1.011
[0.045] [0.045] [0.048] [0.047]
Cognitive ability x Receptiveness 0.917*** 0.915** 0.891*** 0.911***
[0.029] [0.032] [0.035] [0.033]
High ability / Low receptiveness (HL) 1.729** 1.839** 1.672 2.047**
[0.461] [0.506] [0.535] [0.611]
Low ability / High receptiveness (LH) 1.162 1.483 1.141 1.326
[0.384] [0.504] [0.495] [0.528]
High ability / High receptiveness (HH) 1.162 1.132 1.016 1.232
[0.293] [0.292] [0.351] [0.355]
Number of farmers 131 131 127 127 88 88 131 131
χ2 Inequality Tests
HL‐HH>0 0.088* 0.056* 0.092* 0.046**
LH>0 0.324 0.124 0.380 0.240
(1) (2) (3) (4) (5) (6) (7) (8)
Panel B: Different Advice Measures
Cognitive ability (own precision, ρu) 3.185*** 2.406*** 3.222*** 4.580***
[0.759] [0.569] [0.758] [2.038]
Advice receptiveness (ρv) or responsiveness (αv) 1.014 1.045 1.018 1.000
[0.045] [0.066] [0.018] [0.006]
Cognitive ability x Advice measure 0.917*** 0.935 0.932*** 0.986**
[0.029] [0.091] [0.025] [0.007]
High ability / Low advice measure (HL) 1.729** 1.281 1.297 2.095**
[0.461] [0.429] [0.356] [0.662]
Low ability / High advice measure (LH) 1.162 1.039 0.867 1.426
[0.384] [0.375] [0.275] [0.473]
High ability / High advice measure (HH) 1.162 1.280 1.162 1.070
[0.293] [0.342] [0.301] [0.327]
Number of farmers 131 131 131 131 131 131 131 131
χ2 Inequality Tests
HL‐HH>0 0.088* 0.499 0.360 0.022**
LH>0 0.324 0.458 0.673 0.142
Responsiveness
Hazard ratios for survival models. We test whether they are significantly different from 1 (not 0) at * – 10%, ** – 5%, and *** – 1% levels. A hazard ratio
below 1 implies that the variable makes adoption less likely. Robust standard errors in brackets. All regressions assume a Weibull survival distribution and
include year and crop‐reporting district fixed effects. In Columns 2, 4, 6, and 8, "Low ability / Low advice measure" is the excluded category. Other control
variables in all regressions include: high school diploma or less, digit span, age, female, acres operated, farming not principal occupation, years making
decisions on farm, received computer refresher, and number of risky choices.The precisions and advice weight are all mulitplied by 100. Panel A: In
columns (1) and (2) the sample is the full sample, in columns (3) and (4) the sample includes sole and joint proprietors only, and in columns (5) and (6) the
sample includes sole proprietors only. Columns (7) and (8) contain all controls listed in note above in addition to household size, livestock/dairy are 25% of
farm income, acres owned, purchased crop insurance, total household income, and share of household income from farming. Panel B: In columns (1) and
(2) the advice measure is the original receptiveness, using the weight from all 25 rounds of the advice game. In columns (3) and (4) it is receptiveness using
only the first 5 rounds of the advice game while in columns (5) and (6) it is the receptiveness using only the last 10 rounds of the advice game. In columns
(7) and (8) it is responsiveness, rather than receptiveness. The χ2 inequality tests show the p ‐values for one‐sided tests of the hypothesis that the
coefficient on High ability / Low advice is greater than or equal to that on High ability / High advice, and the hypothesis that the coefficient on Low ability /
High advice is greater than or equal to 0 (i.e., testing that the hazard ratio is greater than or equal to 1).
Additional controlsAll respondents Sole and joint proprietors Sole proprietors
Receptiveness ‐ Original Receptiveness ‐ First 5 Receptiveness ‐ Last 10

(1) (2) (3) (4) (5)
VARIABLES
# of sources in which have confidence 0.241* 0.322** 0.365***
[0.133] [0.138] [0.136]
High school diploma or less ‐0.135 1.224* 1.129*
[0.090] [0.658] [0.611]
Digit span 0.052** 0.286*** 0.219**
[0.021] [0.104] [0.107]
Cognitive ability (own precision, ρu) 1.026**
[0.458]
High ability / Low receptiveness (HL) 0.182* 0.166*
[0.103] [0.091]
Low ability / High receptiveness (LH) 0.091 0.148
[0.115] [0.103]
High ability / High receptiveness (HH) 0.114 0.150
[0.094] [0.092]
Age ‐0.005 0.046 0.043
[0.006] [0.042] [0.043]
Female ‐0.148 2.411 2.417
[0.229] [1.813] [1.757]
Acres operated (1000's) 0.091*** ‐0.025 ‐0.006
[0.026] [0.201] [0.180]
Farming not principal occupation ‐0.207* 0.632 0.640
[0.123] [0.755] [0.766]
Years making decisions on farm 0.006 0.002 0.011
[0.005] [0.039] [0.040]
Received computer refresher 0.122 ‐1.342* ‐1.410*
[0.139] [0.780] [0.748]
Number of risky choices ‐0.025* 0.015 ‐0.001
[0.014] [0.084] [0.079]
Constant 0.682*** 0.483 0.200 ‐5.063** ‐5.142**
[0.071] [0.299] [0.490] [2.195] [2.237]
Observations 132 131 132 131 131
R‐squared 0.024 0.197 0.018 0.150 0.193
χ2 Inequality Tests
HL‐HH>0 0.240 0.438
LH>0 0.215 0.077
Appendix Table 5: Alternate Outcomes and Comparing Experimental Results and Survey Questions
Test corn Receptiveness, (advice perceived precision, ρv)
Coefficients in OLS regressions. "Test corn" is the answer to: "In the past, have you tried new corn seeds on
small plots or parcels?" In Columns 1‐2, "Low advice / low receptiveness" is the excluded category. The "#
of sources in which have confidence" is the number out of six in which they have confidence levels 3 or 4.
The precisions are multiplied by 100 for scaling. Robust standard errors in brackets. *** p<0.01, ** p<0.05,
* p<0.10. The χ2 inequality tests show the p ‐values for one‐sided tests of the hypothesis that the
coefficient on High ability / Low receptiveness is greater than or equal to that on High ability /High
receptiveness, and the hypothesis that the coefficient on Low ability / High receptiveness is greater than or
equal to 0 (i.e., testing that the hazard ratio is greater than or equal to 1).

Appendix Figure 1: Farmer and Advice‐Giver APEs in the Advice‐Taking Game
Absolute percentage error (APE) from the 25 circles in the advice‐taking game. This is the absolute difference
between the prediction and the truth, divided by the truth. Pre‐advice and post‐advice APE are from the
farmers and advice APE is from the advice giver.