Embed Size (px)
Citation preview

Recent trends and variability in Canadian Arctic sea ice
Stephen Howell
Climate Research Division
January 19, 2010
Thanks to:Adrienne Tivy (IARC), Thorsten Markus (NASA); Steve McCourt (CIS); Bea Alt (CIS); Trudy Wohlleben (CIS); Claude Duguay (UW)
Page 2 – April 19, 2023
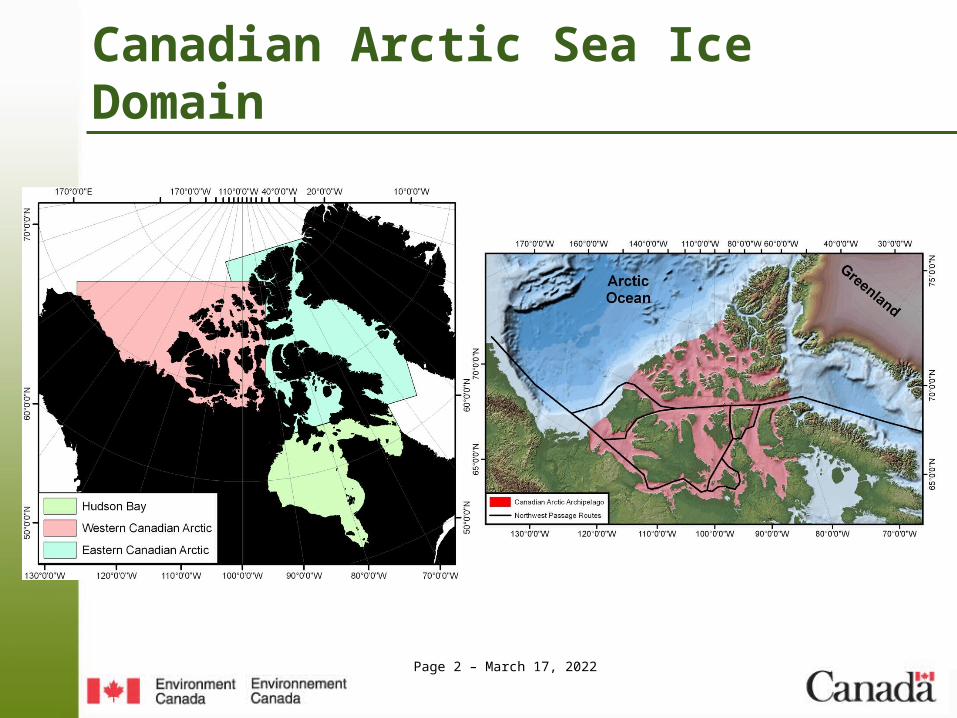
Canadian Arctic Sea Ice Domain

Page 3 – April 19, 2023
Canadian Arctic sea ice decreases will lag the Arctic Ocean
Holland et al., 2006-GRL(left); Sou and Flato 2009-JClim(right)
• How is Canadian Arctic sea ice responding to change?
September 10, 2041-2060 mean

Page 4 – April 19, 2023
Recent trends and variability: total and multi-year sea ice
• Total sea ice area -8.7% decade-1 (sig)
• MYI area -6.4% decade-1 (not sig)
CAA September Average, 1979-2008
Howell et al. 2009-GRL;Tivy et al. submitted-JGR
Summer Average, 1968-2008
Page 5 – April 19, 2023
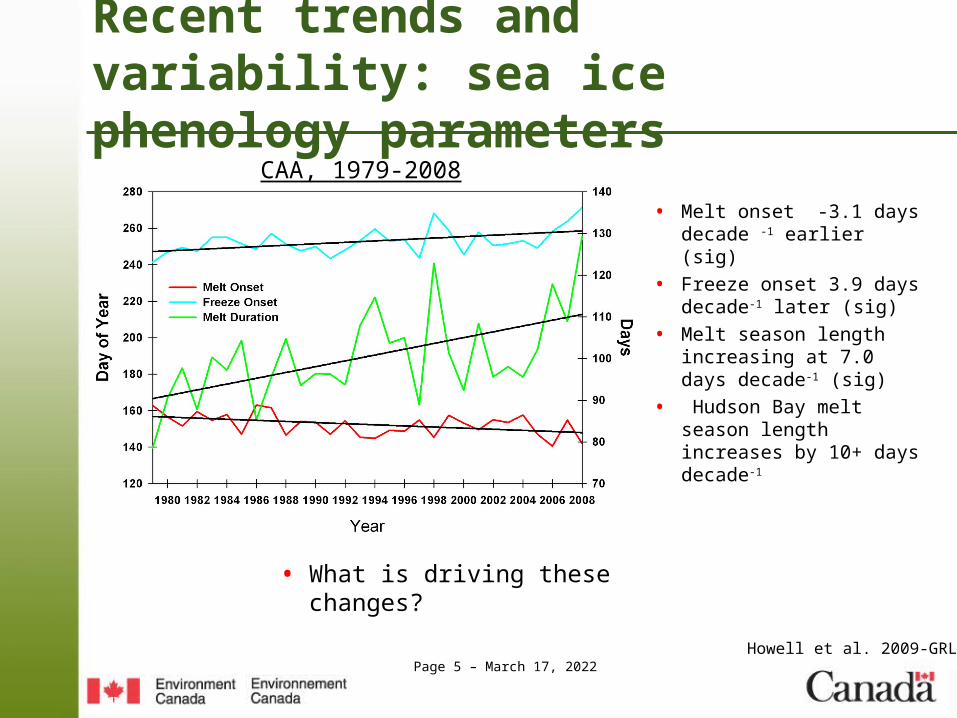
Recent trends and variability: sea ice phenology parameters
• Melt onset -3.1 days decade -1 earlier (sig)
• Freeze onset 3.9 days decade-1 later (sig)
• Melt season length increasing at 7.0 days decade-1 (sig)
• Hudson Bay melt season length increases by 10+ days decade-1
• What is driving these changes?
Howell et al. 2009-GRL
CAA, 1979-2008

Page 6 – April 19, 2023
Sea ice variability: links to surface air temperature
Tivy et al. submitted-JGR
SAT and Sea Ice, 1968-2008
NCEP SAT 1968-2008 (oC decade-1)
> 0.2oC decade-1 than pan-Arctic
Page 7 – April 19, 2023
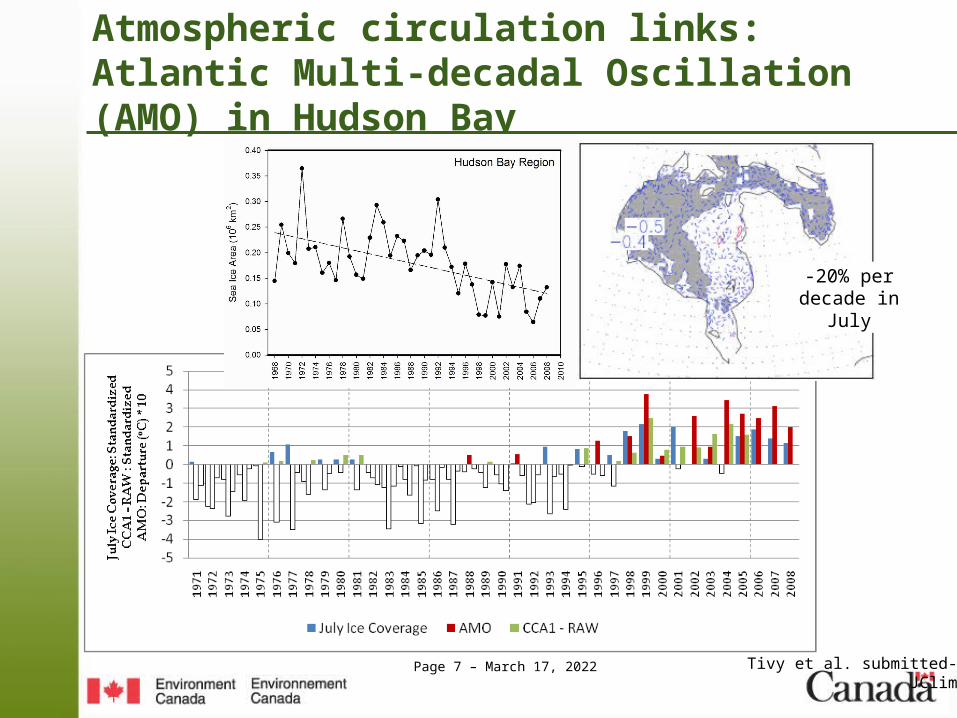
Atmospheric circulation links: Atlantic Multi-decadal Oscillation (AMO) in Hudson Bay
-20% per decade in July
Tivy et al. submitted-JClim

Page 8 – April 19, 2023
Atmospheric circulation links: Arctic Oscillation & ENSO
Composite MJJAS SAT for El Niño Events
• Preceding NDJFM ENSO Index– 5 month lead
MYI Dynamic & Thermodynamic Interplay
Tivy et al. submitted-JGR
Page 9 – April 19, 2023
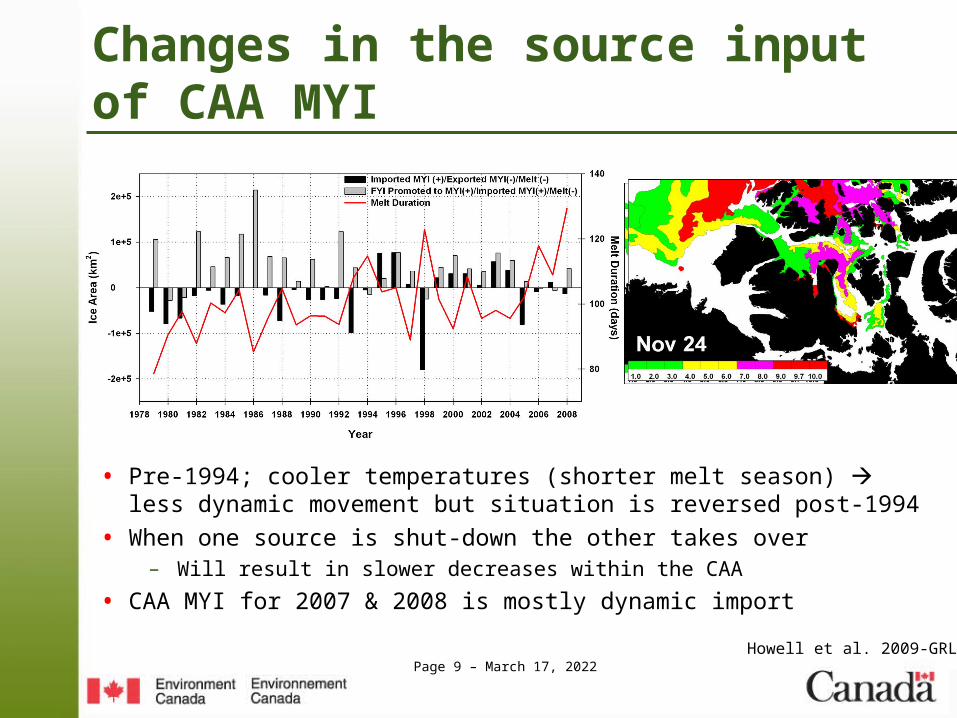
Changes in the source input of CAA MYI
• Pre-1994; cooler temperatures (shorter melt season) less dynamic movement but situation is reversed post-1994
• When one source is shut-down the other takes over– Will result in slower decreases within the CAA
• CAA MYI for 2007 & 2008 is mostly dynamic import
Howell et al. 2009-GRL

Page 10 – April 19, 2023
Late season sea ice consolidation (landfast) changes
• 2004-2007: consolidation of the ice in the CAA was ~normal
• 2008: consolidation of the ice in parts of the CAA was 6-8 weeks late
• 2009: process of normal consolidation of the ice in the CAA significantly interrupted by strong winds and warm temperatures
Courtesy T. Wohlleben (CIS)
Dec 2004 Dec 2005 Dec 2006
Dec 2007 Dec 2008 Dec 2009

Page 11 – April 19, 2023
Dual-pol false-colour image: Blue = young iceRADARSAT-22 Nov 2009 HH/HV
Late season sea ice consolidation: 2009
Courtesy T. Wohlleben (CIS)

Page 12 – April 19, 2023
Borden Island
Ellef Ringnes Island
Fractured Multi-year pack ice with young and first year ice in the leads
Young ice
Young ice
Young ice
Young iceMobile, fractured multi-year
ice
Fast ice
Fast ice
Fast ice
Fast ice
RADARSAT-2, HHHV, 06 Dec 2009, 1430Z
Late season sea ice consolidation: 2009
Courtesy T. Wohlleben (CIS)
Page 13 – April 19, 2023
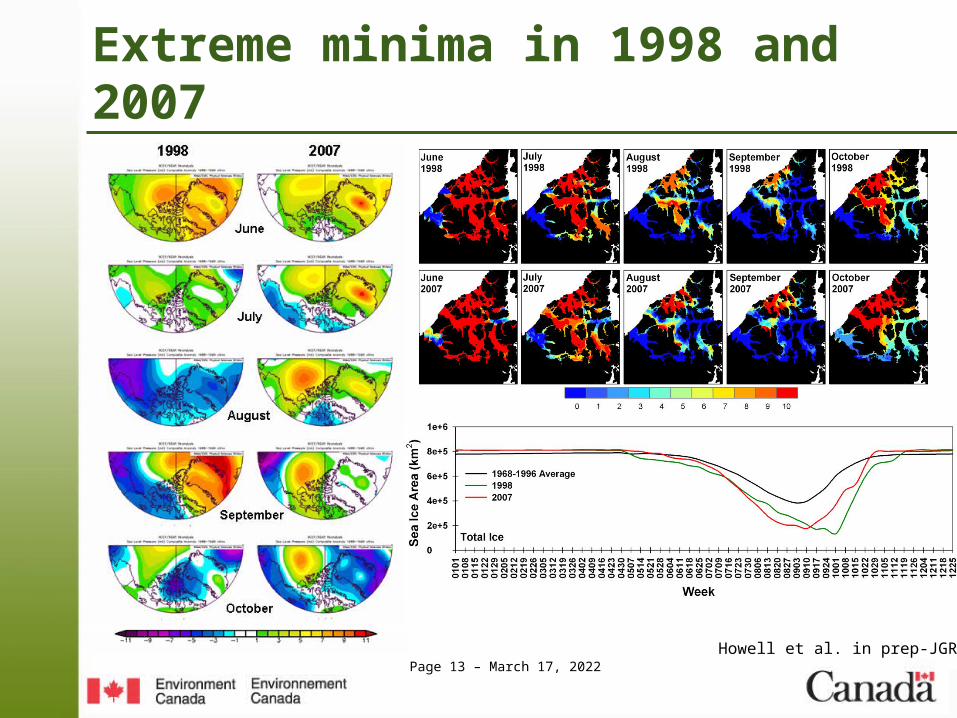
Extreme minima in 1998 and 2007
Howell et al. in prep-JGR
Page 14 – April 19, 2023
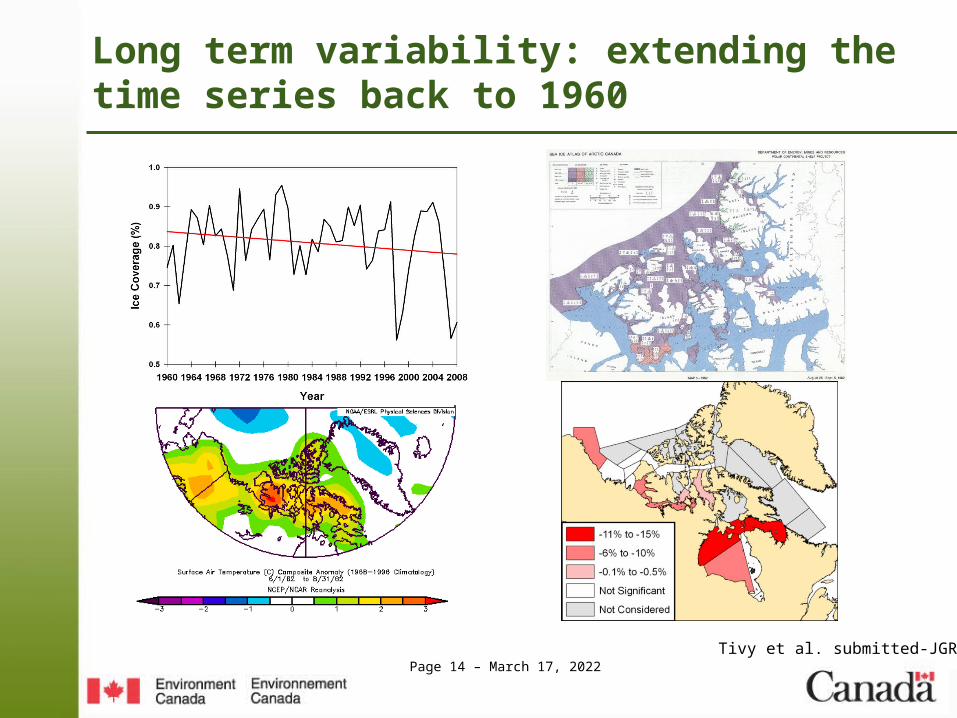
Long term variability: extending the time series back to 1960
Tivy et al. submitted-JGR

Page 15 – April 19, 2023
Variability in the CAA is difficult to capture
Zhang –APL; Howell and Duguay – UW; CIS
Page 16 – April 19, 2023
Summary
• The Canadian Arctic is experiencing sea ice decreases but change varies regionally:
– Greatest in for Hudson Bay (~-9% per decade annually; -20 % per decade in July)– Baffin Bay (~-8.9 % per decade annually)– Beaufort Sea (~-5.2 % per decade annually)– CAA (-3% per decade annually; ~-8% per decade in September; No significant trends in
MYI)• Seasonal FYI decreases are explained mostly by summertime increases in SAT• ENSO teleconnection increases MYI in the CAA • AMO teleconnection maybe responsible for July Hudson Bay decreases• The source of CAA’s MYI has changed
– Less first-year ice survival but more dynamic MYI import attributed to an increase in the length of the melt season (~7 days per decade)
• As the transition to a summer-time sea ice free Arctic continues the supply of MYI from the Arctic Ocean to the CAA is unlikely to stop.
– Atmospheric circulation continues to force sea ice up against the CAA hence creating very thick ice (15+ m ) that will likely be able to survive 2oC temperature warming

Page 17 – April 19, 2023
Anomalies continuing in 2010
• Re-fracture
Courtesy T. Wohlleben (CIS)