Embed Size (px)
Citation preview

Available online at www.IJournalSE.org
Emerging Science Journal
Vol. 2, No. 2, April, 2018
Page | 65
Recent Issues in the Implementation of the New Basel Minimum
Capital Requirements for Market Risk
J. Orgeldinger a* a Ludwig Maximilian University of Munich, Munich, Germany
Abstract
The Basel Committee suggested new ways of dealing with market risk in banks’ trading and banking
books, in its October 2013 consultative paper, and subsequent versions published thereafter, for revised
market risk framework FRTB. The Basel Committee estimates that the new rules will result in an
approximate median capital increase of 22% and a weighted average capital increase of 40% (BCBS
2016), compared with the current framework. Budget reports on FRTB implementation range from
costs of 5-million USD to 250-million USD. Key changes can be found in the internal model approach,
in the standard rules and in the approval process. Significant changes introduced by the FRTB include
stricter separation of the trading and banking book. Regardless of whether they use standardized or
internal models, banks will need to review their portfolios to determine if existing classifications of
instruments and desks as trading or banking book are still applicable, or whether a revision of desk
structure is needed. In its article ‘Critical appraisal of the Basel fundamental review of the trading book
regulation’ (Orgeldinger 2017) the theoretical foundations of the internal model approach IMA were
analysed and the criticisms for FRTB risk models were investigated. A recent onslaught of rules is
rendering the existing timeline for implementation practically impossible. In this article we present and
critically evaluate different approaches to implement the new rules suggested by academics and major
consulting companies.
Keywords:
Market Risk;
Capital Requirements;
Implementation;
FRTB.
Article History:
Received: 12 March 2018
Accepted: 29 April 2018
1- Introduction
The global financial crisis of 2007/2008 had a strong effect on the implementation the Basel regulations (see also
Lobanov 2012 and Friedmann/Kraus 2011). The changes being introduced by the FRTB regulation are important.
Improvement to new internal models and numerous changes to market risk and finance procedures must be completed
to avoid higher capital charges on financial market activities beginning on January 2, 2018.
Table 1. Short overview of consultancies which offer new models for FRTB.
KPMG Ernst &Young
Oliver Wyman Fitch
PWC Klovers
Calypso Murex
Advantage Reply Percentile
McKinsey Quartet
Kamakura Risk transform
SAS Scaled Risk
MSCI Delta capita
Accenture dfine
Clarus Incube
Deloitte Finbridge
Dr. Nagler Bearing Point
* CONTACT: [email protected]
DOI: http://dx.doi.org/10.28991/esj-2018-01129
© This is an open access article under the CC-BY license (https://creativecommons.org/licenses/by/4.0/).
Emerging Science Journal | Vol. 2, No. 2
Page | 66
Among the FRTB’s requirements is a planned 12-month back-testing period of all internal models, which will take
place before March 2019. The following elements of this article, will summarize ways and methods to implement the
new standards. Current propositions made by academics and major consulting companies will be scrutinized
accordingly. Implementation is performed in various phases. The calculations and technical requirements, as well as
organizational issues, and advantages of various implementation approaches will be elaborated and discussed later in
the article.
2- Short Summary of The Minimum Capital Requirements and Literature Overview
Within the last three years there is a huge amount, both academic and consulting, literature on the new Basel minimum
capital requirements on market risk and how to deal with it (e.g. Hott 2013: 157, Borio and Zhu 2008: 2 or Brigo et al.
2012). The new model of the minimum capital requirements for market risk introduced a revised standardised model for
market risk, based on price sensitivities (Ramirez 2017: 17). For those institutions wishing to retain an advanced
approach, a mandatory substitution of value at risk (VaR) with an expected shortfall (ES) risk measure on a desk level
is required (for the calculation of VaR see Hubbert 2012: 131, for a stressed VAR Szylar 2014: 356 and for expected
shortfall the article of Acerbi/Szekey 2014). Expected shortfall ES calibrated on a stressed period is used to reduce
procyclicality. A good description of the methods can be found in the contribution on market risk modelling by Han
Zhang 2017. Liquidity risk with varying liquidity horizons instead of a single 10-day liquidity horizon is accounted for.
The introduction of liquidity horizons in the ES calculation reflects the time required to sell or hedge a given position
during a period of stress. For problems with liquidity please refer to Blundell-Wignall and Atkinson 2010: 19. Disclosure
and transparency of market risk capital charges (see Wernz 2017: 77) include capital ratios calculated using both a
standardised and internal model approach where applicable. Vigorous back-testing requirements for institutions retain
an advanced approach on a trading desk level. In 2015 Gaumert and Kemmer designed a comprehensive approach to
model validation (Gaumert and Kemmer 2015: 23-24). Failure to meet the validation criteria force a desk to revert to
using the standardised approach, thus incurring incremental capital charge. All institutions, regardless of size,
complexity or whether they have allotted to retain an advanced approach, must deploy and report capital charge based
on the standardised model. Analytical technics for modelling VaR, optimized VaR can be found in (Glantz and Mun’s
Credit engineering for bankers 2011: 333-375 and the regulation Alexander et al. 2012: 1). Banks have trouble sourcing
good-quality data for risk models. There is constraints on diversification benefits across five risk classes. Internal models
are assessed through tests at the desk level (if failed, the desk has to revert to revised SA). Profit&Loss P&L attribution
test, risk factors and proxies must explain the daily P&L correctly. Capital for non-modelable risk factors (e. g. markets
with sparse price history) and incremental risk charge (IRC) must be added with a default risk charge.
Table 2. Overview of the regulation.
Date Basel paper Available from:
BCBS 2005 International convergence of capital measurement and capital
standards: A revised framework. http://www.bis.org/publ/bcbs107.pdf
BCBS 2009 Revisions to the Basel II market risk framework. http://www.bis.org/publ/bcbs158.pdf
BCBS 2012 Fundamental review of the trading book. Consultative paper 1. http://www.bis.org/publ/bcbs219.pdf
BCBS 2013 Fundamental review of the trading book: A revised market risk
framework. Consultative paper http://www.bis.org/publ/bcbs265.pdf
BCBS 2013 Regulatory consistency assessment program (RCAP) - Analysis of risk-
weighted assets for credit risk in the banking book. http://www.bis.org/publ/bcbs256.htm
BCBS 2013 BCBS. 2013. Regulatory consistency assessment program (RCAP) -
Analysis of risk-weighted assets for market risk. http://www.bis.org/publ/bcbs256.htm
BCBS 2013 Regulatory consistency assessment program (RCAP) - Second report
on risk-weighted assets for market risk in the trading book http://www.bis.org/publ/bcbs240.pdf
BCBS 2014 Analysis of the trading book hypothetical portfolio exercise. http://www.bis.org/publ/bcbs288.pdf
BCBS 2014 Reducing excessive variability in banks” regulatory capital ratios - A
report to the G20. http://www.bis.org/publ/bcbs298.pdf
BCBS 2015 Frequently asked questions: Impact study on the proposed frameworks
for market risk and CVA risk https://www.bis.org/bcbs/qis/FAQs_impact_study.pdf
BCBS 2015 Fundamental review of the trading book: Outstanding issues
(consultative paper 3) http://www.bis.org/publ/bcbs305.pdf
BCBS 2015 Instructions for Basel III monitoring - Version for banks providing data
for the trading book part of the exercise. https://www.bis.org/bcbs/qis/biiiimplmoninstr_feb15.pdf
BCBS 2015 Instructions: Impact study on the proposed frameworks for market risk
and credit valuation adjustment CVA risk http://www.bis.org/bcbs/qis/instr_impact_study_jul15.pdf
BCBS 2016 Standards - Minimum capital requirements for market risk. http://www.bis.org/bcbs/publ/d352.pdf
Emerging Science Journal | Vol. 2, No. 2
Page | 67
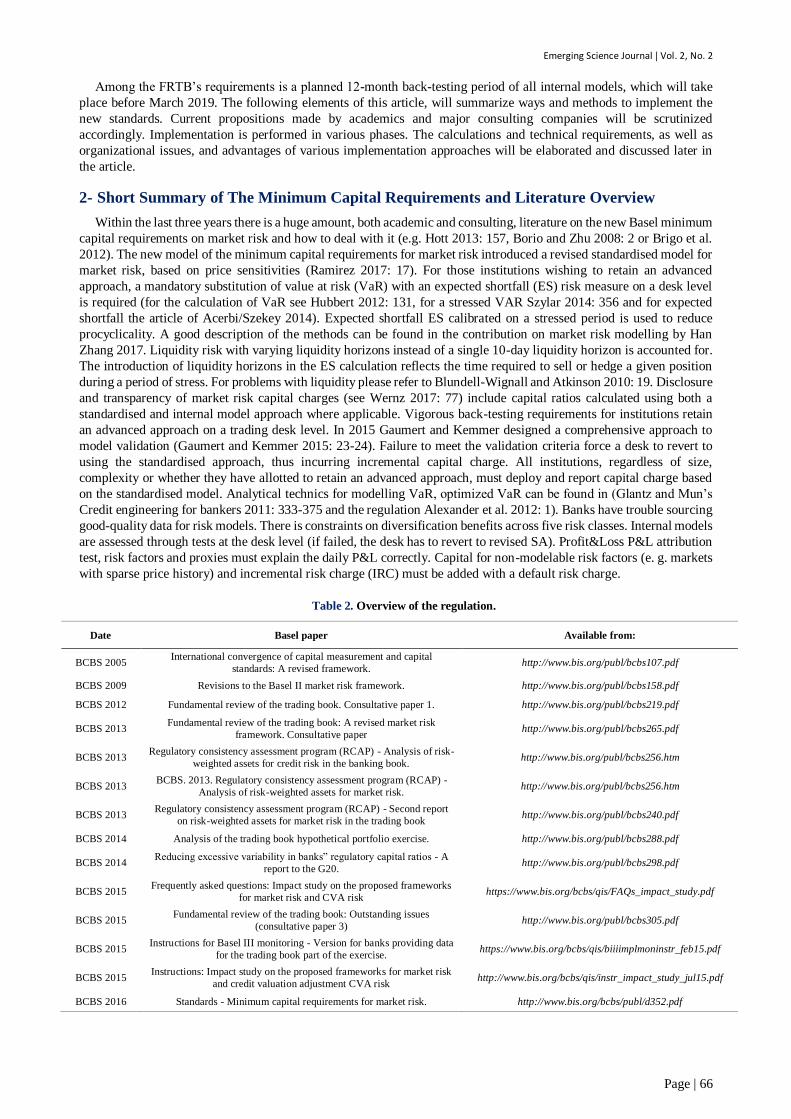
3- Analysis of Current Systems
First it should be determined how the bank’s market risk is measured and reported. A checklist must then be designed
to analyse the systems in use.
Figure 1. Analysis of current systems.
How frequently are risk limits reviewed? What is the scope of activities of the business units referring to market
risk? How is the authority for the delegation of market risk control limits organized? A process of investigation and
resolution of irregular or disputed transactions must be implemented.
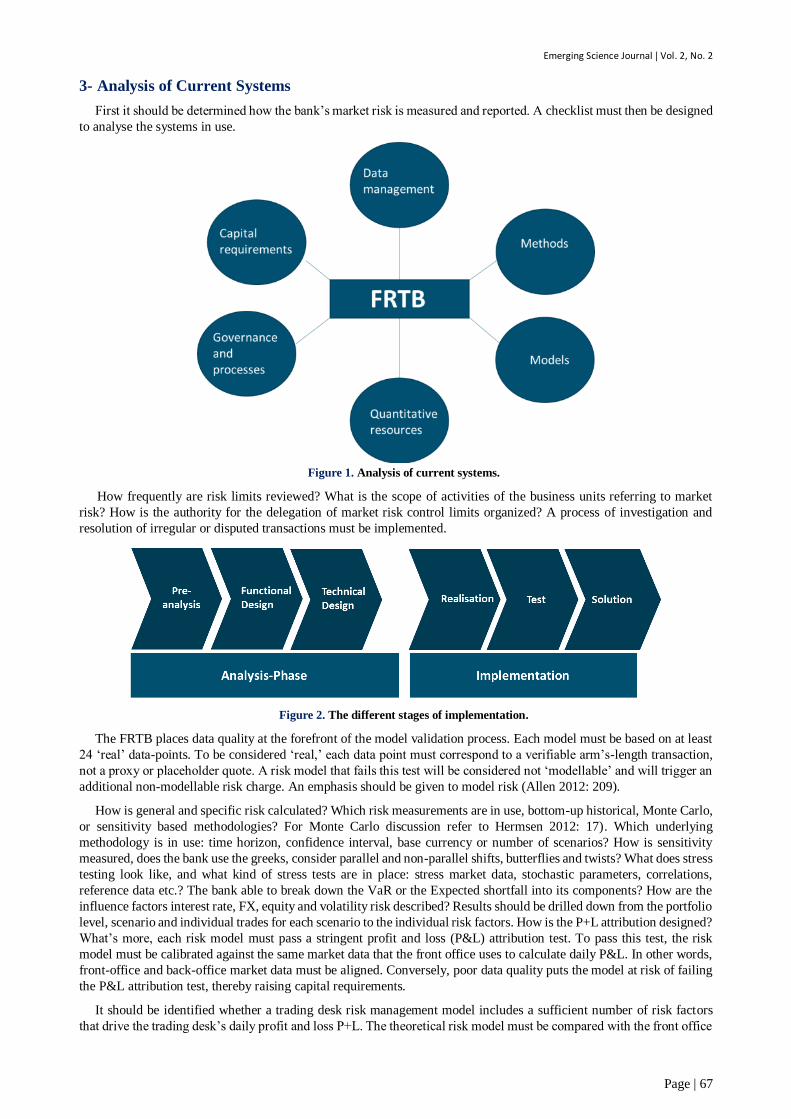
Figure 2. The different stages of implementation.
The FRTB places data quality at the forefront of the model validation process. Each model must be based on at least
24 ‘real’ data-points. To be considered ‘real,’ each data point must correspond to a verifiable arm’s-length transaction,
not a proxy or placeholder quote. A risk model that fails this test will be considered not ‘modellable’ and will trigger an
additional non-modellable risk charge. An emphasis should be given to model risk (Allen 2012: 209).
How is general and specific risk calculated? Which risk measurements are in use, bottom-up historical, Monte Carlo,
or sensitivity based methodologies? For Monte Carlo discussion refer to Hermsen 2012: 17). Which underlying
methodology is in use: time horizon, confidence interval, base currency or number of scenarios? How is sensitivity
measured, does the bank use the greeks, consider parallel and non-parallel shifts, butterflies and twists? What does stress
testing look like, and what kind of stress tests are in place: stress market data, stochastic parameters, correlations,
reference data etc.? The bank able to break down the VaR or the Expected shortfall into its components? How are the
influence factors interest rate, FX, equity and volatility risk described? Results should be drilled down from the portfolio
level, scenario and individual trades for each scenario to the individual risk factors. How is the P+L attribution designed?
What’s more, each risk model must pass a stringent profit and loss (P&L) attribution test. To pass this test, the risk
model must be calibrated against the same market data that the front office uses to calculate daily P&L. In other words,
front-office and back-office market data must be aligned. Conversely, poor data quality puts the model at risk of failing
the P&L attribution test, thereby raising capital requirements.
It should be identified whether a trading desk risk management model includes a sufficient number of risk factors
that drive the trading desk’s daily profit and loss P+L. The theoretical risk model must be compared with the front office
Emerging Science Journal | Vol. 2, No. 2
Page | 68
theoretical model. Can movements in P+L, VaR, and other risk methodologies be explained by underlying risk factors,
and trade movements? Are there back testing procedures in use (see also Acerbi/Szekely 2017)? Could the theoretical
P+L compared against the relevant VaR results and the realized P+L on a daily basis? Is the used market risk model
correctly calibrated? What backtesting criteria are in place? The availability of public trade data varies widely across
jurisdictions and products.
4- Implementation Challenges
In the beginning banks and consulting companies will face different implementation challenges. Various conferences
are organised by PRMIA and GARP to explain these problems (e.g. Risk Minds Conference 2016). Risk data
architecture, data integration, and coordination with the front office should be clearly defined. What is the relationship
between data quality and capital requirements? With an adequate P&L, attribution capital charges can be avoided. P&L
attribution has to be tested, e.g. with p-values as an alternative for P+L attribution. Back-testing for trading the different
desk level models must be approved (different backtesting procedures can be found in Wernz 2014: 79).
Table 3. Overview of the trading and banking book.
Changes in backtesting must be documented. Synergies between front desk and financial (market) risk should be
identified and used. Optimal desk structures allow various predefined scenarios for mitigation. Are the trading desk
modelling tools adequate when granular level risk analysis helps decide which desk lives or dies? Non-modellable risk
factors should be used for sourcing data. Capacities must be implemented to manage the increasing volume of model
outputs. A lack of infrastructure can mean varying degrees of granularity and inadequate risk data across all risk types.
Due to a lack of quality data, data cleansing and manual reconciliation may be demanding. The new reporting requires
more information and enable a strong risk management.
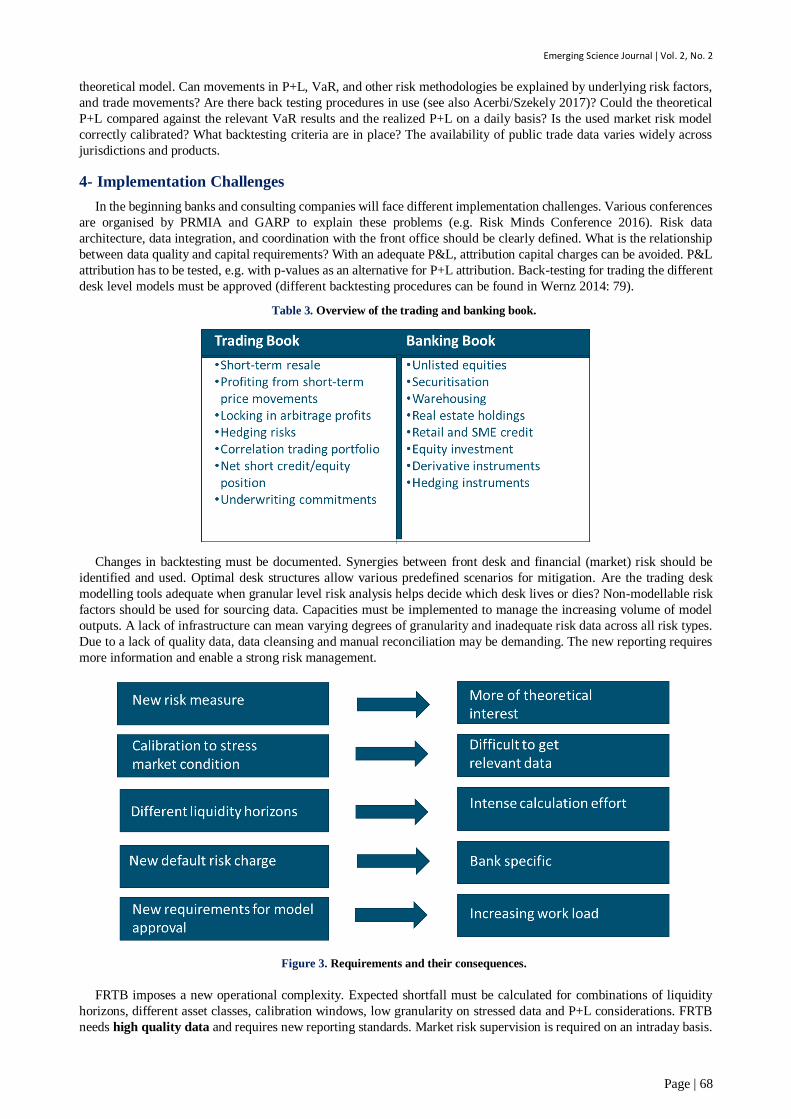
Figure 3. Requirements and their consequences.
FRTB imposes a new operational complexity. Expected shortfall must be calculated for combinations of liquidity
horizons, different asset classes, calibration windows, low granularity on stressed data and P+L considerations. FRTB
needs high quality data and requires new reporting standards. Market risk supervision is required on an intraday basis.
Emerging Science Journal | Vol. 2, No. 2
Page | 69
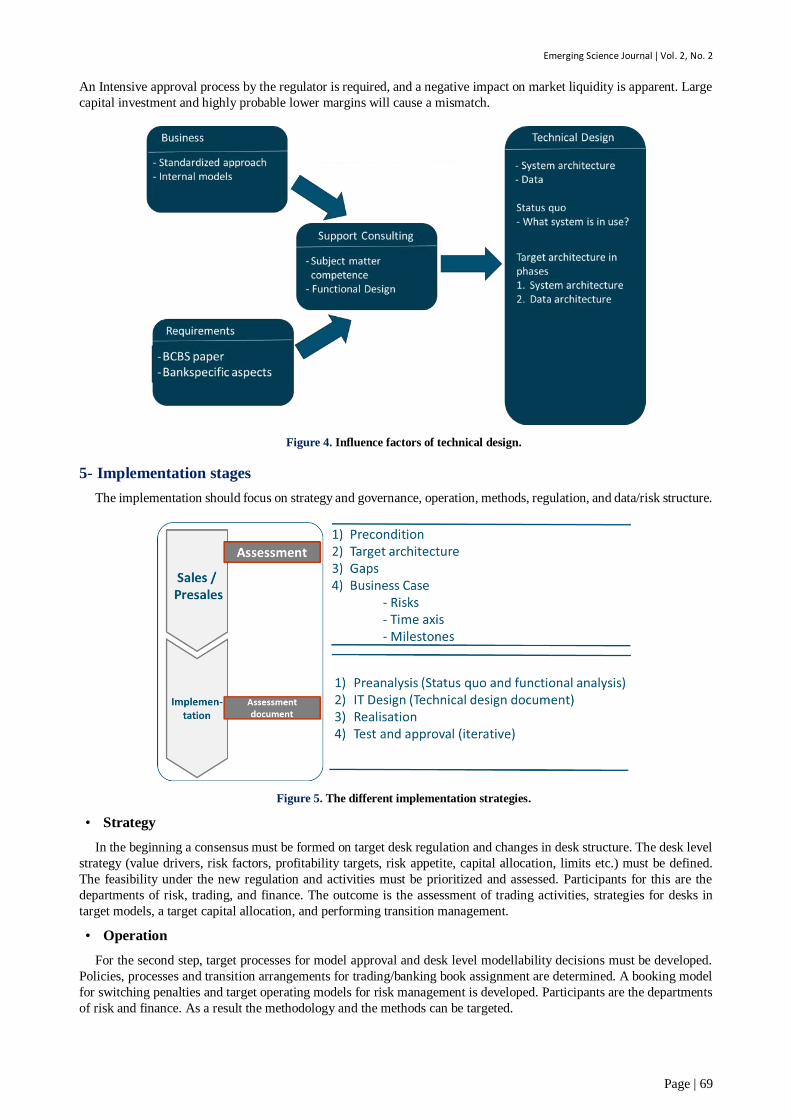
An Intensive approval process by the regulator is required, and a negative impact on market liquidity is apparent. Large
capital investment and highly probable lower margins will cause a mismatch.
Figure 4. Influence factors of technical design.
5- Implementation stages
The implementation should focus on strategy and governance, operation, methods, regulation, and data/risk structure.
Figure 5. The different implementation strategies.
• Strategy
In the beginning a consensus must be formed on target desk regulation and changes in desk structure. The desk level
strategy (value drivers, risk factors, profitability targets, risk appetite, capital allocation, limits etc.) must be defined.
The feasibility under the new regulation and activities must be prioritized and assessed. Participants for this are the
departments of risk, trading, and finance. The outcome is the assessment of trading activities, strategies for desks in
target models, a target capital allocation, and performing transition management.
• Operation
For the second step, target processes for model approval and desk level modellability decisions must be developed.
Policies, processes and transition arrangements for trading/banking book assignment are determined. A booking model
for switching penalties and target operating models for risk management is developed. Participants are the departments
of risk and finance. As a result the methodology and the methods can be targeted.
Emerging Science Journal | Vol. 2, No. 2
Page | 70
• Methods
Methodologies like the usage of ES, liquidity horizons, stressed calibration, residual risk add-ons etc. must be
adapted. The P&L attribution framework needs to be validated and calibrated. Stress periods have to be identified. The
regulatory credit valuation adjustment CVA (risk-neutral) is calculated and the quantitative impact is assessed, mainly
by benchmarking (please refer to Plank and Ludwig. 2012: 113). When implementing the FRTB, the bank will need to
compromise between obtaining a good VaR model, potentially resulting in conservative ES estimates, and obtaining a
less satisfactory VaR model, possibly resulting in more accurate ES estimates. Participants are the risk and finance
department. (For the explanation of the CVA please refer to Aresi/Olivo 2017 or Brigo 2013: 16).
• Regulation
The regulation for future desk level reporting needs to be more clearly defined. Internal and external reporting content
and granularity should be agreed on. In addition IMA/IMM approval under the new regime has to be obtained.
Participants will be departments of compliance, trading and risk. Target is the reporting methodology and the new
IMA/IMM approach.
• Data/Risk structure
Risk factors are reviewed and optimized. Gaps and potential improvements need to be identified. Data quality is
analysed and the impact of uncertainty onto risk measures is minimized. An impact assessment on the IT landscape is
performed. Lastly a target architecture for risk and finance is developed. Participants are the departments Risk, IT and
Finance. The outcome is a sourcing model for risk factors and a target system architecture. Some smaller consulting
companies use a different approach. In a first step decision making solutions are provided. FRTB streams need to be
coordinated, strategic and business related items have to be projected. Model performance needs to be benchmarked and
risk modelling approaches have to be quantified. The impact on organisation, IT, processes and businesses needs to be
assessed and simulated. Quantitative, organisational and processes are assessed and synergies implemented. Is FRTB
arbitrage possible? Optimal book structure and cost efficient processes need to be designed. Many approaches promise
a significant reduction in operational overhead with timely and practical capability for standardized models in advance
of the regulatory deadlines. Extensive data management environment permits to deliver a truly end-to-end solution that
embodies all the principles of the regulation. Third sources are used to provide accurate, complete, consistent and
available data, which can be integrated into the broader process.
Many consulting companies use a phasing approach. With the help of program management re-organization is
organized. In addition an impact analysis on organization, models, IT and processes is performed. A project management
office coordinates FRTB efforts and the IT data framework needs to be rationalized. With the help of the data
management IT makes diagnosis test on: as-is, target and opportunities for change. A data management framework used
to collect data, is managed, gathered and validated. Impacts are simulated and the strategy is projected. Risk modeling
and quantification are designed. The impact analysis needs to be performed between the IMA and SA approaches.
Decisions need to be supported and the communication with top management needs to be facilitated. Decision making
solutions are proposed. Validation procedures are defined and documented. There is an optimal capitalization with a
cross-impacts with synergies need to be quantitative. Are FRTB arbitrages still possible? Optimal book structure,
parallel runs and cost efficient processes need to be developed. Banks face complex implementation of the capital charge
calculation both within the SA and the IMA. Changes in terms of strategy and technical implementation are assessed.
Overall planning and detailed activities by the end of the year 2016 need to be provided.
New desk level approach for reporting purposes and validation impose new investment strategy by the end of the
year 2017 and a new architecture in terms of data provision, model creation and reporting by the end of the year 2017.
Operational burden (availability of sensitivities, market data, time series etc.) increase. The bank’s assets are divided
into asset classes (FX, equity, etc.). Each asset class is subdivided into risk buckets (large vs. small cap, emerging vs.
developed markets, etc.). For each risk bucket, the three risk sensitivities: Delta, Vega and Curvature (the latter two are
only for assets with optionality, such as callable bonds) are calculated.
These sensitivities are usually calculated by derivative pricing models, which must in turn be validated. In cases
where these models do not perform well enough empirically, the latter two risk charges need to be applied. Once
sensitivities are calculated, net out risks to account for hedges and aggregate net risks using formulae specified in the
FRTB and several correlation scenarios (specified to mimic crisis conditions). The scenario, which leads to the highest
required capital, has to be used.
Back testing activities, what if simulation and stress testing at the desk level for the entire year 2018 have to be
adapted. The implementation of the revised market risk standards needs to be organized by January 2019 and a first
reporting under the new standards by the end of the year 2019 is required.

Emerging Science Journal | Vol. 2, No. 2
Page | 71
Figure 6. New requirements of FRTB.
The two approaches IMA and SA raise implementation challenges, because they both require tons of data and many
calculations. Entirely new calculation measures are implemented with revised data standards and sources “to create more
reliable traded price data. Improvements in modelling are welcome” (Blundell-Wignall and Atkinson 2010: 11) and
increased number of simulations are performed relying on new data management techniques and data quality.
Aggregating and monitoring this risk data — both enterprise-wide and on a daily scale — will require substantial
infrastructure investments. Moreover, the risk monitoring group will have the new challenge of reconciling SA vs. IMA
models for a given desk, and explaining the impact of macro and micro factors on period-over-period changes in capital
requirements. On the other hand, this degree of monitoring also opens up new opportunities to identify patterns in
scenario results and to improve upstream risk processes.
6- One example timeline for implementation
Firm specific capabilities and requirements dictate the implementation. Phased roll-out to minimize risk and deal
with evolving regulatory requirements. In addition we take into account to work on other regulatory requirements like
BCBS 239, MIFID II etc.
Figure 7. Possible timeline of implementation.
Invitation - Phase 1 Phase 2 Phase 3 Phase 42016 Q4 2017 Q1 2017 Q2 2017 Q3 2017 Q4 2018 Q1
Delivery kick-off Delivery kick-off Delivery kick-off
Trading/Banking book Business Analytics and
Rev. Standard rules data sourcing
IMA Quantitative analysis
Replacement of VAR model and development
Non-modelable risk factors Technology delivery
Reporting and public disclosure
Target architecture Change management
Data model review /regulator development Model sign-offs Adopt Model sign-offs Adopt Model sign-offs Adopt
CCAR SUBMISSION MIFID II BCBS 239 FRTB
Emerging Science Journal | Vol. 2, No. 2
Page | 72
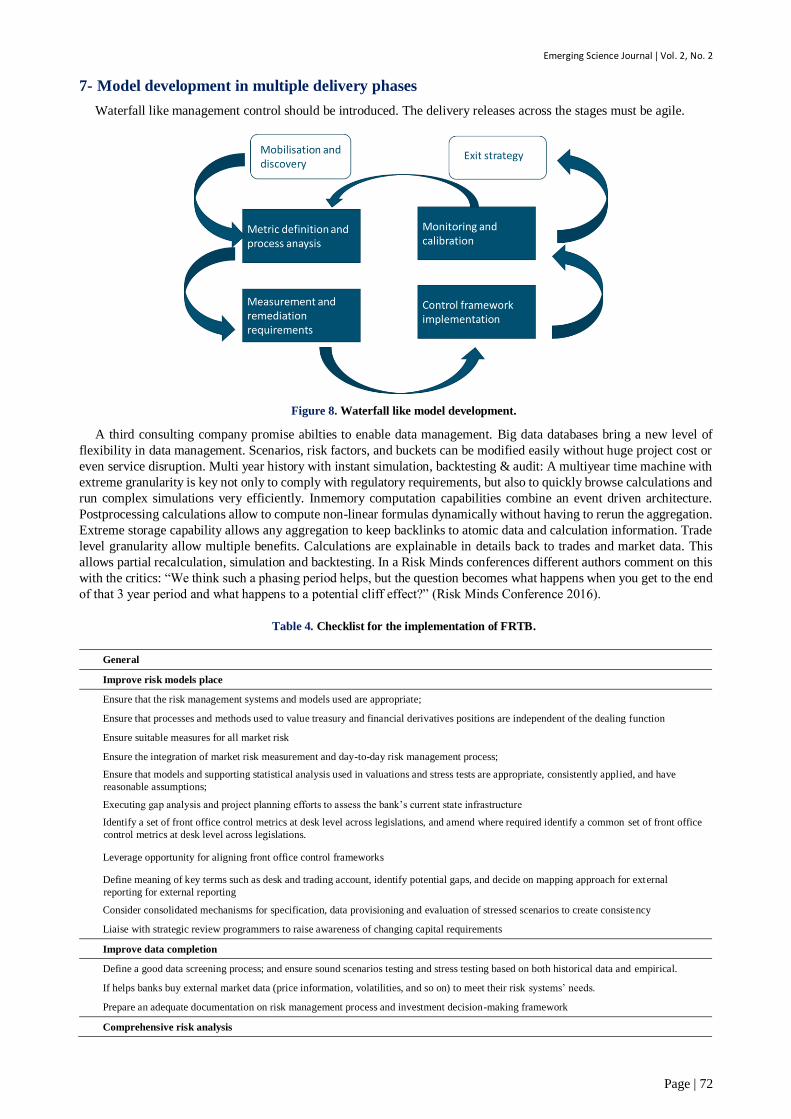
7- Model development in multiple delivery phases
Waterfall like management control should be introduced. The delivery releases across the stages must be agile.
Figure 8. Waterfall like model development.
A third consulting company promise abilties to enable data management. Big data databases bring a new level of
flexibility in data management. Scenarios, risk factors, and buckets can be modified easily without huge project cost or
even service disruption. Multi year history with instant simulation, backtesting & audit: A multiyear time machine with
extreme granularity is key not only to comply with regulatory requirements, but also to quickly browse calculations and
run complex simulations very efficiently. Inmemory computation capabilities combine an event driven architecture.
Postprocessing calculations allow to compute non-linear formulas dynamically without having to rerun the aggregation.
Extreme storage capability allows any aggregation to keep backlinks to atomic data and calculation information. Trade
level granularity allow multiple benefits. Calculations are explainable in details back to trades and market data. This
allows partial recalculation, simulation and backtesting. In a Risk Minds conferences different authors comment on this
with the critics: “We think such a phasing period helps, but the question becomes what happens when you get to the end
of that 3 year period and what happens to a potential cliff effect?” (Risk Minds Conference 2016).
Table 4. Checklist for the implementation of FRTB.
General
Improve risk models place
Ensure that the risk management systems and models used are appropriate;
Ensure that processes and methods used to value treasury and financial derivatives positions are independent of the dealing function
Ensure suitable measures for all market risk
Ensure the integration of market risk measurement and day-to-day risk management process;
Ensure that models and supporting statistical analysis used in valuations and stress tests are appropriate, consistently applied, and have
reasonable assumptions;
Executing gap analysis and project planning efforts to assess the bank’s current state infrastructure
Identify a set of front office control metrics at desk level across legislations, and amend where required identify a common set of front office
control metrics at desk level across legislations.
Leverage opportunity for aligning front office control frameworks
Define meaning of key terms such as desk and trading account, identify potential gaps, and decide on mapping approach for external
reporting for external reporting
Consider consolidated mechanisms for specification, data provisioning and evaluation of stressed scenarios to create consistency
Liaise with strategic review programmers to raise awareness of changing capital requirements
Improve data completion
Define a good data screening process; and ensure sound scenarios testing and stress testing based on both historical data and empirical.
If helps banks buy external market data (price information, volatilities, and so on) to meet their risk systems’ needs.
Prepare an adequate documentation on risk management process and investment decision-making framework
Comprehensive risk analysis
Emerging Science Journal | Vol. 2, No. 2
Page | 73
Define the lines of authority for managing market risk;
Define the scope of activities of the business units assuming market risk
Define delegation of approving authority for market risk control limit
Set up an independent risk management unit
Define appropriate procedures and processes to implement the market risk policy and strategy
Define a sound and comprehensive risk record-keeping system hedging
Define a sound process to monitor the activities of investment managers
Review and update procedure manuals regularly;
Re-evaluate and revise market risk measurement models and assumptions;
Set up an independent risk management unit;
Define appropriate procedures and processes to implement the market risk policy and strategy;
Define a sound and comprehensive risk record-keeping system hedging;
Project plan
Which projects to start first
Which programs can serve as accelerators (BCBS 239)
What is your lead time for the implementation of new instruments and new models
Define the frequency of review of risk limits.
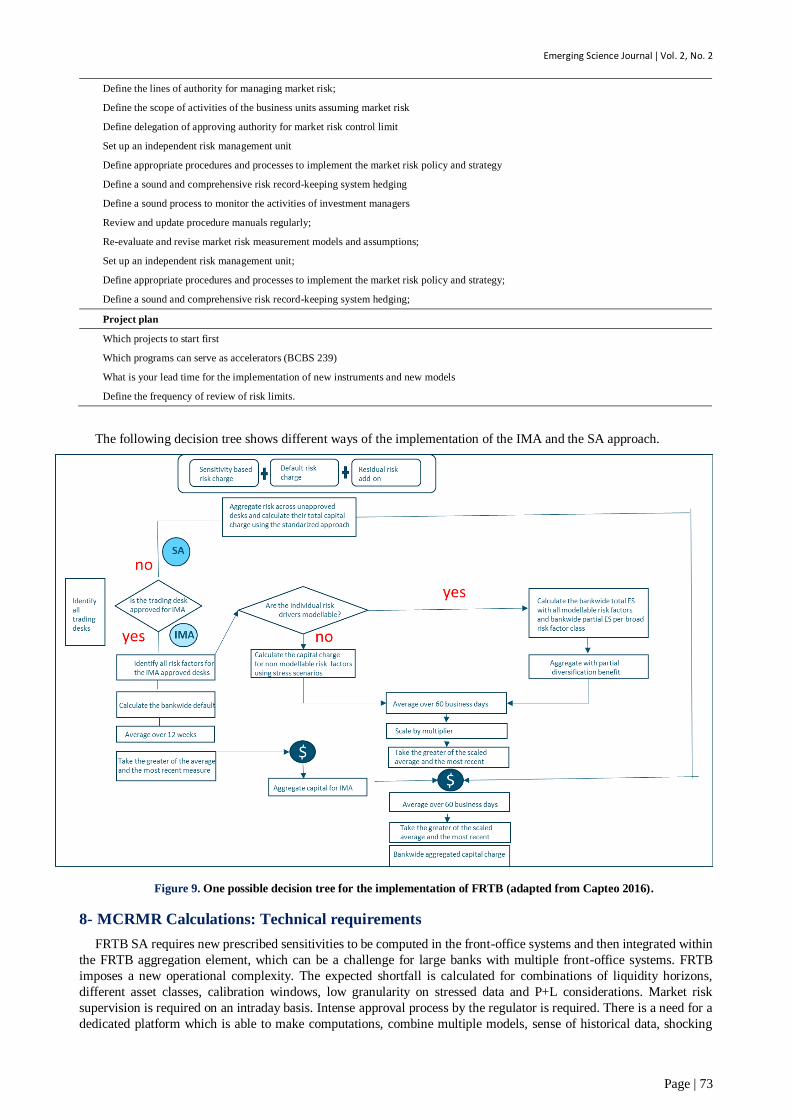
The following decision tree shows different ways of the implementation of the IMA and the SA approach.
Figure 9. One possible decision tree for the implementation of FRTB (adapted from Capteo 2016).
8- MCRMR Calculations: Technical requirements
FRTB SA requires new prescribed sensitivities to be computed in the front-office systems and then integrated within
the FRTB aggregation element, which can be a challenge for large banks with multiple front-office systems. FRTB
imposes a new operational complexity. The expected shortfall is calculated for combinations of liquidity horizons,
different asset classes, calibration windows, low granularity on stressed data and P+L considerations. Market risk
supervision is required on an intraday basis. Intense approval process by the regulator is required. There is a need for a
dedicated platform which is able to make computations, combine multiple models, sense of historical data, shocking
Emerging Science Journal | Vol. 2, No. 2
Page | 74
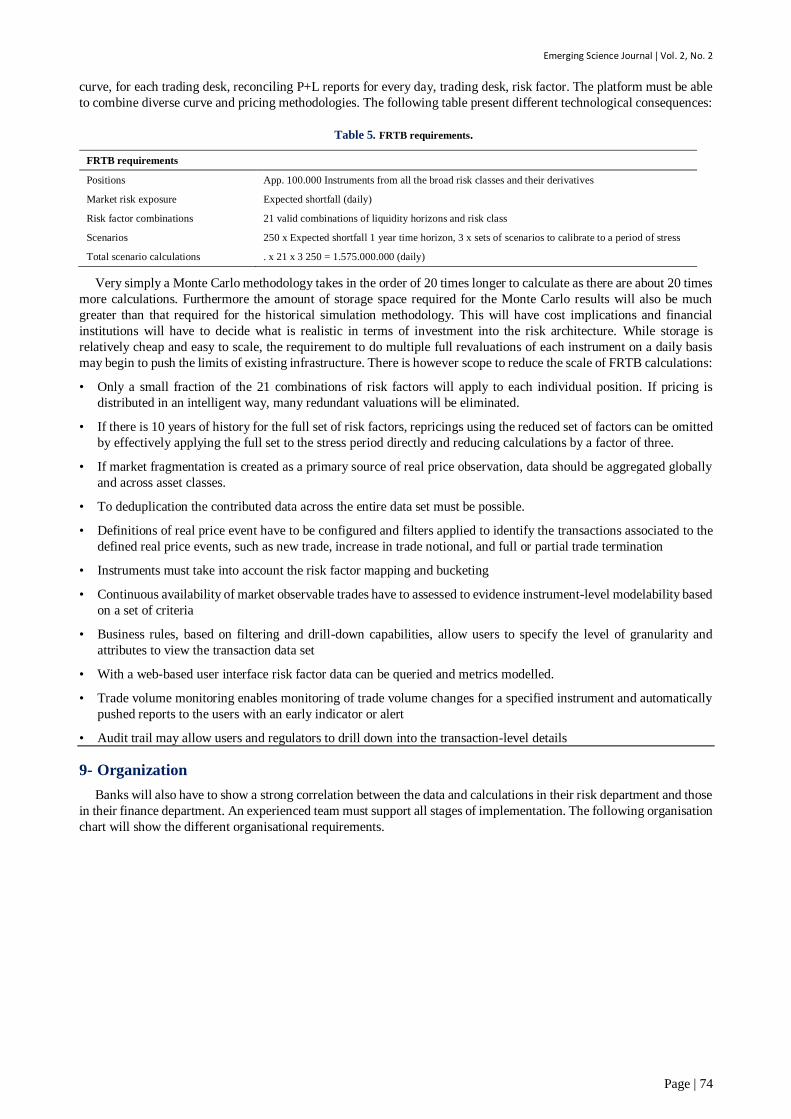
curve, for each trading desk, reconciling P+L reports for every day, trading desk, risk factor. The platform must be able
to combine diverse curve and pricing methodologies. The following table present different technological consequences:
Table 5. FRTB requirements.
FRTB requirements
Positions App. 100.000 Instruments from all the broad risk classes and their derivatives
Market risk exposure Expected shortfall (daily)
Risk factor combinations 21 valid combinations of liquidity horizons and risk class
Scenarios 250 x Expected shortfall 1 year time horizon, 3 x sets of scenarios to calibrate to a period of stress
Total scenario calculations . x 21 x 3 250 = 1.575.000.000 (daily)
Very simply a Monte Carlo methodology takes in the order of 20 times longer to calculate as there are about 20 times
more calculations. Furthermore the amount of storage space required for the Monte Carlo results will also be much
greater than that required for the historical simulation methodology. This will have cost implications and financial
institutions will have to decide what is realistic in terms of investment into the risk architecture. While storage is
relatively cheap and easy to scale, the requirement to do multiple full revaluations of each instrument on a daily basis
may begin to push the limits of existing infrastructure. There is however scope to reduce the scale of FRTB calculations:
• Only a small fraction of the 21 combinations of risk factors will apply to each individual position. If pricing is
distributed in an intelligent way, many redundant valuations will be eliminated.
• If there is 10 years of history for the full set of risk factors, repricings using the reduced set of factors can be omitted
by effectively applying the full set to the stress period directly and reducing calculations by a factor of three.
• If market fragmentation is created as a primary source of real price observation, data should be aggregated globally
and across asset classes.
• To deduplication the contributed data across the entire data set must be possible.
• Definitions of real price event have to be configured and filters applied to identify the transactions associated to the
defined real price events, such as new trade, increase in trade notional, and full or partial trade termination
• Instruments must take into account the risk factor mapping and bucketing
• Continuous availability of market observable trades have to assessed to evidence instrument-level modelability based
on a set of criteria
• Business rules, based on filtering and drill-down capabilities, allow users to specify the level of granularity and
attributes to view the transaction data set
• With a web-based user interface risk factor data can be queried and metrics modelled.
• Trade volume monitoring enables monitoring of trade volume changes for a specified instrument and automatically
pushed reports to the users with an early indicator or alert
• Audit trail may allow users and regulators to drill down into the transaction-level details
9- Organization
Banks will also have to show a strong correlation between the data and calculations in their risk department and those
in their finance department. An experienced team must support all stages of implementation. The following organisation
chart will show the different organisational requirements.

Emerging Science Journal | Vol. 2, No. 2
Page | 75
Figure 10. Organizational requirements.
Differences between jurisdictions would be a cause for concern. It would be problematic if a trading desk based in
the UK were hedging exposures in the US and one of the two countries’ regulators denied model approval. If we have
similar infrastructure and governance around one desk and one is approved and one is not. Then hedges are broken,
according to the rules.
10- Advantages of the new system
The new implementation significantly should reduce the operational overhead capability for standardized models in
advance of the regulatory deadlines. Detailed reports to advanced and standardized reports are provided. A mechanism
to benchmark model performance is implemented. Early deployment supports banks ascertain impact analysis in
advance of the regulatory deadline. The bank can greatly simplify the implementation though the introduction of a
standard data model to enable an organization to focus on sourcing the right data. Banks would give valuable insight
into seasonal trends of Risk On / Risk Off across different clients. This could be used to generate more business or to
mitigate risks with certain clients during certain periods. Any bank that manages to crack this will definitely lean a
competitive advantage. There is a chance for banks to leverage on several synergies coming from the FRTB
implementation. Banks have the opportunity to reduce the operational implementation burdens and their market risk
capital charges by pooling observable transaction data to evidence and to demonstrate that the associated risk factors
meet the “real” price standards under FRTB.
In their 2016 research report Alessi et al. analysed different scenarios for the implementation of the FRTB. Assuming
that the banks hold no capital in excess of their MCR minimum capital requirements, the implementation of FRTB
reduces contingent liabilities from the banking sector by 15%. In another scenario public support is reduced from 11%
to 48% compared to a baseline scenario.
11- Conclusion
Several European banks have put all efforts towards a fundamental review of the trading book on hold, claiming there
is too much regulatory uncertainty. The US has said it needs more time to review the framework. Australia, Hong Kong
and Singapore have all announced delays, and last week the European Council called for a four-year delay for
implementation. Currently it is nearly impossible to start testing because no one knows the parameters. This article
concentrated on the FRTB-SBM implementation. However, improvements in the handling of data is a vitally important
topic banks should face in order to adapt their frameworks to the new rules set by regulators. Since there is a tendency
for regulators to standardise capital requirements, and to make computations more sensitivity-based. The banks
themselves have underestimated implementation costs. Instead of focusing on the development of new services to the
economy as well improving existing counterparty services and providing liquidity, a large share of banks” intellectual
and financial resources will be devoted to the implementation and management of new prudential regulations. The real
price and non-modellable risk factors NMRF requirements in FRTB will pose significant implementation challenges
and potentially large increases in market risk capital that banks are required to hold. A state of the art approach must be
able to demonstrate model ability of risk factors, leverage the existing data collection and process infrastructure. There
is a need to penalise regulatory arbitrage. Possible challenges for further research on this topic are widespread. It might
Emerging Science Journal | Vol. 2, No. 2
Page | 76
be interesting to explore how the interaction of the level of regulatory capital of the different risk types might affect
financial market stability. New methods and models for risk management are on the way (see Yang 2017: 281).
12- References
[1] Acerbi, Carlo, and Balazs Szekely. “General Properties of Backtestable Statistics.” SSRN Electronic Journal (2017).
doi:10.2139/ssrn.2905109.
[2] Acerbi, C. and B. Szekey. “Backtesting Expected Shortfall - Introducing three model-independent, non-parametric backtest
methodologies for Expected Shortfall.” Working paper MSCI Inc, 2014.
[3] Allen, S., Financial Risk Management. John Wiley and sons. Hoboken, NJ, 2012.
[4] Alessi, L. et al.. “Estimation of potential benefits of the implementation of the fundamental review of the trading book and
leverage ratio”, Europe: Publications Office of the European Union, 2016.
[5] Alexander, Gordon J., Alexandre M. Baptista, and Shu Yan. “On the Regulatory Responses to the Recent Crisis: An Assessment
of the Basel Market Risk Framework and the Volcker Rule.” SSRN Electronic Journal (2012). doi:10.2139/ssrn.2133583.
[6] Aresi, G. and L. Olivo. “The Effects of FRTB in the CVA Risk Framework,” in: Liason – essential services for financial
institutions, research paper series, 2017.
[7] Brigo, Damiano, Massimo Morini, and Andrea Pallavicini. “Counterparty Credit Risk, Collateral and Funding” (August 1, 2013).
Doi:10.1002/9781118818589.
[8] BCBS. 2009. “Revisions to the Basel II market risk framework” Basel Committee on Banking Supervision,” January 2016.
Access at: http://www.to.org/publ/bcbs158.pdf
[9] BCBS. 2015. “Fundamental review of the trading book – interim impact analysis,” Bank for International Settlements, November
2015. Access at: http://www.to.org/bcbs/publ/d346.htm
[10] BCBS. 2016. “Minimum capital requirements for market” Basel Committee on Banking Supervision, January 2016. Access at:
http://www.to.org/bcbs/publ/d352.htm
[11] Blundell-Wignall, A. and P. Atkinson. “Thinking beyond Basel III: Necessary solutions for capital and liquidity,” in: OECD
Journal: Financial Market Trends Volume 2010 – Issue 1.
[12] Borio, C. and H. Zhu. “The future of banking regulation - Capital regulation, Risk-Taking and Monetary Policy: A Missing Link
in the Transmission Mechanism?” BIS Working Paper No. 268, 2009.
[13] Friedman, J. and W. Kraus. “Engineering the Financial Crisis Systemic Risk and the Failure of Regulation”. University of
Pennsylvania Press: Philadelphia, 2011.
[14] Gaumert, Uwe, and Michael Kemmer. “Regulatory Developments in Risk Management: Restoring Confidence in Internal
Models.” Springer Proceedings in Mathematics & Statistics (2015): 19–37. Doi:10.1007/978-3-319-09114-3_2.
[15] Glantz, M. and J. Mun,. Credit engineering for bankers – A practical guide for bank lending. Elsevier: Oxford, 2011.
[16] Hermsen, O. The influence of Basel II and III frameworks on financial markets stability. Dissertation university of Bamberg:
Bamberg, 2012.
[17] Hubbert, S., Essential mathematics for market risk management. John Wiley and sons: Hoboken, NJ, 2012.
[18] Hellmann, T., Kevin, K., Murdock, C. and J. Stigliz. “Liberalization, Moral Hazard in Banking, and Prudential Regulation: Are
Capital Requirements Enough?” The American economic review 2000.
[19] Hott, Christian. “An Economic Approach to Market Risk.” Financial Crises, Sovereign Risk and the Role of Institutions (2013):
157–168. Doi:10.1007/978-3-319-03104-0_10.
[20] Lobanov, Alexey. “Current Trends in Prudential Regulation of Market Risk: From Basel I to Basel III.” Market Risk and
Financial Markets Modeling (2012): 129–139. Doi:10.1007/978-3-642-27931-7_13.
[21] Orgeldinger, J. “Critical appraisal of the Basel fundamental review of trading book regulations,” in: Journal or risk management
in financial institutions, Vol. 10, 3, 2017, Henry Stewart Publications.
[22] Plank, M. and S. Ludwig. “Credit-Valuation-Adjustments; eine kurze mathematische Einführung und ein praktischer Überblick,”
in: S. Ludwig, M. Martin and C. Wehn.2012. Kontrahentenrisiko – Bewertung, Steuerung, Unterlegung nach Basel III und IFRS,
Schaeffer Poeschel: Leipzig. 2012.
[23] Ramirez, J.. Handbook of Basel III Capital – Enhancing bank capital in practice, John Wiley & Sons: Chichester, 2017.
[24] Risk Minds Conference. “Challenges in the implementation of FRTB,” London, 2016.

Emerging Science Journal | Vol. 2, No. 2
Page | 77
[25] Szylar, C. “Handbook on market risk,” John Wiley & Sons, Hoboken, 2014.
[26] Tian, Weidong, ed. “Commercial Banking Risk Management” (2017). Doi:10.1057/978-1-137-59442-6.
[27] Wernz, J., Bank Management and Control -Strategy, Capital and Risk Management. Heidelberg: Springer Verlag, 2014.
[28] Yang, Y., Modern risk management tools and applications, in: Tian, Weidong.2017. Commercial Banking Risk Management -
Regulation in the Wake of the Financial Crisis. Palgrave Macmillan: New York, 2017.
[29] Zhang, Han. “Market Risk Modeling Framework under Basel.” Commercial Banking Risk Management (December 9, 2016):
35–52. Doi:10.1057/978-1-137-59442-6_2.