Embed Size (px)
Citation preview
1.1 PREVALENCE: Recent Data from Member States
228
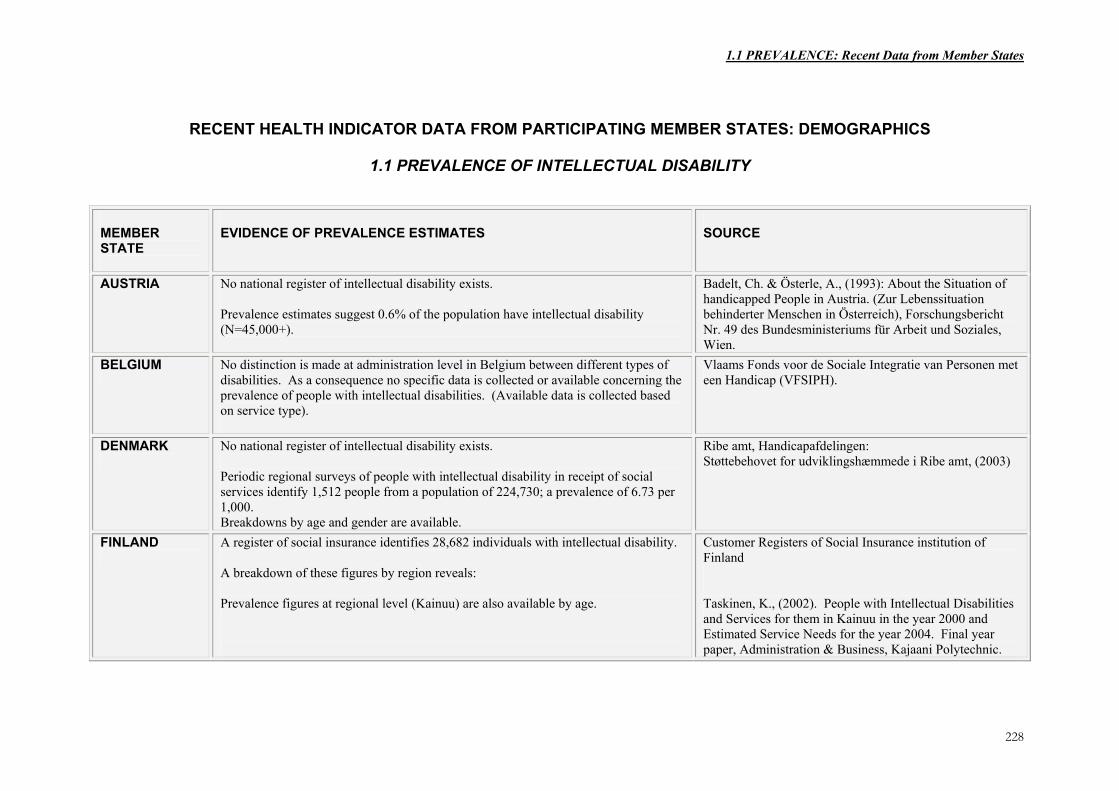
RECENT HEALTH INDICATOR DATA FROM PARTICIPATING MEMBER STATES: DEMOGRAPHICS
1.1 PREVALENCE OF INTELLECTUAL DISABILITY MEMBER STATE
EVIDENCE OF PREVALENCE ESTIMATES
SOURCE
AUSTRIA No national register of intellectual disability exists. Prevalence estimates suggest 0.6% of the population have intellectual disability (N=45,000+).
Badelt, Ch. & Österle, A., (1993): About the Situation of handicapped People in Austria. (Zur Lebenssituation behinderter Menschen in Österreich), Forschungsbericht Nr. 49 des Bundesministeriums für Arbeit und Soziales, Wien.
BELGIUM
No distinction is made at administration level in Belgium between different types of disabilities. As a consequence no specific data is collected or available concerning the prevalence of people with intellectual disabilities. (Available data is collected based on service type).
Vlaams Fonds voor de Sociale Integratie van Personen met een Handicap (VFSIPH).
DENMARK
No national register of intellectual disability exists. Periodic regional surveys of people with intellectual disability in receipt of social services identify 1,512 people from a population of 224,730; a prevalence of 6.73 per 1,000. Breakdowns by age and gender are available.
Ribe amt, Handicapafdelingen: Støttebehovet for udviklingshæmmede i Ribe amt, (2003)
FINLAND
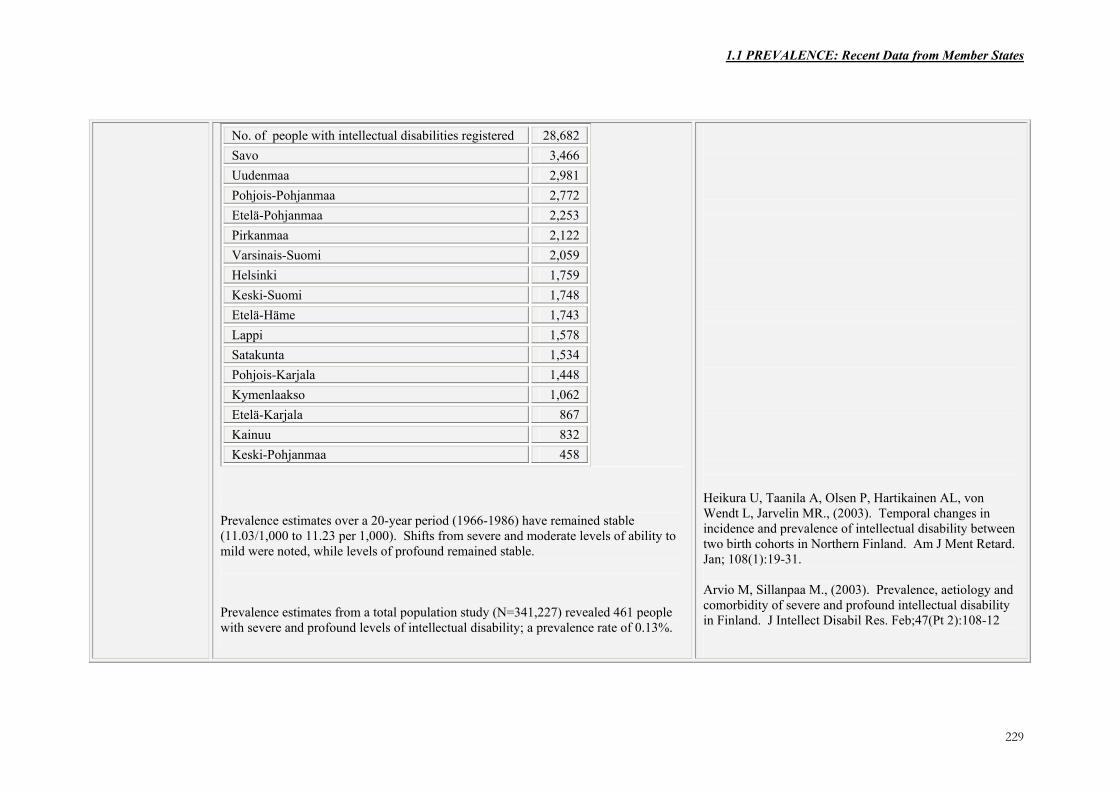
A register of social insurance identifies 28,682 individuals with intellectual disability. A breakdown of these figures by region reveals: Prevalence figures at regional level (Kainuu) are also available by age.
Customer Registers of Social Insurance institution of Finland Taskinen, K., (2002). People with Intellectual Disabilities and Services for them in Kainuu in the year 2000 and Estimated Service Needs for the year 2004. Final year paper, Administration & Business, Kajaani Polytechnic.
1.1 PREVALENCE: Recent Data from Member States
229
No. of people with intellectual disabilities registered 28,682 Savo 3,466 Uudenmaa 2,981 Pohjois-Pohjanmaa 2,772 Etelä-Pohjanmaa 2,253 Pirkanmaa 2,122 Varsinais-Suomi 2,059 Helsinki 1,759 Keski-Suomi 1,748 Etelä-Häme 1,743 Lappi 1,578 Satakunta 1,534 Pohjois-Karjala 1,448 Kymenlaakso 1,062 Etelä-Karjala 867 Kainuu 832 Keski-Pohjanmaa 458
Prevalence estimates over a 20-year period (1966-1986) have remained stable (11.03/1,000 to 11.23 per 1,000). Shifts from severe and moderate levels of ability to mild were noted, while levels of profound remained stable. Prevalence estimates from a total population study (N=341,227) revealed 461 people with severe and profound levels of intellectual disability; a prevalence rate of 0.13%.
Heikura U, Taanila A, Olsen P, Hartikainen AL, von Wendt L, Jarvelin MR., (2003). Temporal changes in incidence and prevalence of intellectual disability between two birth cohorts in Northern Finland. Am J Ment Retard. Jan; 108(1):19-31. Arvio M, Sillanpaa M., (2003). Prevalence, aetiology and comorbidity of severe and profound intellectual disability in Finland. J Intellect Disabil Res. Feb;47(Pt 2):108-12

1.1 PREVALENCE: Recent Data from Member States
230
FRANCE
The Handicaps, Incapacités, Dépendance" (HID)(Disabilities, Impairments, Dependence) population survey was carried out between 1998 and 2001. Data is reported by disability, age, gender and residential settings. Current breakdown of respondents combines those with intellectual disability with those with ‘mental disability’ (e.g. autism, personality disorders, etc.). Data is also available for those with visceral, metabolic, hearing or visual impairment. Prevalence estimates for those with intellectual and mental disability only are presented below by residential setting:
Resident in the Family Home Intellectual or Mental Disability
French Population
Percent 0-19 years 4 % 14,770,000 20-39 years 2 % 16,170,000 40-59 years 3 % 14,910,000 + 60 years 2 % 11,570,000 Total 3 % 57,410,000
Resident in Special Institution Intellectual
or Mental Disability
People in institution (Every type)
Percent 0-19 years 63% 48,600 20-39 years 56 % 69,200 40-59 years 50 % 58,600 + 60 years 12 % 483,800 Total 24 % 660,200
http://rfr-handicap.inserm.fr/handiwebeng/seehid.html Goillot C. & Mormiche P. (2002) Enquête “Handicaps, Incapacités, Dépendance” auprès des personnes vivant à domicile en 1999. INSEE Résultats, Collection Société, n°6. Goillot C. & Mormiche P. (2001) Enquête“Handicaps, Incapacités, Dépendance” auprès des personnes en instituion en 1998. INSEE Résultats, Collection Démographie-Société, n°83-84.

1.1 PREVALENCE: Recent Data from Member States
231
Prevalence data can also be obtained from the educational status of children with intellectual and mental disabilities.
Education Places for Children with Intellectual & Mental Disabilities
Children in Mainstream Primary Schools (full-time) 10,244 Children in Mainstream Primary Schools (part-time) 4,647 Older Children in Mainstream Secondary Schools 1,716 Children in Special Classrooms in Mainstream Primary Schools
41,351
Older Children in Special Classrooms in Mainstream Secondary Schools
1,376
Trends in placement options for children in France were monitored between 1987 and 2001, findings from which are presented below:
Centres for Children Places (Number)
Rate Places/1,000 inhabitants 0-19 years old
1987 2001 1987 2001 Specialised Education Centres in intellectual disability for Children (IME)
83,228 71,207 5.3 4.6
Specialised Education Centres in severe intellectual disability and motor impairments
522 4,387 0 0.3
Re-education Institute (IR) for those with challenging behaviour and personality disorders
13,363 15,617 0.8 1.0
Home care and Specialised Education Centres (SESSAD)
6,577 22,835 0.4 1.5
Ministère de la Jeunesse, de l'Education nationale et de la Recherche. Données Statistiques http://www.education.gouv.fr/thema/special/statistique.htm Brouard C. (coord.) (2004) “Le Handicap en chiffres, février 2004” CTNERHI-DREES-DGAS, Ministère des Affaires Sociales de la Solidarité, de la Santé et des Personnes Handicapées.

1.1 PREVALENCE: Recent Data from Member States
232
Trends in placement options for adults in France have also been monitored between 1988 and 2002, findings from which are presented below:
Centres for Adults Places (Number)
Percentage
1988 2002 ID/Total Severe ID & Motor
Impairment “Ateliers Proteges” 50% 0% “Centres d’Aide par le Travail” 64,362 97,378 76% 0% “Foyers d’Hebergement” 30,915 40,357 76% 0% “Foyers Occupationnels” 13,755 34,453 70% 2% “Foyers Accueil Medicalise” - 8,978 44% 11% “Maison d’Accueil Specialisees”
4,711 14,342 48% 28%
113,743 195,508 Population based prevalence studies have compared the prevalence of intellectual disability among cohorts of children across three time spans 1976-78, 1979-81 and 1982-84. Results indicate a decrease in prevalence for those with more severe levels of ability.
Type of Disability 1976-78 1979-81 1982-84 P value per 1000 per 1000 per 1000
Downs Syndrome 0.93 0.95 0.97 0.76 Others severe ID 2.37 2.28 1.92 0.03 Autism 0.45 0.68 0.42 0.76 Cerebral Palsy 1.84 1.71 1.92 0.03
Evans A. (coord.) (2003) Données sur la situation sanitaire et sociale en France en 2003. DREES-Ministère des Affaires sociales du Travail et de la Solidarité- Ministère de la Santé de la Famille et des Personnes Handicapées. Paris, France. http://www.sante.gouv.fr/drees/donnees/donnees2003ch2.pdf Rumeau-Rouquette C., Du Mazaubrun C. & al. (1994) Prévalence des handicaps. Evolution dans trois générations d’enfants: 1972,1976,1981. Editions INSERM, Paris. 177p. Rumeau-Rouquette C., Grandjean H &t al (1997) Prevalence and time trends of disabilities in School-Age Children International J. of Epidemiology 26, 1: 137-145. Rumeau-Rouquette C. & Du Mazaubrun C. (1998) Prévalence et évolution chronolique des déficiences à l’âge scolaire. Direction Général e de la Santé Bulletin Epidémiologique Hebdomadaire, 19, 4 p.

1.1 PREVALENCE: Recent Data from Member States
233
GERMANY
Statististisches Bundesamt collate official statistics in Germany regarding disability. This data however is limited to those with ‘severe disability’. Data is available regarding the number of certified persons (eligibility for service provision), demographics, residential setting and type, aetiology & severity of disability. In 2001 a total of 6,711,797 people with severe levels of disability were registered. A breakdown of those with ‘disturbances of mental development’ by age is presented:
Age Persons Registered < 4 years 2,128 4-18 years 27,856 18-34 years 75,426 35-45 years 61,620 46-60 years 46,625 60-75 years 25,292 > 75 years 6,014 Total 244,961
Statistisches Bundesamt (2003)
IRELAND
A National Intellectual Disability Database was established in 1995 and comprises three types of information: demographics, current service provision and future requirements. The database includes those with moderate, severe and profound levels of disability and those with mild levels of disability who are, or will be, in need of service provision. Data from 2003 identifies 25,557 people on the database; a prevalence rate of 6.25 per 1,000 (the administrative prevalence rate for mild ID is 2.38 per 1,000; prevalence rate for moderate, severe and profound ID is 3.72 per 1,000). The administrative prevalence rate for mild ID has decreased from 2.38/1000 in 2003 to 2.40/1000 in 2002. This reduction is mainly attributed to refinements in the dataset. The prevalence rate for moderate, severe and profound ID remains largely stable.
Barron, S., & Mulvaney, F. (2004) National Intellectual Disability Database Committee Annual Report 2003. Health Research Board, Dublin.

1.1 PREVALENCE: Recent Data from Member States
234
Age ranges % 0-19 years 33.5% 20-34 years 28.1% 35-54 years 28.5% 55 years + 10.0%
Time trends between 1996 and 2003 reveal:
• A reduced prevalence in the 0-4 year age group. • An overall upward trend in prevalence among the 5-9 year and 10-14 year age
groups. • A downward trend in prevalence in the 15-19 year, 20-34 year and 35-54 year
age group. The 35-54 year age group has the highest prevalence of moderate, severe and profound intellectual disability.
• An increase in the prevalence for the 55 years and over group revealing a 21% increase in numbers during the period.
Health Board Regions N % Eastern Regional Health Authority Region 8,574 33.5 Midland Health Board Region 1,366 5.3 Mid Western Health Board Region 2,423 9.5 North Eastern Health Board Region 2,017 7.9 North Western Health Board Region 1,773 6.9 South Eastern Health Board Region 3,147 12.3 Southern Health Board Region 3,603 14.1 Western Health Board Region 2,654 10.4 TOTAL 25,557 100
Prevalence figures are available by geographical region (above). These regions are defined according to the area in which the individual receives support, as opposed to the area where the individual was born.

1.1 PREVALENCE: Recent Data from Member States
235
ITALY
No national register of intellectual disability exists. The Handicap Information System Project has been established to coordinate the collection of disability data. Current data suggests that 1% (N= 578,440) of the population have disabilities. Regional prevalence estimates are available for non-specific disabilities and for some intellectual disabilities such as Downs’ Syndrome.
Regional Prevalence Data % Disabled Live Births Down Syndrome (N)
Piemonte 4.3 23 Valle d’Aosta 3.2 0 Lombardia 4.4 111 Trentino-Alto Adige - 11 Bolzano 2.9 4 Trento 3.9 7 Veneto 4.1 30 Friuli-Venezia Giulia 4.3 5 Liguria 4.8 7 Emilia-Romagna 5.4 21 Toscana 5.6 15 Umbria 4.8 11 Marche 5.8 9 Lazio 4.5 41 Abruzzo 5.9 15 Molise 5.5 2 Campania 4.4 30 Puglia 4.9 43
ISTAT: Italy’s National Statistical Institute; Health Conditions and Access to Health Services. Buono, S., et al., (2004). Health Indicators for People with Intellectual Disabilities. Life Span & Disability (In press)

1.1 PREVALENCE: Recent Data from Member States
236
Basilicata 5.5 5 Calabria 7.0 24 Sicilia 6.9 44 Sardegna 5.4 15
Demographic information regarding people with intellectual disabilities is estimated from clinically referred sample studies. A recent survey conducted by the OASI Institute revealed:
Sample (N=2,919) % over 18 years 33.6% Mild 26.9% Moderate 24.3% Severe 25.2% Profound 11.1% NAS 12.4%
LUXEMBOURG
No national register of intellectual disability exists. Prevalence estimates of all disabilities (physical, sensory, intellectual, etc.,) suggest that 10% of the population (439,500) have a disability. Limited demographic information is available regarding the prevalence of those in institutionalised care based on social support.
STATEC Service of statistic and economic studies B.P. 304 L-2013 Luxembourg Info-Handicap Service for national information and meeting point for handicap persons B.P. 33 L-5801 Hesperange http:// www.info-handicap.lu

1.1 PREVALENCE: Recent Data from Member States
237
Sample (N=581) Age Range % 0-19 years 6.7% 20-39 years 38.8% 40-59 years 42.0% 60-79 years 12.2% 80 years + 0.3%
[email protected] Ministry of family and social services Service for handicap persons L-2919 Luxembourg Annex page 134; 135
NETHERLANDS
No national register of intellectual disability exists. Prevalence estimates for intellectual disability range 0.543% to 0.699% depending on the methods of extrapolation employed. Age breakdowns for these estimates are available:
Age Range % <20 years 22.0% 20-34 years 19.2% 35-49 years 31.7% 50-69 years 23.0% >70 years 4.1%
Forecast of prevalence change suggest that while a 2% increase will be noted in the next 10 years, this figure will increase to 7% over the next 12 years. Longer life expectancy is identified as the causal factor in the prevalence increase. No comparable increase is forecast for incidence.
Mensen met een verstandelijke beperking in Nederland, Universiteit Maastricht, 2002
SPAIN
The National Survey on Disabilities, Deficits and Health States (Encuesta Nacional sobre Discapacidades, Deficits y Estados de Salud) INE and IMSERSO, 1999 provides information on people with disabilities in Spain.
The National Survey on Disabilities, Deficits and Health States (Encuesta Nacional sobre Discapacidades, Deficits y Estados de Salud) INE and IMSERSO, 1999.

1.1 PREVALENCE: Recent Data from Member States
238
Disability N % Developmental Disorders 6,808 4.81% Severe & profound intellectual disability 31,365 22.18% Moderate intellectual disability 62,009 43.84% Mild & borderline intellectual disability 41,259 29.17% Total 141,441 100% Prevalence per 1,000 3.50
Prevalence estimates from the National Database on People with Disability suggest that 170,924 individuals have intellectual disability, a prevalence of 4.20. A regional study in Comunidad Autonoma Valenciana analysed the prevalence of borderline intellectual functioning among children under 14 years. Prevalence rates of 13.97 per 1,000 were reported. The authors conclude that assuming a constant prevalence rate for the population under 45 years of age (0.14 per 1,000), half of it for the population between 45-60 years old (0.7 per 1,000) and 0.2 above 61, the rates of intellectual disability are calculated at approximately 0.55% or 225,000 individuals.
National Database on People with Disability (Base de datos Estatal de Personas con Tomás J. Estudio del Retraso mental en la Comarca de La Safor. Generalitat Valenciana, Valencia, 1991
SWEDEN
No national register of intellectual disability exists. Census information is available from the Central Bureau of Statistics. People with intellectual disability are estimated to comprise 0.4% of the population, approximately 36,000 people. The estimate is based on an administrative definition and includes people of all ages who are in receipt of services for people with intellectual disability. In Sweden relatively few people are identified as having mild level of intellectual disability. It has been suggested that this is a result of socio-political decisions. Not
The National Board of Health and Welfare Statistics (2001). Report on Children’s Health in Stockholm County 1998.
• Grunewald, Karl, Medicinska omsorgsboken,
1.1 PREVALENCE: Recent Data from Member States
239
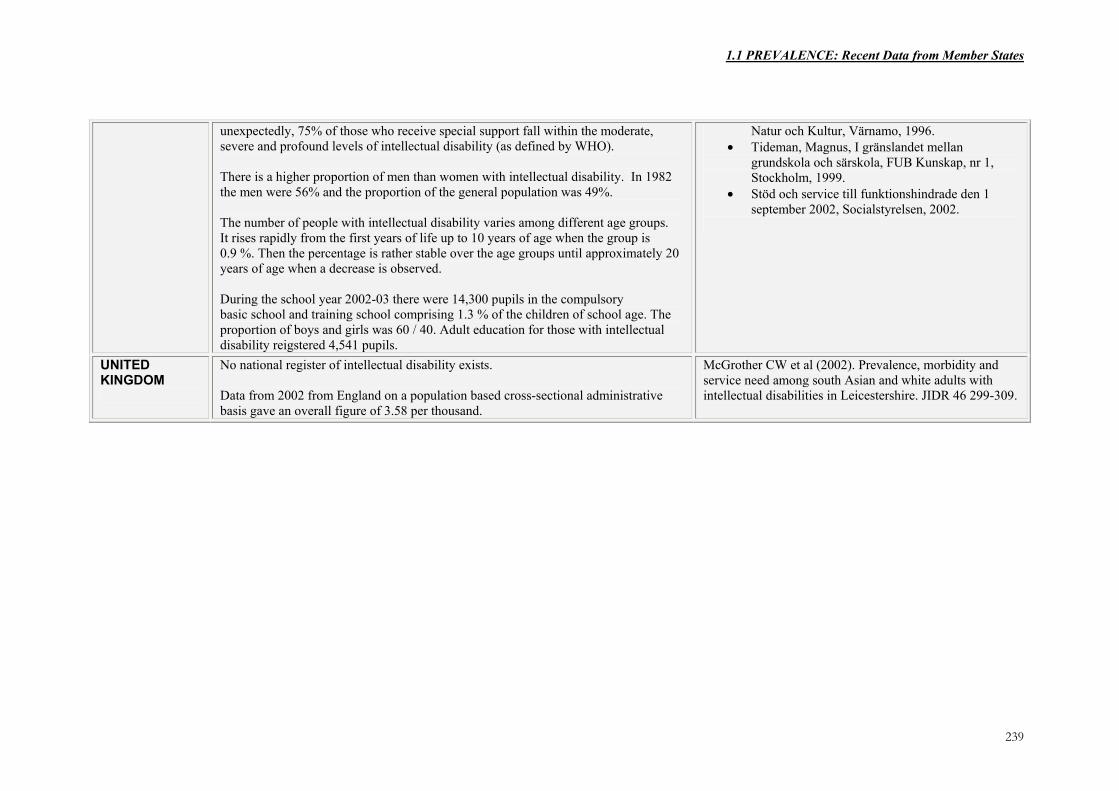
unexpectedly, 75% of those who receive special support fall within the moderate, severe and profound levels of intellectual disability (as defined by WHO). There is a higher proportion of men than women with intellectual disability. In 1982 the men were 56% and the proportion of the general population was 49%. The number of people with intellectual disability varies among different age groups. It rises rapidly from the first years of life up to 10 years of age when the group is 0.9 %. Then the percentage is rather stable over the age groups until approximately 20 years of age when a decrease is observed. During the school year 2002-03 there were 14,300 pupils in the compulsory basic school and training school comprising 1.3 % of the children of school age. The proportion of boys and girls was 60 / 40. Adult education for those with intellectual disability reigstered 4,541 pupils.
Natur och Kultur, Värnamo, 1996. • Tideman, Magnus, I gränslandet mellan
grundskola och särskola, FUB Kunskap, nr 1, Stockholm, 1999.
• Stöd och service till funktionshindrade den 1 september 2002, Socialstyrelsen, 2002.
UNITED KINGDOM
No national register of intellectual disability exists. Data from 2002 from England on a population based cross-sectional administrative basis gave an overall figure of 3.58 per thousand.
McGrother CW et al (2002). Prevalence, morbidity and service need among south Asian and white adults with intellectual disabilities in Leicestershire. JIDR 46 299-309.
1.2. LIVING ARRANGEMENTS: Recent Data from Member States
240
RECENT HEALTH INDICATOR DATA FROM PARTICIPATING MEMBER STATES
1.2. LIVING ARRANGMENTS FOR PEOPLE WITH INTELLECTUAL DISABILITY MEMBER STATE
EVIDENCE OF LIVING ARRANGEMENTS
SOURCE
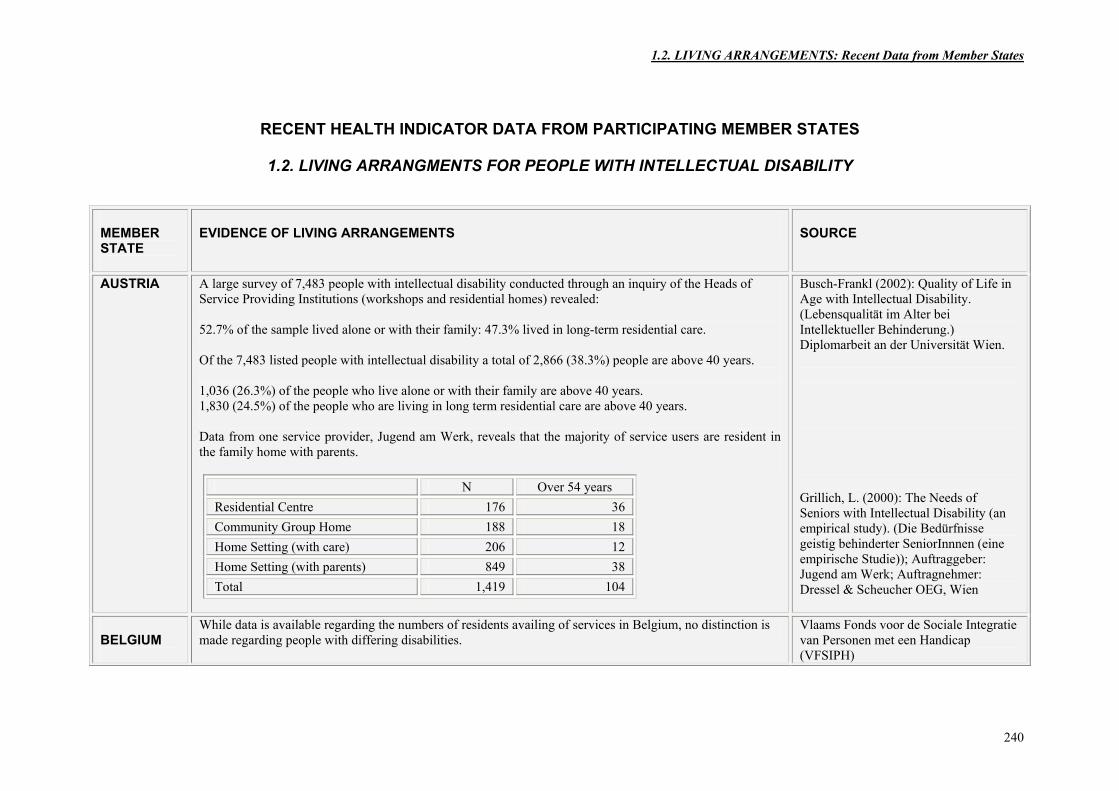
AUSTRIA A large survey of 7,483 people with intellectual disability conducted through an inquiry of the Heads of Service Providing Institutions (workshops and residential homes) revealed: 52.7% of the sample lived alone or with their family: 47.3% lived in long-term residential care. Of the 7,483 listed people with intellectual disability a total of 2,866 (38.3%) people are above 40 years. 1,036 (26.3%) of the people who live alone or with their family are above 40 years. 1,830 (24.5%) of the people who are living in long term residential care are above 40 years. Data from one service provider, Jugend am Werk, reveals that the majority of service users are resident in the family home with parents.
N Over 54 years Residential Centre 176 36 Community Group Home 188 18 Home Setting (with care) 206 12 Home Setting (with parents) 849 38 Total 1,419 104
Busch-Frankl (2002): Quality of Life in Age with Intellectual Disability. (Lebensqualität im Alter bei Intellektueller Behinderung.) Diplomarbeit an der Universität Wien. Grillich, L. (2000): The Needs of Seniors with Intellectual Disability (an empirical study). (Die Bedürfnisse geistig behinderter SeniorInnnen (eine empirische Studie)); Auftraggeber: Jugend am Werk; Auftragnehmer: Dressel & Scheucher OEG, Wien
BELGIUM
While data is available regarding the numbers of residents availing of services in Belgium, no distinction is made regarding people with differing disabilities.
Vlaams Fonds voor de Sociale Integratie van Personen met een Handicap (VFSIPH)

1.2. LIVING ARRANGEMENTS: Recent Data from Member States
241
DENMARK
Statistics Denmark provides limited information over time regarding the number of individuals with disabilities (not exclusive to intellectual disability) who reside in institutionalised care.
1994 1995 1996 1997 1998 Number of accommodations in homes/institutions 6,486 6,539 6,278 6,662 6,546 Number of people in homes/institutions 6,234 6,357 6,123 6,355 6,412
A breakdown of the residential options for those with intellectual disability resident in one country in Denmark reveals a migration from the family home with age.
0 - 14 year: Single Couple Total % Parents home 236 236 88.7% Childrens home 21 21 7.9% Other 9 9 3.4% Total 266 266 100.0% 15 years + : Parents home 142 142 11.4% Childrens home 18 18 1.4% Independent setting 335 147 482 38.7% Municipal group home 225 6 231 18.5% County group home 30 30 2.4% County residential 234 234 18.8% Other 108 1 109 8.7% Total 1,092 154 1,246 100.0%
Statistics Denmark Ribe amt, Handicapafdelingen: Støttebehovet for udviklingshæmmede i Ribe amt, 2003

1.2. LIVING ARRANGEMENTS: Recent Data from Member States
242
FINLAND
STAKES, the National Research and Development Centre for Welfare and Health provides information regarding residential support for people with intellectual disabilities.
Type of family All families
Families with
children 0-17
Families with
children 0-6
Persons per
family
Families 1,407,759 605,322 285,991 2.9 Type of family (%)
• Married couples without children 31.7 - - 2.0 • Cohabiting couples without children 11.8 - - 2.0 • Married couples with children 35.7 64.3 63.5 3.9 • Cohabiting couples with children 7.5 16.1 22.3 3.7 • Mothers with children 11.3 17.2 13.4 2.5 • Fathers with children 2.1 2.4 0.8 2.3
Year 1998 1999 2000 2001 Persons living alone
Number 827,304 847,170 865,504 891,768 % of total population 16.0 16.4 16.7 17.2
Institutional care - year 1999 2000 2001 - Residential services for people with intellectual disabilities
5,129 5,535 5,578 -
• 0-15 years 220 242 232 - • 16-64 years 4,608 4,963 5,009 - • 65 years or over 301 330 337 -
Clients during the year 7,838 8,433 8,822 - Care days during the year 1,859,253 2,080,490 2,083,131 -
Facts about Finnish Social Welfare and Health Care 2003. STAKES The National Research and Development Centre for Welfare and Health. Helsinki. www.stakes.info/files/pdf/Raportit/ Taskutieto_2003eng.pdf

1.2. LIVING ARRANGEMENTS: Recent Data from Member States
243
FRANCE
No data available.
GERMANY
Residential data is available regarding non-state organisations (organisations of the open welfare, Freie Wohlfahrtspflege). The number of beds/places in organisations of the Freien Wohlfahrtspflege in the year 1996 is presented:
Residential homes for persons with intellectual disability 46,781 Group homes for persons with intellectual disability 30,250 Supported living for persons with intellectual disability 9,631 Sonderkindergärten für geistig behinderte Kinder 11,298 Kindergardens for children with intellectual disability 2,770 Schools for children and adolescents with intellectual disability 17,036
About two-third of the children and adolescents with intellectual disability aged 0-21 years live at their parents’ home. Wacker et al., (1998) examined the residential settings of 8,700 children and adolescents (age 0-24) living in 132 residential facilities;
- 6,300 lived in 167 age general residential facilities - 2,400 lived in 75 specific facilities for children or adolescents.
Further data suggests that in total 7,400 children with intellectual disability (age 0-15 years) live in residential homes, as well as 8,500 children, adolescents and adults (age 15-24 years).
Statistics of organisations and services of the Freien Wohlfahrtspflege, Bundesarbeitsgemeinschaft der freien Wohlfahrtspflege e.V. Forschungsstelle Lebenswelten behinderter Menschen“ :publication of the research project: „Möglichkeiten und Grenzen selbständiger Lebensführung in Einrichtungen“, Wacker u.a. 1998

1.2. LIVING ARRANGEMENTS: Recent Data from Member States
244
IRELAND The National Disability Database reveals the following breakdown of residential placement for people with intellectual
disability:
Main Residential Circumstance N % Home Setting 15,563 60.9% Independent Setting 713 2.8% Community Group Home 3,430 13.4% Residential Centre 3,510 13.7% Other full time services 1,152 4.5% No fixed abode 12 0 Insufficient information
1,177 4.6%
TOTAL 25,557 100%
Barron, S., & Mulvaney, F. (2004) National Intellectual Disability Database Committee Annual Report 2003. Health Research Board, Dublin.
ITALY
No data available.

1.2. LIVING ARRANGEMENTS: Recent Data from Member States
245
LUXEMBOURG Information regarding residential provision for people with intellectual disability in Luxembourg is restricted to those residing in institutional care.
NETHERLANDS General Institutions for people with intellectual disability in the Netherlands supplied the following residential provision in 2000:
Individually living (if so in a family situation): 1% Living independent with several clients: 3% Living in group homes 96%
2 –5 % of the people with intellectual disability over 50 years of age live with their family. The capacity of living facilities as outlined by the Ministry of Health, Welfare & Sport VWS in 2001 is presented below:
Provence: GVT* GVT for children
Ortho pedag
AZI**+ Short-stay
Multiple Supported living:
Groningen 834 54 41 889 64 1,882 Friesland 834 98 50 1,148 0 2,130 Drente 503 48 14 1,164 242 1,971 Overijssel 1,200 35 165 1,698 0 3,098 Flevoland 158 0 26 233 0 417 Gelderland 2,158 52 634 5,351 0 8,195 Utrecht 1,110 24 189 2,668 379 4,370 N-Holland 2,743 91 274 3,615 164 6,887 Z-Holland 3,931 16 253 5,926 0 10,126 Zeeland 347 0 67 738 0 1,152 N-Brabant 2,118 0 364 5,085 407 7,974 Limburg 1,136 0 196 3,665 0 4,997 Total: 17,072 418 2,273 32,180 1,256 53,199
Landelijke tabellen clientenregistraties 2000, Vereniging Gehandicaptenzorg Nederland H.W. van Berkum en M.J. Haveman. (1995) Zorg aan huis. Behoefte aan zorg, gebruik van zorg en discrepantie tussen vraag en aanbod onder ouders van verstandelijk gehandicapten in Zuid-Nederland. Maastricht: Rijksuniversiteit Limburg/vakgroep Epidemiologie, Mensen met een verstandelijke Beperking In Nederland, Universiteit Maastricht , April 2002.

1.2. LIVING ARRANGEMENTS: Recent Data from Member States
246
*GVT: Group Homes: Gezins Vervangende Tehuizen ** AZI: General Institution for people with Intellectual Disability: Algemene Inrichting voor Verstandelijk Gehandicapten This data source also reveals that: More than 53,000 people with intellectual disability live in residential care (including institutions, group homes and smaller residential settings). Approximately 58,000 people are living at home (of whom 40% are younger than 20 yrs, 20% are older than 50 yrs). More than 50% of the people living at home do not make use of the existing services for people with intellectual disability. Additional data is based on data collected from College Tariffs Health Care (College Tarieven Gezondheidszorg / CTG). Numbers are based on amount of places in 1999:
Capacity: Intramural living facilities: Institutions for people with ID: 33,128 Institutions for people with a light ID: 2,284 Institutions for people with sensory disability: 1,444 Large residences: 725 Semi-mural facilities: Family Replacement homes people with ID: 17,645 Family Replacement homes people with physical disability: 2,189 Family Replacement homes people with sensory disability: 217 Day-centres: Day-care centre for elderly: 11,938 Day-care centre for children: 4,227 Activity centre: 1,692 Ambulant service/ Social Pedagogic Services*: 53,516 Total: 129,005
Brancherapport gehandicaptenzorg A.J.J. van der Kwartel, M.C. Barnhard, C. van Vliet Brancherapport gehandicaptenzorg
1.2. LIVING ARRANGEMENTS: Recent Data from Member States
247
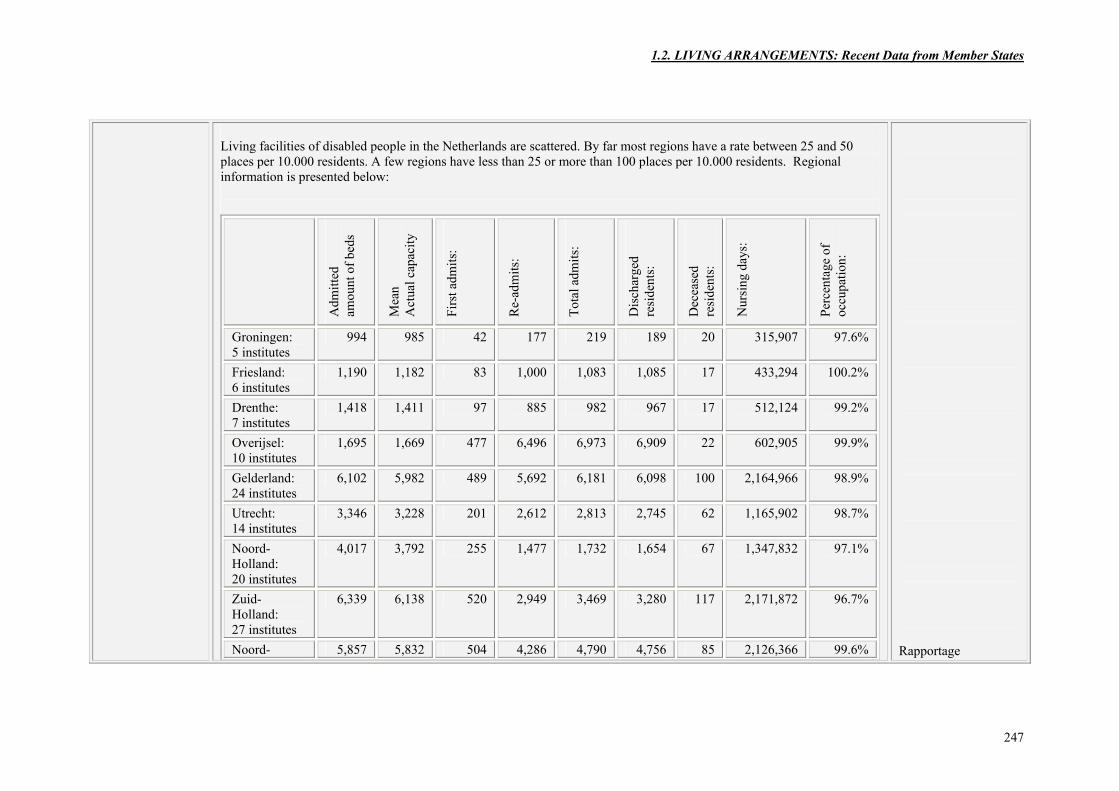
Living facilities of disabled people in the Netherlands are scattered. By far most regions have a rate between 25 and 50 places per 10.000 residents. A few regions have less than 25 or more than 100 places per 10.000 residents. Regional information is presented below:
Adm
itted
am
ount
of b
eds
Mea
n A
ctua
l cap
acity
Firs
t adm
its:
Re-
adm
its:
Tota
l adm
its:
Dis
char
ged
resi
dent
s:
Dec
ease
d re
side
nts:
Nur
sing
day
s:
Perc
enta
ge o
f oc
cupa
tion:
Groningen: 5 institutes
994 985 42 177 219 189 20 315,907 97.6%
Friesland: 6 institutes
1,190 1,182 83 1,000 1,083 1,085 17 433,294 100.2%
Drenthe: 7 institutes
1,418 1,411 97 885 982 967 17 512,124 99.2%
Overijsel: 10 institutes
1,695 1,669 477 6,496 6,973 6,909 22 602,905 99.9%
Gelderland: 24 institutes
6,102 5,982 489 5,692 6,181 6,098 100 2,164,966 98.9%
Utrecht: 14 institutes
3,346 3,228 201 2,612 2,813 2,745 62 1,165,902 98.7%
Noord-Holland: 20 institutes
4,017 3,792 255 1,477 1,732 1,654 67 1,347,832 97.1%
Zuid-Holland: 27 institutes
6,339 6,138 520 2,949 3,469 3,280 117 2,171,872 96.7%
Noord- 5,857 5,832 504 4,286 4,790 4,756 85 2,126,366 99.6%
Rapportage

1.2. LIVING ARRANGEMENTS: Recent Data from Member States
248
Brabant: 25 institutes Limburg: 11 institutes
3,993 3,924 257 554 811 771 62 1,405,440 97.9%
Flevoland: 2 institutes
283 273 27 13 40 27 8 97,795 97.9%
Total: 36,049 35,121 3,036 26,160 29,196 28,551 588 12,675,666 98.4% Data regarding residents privacy is also available:
Independently Supported
Living
Group Home
Total
Has a own room 100 99 99 Ability to lock the room 90 89 88 Ability to receive guests in his/hers own room Mostly 96 82 84 Sometimes 2 13 12 Never 2 5 5 (n) (23) (79) (103)
gehandicapten, 2002
SPAIN No data available.
SWEDEN There are no institutions for people with intellectual disability in Sweden. There are group homes for adults with intellectual disability most commonly built for five residents. Special housing is often provided for adults with autism

1.2. LIVING ARRANGEMENTS: Recent Data from Member States
249
and other psychiatric or social additional limitations of function, and these residences typically provide for less than five residents.
UNITED KINGDOM
No data available.

1.3 DAILY OCCUPATION: Recent Data from Member States
250
RECENT HEALTH INDICATOR DATA FROM PARTICIPATING MEMBER STATES
1.3. DAILY OCCUPATION FOR PEOPLE WITH INTELLECTUAL DISABILITY MEMBER STATE
EVIDENCE OF DAILY OCCUPATION
SOURCE
AUSTRIA
A large survey of 633 service providers examined the level of access people with intellectual disability have to open employment in Austria. Service agencies that provide workshop style employment options for people with intellectual disability reported that of 1,608 people working in sheltered workshops, 66 (4%) people had recently moved to employment in the regular market. Staff providing these services estimated that a further 192 (12%) subjects would be in a position to secure employment in the regular market. Service agencies that provide residential services to people with intellectual disability identified 11% of 733 service users as holding down employment in the open market. Gender differences were noted in employment options available to people with intellectual disability with the majority of jobs being held down by women being dominated by domestic activities such as cleaning, kitchen work & laundry, while jobs held down by men were considerably wider in scope. A study of 53 people with intellectual disability (81%male, 19% female) and their relatives, contacted via the job centre (labour exchange), examined the types of employment secured by employees. 28% of the jobs involved heavy physical work and 17% of the jobs were conducted out of doors. Environmental hazards such as time pressure (13%), noise (8%) and danger (4%) were rare. Job satisfaction was high with 72% responding that pleasure and satisfaction are the main advantages of their job. No respondent stated that s/he was less content with the present job in the free market, than with previous employment in a workshop setting. Information regarding the level of support people received in securing their position of employment revealed that one third of the sample was not
Schabmann, A. & Klicpera C. (1997) Which professions do People with Intellectual Disability have in the regular market? (Welche Berufe üben Menschen mit geistiger Behinderung am offenen Arbeitsmarkt aus?) Geistige Behinderung 1, 97 S5-12. Schabmann A. & Klicpera, C. (1998): Experiencing Professional Life. (Erleben von Berufstätigkeit.) Behinderte in Familie, Schule und Gesellschaft; 4/5/1998

1.3 DAILY OCCUPATION: Recent Data from Member States
251
consulted about occupational possibilities. Information on types of employment options available to service users was provided by a range of services including special schools (36%), labour exchanges (36%), social welfare offices (19%) and directed care staff (8%). Respondents commented that the crucial factor in their sourcing a position of employment was the intervention of parents or self (51%) or of carers in their workshop (38%).
BELGIUM
No data available.
DENMARK
A breakdown of the daily occupational options for those over 15 years with intellectual disability resident in one country in Denmark reveals a minority are in open employment:
15 years +: No % School 99 7,9 Work test 8 0,6 Ordinary employment 8 0,6 Employment with salary support 52 4,2 Sheltered single employment 90 7,2 Sheltered workshop 628 50,4 Unemployed 257 20,6 Club for elderly people 12 1,0 Other 92 7,4 Total 1,246 100
Ribe amt, Handicapafdelingen: Støttebehovet for udviklingshæmmede i Ribe amt, 2003 ISBN 87-7941-340-4 (Print) ISBN 87-7941-341-2 (Internet)

1.3 DAILY OCCUPATION: Recent Data from Member States
252
FINLAND
Year 1998 1999 2000 2001 Sheltered work and work therapy centres for people with intellectual disabilities No. of clients 10,268 10,607 10,929 11,231 Sheltered work centres for the disabled No. of clients 3,078 3,195 3,301 3,271
http://www.stat.fi/tk/tp/tasku/taskue_tulot.html
FRANCE
No data available.
GERMANY
Throughout Germany approximately 160 service organisations exist to provide optimal occupational integration for people with disabilities. Over 600 sheltered workshops are available providing in excess of 155,000 workplaces for adults with intellectual disability.
A study examining the transition from school to work for people with intellectual disability (1995) illustrates some of the training and employment options available:
- 83 people with intellectual disability were engaged in that year (school leavers) in a
regular fulltime preparatory work training course (25 BBiG/HWO). - 91 people with intellectual disability were in receipt of a reduced fulltime preparatory
work training course (48BbiG,42bHWO). This is a modified work education program with reduced demands regarding theoretical knowledge and practical skills. The Offices for Work Performance typically provide this type of work training course (Berufsbildungswerke).
- 368 people were included that year (school leavers) in an F-training module. This type of work training is typically provided by rehabilitation organisations. The ultimate goal of
Heinz Mühl, 2000 Journal: Gemeinsam leben; 1/2000 Bundesarbeitsgemeinschaft 1997, 424f.

1.3 DAILY OCCUPATION: Recent Data from Member States
253
this work preparation measure is to reach permanent integration of the person in regular work.
- Most people (N=6759) making the transition from school however are found placements in sheltered workshops (Werkstatt für behinderte Menschen,WfbM). The WfbM offers people who have not, or are not ready to have, regular work a sheltered workplace as an alternative.
IRELAND
The National Intellectual Disability Database in Ireland identifies 1,618 individuals with intellectual disability engaging in various forms of employment:
Employment Type Enclave within open employment 21 Supported employment 1,424 Open employment 173 TOTAL 1,618
Barron, S., & Mulvaney, F. (2004) National Intellectual Disability Database Committee Annual Report 2003. Health Research Board, Dublin.
ITALY
National employment statistics in Italy suggest that approximately 210,000 employees with disabilities (note, not intellectual disability specific) are employed in open employment or freelance work. An additional 15,000 people with disabilities are employed in approximately 3,000 social co-operatives. The figure for social co-operatives is confirmed by a 1999 study on these co-operatives:
Members without disabilities 1,288 Members with disabilities 15,746
ISTAT, “Indagine sulle condizioni di salute e ricorso ai servizi sanitari” 1999/2000 ISTAT 1994/ Confirmed 1999 Presidenza del Consiglio dei Ministri. Dipartimento per gli Affari Sociali “Programma di azione del governo per le politiche dell'handicap 2000-2003 Vianello R. (1999). Difficoltà di apprendimento, situazione di handicap, integrazione. Bergamo:Edizioni Junior

1.3 DAILY OCCUPATION: Recent Data from Member States
254
In 1998, 264,073 disabled people were recorded as being unemployed by the employment office (30 June 1998).
Presidenza del Consiglio dei Ministri, Dipartimento per gli Affari Sociali . (2000-2003). Programma di azione del governo per le politiche dell'handicap.
LUXEMBOURG
National statistics from Luxembourg identify 2,798 people as registered ‘handicapped workers’.
Physical disability 1,938 ( 69% ) Intellectual disability 564 ( 20%) → protect work shops Sensory disability 216 ( 8% ) Mental illness 80 ( 3% )
Ministry of family and social services Service for handicap persons L-2919 Luxembourg Annex page 157 Ministry of work and employment L-2939 Luxembourg http://www.mt.etat.lu
NETHERLANDS
The Social and Cultural Planning Office of the Netherlands conducted research in 2000 to examine the social climate of people with intellectual disability in the Netherlands. Over 200 institutions cooperated including General Institutions (including socio-residences), Group Homes (including independent living with intensive support), Day-care centres for the elderly (adults) (DVO) and Social Labour Facilities (SWV). This research included only people who are over 18 years and use one of the mentioned facilities. No comparable data exists for children with intellectual disability and for approximately 4,500 adults with intellectual disability who are not in receipt of services. The survey revealed:
• 30,000 people with intellectual disability work in Social Labour Facilities (SWV). • 15,000 people visit day-care centres for the elderly (DVO). These service users typically
have more severe levels of disability than those who work in Social Labour Facilities. 70% of the people in Social Labour Facilities are men, against 51% of the people who visit day-care centre for elderly. An evaluation of service users’ satisfaction with these facilities was positive:
The Social and Cultural Planning Office of the Netherlands.

1.3 DAILY OCCUPATION: Recent Data from Member States
255
DVO: SWV: Work pleasure: Mostly 90% 84% Sometimes 9% 12% Mostly not 2% 4% Total: 100% 100% Work tempo: Too hard 8% 12% Satisfied with tempo 88% 87% Too slow 4% 1% Total: 100% 100%
Recent years have seen an increase in the finances available to provide daily activities for people with intellectual disability in the Netherlands. In 2002 the expenditure was 12.7 million euros. A central aim of this investment is to increase the number of hours of day care activity for those in institutional care. The flow of AWBZ ("Care for the Disabled") paid daily activities into employment is being promoted in four ways: 1. Netherlands Institute for Care and Welfare (NIZW) is by order of the government carrying
out a stimulation program: "Of daily activities into employment". 2. In co-operation with NIZW there is an instruction program framed for AWBZ and WSW
(Social Employment Provision) with the goal: "Employment first". 3. Cooperation is being investigated between Day-care centres and Social Employment
Provision. 4. Promotion as a result of the MJA-deals in cooperation with VGN and Somma.

1.3 DAILY OCCUPATION: Recent Data from Member States
256
SPAIN
Active Inactive Total Total 39,666 217,799 257,465 Employed 21,855 - 21,855 Unemployed 17,811 - 17,811
National Survey on Disabilities, Deficits and Health States (Encuesta Nacional sobre Discapacidades, Déficit y Estados de Salud; INE e IMSERSO, 1999) http://usuarios.discapnet.es/
SWEDEN
The National Work Force Statistics, Sweden report that the total working population aged 20 – 64 years is 4,135,698 Approximately 0.7% of the population are defined as having “diminished ability to work because of intellectual disability” with the following gender breakdown: Men 1.2 % ± 0,7 Women 0.2 % ± 0,2 Total 0.7 % ± 0,4
National Work Force Statistics 2002
UNITED KINGDOM
There are no estimates of the numbers of people with intellectual disability in employment in the UK.

1.4 INCOME: Recent Data from Member States
257
RECENT HEALTH INDICATOR DATA FROM PARTICIPATING MEMBER STATES
1.4. INCOME FOR PEOPLE WITH INTELLECTUAL DISABILITY MEMBER STATE
EVIDENCE OF INCOME
SOURCE
AUSTRIA
No data available.
BELGIUM
No data available.
DENMARK
A breakdown of the sources of income for those with intellectual disability resident in one country in Denmark reveals varying sources:
15 years + N % Maximum social pension 671 53.9% Medium social pension 323 25.9% Old age pension or benefit 119 9.6% No income 87 7.0% No information 46 3.7% Total 1246 100%
Ribe amt, Handicapafdelingen: Støttebehovet for udviklingshæmmede i Ribe amt, 2003

1.4 INCOME: Recent Data from Member States
258
FINLAND
The benefits awarded by the Social Insurance Institution of Finland (SII) were examined between 1962 and 1998for cohorts of people with intellectual disability. Findings indicated that the disability pension was one of the most commonly awarded benefits. Level of ability was identified as a factor influencing benefits with those with more severe levels of ability receiving greater benefits and from an earlier age. The authors conclude that use of welfare and health services have changed to only a minor degree since the early 1960s.
Ruoppila I, Poutanen V-M, Laurinkari J, Vesala H. (2003). The role of the social benefits provided by the Social Insurance Institution of Finland in the life course of intellectually disabled persons in 1962-1998. Helsinki: The Social Insurance Institution, Finland, Studies in social security and health 73, 2003. 249 pp. ISBN 951-669-631-7.
FRANCE
No data available.
GERMANY
Monthly earnings for persons in sheltered workshops are approximately €100.
Troxler Werkstätten, 2004
IRELAND
Disability Allowance is a weekly allowance paid to people with a disability (not intellectual disability specific) by the Department of Social, Community and Family Affairs. It is available to disabled people whose income falls below certain limits and who are aged 16 or over and under age 66. The disability must be expected to last for at least one year. The allowance is made up of a personal rate plus increases for a partner and each dependent child. The current maximum personal rate of disability allowance is €118.80 per week.
www.irishhealth.com
ITALY
A disability pension of € 204 is provided for about 800,000 disabled people (not intellectual disability specific) in Italy. (1998)
Presidenza del Consiglio dei Ministri, Dipartimento per gli Affari Sociali . (2000-2003). Programma di azione del governo per le politiche dell'handicap

1.4 INCOME: Recent Data from Member States
259
LUXEMBOURG
The Ministry of Family and the Ministry of Work and Employment have recently drafted new legislation governing the employment and income status of people with intellectual disability. This legislation was adopted in June 2004. The law envisages a number of measures with a view to promoting the economic security and independence of people with disabilities, and to improve their socio-economic protection. They concern both people who have sufficient capacity for work to carry out paid employment duties in a sheltered environment, and those who, because of the seriousness of their impairments, are unable to engage in any paid employment at all. The law defines as 'disabled' any worker considered able to carry out paid employment on the ordinary labour market or in a sheltered workshop, who has at least a 30% reduction in their capacity for work. The new law confers employee status on people with disabilities working in sheltered workshops, and places them under the protective rules of employment legislation. The new law also provides a new income benefit for people with disabilities who are unable to perform any work and have no employment-linked income. Under this legislation, those with disability in employment will receive 1,400 euro per month and are entitled to benefits such as unemployment benefit and pensions. Those with more severe levels of disability may receive an additional 527 euro per month or insurance of care. Employees with disabilities who remain in their position of employment in excess of ten years will be entitled to a salary comparable to a qualified worker. Those with disabilities who are deemed unable to obtain and maintain positions of employment are eligible to receive an income of 1,000 euro per month. An additional 527 may be available for those with severe levels of disability. http://www.eiro.eurofound.eu.int/2003/10/feature/lu0310103f.html
Ministry of family and social services Service for handicap persons L-2919 Luxembourg Annex page 157 page 117 – 118 Ministry of work and employment L-2939 Luxembourg http://www.mt.etat.lu Assurance dépendance ( insurance of care ) 125,route d’Esch L-1471 Luxembourg National solidarity fond B.P. 2411 L-1024 Luxembourg National cash-office for family payment B.P. 394 L-2013 Luxembourg Service for handicap workers B.P. 2208 L-1022 Luxembourg

1.4 INCOME: Recent Data from Member States
260
NETHERLANDS
Research in the Netherlands highlights the low income of those with disabilities. Approximately 50% of people with disabilities have an income comparable to those on social security, and a further 20% have an income comparable to the minimum wage (817 euro per month). Less than 1% of this population has an income in excess of 1,134 euro per month. The distribution of income by level of disability and type of service provision is presented below:
Distribution of Income Level in relation to level of Intellectual Disability: (%)
Mild: Moderate: Severe: €635 38% 49% 61% €635-€816 18% 16% 16% >€816 30% 18% 2% Unknown 14% 17% 21% (n) (396) (352) (248)
Distribution of Income Level in relation to housing: (%)
Family
Home Independent (supported)
Group Homes AIVG*
€635 32% 22% 50% 65% €635-€816 23% 23% 15% 12% >€816 42% 43% 10% 1% Unknown 3% 12% 25% 22% (n) (233) (147) (232) (384)
*AIVG: General Institute for Intellectual Disabled
Rapportage gehandicapten 2002

1.4 INCOME: Recent Data from Member States
261
In the Netherlands people with intellectual disability over 18 years of age have the right to receive an income. Mostly those who have a severe level of intellectual disability are in receipt of the WAJONG-benefit. WAJONG is the Law for Disability Insurance for Young Disabled. The distribution of those in receipt of this benefit by level of disability and by residential setting is presented below:
Level of Intellectual Disability Type of Residential Setting
mild moderate severe Family Independent GVT* AIVG** Total Wajong + 40% 60% 84% 31% 26% 62% 87% 58% Wajong- 60% 40% 16% 69% 74% 38% 13% 42% (n) (377) (327) (226) (232) (147) (210) (342) (930)
*GVT: Group Homes/ Gezins Vervangend Tehuis **AIVG: General Institutions for Intellectual Disabled
Rapportage gehandicapten 2002
SPAIN
No data available.
SWEDEN
No data available.
UNITED KINGDOM
No data available.

1.5 LIFE EXPECTANCY: Recent Data from Member States
262
RECENT HEALTH INDICATOR DATA FROM PARTICIPATING MEMBER STATES
1.5 LIFE EXPECTANCY FOR PEOPLE WITH INTELLECTUAL DISABILITY MEMBER STATE
EVIDENCE OF LIFE EXPECTANCY
SOURCE
AUSTRIA
No data available.
BELGIUM
No data available.
DENMARK
Mortality and life expectancy was examined among 2,412 people with a diagnosis of Down’s Syndrome (between 1976-1980) in Denmark. Of the total group, a survival rate of 82.4 was found at the end of the age group 5-9 years
Dupont A, Vaeth M, Videbech P (1986). Mortality and life expectancy of Down's syndrome in Denmark. J Ment Defic Res., Jun; 30 (Pt 2):111-20.
FINLAND
This report comprises the first population-based study of life expectancy and cause specific mortality of people with intellectual disability in Finland. It is based on a 35-year (1962-1997) follow-up study of a nationally representative cohort of 2,369 people with intellectual disability aged between 2 and 97 years. Life expectancy was positively correlated with intelligence quotient. Profound intellectual disability was associated with a 30% loss of life span throughout the life, while people with mild intellectual disability were found to have a similar life expectancy to the general population. The report acknowledges that the life span of people with intellectual disability has lengthened however it is dependent on the level of intellectual disability. The improved life expectancy is interpreted as a result of improved health care and social support and normalisation. The mortality rate was 17.7 per 1,000 person years (CI 95% 8.4-27.0). The three most common causes of death were cardiovascular diseases, respiratory diseases and cancer for both sexes. There were 173 patients diagnosed with cancer; the expected number was 188 (SIR 0.9, CI 95% 0.8-1.0).
Kristiina Patja, academic dissertation, Helsinki 2001 FAMR Research Publications, No. 81 Helsinki: Finnish Association on Mental Retardation
1.5 LIFE EXPECTANCY: Recent Data from Member States
263
A 35-year follow-up study based on a nation-wide population study of the life expectancy of people with intellectual disability was undertaken. The study population consisted of a total of 60,969 person-years. A prospective cohort study with mortality follow-up for 35 years was used and the life expectancy of people with intellectual disability was calculated for different levels of intelligence. People with mild intellectual disability had similar life expectancy to the general population. For those with profound intellectual disability the proportion of expected life lost was > 20% for almost all age groups. The female preponderance was manifested from the age of 60 years onwards, 25 years later than in the general population. Respectively, survival between sexes differed less. Epilepsy and/or hearing impairment increased the relative risk of death for all levels of intellectual disability.
Patja K, Iivanainen M, Vesala H, Oksanen H, Ruoppila I., (2000). Life expectancy of people with intellectual disability: a 35-year follow-up study. J Intellect Disabil Res. 2000 Oct;44 ( Pt 5):591-9.
FRANCE
Review of French and international literature on Life Expectancy and Ageing of persons with intellectual disabilities show a consistent trend toward increased life expectancy of persons with intellectual disabilities in all developed countries. The main results showed that people with intellectual disability shared a similar lifespan with the general population. However, there are a highly significant association between survival and the level of severity of intellectual disability. The presences of genetic disorders (Down Syndrome), heart and respiratory diseases, cancers, epilepsy, and lifestyle factors (obesity, poorer level of physical fitness) are the commonest causes of death. Given the increased longevity in life expectancy among people with intellectual disability, an improvement of the Death Certificate, clearly indicating the presence of intellectual disability and others disabilities known by the practitioner, is necessary.
Azéma B. & Martinez N. (2003) Les personnes handicapées vieillissantes: espérances de vie, projections démographiques et aspects qualitatifs. Rapport d’étude pour la DREES, (Ministère des Affaires sociales du Travail et de la Solidarité- Ministère de la Santé de la Famille et des Personnes Handicapées). CREAI Languedoc Roussillon, Montpellier, France. 317p. Azéma B. & Martinez N. (2004) The new longevity of people with intellectual disability: Life Expectancy and Health Factors. Presentation IASSID Congress, Montpellier, June, 2004
1.5 LIFE EXPECTANCY: Recent Data from Member States
264
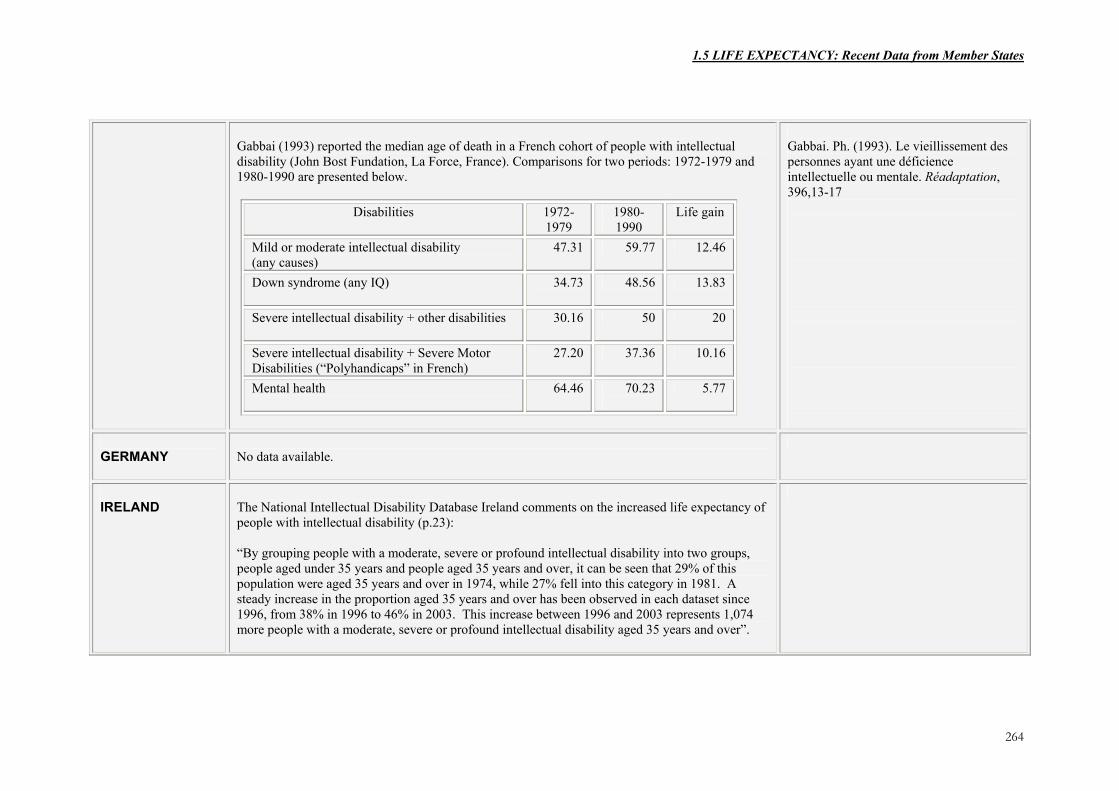
Gabbai (1993) reported the median age of death in a French cohort of people with intellectual disability (John Bost Fundation, La Force, France). Comparisons for two periods: 1972-1979 and 1980-1990 are presented below.
Disabilities 1972-1979
1980-1990
Life gain
Mild or moderate intellectual disability (any causes)
47.31 59.77 12.46
Down syndrome (any IQ)
34.73 48.56 13.83
Severe intellectual disability + other disabilities
30.16 50 20
Severe intellectual disability + Severe Motor Disabilities (“Polyhandicaps” in French)
27.20 37.36 10.16
Mental health
64.46 70.23
5.77
Gabbai. Ph. (1993). Le vieillissement des personnes ayant une déficience intellectuelle ou mentale. Réadaptation, 396,13-17
GERMANY
No data available.
IRELAND
The National Intellectual Disability Database Ireland comments on the increased life expectancy of people with intellectual disability (p.23): “By grouping people with a moderate, severe or profound intellectual disability into two groups, people aged under 35 years and people aged 35 years and over, it can be seen that 29% of this population were aged 35 years and over in 1974, while 27% fell into this category in 1981. A steady increase in the proportion aged 35 years and over has been observed in each dataset since 1996, from 38% in 1996 to 46% in 2003. This increase between 1996 and 2003 represents 1,074 more people with a moderate, severe or profound intellectual disability aged 35 years and over”.

1.5 LIFE EXPECTANCY: Recent Data from Member States
265
ITALY
No data available.
LUXEMBOURG
No data available.
NETHERLANDS
The National Case Register (LRZ) which comprises data on almost all residents of residential centres in the Netherlands was examined for the period 1991-1995 (N=29,290). Approximately 40% of all people with intellectual disability in the Netherlands reside in such centres. Results showed that 5 year old individuals with intellectual disability in Dutch residential homes have a life expectancy of 41 years. The life expectancy of peers with Down’s Syndrome is 46 years. At 30 years of age the respective figures are 36 years and 26 years. No statistically significant differences were reported between men and women or between people of differing levels of ability.
Maaskant, M.A., Gevers, J.P.M., & Wierda, H., (2002). Mortality and Life Expectancy in Dutch Residential Centres for Individuals with Intellectual Disability, 1991-1995
SPAIN
No data available.
SWEDEN
One study from 1996 states: The standardized mortality ratio (SMR) in those with only intellectual disability was significantly increased as compared with that of the general population: 1.6 [95% confidence interval (CI) 1.3-2.0]; intellectual disability and epilepsy, 5.0 (CI 3.3-7.5); intellectual disability, epilepsy, and cerebral palsy (CP), 5.8 (CI 3.4-9.7).
UNITED KINGDOM
No data available.

This report was produced by a contractor for Health & Consumer Protection Directorate General and represents the views of thecontractor or author. These views have not been adopted or in any way approved by the Commission and do not necessarilyrepresent the view of the Commission or the Directorate General for Health and Consumer Protection. The EuropeanCommission does not guarantee the accuracy of the data included in this study, nor does it accept responsibility for any use madethereof.