Embed Size (px)
Citation preview

0
RECENT ADVANCES IN THE EMPIRICS OF
ORGANIZATIONAL ECONOMICS
Nicholas Blooma , Raffaella Sadunb and John Van Reenenc
October 25th 2009
Abstract We present a survey of recent contributions in the empirical organizational economics, focusing on management practices and decentralization. Productivity dispersion between firms and countries has motivated the improved measurement of firm organization across industries and countries. There appears to be substantial variation in management practices and decentralization between countries, but especially within countries. Much of the poorer average management quality in countries like Brazil and India seems due to a “long tail” of poorly managed firms, which barely exist in the US. Many basic economic theories are supported by this new data. Some stylized facts include: (1) competition seems to foster improved management and decentralization; (2) larger firms, skill-intensive plants and foreign multinationals appear better managed and are more decentralized; (3) family owned and managed firms appear to have worse management; (4) firms facing an environment of lighter labor market regulations, and more human capital intensive organizations specialize relatively more in “people management”. There is evidence for complementarities between ICT, decentralization and management, but the relationship is complex and identification of the productivity effects of organizational practices remain a challenge for future research.
JEL No. L2, M2, O32, O33.
Keywords: productivity, organization, management, decentralization
Acknowledgements: We would like to thank Tim Bresnahan for detailed comments and the Anglo German Foundation and the Economic and Social Research Council for their financial support through the Center for Economic Performance. This survey draws substantially on joint work with Daron Acemoglu, Philippe Aghion, Eve Caroli, Luis Garicano, Christos Genakos, Claire Lelarge and Fabrizio Zilibotti. Data for Canada was collected with Daniela Scur and James Millway at the Institute of Prosperity and Competitiveness, and for Australia with DIISR, Renu Agarwal and Roy Green at University of Technology, Sydney. a Stanford, Center for Economic Performance and NBER, [email protected] b Harvard Business School and Center for Economic Performance, [email protected] c Corresponding Author: London School of Economics, Center for Economic Performance, NBER and CEPR, [email protected]

1
I. INTRODUCTION
Organizational economics has developed very rapidly over the last twenty years, but theory has run
ahead of measurement. In this review we discuss some recent econometric work that has tried to shed
light on organizational theories and their implications for firm productivity. We focus on two specific
aspects of firm organization: management quality and decentralization. Management quality is of
interest to us both because of its presumed close relation to productivity and recent improvements in
measurement of global best managerial practices. Decentralization, or the delegation of power between
agents in the firm, has long been a focus of theoretical interest in organizational economics.
Our motivation for analyzing management quality stems from the compelling evidence of
heterogeneity in firm sizes and productivity (see Section II). Economic theory has focused on the fixity
of the managerial (or entrepreneurial) resource as being a fundamental determinant of dispersion. A
firm must have a center where decisions are ultimately made and coordinated, and this has to be single
unit (whether it is the owner-manager, CEO or corporate headquarters). Indeed, Kaldor (1934) pointed
out, the fixity of the managerial input is what determines the firm’s size even in a world with
homogeneity of the production function (in non-managerial inputs) and perfect competition: “…there
must be a factor of which the firm cannot have ‘two units’ because only one unit can do the job” (pp.
68-69). If some firms will be better at making decisions on how efficiently to allocate their resources
than others (i.e. higher managerial quality/better practices) then productivity will systematically differ
between companies. Our notion of management is that it is attached to the firm as a whole, rather than
being simply a reflection of the skills of the current CEO (although CEO talent will clearly be an
important aspect of the firm’s overall performance). We will examine such theories and why badly
managed firms can persist over time in Section III.

2
Decisions are not all made at the center, however, and real authority is delegated to some degree
throughout the body of the firm. A major issue in organizational economics is what features of the
environment determines the degree of this decentralization? Unlike management, there is no
assumption that greater decentralization will lead to higher productivity, which sharply distinguishes
the study of decentralization from that of management. Of course, delegation may be more beneficial
to firms in certain environments than others, for example when there are many new innovations in
information and communication technologies (we will discuss this in section IV).
In addition to limiting our work to management quality and decentralization, our focus is on
econometric studies. The qualitative case studies which have dominated work in this area are valuable
in terms of theory formation and understanding mechanisms. But they are necessarily limited in terms
of their generalizability due to the heavy selection bias, small samples and difficulties of constructing
credible control groups. In terms of the empirical studies we cover, we do not claim to be
comprehensive but rather have sought to focus on “exemplar studies” and our own recent contributions
to make our points. Our apologies in advance to authors whose works have not been covered.
It is worth noting what else we are not covering. We do not deal with the issues of the boundary of the
firm – such as vertical integration, mergers and outsourcing (although we will touch on firm size). Nor
do we study the spatial distribution of firm activities, e.g. the issue of offshoring within multinational
firms (although we will discuss the organization of multinational firms in relation to domestic firms).
Finally, we are not focusing on how incentive contracts can overcome some of the organizational
problems of the firm. In the decentralization discussion we are assuming that incentive contracts
cannot fully deal with the agency issue. Mookherjee (2006) has a comprehensive review of incentive
contracts and decentralization and Gibbons and Roberts (2009) provide an extensive overview of the

3
theoretical and empirical literature. Space constraints mean we take a micro rather than macro
perspective (on the latter see the survey of Aghion, Caroli and Garcia-Penalosa, 2001).
The summary of our arguments is as follows:
1. Work in this area has been seriously impaired by the lack of high quality data across large
numbers of firms both nationally and internationally. This is now being rectified.
2. Many of the basic predictions from some basic economic theories receive support from the data
(e.g. consistently with Lucas, 1978, larger firms are better managed)
3. Product market competition is a key factor in increasing management quality and
decentralization
4. Cultural factors such as generalized trust are important in facilitating greater decentralization
5. There is much suggestive evidence that management and decentralization matter for
productivity, especially in relation to information and communication technology (ICT)
6. Identifying the causal effect of management and decentralization on firm performance is a key
challenge for future studies
The structure of this review is as follows. In section II we first motivate the study of organizations by
examining the literature on firm heterogeneity, in particular the dispersion of productivity. In section
III we discuss the determinants of management practices in terms of measurement, theory and results.
In section IV we discuss the same issues for decentralization. In section V we discuss issues in
identifying the effects of organization (e.g. management practices and decentralization) on
productivity. Section VI concludes.

4
II. MOTIVATION: FIRM PRODUCTIVITY DISPERSION
Research on firm heterogeneity has a long history in social science. Systematic empirical analysis first
focused on the firm size distribution measured by employment, sales or assets. Most famously, Gibrat
(1931), characterized the size distribution as approximately log normal and sought to explain this with
reference to simple statistical models of growth (i.e. Gibrat’s Law that firm growth is independent of
size). In the 1970s as data became available by firm and line of business, attention focused on
profitability as an indicator of performance (e.g. Kwoka and Ravenscraft, 1986). Accounting
profitability can differ substantially from economic profitability, however, and may rise due to market
power rather than efficiency.
In recent decades the development of larger databases has enabled researchers to look more directly at
productivity. The growing availability of plant-level data from the Census Bureau in the US and other
countries combined with rapid increases in computer power has facilitated this development.
Bartelsman, Haltiwanger and Scarpetta (2008) offer many examples of the cross country micro-
datasets now being used for productivity analysis.
One of the robust facts emerging from these analyses is the very high degree of heterogeneity between
business units (see Bartelsman and Doms, 2000). For example, Syverson (2004a) analyzes labor
productivity (output per worker) in US manufacturing establishments in the 1997 Economic Census
and shows that on average, a plant at the 90th percentile of the productivity distribution is over four
times as productive as a plant at the 10th percentile in the same four digit sector. Similarly, Criscuolo,
Haskel and Martin (2003) show that in the UK in 2000 there is a fivefold difference in productivity
between these deciles.
5
Analysis of aggregate productivity growth has shown that a substantial fraction of the change in
industry productivity (e.g. about half in Baily, Hulten and Campbell, 1992) is due to reallocation of
output from lower productivity plants to those with higher productivity - i.e. it is not simply incumbent
plants becoming more productive. This reallocation effect is partly due to the shift in market share
between incumbents and partly due to the effects of exit and entry. Bartelsman, Haltiwanger and
Scarpetta (2008) show that the speed of reallocation is much stronger in some countries (like the US)
than others. There is also significant sectoral variation. For example, Foster, Krizan and Haltiwanger,
2006, show that reallocation between stores accounts for almost all aggregate productivity growth in
the US retail sector.
What could explain these differences in productivity, and how can they persist in a competitive
industry? One explanation is that if we accounted properly for the different inputs in the production
function there would be little residual productivity differences1. It is certainly true that moving from
labor productivity to total factor productivity (TFP) reduces the scale of the difference (e.g. in the
Syverson, 2004a, study the difference falls from 4.1 to 1.9), but it does not disappear.
These differences show up clearly even for quite homogeneous goods. An early example is Salter
(1960) who studied the British pig iron industry between 1911-1926 showing that the best practice
factory produced nearly twice as many tons per hour as the average factory. More recently, Syverson
(2004b) shows TFP (and size) is very dispersed in the US ready mix concrete industry. Interestingly,
the mean level of productivity was higher in more competitive markets (as indicated by a measure of
spatial demand density) and this seemed to be mainly due to a lower mass in the left tail in the more
competitive sector. Studies of large changes in product market competition such as trade liberalization
1 This is analogous to the historical debate in the macro time series of productivity between Solow, who claimed that TFP was a large component of aggregate growth and Jorgenson who claimed that there was little role for TFP when all inputs were properly measured (see Griliches, 1996). A similar debate is active in “levels accounting” of cross-country TFP (e.g. Caselli, 2005).

6
(e.g. Pavcnik, 2002) or deregulation (e.g. Olley and Pakes, 1996) suggest that the subsequent increase
in aggregate productivity has a substantial reallocation element2.
A major problem in measuring productivity is the fact that researchers rarely observe plant level prices
so an industry price deflator is usually used. Consequently, measured TFP typically includes an
element of the firm-specific price-cost margin (e.g. Klette and Griliches, 1994). Foster, Haltiwanger
and Syverson (2009) study 11 seven-digit homogeneous goods (including block ice, white pan bread,
cardboard boxes and carbon black) where they have access to plant specific output (and input) prices.
They find that conventionally measured revenue based TFP (“TFPR”) numbers actually understate the
degree of true productivity dispersion (“TFPQ”) especially for newer firms as the more productive
firms typically have lower prices and are relatively larger3.
Higher TFP is positively related to firm size, growth and survival probabilities. Bartelsman and
Dhrymes (1998, Table A.7) show that over a five year period around one third of plants stay in their
productivity quintile. This suggests that productivity differences are not purely transitory, but partially
persistent.
In summary, there is a substantial body if evidence of persistent firm-level heterogeneity in firm
productivity (and other dimensions of performance) in narrow industries in many countries and time
periods. What could account for this?
2 There is also a significant effect of such policy changes on the productivity of incumbent firms. Modelling the changing incentives to invest in productivity enhancing activities, such as R&D, is more difficult in heterogeneous firm models, but some recent progress has been made (e.g. Aw, Roberts and Xu, 2008). 3 Foster et al (2009) show that measured revenue TFP will in general be correlated with true TFP but also with the firm specific price shocks. Hsieh and Klenow (2009) detail a model where heterogeneous TFPQ produces no difference in TFPR because the more productive firms grow larger and have lower prices, thus equalizing TFPR. In their model intra-industry variation in TFPR is due to distortions as firms face different input prices.

7
III MANAGEMENT PRACTICES
III.1 Measurement of management
Progress in understanding the role of management has been severely limited by the absence of high
firm-level quality data4. Recently, Bloom and Van Reenen (2007) developed a survey tool that can in
principle be used to directly quantify management practices across firms, sectors and countries.
Fundamentally, the aim is to measure the overall managerial quality of the firm by benchmarking it
against a series of global best practices. These practices are a mixture of things that would always be a
good idea (e.g. taking effort and ability into consideration when promoting an employee) and some
practices that are now efficient due to changes in the environment. For example, rapid falls in the costs
of information technology have made the systematic use of data for monitoring performance much
more cost-efficient than ever before.
Bloom and Van Reenen (2007) use an interview-based evaluation tool that defines and scores from
one (“worst practice”) to five (“best practice”) eighteen basic management practices. This evaluation
tool was developed by an international consulting firm to target practices they believed were
associated with better performance, covering three broad areas:
• Monitoring: how well do companies track what goes on inside their firms, and use this for
continuous improvement? For example, is product quality regularly monitored so that any
production defects are quickly addressed rather than left to damage large volumes of output.
• Target setting: do companies set the right targets, track the right outcomes and take appropriate
action if the two are incongruent? For example, are individual production targets callibrated to
be stretching but achievable, rather than incredibly easy or impossibly hard.
4 Bertrand and Schoar (2006) show that there is substantial variation in “management styles” (e.g. in M&A activity) that are correlated with management characteristics. For example, older managers that have experienced the Great Depression tend to be more cautious than younger managers with MBA training on the tax advantages of debt leverage. Although this goes beyond TFP, management styles are still identified with the residual fixed effects in their analysis.

8
• People: are companies promoting and rewarding employees based on ability and effort, and
systematically trying to hire and keep their best employees? For example, are employees that
perform well, work hard and display high ability promoted faster than employees who under-
perform, are lazy and appear incompetent.
The management survey tool excludes practices whose performance impact clearly depends on
individual firms circumstance – for example, setting lower prices or providing 100% bonuses.
To obtain accurate responses from firms they interview production plant managers using a ‘double-
blind’ technique. One part of this double-blind technique is that managers are not told they are being
scored or shown the scoring grid. They are only told they are being “interviewed about management
practices for a research project”. To run this blind scoring open questions were used since these do not
tend to lead respondents to a particular answer. For example, the first monitoring question starts by
asking “tell me how you monitor your production process” rather than a closed question such as “do
you monitor your production daily (yes/no)”. Interviewers also probed for examples to support
assertions (see Table 1). The other side of the double-blind technique is interviewers are not told in
advance anything about the firm’s performance to avoid prejuduice. They are only provided with the
company name, telephone number and industry. Since the survey covers medium-sized firms (defined
as those employing between 100 and 10,000 workers) these would not be usually known ex ante by the
interviewers. The survey was targeted at plant managers, who are senior enough to have an overview
of management practices but not so senior as to be detached from day-to-day operations. The sample
response rate was 45% and this was uncorrelated with measures of firm performance.
One way to summarize firm-specific quality is to z-score each individual question and take an average
across all eighteen question.5 This management practice score is strongly correlated with firm
5 Another is to take the principal factor component. This provides an extremely similar results to the average z-score since these are correlated at 0.997.

9
performance (total factor productivity, profitability, growth rates, and Tobin’s Q and survival rates) as
well as firm size. These data were taken from independently collected company accounts and imply
that the managers’ responses contained real information. Figure 1 shows the correlation between the
management score and labor productivity, for example. Firms with higher management scores tend to
have higher sales per worker relative to the industry and country average. These correlations should
by no means be taken as causal but do suggest that the management data contains useful information.
Other research shows that better management is also associated with more energy efficient production
(Bloom, Genakos, Martin and Sadun, 2008), better patient outcomes in hospitals (Bloom, Propper,
Seiler and Van Reenen, 2009) and improved work-life balance indicators (Bloom, Kretschmer and
Van Reenen, 2009).
The bar chart in Figure 2 plots the average management practice scores across countries from the
6,000 interviews. The US has the highest average management practice scores, with Germany, Japan
and Sweden below, followed by a block of mid-European countries (France, Italy, the UK and Poland)
and Australia, with Southern Europe and developing countries Brazil, China, Greece and India at the
bottom. In one sense this cross-country ranking is not surprising since it approximates the cross-
country distribution of productivity. But in another sense it suggests management practices could play
an important role in determining this cross country productivity distribution.
Broadly, there are two alternative approaches to direct measures of management, or more generally
attempts to measure “intangible capital”, “organizational capital” (Prescott and Visscher, 1980) or “e-
capital”, of which managerial know-how is one element. First, one could try and infer these as
residuals using relatively weak conditions (variants of TFP) or more tightly specified structures (e.g.
Atkeson and Kehoe, 2005). Secondly, one can use past expenditures to build up intangible stocks
exactly as would be done for tangible capital (e.g. through the perpetual inventory method). This is

10
frequently done for R&D and advertising, but it is far harder to accomplish for management as there is
no clear data on such expenditures6.
III.2 Theories of management quality
The large-scale productivity dispersion described in Section II poses serious challenges to the
representative firm approach. This has lead to a wholesale re-evaluation of theoretical approaches in
several fields. For example, in international trade the dominant paradigm has already started to shift
towards heterogeneous firm models (e.g. Melitz, 2003).
Imperfect competition is one obvious ingredient for these models. With imperfect competition firms
can have differential efficiency and still survive in equilibrium. With perfect competition inefficient
firms should be rapidly driven out of the market as the more efficient firms undercut them on price.
Another important element is “frictions”, the adjustment costs to reallocation. One way of modeling
these frictions analytically is in Melitz (2003) who follows Hopenhayn (1992) in assuming that firms
do not know their productivity ex ante, but on paying entry costs firms receive a draw from a known
distribution. Firm productivity does not change over time. It can be thought of as entrepreneurs
founding firms with a distinct managerial culture which is imprinted on them until they exit, so some
firms are permanently “better” or “worse” managed. Over time, the low productivity firms are selected
out and the better ones survive and prosper. But, in the steady state there will always be some
dispersion of productivity as the cost of entry limits the number of firms that enter the market and draw
a productivity value.
6 See Corrado, Hulten and Sichel (2006) at the macro level. Lev and Radhakrishnan (2004) use firm expenditures on sales, general and administrative costs, but this too broad as, for example, it often includes advertising.

11
Identifying this permanent productivity advantage as “managerial quality” is consistent with the
tradition in the panel data econometric literature. Indeed, Mundlak’s (1961) fixed effects panel data
model was designed to control for this unmeasured managerial ability. More recent attempts have tried
to measure management directly rather than indirectly.
Modeling the TFP advantage as a fixed factor is a convenient way of introducing frictions in the
model. The managerial factor is “trapped”, as there is no direct market for it as it cannot be transferred
between firms. When the firm exits, so does the productivity advantage – entrepreneurs take a new
draw if they enter again. In reality, adjustment costs can take more general forms then entry costs and
are likely to be important as organizational forms take time to adjust (e.g. to move from centralization
to decentralization). Measured TFP will diverge from real TFP if some firms are further away from
their long-run equilibrium than others.
The management quality measures in Bloom and Van Reenen (2007) can be interpreted as the
permanent draw from the productivity distribution when firms are born. Alternatively, it may reflect
that some individuals have superior managerial skill and can maintain a larger span of control as in
Lucas (1978). More generally, management quality could evolve over time due to investments in
training, consultancy, etc.
A common feature of these models is that management is partially like a technology, so there are
distinctly good practices that would universally raise productivity. For example, promoting employees
based on performance, effort and ability (rather than family connections or tenure) is a practice that
should be pretty universally associated with higher productivity. We believe that this technological
element of management practices is important, and the traditional models that seek to understand

12
technological diffusion are relevant for understanding the spread of managerial techniques (e.g. Hall,
2003).
An alternative theoretical to the view is that all management is contingent, so no practice can ever be
considered on average to be better or worse. For example, individual performance rewards may reduce
productivity in industries with team based production but increase productivity in industries with
individual production. In these models, firms at every point are choosing their optimal set of
management practices and no firm is more efficient than another based on these. In management
science, “contingency theory” (e.g. Woodward, 1958) is akin to this.
Any coherent theory of management has firms choosing different practices in different environments,
so there will always be some element of contingency. For example, Bloom and Van Reenen (2007)
show that firms appear to specialize more in investing in “people management” (practices over
promotion, rewards, hiring and firing) when they are in a more skill-intensive industry. If we examine
the relative scores by country for monitoring and target setting practices compared to people
management, the US, India and China have the largest relative advantage in people management, and
Japan, Sweden and Germany the largest relative advantage in monitoring and target setting
management. The systematic difference in the relative scores of different types of management across
countries also suggests that there may be some specialization in areas of comparative advantage,
perhaps due to labor market regulation.
The interesting question is whether there really are any “universals”, i.e. some practices that would be
unambiguously better for the majority of firms? The results of Bloom and Van Reenen (2007) that
certain management practices are robustly associated with better firm performance suggests there may
be. Given this the question is then why are all firms not adopting these universally good management
13
practices? The answer to this question is identical to that of the adoption of any new technology – there
are costs to adoption in the form of information, incentives, regulatory constraints and externalities.
These will vary by time and place and we turn to some of these factors next.
III.3 Some factors influencing management practices
Without trying to be exhaustive we discuss some of the main factors influencing the Bloom and Van
Reenen (2007) management practices measures.
Product Market Competition
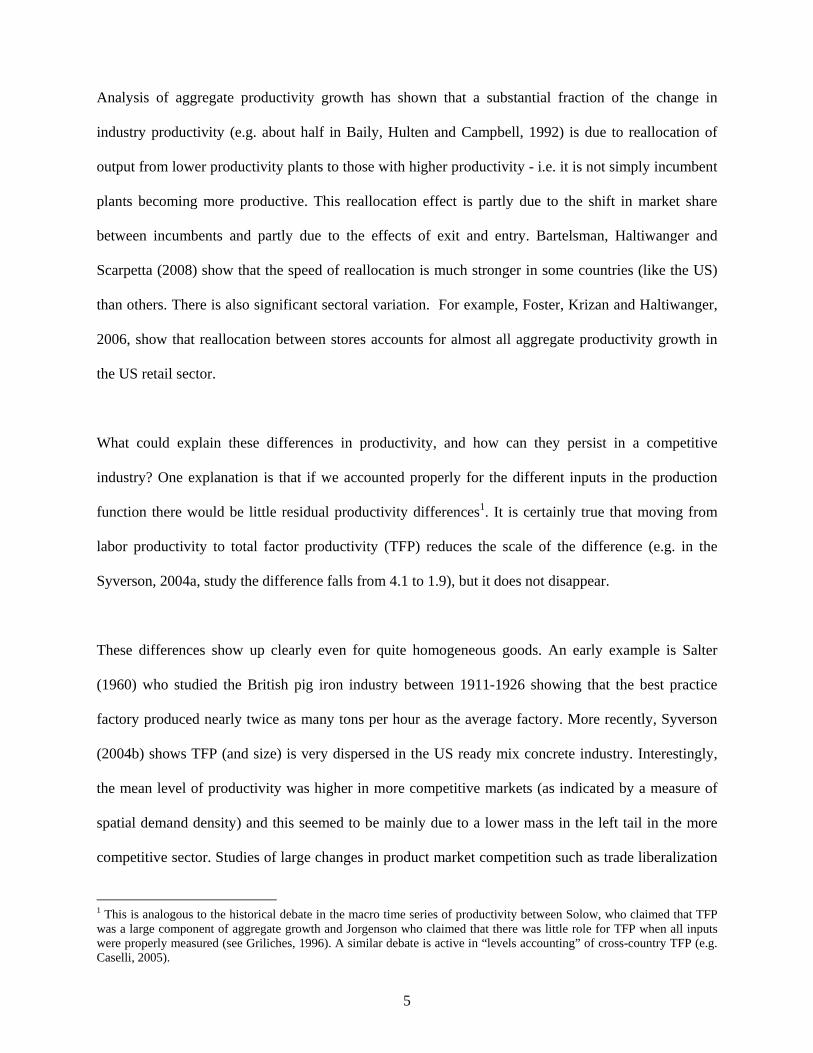
Figure 3 plots the firm-level histogram of management practices, and shows that management
practices, like productivity, display tremendous variation within countries. The variation across firms
within country is far greater than cross-country variation. Some countries (e.g. India) have lower
management scores than the US due to a large density of badly run firms (scores of 2 or less). This
immediately suggests, like Syverson (2004a,b) that the tougher competitive conditions in the US
causes greater selection removing the badly managed firms more ruthlesslessly than in India and other
nations.
.
More formally, we can look at the conditional correlation between the management score and several
measures of competition in Table 2. Whether measured by trade oppenness, the industry inverse
Lerner Index or simply the number of perceived rivals, competition is robustly and positively
associated with higher management practice scores. Note that the obvious endogeneity bias here is to
underestimate the importance of competition as better managed firms are likely to have higher profit
margins, lower import penetration ratios and drive out their rivals.
Family Firms

14
There has been a lively debate on the relative merits of family firms (e.g. Bertrand and Schoar, 2006).
Firms which are both owned and run by a family member are very common, especially in developing
countries. Figure 4 plots a firm-level histogram of the management scores by ownership category. The
bars display the distribution of management practices within ownership group. The dotted line is the
kernel density for dispersed shareholders – which is the most common ownership category in the US -
for comparison. Firms that are family owned and family managed (“Family, family CEO”) have a
large tail of badly managed firms, while the family owned but externally managed (“Family, external
CEO”) look very similar to dispersed shareholders. Government firms are clearly badly managed,
while firms owned by Private Equity appear well managed.
This finding is robust to more systematic controls for other covariates (see Bloom and Van Reenen,
2007). Family ownership per se is not correlated with worse management practices, it is when family
ownership is combined with the CEO being chosen as the eldest son (Primogeniture) that the quality of
management appears to be very poor. This is consistent with the idea that limiting the talent pool to a
single individual is not the optimal form of CEO selection. It is also consistent with Perez-Gonzalez
(2006) and Bennesden, Nielson, Perez-Gonzales and Wolfenzon (2007) who find that inherited family
control appears to cause worse performance7.
International Trade and globally engaged firms
Consistent with Helpman, Melitz and Yeaple (2004) there is a pecking order in management scores
with purely domestic firms at the bottom, firms that export but do not produce overseas next and
multinational firms at the top. In fact, multinational subsidiaries tend to be better managed in every
country, consistent with the idea that they can “transplant” some of their practices overseas. This is
7 They use the gender of the eldest child as an instrumental variable for family management since families are more likely to hand management down to sons.

15
important as it suggests that a mechanism for good management practices to diffuse internationally is
through the investments of overseas firms.
Education
Education is extremely highly correlated with productivity in a range of studies, and with management
scores in the Bloom and Van Reenen (2007) work. Interestingly, they find that this is true both for
managerial education (proxied by the share of managers with a degree or an MBA) and also for the
non-managerial education (proxied by the share of non-managers with a degree). One potential
explanation is that it is easier to adopt modern management practices around data collection and
analysis, economically rational targets and strong incentives if employees are strongly numerate.
Labor market regulation
The cross country differences in people management are related to the degree of labor market
regulation (lightly regulated countries such as the US and Canada do better than heavily regulated
countries such as France, Brazil and Greece). This is consistent with heavily regulated labor markets
restricting managerial practices around hiring, firing, pay and promotions.
Summary on determinants of management quality
Although causality is hard to prove, our reading of the evidence is that weak product market
competition and family firms reduce management quality and more human capital and lighter labor
regulation improve people management. Although openness to trade and FDI will help increase
average management quality, the fact that multinationals and exporters are better managed is also
linked to a selection effect, rather than necessarily being causal.
IV. DECENTRALIZATION

16
We focus on decentralization as distinct from managerial spans of control. These are distinct concepts
as the span and depth (number of levels) of a hierarchy are compatible with different power
relationships between the levels. Nevertheless there is some evidence that the move towards delayering
over the last twenty years has been associated with decentralization (see Rajan and Wulf, 2006).
IV.1 Measurement of decentralization
A key factor in any organization is who makes the decisions? A centralized firm is one were these are
all taken at the top of the hierarchy and a decentralized firm is where decision-making is more evenly
dispersed throughout the hierarchy. An extreme case of decentralized organization is a market
economy where atomistic individuals make all the decisions and spot contract with each other. The
origin of many of the debates on decentralization has their origins in the 1930s over the relative merits
of a market economy relative to a centrally planned one.
How can this concept be operationalized empirically? One way is to look at the organization charts of
firms (“organogram”) as graphical representations of the formal authority structure. One of the best
studies in this area is Rajan and Wulf (2006) who use the charts of over 300 large US corporations
1987-1998 to examine the evolution of organizations (e.g. how many people directly report to the CEO
as a measure of the span of control). Unfortunately, as Max Weber and (more recently) Aghion and
Tirole (1997) stressed, formal authority is not the same as real authority as the organogram may not
reflect where real power lies.
Observing whether a firm is decentralized into profit centers is useful, as this is a formal delegation of
power - the head of such a business unit will be performance managed on profitability. If the firm is
composed of cost (or revenue) centers this indicates less decentralization. If the firm does not even

17
delegate responsibility at all, this is more centralized. Acemoglu, Aghion, Lelarge, Van Reenen and
Zilibotti (2007, henceforth AALVZ) use this distinction.
Still, just using profit centers as an indicator is rather crude and a better way is directly survey the
firms themselves. Bloom, Sadun and Van Reenen (2009a) measure decentralization between the
central headquarters (CHQ) and the plant manager (see Table 3). They asked plant managers about
their decisions over investment (maximum capital investment that could be made without explicit sign
off from central headquarters), hiring, marketing and product introduction (the latter three on a scale of
1 to 5).
As a summary empirical measure consider the combination of these four measures into a single index
of decentralization by z-scoring each individual indicator and z-scoring the average. As with the index
of management quality in Bloom and Van Reenen (2007) decentralization displays considerable
variation across firms. There is also a large difference across countries as shown in Figure 5.
Interestingly, the US, UK and Northern European countries are the most decentralized and the Asian
countries the most centralized.
Decentralization extends beyond just plant managers and the CHQ of course. At a minimum there is
the autonomy of the workers from the plant manager. Bresnahan, Brynjolfsson and Hitt (2002) focused
on this aspect. Proxies for this include questions over worker control over the pace of work and the
allocation of tasks (see Table 3).
IV.2 Theories of decentralization
The basic trade off in the decentralization decisions is between the efficient use of local information
(see Radner, 1993) favoring delegation and the principal-agent problem where the agent has weaker

18
incentives to maximize the value of the firm than the principal (on the trade-off see Aghion and Tirole,
1997 and Prendergast, 2002).
The benefits from decentralization arise from at least three sources. First, decentralizing decision-
making reduces the costs of information transfer and communication. In a hierarchical organization,
information that has been processed at lower levels of the hierarchy has to be transferred upstream.
This induces a cost due to the need that information be codified and then received and analyzed at
various levels (Bolton and Dewatripont, 1994). When decision-making is decentralized, information is
processed at the level where it is used so that the cost of communication is lower. Second,
decentralization increases firms’ speed of response to market changes (Thesmar and Thoenig, 1999).
One reason for this is that hierarchical organizations are characterized by a high degree of
specialization of workers. Any response to market changes involves the coordination of a great number
of activities so that overall firm's reaction speed is low. When responsibility is transferred downstream,
it is most often delegated to teams of workers, generally involved in multi-tasking. This allows a
quicker reaction to market changes given that coordination involves a limited number of multi-skilled
workers. Finally, decentralization of decision-making may increase productivity through rising job
satisfaction. Delegation of responsibility goes along with more employee involvement, greater
information sharing and a greater participation of lower level staff.
Turning to the costs of decentralization, we highlight four of them. First, costs arise from the risk of
duplication of information in the absence of centralized management. Workers are now in charge of
analyzing new pieces of information. With decentralization the risk of replication in information
processing increases, both across individuals and across teams. A related risk is that of an increase in
the occurrence of “mistakes” as there is less co-ordination (e.g. plants producing substitutable products
will tend to price too low) - see Alonso, Dessein and Matouschek (2008) for a general discussion. A
19
third cost is that decentralization makes it more difficult to exploit returns to scale (Thesmar and
Thoenig, 2000). The reason for this is that as multi-tasking develops returns to specialization decreases
so that large-scale production becomes less beneficial. Finally, decentralization may reduce workers'
efficiency if the increase in responsibility that it implies induces rising stress (Askenazy, 2001). In this
case, productivity may be directly affected and/or reduced through lower job satisfaction.
IV.3 Some factors determining decentralization
We divide our analysis into the examination of three groups of factors that influence decentralization:
technological, economic and cultural.
Technological Factors
Firm Size and Scope
Some basic factors determine decentralization. All else equal a larger firm will require more
decentralization than a small firm. A sole entrepreneur does not need to delegate because he is his own
boss, but as more workers are added, doing everything himself is no longer feasible. Penrose (1959)
and Chandler (1962) stressed that decentralization was a necessary feature of larger firms, because
CEOs do not have the time to take every decision in large firms. Similarly as firms expand in their
scope both geographically and in product space, local information will become more costly to transmit
so this will also favor decentralization
Table 4 illustrates these factors at work from Bloom, Sadun and Van Reenen (2009a) who regress
plant manager autonomy on a number of factors. Column (1) shows that doubling firm size increases
the decentralization in index by 0.05 of a standard deviation and doubling of plant size increases
20
decentralization by 0.09. Plant managers in subsidiaries of foreign multinationals have 0.16 of a
standard deviation more autonomy than similar plants that are domestic non-multinationals8.
Information and Communication Technologies (ICT)
Garicano (2000) formalizes the idea of the firm as a cognitive hierarchy. There are a number of
problems to be solved and the task is how to solve them in the most efficient manner. The simplest
tasks are performed by those at the lowest level of the hierarchy and the “exceptional” problems are
passed upwards to an expert. The cost of passing problems upwards is that communication is non-
trivial. The benefit of passing the problem upwards is that it economizes on the cognitive burden of
lower level employees.
This framework was designed to address the impacts of ICT. Interestingly, information technologies
have different implications for decentralization than communication technologies. Consider again the
decentralization decision between the CHQ and plant manager. When communication costs fall
through (for example) the introduction of company intranets, it is cheaper for the plant manager to
refer more decisions to the corporate officers. So communication technologies should cause
centralization. By contrast, technologies that make it easier for the plant manager to acquire
information (e.g. Enterprise Resource Planning software, ERP like SAP) means that decentralization
should increase. An example in law firms would be Lexis Nexis that enables junior lawyers to quickly
find relevant cases without consulting a more senior associate or partner.
Bloom, Garicano, Sadun and Van Reenen (2009) test this theory and find considerable empirical
support. Computer networks (reducing communication costs) significantly decrease decentralization to
plant managers whereas tools to help managers access more information (like ERP) significantly
8 Colombo and Delmastro (2004) also find that complexity related variables are associated with decentralization in their sample of Italian firms.

21
increase decentralization. The magnitude of the effect is substantial. An increase in ERP usage by 60%
(the average difference in ICT between Europe and the US) increases plant manager’s autonomy by
0.025 which is equivalent to a large increase in the supply of human capital (roughly the same as the
increase in US college graduates between 1990 and 2000).
Age, innovation and heterogeneity
AALVZ present a model of decentralization that stresses the need to learn about the best way to use a
new technology. This is a special case of the general problem that an organization faces in deciding
whether to do a new thing without knowing for sure what the benefits (and perhaps costs) will be. The
set-up is of a principal (CHQ) deciding whether or not to delegate to a local agent (plant manager) who
is better informed. As usual the trade-off is between better local information, and worse incentives due
to the agency problem.
The natural way to model this is of the firm attempting to learn from other implementations of the
technology. AALVZ consider first the problem of learning from other firms in the industry. The
profitability of each previous implementation of the technology is a (noisy) signal of the profitability
of the firm implementing the technology itself. Firms act as Bayesians updating their priors based on
the public history of other firms. As we know more and more about the success of the new technology
there is increasingly less need to delegate to the better informed local agent. This immediately
generates two results. First, the greater the heterogeneity of the industry, the less valuable will be the
experience of other firms in predicting the outcome for the firm itself. Thus greater heterogeneity (as
indicated by say, the variance of productivity) will be associated with more decentralization. Second,
the more recent the technology the less will be known, so the more likely the firm is to decentralize to
the plant manager. An extension to the model considers learning from oneself rather than from others.

22
In this case older firms who have had more time to learn about themselves should be more centralized
than younger firms.
AALVZ measure decentralization in several ways using both formal measures of whether firms are
organized into profit centers (in French data) and “real” survey measures of the power managers have
over hiring decisions (in British data). In both samples they find econometric evidence consistent with
their three theoretical predictions: decentralization is more likely in industries that are more
heterogeneous, and for firms that are younger or closer to the technological frontier. These results are
illustrated in Figures 6 where average decentralization is plotted by decile for the raw data. In Panel A,
there is a reasonably clear upward slope after the second decile between decentralization and
heterogeneity9. In Panel B, decentralization appears to be higher among firms closer to the
technological frontier (as measured by productivity) and in Panel C older firms appear more
centralized than younger firms.
Economic Factors
Skills
Many models would predict that human capital should be associated with decentralization. For
example, more skilled workers will have greater ability to take on more responsibility. When the
environment changes due to new technologies and organizational change is required, skilled workers
may be better at learning how to cope with the new organizational structures.
There is generally a robust and positive association of decentralization and skills. Column (1) of Table
4 from Bloom, Sadun and Van Reenen (2009a) measures skills by the proportion of people who hold a
college degree and find this to be significantly correlated with decentralization. Caroli and Van Reenen
9 The authors show that the anomalous first decile is due to the disproportionate number of older and less productive firms in this decile (this is controlled for in the regressions).

23
(2001) examine the relationship between skills and organization in some detail, arguing in favor of
“skill biased organizational change”. To tackle the endogeneity problem they use information on the
differential price of skilled vs. unskilled labor in the local market (as indicated by the wage differential
between college educated workers and other individuals). They argue that this skill premium is
partially driven by exogenous shifts in labor supply of unskilled workers. For their sample of UK and
French firms they find that regions where skill prices are higher have a lower probability of
decentralization/delayering.
Product Market Competition
Some authors such as AALVZ argue that a cause of the move to more decentralized and delayered
organizations is rapid technological change (in IT for example). An alternative explanation is that
globalization and deregulation (and perhaps technical change itself) has increased the degree of
product market competition has stimulated organizational change.
Theory is ambiguous here. If competition has made swift decisions more important than this will have
increased the salience of local knowledge, leading to greater decentralization under the framework
discussed above (e.g. Aghion and Tirole, 1997). Similarly if competition aligns the incentives of
agents more with the principal than the costs of decentralization may also have fallen. There are
countervailing forces however. For example, a larger number of firms in an industry aids yardstick
competition, but it may also help learning in the AALVZ framework which will reduce the need to
decentralize.
The empirical evidence, however, is clear cut. Bloom, Sadun and Van Reenen (2009a) find a robust
positive association between competition and decentralization using industry import competition
(column (2) in Table 4), the inverse industry Lerner index (column (3)) or simply the number of

24
perceived competitors (column (4)). A similar positive correlation was reported in AALVZ and Marin
and Verdier (2008). Both of these are cross sectional studies and the positive coefficient on
competition could simply reflect unobserved variables. Guadalupe and Wulf (2009) try to tackle this
using the Rajan and Wulf (2006) panel data on the changing organizational structure of firms over
time. They argue that the Canadian-US Free Trade Agreement (FTA) in 1989 constitutes an exogenous
increase in competition for US firms in the industries where tariffs were removed. Exploiting this
policy experiment they find that competition is associated with delayering (increasing span for CEO)
and that this is likely to also reflect increased delegation (using wage data).
Culture
In recent years, economists have started to take cultural factors more seriously in determining
economic outcomes (Guiso, Sapienza and Zingales, 2006; Grief, 1994). Part of this is due to the
influence of Putnam (1993) on the importance of social capital and the finding that trust is important in
a number of economic dimensions (e.g. see Knack and Keefer, 1997, on growth or Guiso, Sapienza
and Zingales, 2009, on foreign trade).
Trust is an obvious candidate from improving delegation incentives as it will relieve the agency
problem that the delegated agent will steal from the principal. It could also be a mechanism to enforce
long term contracts in repeated interaction, particularly in the framework of Baker, Gibbons and
Murphy (1999) where formal authority always resides with the principal. In their model the principal
decides whether to decentralize after the agent reveals their private information, so it is important the
agent trusts the principal will allow them to decentralize after they reveal their information. If contracts
can be well enforced this should also help decentralization to take place, and we do observe more

25
delegation in countries where rule of law is strong (see column (5) in Table 4).10 However, contracts
are never perfectly enforceable and this leaves a role for trust to help generate more delegation.
Bloom, Sadun and Van Reenen (2009a) examine the importance of culture. Column (1) of Table 4
shows that higher levels of trust in the region where a plant is located is associated with a significantly
greater degree of decentralization. Trust is measured using the standard indicators in the World Values
Survey. The magnitude of this effect is non-trivial. Moving from the region with the lowest level of
trust (Assam in India) to the highest trust region (Norrland in Sweden) is associated with an increase of
0.45 of a standard deviation in the decentralization index.
Bloom, Sadun and Van Reenen (2009a) also exploit the fact that they have many subsidiaries of
multinational firms so they can construct measures of trust in the country of origin (the multinational’s
headquarters) and location (country were affiliate is set up). Both of these seem to matter for
decentralization, but the most powerful factor is the bilateral trust between country pairs, i.e. the
degree to which people from the subsidiary’s parent country trust people in the country where the plant
is located. Multinationals locating in countries that are seen to be relatively highly trusted (after
country location and origin dummies are removed) are more likely to decentralize. This suggests that
trust can affect the internal structures of global firms and that some aspects of organization are
transplanted abroad as suggested by recent theories of international trade (e.g. Helpman Melitz and
Yeaple, 2004).
Summary on decentralization
Like good management, larger, global firms that are closer to the technology frontier and located in
more heterogeneous and competitive industries will on average, become more decentralized. 10 Laevan and Woodruff (2007) looked at the impact of rule of law on firm size across regions within one country, Mexico. They find larger firms in the states where rule of law is better enforced, consistent with our argument that strong rule of law facilitate decentralization, which enables efficient firms to grow.

26
Improvements in information technology increase decentralization, but improvements in
communication technology reduce decentralization. Finally, cultural and legal factors such as lower
trust increase decentralization.
V ORGANIZATIONAL PRACTICES AND FIRM PRODUCTIVITY
How can researchers identify the causal effects of organizational practices in general (in particular
management practices and decentralization) on firm performance?
V.1. Correlations of performance and organizational practices: The Basic Identification Problem
Consider the basic production function as:
ititkitlit aklq ++= αα (1)
Where q is ln(output), l is ln(labor) and k is ln(capital) of firm i at time t. Assume that we can write the
TFP term as
ititit umaa ++= β0 (2)
where itm is an organizational feature of the firm (such as the management index discussed in section
III) and itu an unobserved error. So
itititkitlit umklaq ++++= βαα0 (3)
27
Assume that we can deal with the econometric problems in estimating the coefficients on the
production function so that we have a consistent measure of total factor productivity (see Ackerberg,
Benkard, Berry and Pakes, 2007, for a discussion of recent contributions here). OLS estimation of (2)
will generally be biased as 0)( ≠ititumE .
The traditional strategy is to assume that m is a fixed effect. So one approach is simply to recover TFP
and project it on m. This will indicate whether there is an association between the two measures, but
the relationship is by no means causal. For example, Bloom and Van Reenen (2007) show that there is
a robust relationship between TFP and their measure of management quality, but they interpret this as
an “external validity” test of the quality of the management data rather than any causal relationship.
An analogous strategy if there are time varying measures of organization is to treat all the correlated
unobservables as fixed, i.e. itiitu εη += with 0)( ≠iitmE η but ( ) 0, 1it it sE m sε − = ≤ . Thus the fixed
effect model estimated in (say) differences would be ititit ma εβ Δ+Δ=Δ which can be consistently
estimated by OLS.
There are a huge number of studies that have correlated various aspects of the firm’s performance on
various aspects of its organizational form (see the survey in Lazear and Oyer, 2009). The better studies
use micro data and pay careful attention to the measurement issues and need to control for many
covariates. For example, Capelli and Neumark (1999) and Black and Lynch (2001) examine various
aspects of “high performance” workplaces mostly relating to employee involvement, team work and
meetings. Caroli and Van Reenen (2001) look at organizational changes such as delayering. All three
papers look across many industries and find no direct effect of these measures on performance (in
contrast to many of the case studies).

28
There remain several serious problems. First is the data constraint that measuring organization is hard
and finding data with time series variation even harder. Second, the management proxies are measured
with error, so this will cause attenuation towards zero if the measurement error is classical. This bias is
exacerbated in first differences. Third, and most seriously, the factors that cause variation in the
propensity to adopt organizational practices will also likely be correlated with those affecting TFP so
the assumption that 0)( =ititmE ε is unlikely to hold in most cases. The bias could be upwards or
towards zero (e.g. if firms doing badly are more likely to innovate organizationally as argued by
Nickell, Nicolitsas and Patterson, 2001).
There is no simple solution to this as we fundamentally need some identifying variation. The most
promising route is through randomized control trials, for example where the researchers design an
intervention to raise management quality (such as a high quality management consultancy
intervention) and randomize out a control group from the eligible population. The authors are involved
with such experiments in India and Eastern Europe, and in preliminary analysis are finding large
productivity effects of improvement management practices (Bloom, Eifert, Mahajan, McKenzie and
Roberts, 2009). An alternative to real experiments is to use quasi-experiments on specific interventions
and there is an emerging literature on this.
Most of the quasi-experiments have been in the labor economics field. A good example is Lazear
(2000) who looked at the introduction of a pay for performance system for windshield installers in the
Safelite Glass Company. Lazear found that productivity increased by around 44%, with about half of
this due to selection effects and half from the same individuals changing behavior. More recently,
Bandiera, Barankay and Rasul (2008) engineered a change in the incentive pay system for managers in
farm. They have no contemporaneous control group, but can examine the behavior of individuals
before and after the introduction of the incentive scheme. Productivity rose by 21% mainly due to

29
improved selection (the managers allocated more fields to the ablest workers rather than their
friends)11.
A related literature is on the productivity impact of labor unions, an important human resource policy
choice (see Freeman and Medoff, 1984). Exactly the same set of issues arises. One recent attempt at an
identification strategy here is DiNardo and Lee (2004) who exploit a regression discontinuity design.
In the US a unions must win a National Labor Relations Board election to obtain representation, so one
can compare plants just above the 50% cut-off to plants just below the 50% cut-off to identify the
causal effects of unions. In contrast to the rest of the literature, DiNardo and Lee (2007) find no effect
of unions on productivity, wages and most other outcomes. The problem, of course, is that union
effects may only “bite” when the union has more solid support from the workforce.
V.2 Complementarities between organizational practices
One of the key reasons why firms may find it difficult to adjust their organizational form is that there
are important complementarities between sets of organizational practices. Milgrom and Roberts (1990)
build a theoretical structure where such complementarities (or more precisely, super-additivities) mean
that firms optimally choose clusters of practices that “fit together”. When the environment change so
that an entrant firm would use this group of optimal practices, incumbent firms will find it harder –
they will either switch a large number together or none at all.
This has important implications for productivity analysis. The effects of introducing a single practice
will be heterogeneous between firms and depend on what practices they currently use. This implies
linear regressions of the form of equation (2) may be misleading. To see this consider there are two
11 Other examples include Shearer (2004) who finds productivity increases from a switch to piece rates of tree planters in British Columbia and Freeman and Kleiner (2005) who find a loss of productivity when piece rates were removed for a footwear manufacturer. More ambiguous effects are found in Asch (1990), Courty and Marshke (2004), Oyer (1998) and Griffith and Neely (2009).

30
practices, m1 and m2 and their relationship with productivity is such that TFP increases only when both
are used together.
itititititit ummmmaa ++++= )*( 2112
22
110 βββ (4)
One version of the complementary hypothesis is 0,0,0 1221 ><< βββ , i.e. the disruption caused by
just using one practice actually reduced productivity. A regression which omits the interaction term
may find only a zero coefficient on the linear terms.
The case study literature emphasizes the importance of complementarities. Testing for their existence
poses some challenges, however, as pointed out most clearly by Athey and Stern (1998). A common
approach is a regression of practice 1 on practice 2 (and more) with a positive covariance (conditional
on other factors) indicating complementarity. It is true that complements will tend to covary positively,
but this is a very weak test. There could be many other unobservables causing the two practices to
move together. We need an instrumental variable for one of the practices (e.g. Van Biesebroeck,
2007), but this is hard to obtain as it is unclear what such an instrument would be - how could it be
legitimately excluded from the second stage equation? In classical factor demand analysis we would
examine the cross price effects to gauge the existence of complements versus substitutes, i.e. does
demand for practice 1 fall when the price of practice 2 rises (all else equal). There still remains the
concern that the price shocks could be correlated with the productivity shocks, but such an assumption
is weaker than assuming unobserved shocks to the firm’s choice of practices are uncorrelated.
Unfortunately, such tests are particularly hard to implement because there are generally not market
prices for the organizational factors we are considering.
An alternative strategy is to work straight from the production function (or performance equation more
generally). Consider the productivity equation after substituting in multiple practices:
31
ititititititkitliit ummmmklaq ++++++= )*( 2112
22
11 βββαα (5)
In an influential paper Ichinowski, Prennushi and Shaw (1997) estimate a version of equation (5) using
very disaggregate panel data on finishing lines in US steel mills using eleven human resource practices
(including incentive pay, recruitment, teamwork, job flexibility and rotation). Their measure of
productivity is based on downtime - the less productive lines were idle for longer. They find that
introducing one or two practices has no effect on productivity, but introducing a large number together
significantly raises productivity. Although the endogeneity problem is not eliminated, the controls for
fixed effects, looking within one firm and using performance data helps reduce some of the more
obvious sources of bias.
V.3. The role of ICT
One of the key productivity puzzles of recent years has been why the returns to the use of information
and communication technologies appear to be so high and so heterogeneous between firms and
between countries. For example, Brynjolffson and Hitt (2003) find that the elasticity of output with
respect to ICT capital is far higher than its share in gross output (see also Stiroh, 2004). One
explanation for this is that effective use of ICT also requires significant changes in firm organization.
Changing the notation of (5) slightly we could write
ititcmititcitkitliit umcmcklaq ++++++= )*(βββαα
With the hypothesis that cmβ >0. This is broadly the position of papers in macro literature in explaining
the faster productivity growth of the US than Europe after 1995 (e.g. Jorgenson, Ho, and Stiroh, 2008).

32
Bresnahan, Brynjolfsson and Hitt (2002) try to test this directly by surveying the organizations of large
US firms on decentralization and team work (for a cross section) and combining this with data on ICT
(from a private company Harte-Hanks) and productivity from Compustat. They find evidence that
cmβ >0. Bloom, Sadun and Van Reenen (2007) broaden the sample to cover both the US and firms in
seven European countries and find evidence of complementarity of ICT with people management.
They also show that their results are robust to controlling for firm fixed effects. Careful econometric
case studies (e.g. Baker and Hubbard, 2004; Bartel, Ichinowski and Shaw, 2007) also identify
differential productivity effects of ICT depending on organization form.
V.4 The role of human capital
One of the reasons for the renewed interest in organizational change by labor economists was the
attempt to understand why technology seemed to increase the demand for human capital, and thus
contribute to the rise in wage inequality experiences by the US, UK and other countries since the late
1970s. Many theories have been proposed (see Autor, Levy and Murnane, 2003, for a review), but one
hypothesis is that lower IT prices increased decentralization for the reasons outlined in Garicano
(2000) and in sub-section IV.3, and decentralization leads to an increase in inequality (Garicano and
Rossi-Hansberg, 2006). Further, decentralization is complementary with skills for at least three
reasons. First, skilled workers are more able to analyze and synthesize new pieces of knowledge so
that the benefits of the local processing of information are enhanced. Additionally, skilled workers are
better at communicating which reduces the risk of duplication of information. Second, the cost of
training them for multi-tasking is lower and they are more autonomous and less likely to make
mistakes. Finally, workers who are better educated may be more likely to enjoy job enrichment, partly
because they expect more from their job in terms of satisfaction.
This has three main implications:

33
(i) Decentralization leads to skill upgrading within firms. This is due to the fact that the
return to new work practices is greater when the skill level of the workforce is higher.
(ii) A lower price of skilled labor will accelerate the introduction of organizational changes.
(iii) Skill intensive firms will experience greater productivity growth when decentralizing.
Caroli and Van Reenen (2001) find support for all three predictions. They estimate production
functions (with the relevant interactions), skill share equations and organizational design equations. A
novel feature of this approach is that because labor is traded in a market, it is possible to use local skill
price variation to examine the complementarity issues. They find that higher skill prices make
decentralization less likely, consistent with “skill biased organizational change”.
V5. Aggregate Implications and Reallocation
One route through which structural factors of a country like high human capital and strong competition
lead to high aggregate productivity is that each firm has better management practices (as reflected in
equation (3)). Another mechanism as discussed in section II, however, is that aggregate productivity
will be higher if more output is allocated to the more efficient firms.
Hsieh and Klenow (2009) find much stronger reallocation effects (a correlation between size and
productivity) in the US than in India or China. They suggest this could be due to distortions due, for
example, bribery and corruption causing arbitrary variation in the cost of capital and labor across
firms. But an alternative explanation is that structural factors, such a low human capital, generate poor
management which leads to greater optimization errors. Good management practices involve the
collection and analysis of production information, so that firms are less likely to make errors when
undertaking new investment or hiring. For example, if badly managed firms make investment
decisions without undertaking formal cost-benefit analysis (e.g. capital budgeting) they are much more

34
likely to make investment errors. These optimization errors will lead to a lower correlation between
firm size and productivity in countries with bad management practices – like Brazil and India - than in
countries with good management like the US.
VI CONCLUSIONS
A growing body of empirical work has shown significant heterogeneity in firm size and productivity,
which has only recently been incorporated into mainstream models. Organizational economics has
long stressed this phenomenon, but has lacked a rigorous empirical basis to measure firm-level
management and decentralization across firms and countries. Several recent papers have tried to fill
this gap and we now have (at least in the cross section) much more knowledge. For example,
management and decentralization differ substantially across and between countries. Larger, more
skilled and more globally engaged firms tend to be better managed and more decentralized, as do firms
in more competitive markets. Family firms are worse managed. Firms using more IT, in more
heterogeneous sectors and in regions where trust is high tend to be more decentralized.
There are many exciting areas for future research. Building up panels of data to examine
organizational change is a priority (e.g. is the effect of competition on management mainly through
selection or incumbent responses?). There needs to be a closer link between the theories, data and
empirical evidence. And what are the implications for policy?
In terms of economic development, we think it is likely that the productivity gap between nations is
not simply linked to the access to “hard” technologies such as computers, but also depends more on the
ability of developing countries to access and implement some of the organizational practices discussed
here. The fact that multinationals can spread better management all over the world, suggests that

35
structural factors are not impossible to overcome. Openness to foreign investment and trade (to
stimulate competition) should also foster improvements. The evidence that many firms struggle to
grow in developing countries may be because of the difficulty of decentralizing which is necessary for
larger firms to operate effectively. Economic, technological and cultural factors all play a role in
distorting the ability of firms to decentralize and grow. Understanding how to alleviate these barriers is
an important research and public policy question.
Word Count: 10,098 (includes abstract); Figures + table (10): 2,600; Total = 12,698 [limit was
13,000]
36
BIBLIOGRAPHY
Acemoglu D, Aghion, P, Lelarge, S, Van Reenen, J and Zilibotti, F. 2007 Technology, Information
and the Decentralization of the Firm. Quarterly Journal of Economics, 122(4): 1759–1799.
Ackerberg, D, Benkard, L, Berry, S and Pakes, A. (2007) “Econometric tools for analyzing market
outcomes”, in James Heckman and Edward Leamer (eds) Handbook of Econometrics Volume 6A,
Amsterdam: North-Holland.
Aghion P, and Tirole, J. 1997 Formal and Real Authority in Organizations. Journal of Political
Economy, 105(1): 1-29.
Aghion P, Caroli, C and Garcia-Penalosa, C. 1999. Inequality and Economic Growth: The Perspective
of the New Growth Theories. Journal of Economic Literature, 37(4): 1615-1660
Alonso R, Wouter D and Matouschek, N. 2008 When Does Coordination Require Centralization?
American Economic Review, 98(1): 145-179.
Asch B. 1990 Do Incentives Matter?: The Case of Navy Recruiters. Industrial and Labor Relations
Review, 43: 89-107.
Askenazy P. 2001 Innovative Workplace Practices and Occupational Injuries and Illnesses in the
United States. Economic and Industrial Democracy 22(4): 485-516.
Atkeson A. and Kehoe, P. J. 2005 Modeling and Measuring Organization Capital. Journal of Political
Economy, 113(5): 1026-1053.

37
Autor D, Levy, F and Murnane, R. 2003 The Skill Content of Recent Technological Change: An
Empirical Exploration. Quarterly Journal of Economics, 118(4) 1279-1334.
Athey S and Stern, S. 1998 An Empirical Framework for Testing Theories About Complementarity in
Organizational Design. NBER Working Paper 6600
Aw, B., Roberts, M and Xu, D (2008) R&D Investments, Exporting, and the Evolution of Firm
Productivity American Economic Review, 98(2), 451-456
Baily M. Hulten, C and Campbell, D. 1992 Productivity Dynamics in Manufacturing Plants. Brookings
Papers on Economic Activity, Microeconomics, 187-249.
Baker G, Gibbons, R and Murphy, K. 1999 Informal Authority in Organizations. Journal of Law,
Economics, and Organization, 15(1): 56-73.
Baker G and Hubbard, T. 2004 Contractibility and Asset Ownership: On Board Computers and
Governance in US Trucking. Quarterly Journal of Economics, 119(4): 1443-1479.
Bandiera, O, Barankay, I and Rasul, I 2009 Social Connections and Incentives in the Workplace:
Evidence from Personnel Data. Forthcoming in Econometrica.
Bartel A Ichinowski, C and Shaw, K. 2007 How Does Information Technology Really Affect
Productivity? Plant-Level Comparisons of Product Innovation, Process Improvement and Worker
Skills”, Quarterly Journal of Economics, 122(4): 1721-1758.
38
Bartelsman E and Dhyrmes, P. 1998 Productivity Dynamics U.S. Manufacturing Plants 1972-1986.
Journal of Productivity Analysis, 9(1): 5-33.
Bartelsman E and Doms, M. 2000 Understanding Productivity: Lessons from Longitudinal Microdata.
Journal of Economic Literature, 38(3): 569-594.
Bartelsman E, Haltiwanger, J and Scarpetta, S. 2008 Cross Country Differences in Productivity: The
Role of Allocative Efficiency. University of Maryland mimeo.
Bennedsen, M. Nielson, K. Pérez-Gonzáles, F and Wolfenzon, D. 2007 Inside the Family Firm: The
Role of Families in Succession Decisions and Performance. Quarterly Journal of Economics, 122(2):
647-691.
Bertrand M and Schoar, A. 2006 The Role of Family in Family Firms. Journal of Economic
Perspectives 20(2): 73-96.
Black S and Lynch, L. 2001 How to Compete: The Impact of Workplace Practices and Information
Technology on Productivity. The Review of Economics and Statistics, 83(3): 434–445.
Bloom N, Eifert, B, Mahajan, A, McKenzie, D and Roberts, J. 2009 How Much Does Management
Matter? Stanford mimeo.
Bloom N and Van Reenen, J. 2007 Measuring and Explaining Management Practices Across Firms
and Countries. Quarterly Journal of Economics, 122(4): 1341-1408.

39
Bloom N, Genakos, C, Martin, R and Sadun, R. 2008 Modern Management: Good for the
Environment or Just Hot Air. NBER Working Paper 14394.
Bloom N, Genakos, C, Sadun, R and Van Reenen, J. 2009, “Management Matters”, LSE/Stanford
mimeo.
Bloom N, Kretschmer, T and Van Reenen, J. 2009 “Work-life balance, management practices and
productivity” International Differences in the Business Practice and Productivity of Firms Richard
Freeman and Kathy Shaw (eds), Chicago: University of Chicago Press
Bloom N, Sadun R and Van Reenen, J. 2007 Americans do IT Better: American Multinationals and the
Productivity Miracle. NBER Working Paper 13085
Bloom N, Sadun R and Van Reenen, J. 2009 The Organization of Firms Across Countries. Center for
Economic Performance Discussion Paper No 937
Bloom N, Garicano, L, Sadun R and Van Reenen, J. 2009 The Distinct Effects of Information
Technology and Communication Technology on Firm Organization. Center for Economic
Performance Discussion Paper No. 927
Bloom N, Propper, C, Seiler, S and Van Reenen, J. 2009 Management Practices in Healthcare.
Stanford/LSE mimeo.

40
Bolton P and Dewatripont, M. 1994 The Firm as a Communication Network. Quarterly Journal of
Economics, 109(4): 809-839.
Bresnahan T, Brynjolfsson, E and Hitt, L. 2002 Information Technology, Workplace Organization and
the Demand for Skilled Labor: Firm-level Evidence. Quarterly Journal of Economics, 117(1): 339-
376.
Brynjolffson E and Hitt, L. 2003 Computing Productivity: Firm-Level Evidence. Review of Economics
and Statistics, 85(4): 793–808.
Cappelli P and Neumark, D. 1999 Do ‘High Performance’ Work Practices Improve Establishment-
Level Outcomes? NBER Working Paper 7374.
Caroli E, and Van Reenen, J. 2001 Skill Biased Organizational Change. Quarterly Journal of
Economics, 116(4): 1449-1492.
Caselli F. 2005 Accounting for Cross Country Income Differences in Aghion, P. and Durlauf, S. (eds)
Handbook of Economic Growth. North-Holland: Elsevier.
Chandler A. 1962 Strategy and Structure: Chapters in the History of the Industrial Enterprise.
Cambridge: MIT Press.
Colombo M and Delmastro, M. 2004 Delegation of Authority in Business Organizations: An
Empirical Test. Journal of Industrial Economics, 52(1): 53-80.

41
Corrado, C, Hulten, C and Sichel, D (2006) “Intangible Capital and Economic Growth” NBER
Working Paper No. 11948
Courty P and Marshke, G. 2004 An Empirical Investigation of Gaming Responses to Performance
Incentives. Journal of Labor Economics, 22(1): 23-56.
Criscuolo C, Haskel, J and Martin, R. 2003 Building the Evidence Base for Productivity Policy Using
Business Data Linking. Economic Trends 600: 39-51.
Di Nardo, J and Lee, D 2004 Economic impacts of new unionization on private sector employers:
1984–2001, Quarterly Journal of Economics 119: 1383–1441.
Foster L, Krizan, C and Haltiwanger, J. 2006 Market Selection, Reallocation and Restructuring in the
U.S. Retail Trade Sector in the 1990s. Review of Economics and Statistics, 88(4): 748-758.
Foster L, Haltiwanger, J and Syverson, C. 2009 Reallocation, Firm Turnover and Efficiency: Selection
on Productivity or Profitability. American Economic Review, 98(1): 394-425.
Freeman, R and Kleiner, M. 2005 The Last American Shoe Manufacturers: Decreasing Productivity
and Increasing Profits in the Shift from Piece Rates to Continuous Flow Production. Journal of
Industrial Relations 44(2): 307-330.
Freeman, R and Medoff, J. 1984 What Do Unions Do? New York: Basic Books

42
Garicano L. 2000 Hierarchies and the Organization of Knowledge in Production. Journal of Political
Economy, 108(5): 874-904.
Garicano L. and Rossi-Hansberg 2006 Organization and Inequality in a Knowledge Economy.
Quarterly Journal of Economics, 121(4): 1383-1435.
Gibbons R and Roberts, J. 2008 The Handbook of Organizational Economics. Princeton: Princeton
University Press.
Gibrat R. 1931 Les Inegalites Economiques, Sirey, Paris.
Greif, A (1994) Cultural beliefs and the Organization of Society: A Historical and Theoretical
Reflection on Collectivist and Individualistic societies. Journal of Political Economy, 102(5), 912-50
Griffith, R. and Neely, A. 2009 Incentives and managerial experience in multi-task teams: evidence
from within a firm Journal of Labor Economics, 27(1): 49-82
Griliches Z. 1996 The Discovery of the Residual: A Historical Note. Journal of Economic Literature,
34(3): 1324-1330.
Guadalupe M and Wulf, J. 2007 The Flattening Firm and Product Market Competition: The Effects of
Trade Costs and Liberalization. Columbia University mimeo.
Guiso L, Sapienza, P and Zingales, L. 2006 Does Culture Affect Economic Outcomes? The Journal of
Economic Perspectives, 20(2): 23-48.

43
Guiso L, Sapienza, P and Zingales, L. 2009 Cultural Biases in Economic Exchange. Forthcoming in
Quarterly Journal of Economics.
Hall, B (2003) Innovation and Diffusion in Fagerberg, Jan, Mowery, Davis and Nelson, Richard (eds.),
Handbook of Innovation, Oxford: Oxford University Press
Helpman E, Melitz, M and Yeaple, S. 2004 Export Versus FDI with Heterogeneous Firms. American
Economic Review, 94(1): 300-316.
Hopenhayn H. 1992 Entry, Exit, and Firm Dynamics in Long Run Equilibrium. Econometrica,
60:1127–1150.
Hsieh C-T and Klenow, P. 2009, Misallocation and Manufacturing TFP in China and India,
forthcoming Quarterly Journal of Economics.
Jorgenson D, Mun H, and Stiroh, K. 2008 A Retrospective Look at the US Productivity Growth
Resurgence. Journal of Economic Perspectives, 22(1): 3-24.
Kaldor N 1934 The Equilibrium of the Firm, Economic Journal, 44 (173) 60-76
Klette, T and Griliches, Z (1996) The inconsistency of Common Scale estimators when output prices
are unobserved and endogenous, Journal of Applied Econometrics, 11, 343-361.
Knack S and Keefer, P. 1997 Does Social Capital have an Economy Payoff? A Cross-country
Investigation. Quarterly Journal of Economics 12(4): 1251-1288.

44
Kwoka J and Ravenscraft, D. 1986 Cooperation Versus Rivalry: Price-Cost Margins by Line of
Business. Economica, 53: 351-64.
La Porta R, Lopez-de-Silanes, F, Shleifer, A and Vishny, R. 1997 Trust in Large Organizations.
American Economic Review, 87(2): 333-338.
Laeven, L and Woodruff, P. 2007 The Quality of the Legal System, Firm Ownership, and Firm Size,
Review of Economics and Statistics, 89(4), 601-614.
Lazear E and Oyer, P. 2009 Personnel Economics in Gibbons, E and Roberts, D J (eds) Handbook of
Organizational Economics. Princeton: Princeton University Press.
Lazear E. 2000 Performance Pay and Productivity American Economic Review 90(5): 1346-1361.
Lev B and Radhakrishnan, S. 2004 The Valuation of Organization Capital. NYU Stern School of
Business Working Paper.
Lucas R E Jr. 1978 On the Size Distribution of Business Firms, Bell Journal of Economics, 9: 508-
523.
Marin D and Verdier, T. 2008 Corporate Hierarchies and the Size of Nations: Theory and Evidence.
Paris School of Economics mimeo.
Melitz M. 2003 The Impact of Trade on Intra-Industry Reallocations and Aggregate Industry
Productivity. Econometrica, 71(6): 1695-1725.

45
Milgrom P and Roberts, J. 1990 The Economics of Modern Manufacturing: Technology, Strategy, and
Organization. American Economic Review, 80(3), 511–28.
Mookherjee D. 2006 Decentralization, Hierarchies and Incentives: A Mechanism Design Approach.
Journal of Economic Literature, 44(2): 367-390.
Mundlak Y. 1961 Empirical Production Function Free of Management Bias. Journal of Farm
Economics 43: 44–56.
Nickell S, Nicolistsas, D and Patterson, M. 2001 Does Doing Badly Encourage Innovation? Oxford
Bulletin of Economics and Statistics, 63(1): 5-28.
Olley S and Pakes, A. 1996 The Dynamics of Productivity in the Telecommunications Equipment
Industry. Econometrica 64(6): 1263–1298.
Oyer P. 1998 Fiscal Year Ends and Nonlinear Incentive Contracts: The Effect on Business Seasonality.
Quarterly Journal of Economics, 113(1): 149-185
Pavcnik N. 2002 Trade Liberalization, Exit, and Productivity Improvement: Evidence From Chilean
Plants. Review of Economic Studies 69:245–276.
Penrose E T. 1959 Theory of the Growth of the Firm. New York: J. Wiley & Sons.

46
Pérez-Gonzáles F. 2006 Inherited Control and Firm Performance. American Economic Review, 96(5):
1559–1588.
Prendergast C. 2002 The Tenuous Trade-Off between Risk and Incentives. Journal of Political
Economy, 110(5): 1071-102.
Prescott E C and Visscher, M. 1980 Organization Capital. Journal of Political Economy, 88(3): 446—
461.
Putnam R. 1993 Making Democracy Work: Civic Traditions in Modern Italy. Princeton NJ: Princeton
University Press.
Radner R. 1993 The Organization of Decentralized Information Processing. Econometrica, 61(5):
1109-1146.
Rajan R and Zingales, L. 2001 The Firm as a Dedicated Hierarchy: A Theory of the Origin and
Growth of Firms. Quarterly Journal of Economics, 116(3): 805-851.
Rajan R and Wulf, J. 2006 The Flattening Firm: Evidence from Panel Data on the Changing Nature of
Corporate Hierarchies. Review of Economics and Statistics, 88(4): 759-773.
Salter W G. 1960 Productivity and Technical Change. Cambridge: Cambridge University Press.
Shearer B 2004 Piece Rates, Fixed Wages and Incentives: Evidence from a Field Experiment. Review
of Economic Studies, 71(2): 513-534.

47
Stiroh K. 2004 Reassessing the Role of IT in the Production Function: A Meta Analysis. Federal
Reserve Bank of New York mimeo.
Syverson C. 2004a Product Substitutability and Productivity Dispersion. Review of Economics and
Statistics 86(2): 534-550.
Syverson C. 2004b “Market Structure and productivity: A concrete Example” Journal of Political
Economy, 112 (6): 1181-1222
Thesmar D and Thoenig, M. 1999 From Flexibility to Insecurity: How Vertical Separation Amplifies
Firm-level Uncertainty. Journal of the European Economic Association 5(6): 1161-1202.
Thesmar D and Thoenig, M. 2000 Creative Destruction and Organization Change. The Quarterly
Journal of Economics, 115(4): 1201-1237.
Van Biesebroeck, J. 2007 “Complementarities in automobile production”. Journal of Applied
Econometrics 22: 1315-1345
Woodward J. 1958 Management and Technology, Cambridge: Cambridge University Press.

48
TABLE 1: MANAGEMENT PRACTICE INTERVIEW GUIDE AND EXAMPLE RESPONSES FOR FOUR OF THE EIGHTEEN PRACTICES Any score from 1 to 5 can be given, but the scoring guide and examples are only provided for scores of 1, 3 and 5. Multiple questions are used for each dimension to improve scoring accuracy.
Practice 3: Process problem documentation (Operations)
Score 1 Score 3 Score 5 Scoring grid: No, process improvements are made when
problems occur. Improvements are made in weekly workshops involving all staff, to improve performance in their area of the plant
Exposing problems in a structured way is integral to individuals’ responsibilities and resolution occurs as a part of normal business processes rather than by extraordinary effort/teams
Examples: A U.S. firm has no formal or informal mechanism in place for either process documentation or improvement. The manager admitted that production takes place in an environment where nothing has been done to encourage or support process innovation.
A U.S. firm takes suggestions via an anonymous box, they then review these each week in their section meeting and decide any that they would like to proceed with.
The employees of a German firm constantly analyse the production process as part of their normal duty. They film critical production steps to analyse areas more thoroughly. Every problem is registered in a special database that monitors critical processes and each issue must be reviewed and signed off by a manager.
Practice 4: Performance tracking (Monitoring)
Score 1 Score 3 Score 5 Scoring grid: Measures tracked do not indicate directly if
overall business objectives are being met. Tracking is an ad-hoc process (certain processes aren’t tracked at all)
Most key performance indicators are tracked formally. Tracking is overseen by senior management.
Performance is continuously tracked and communicated, both formally and informally, to all staff using a range of visual management tools.
Examples: A manager of a U.S. firm tracks a range of measures when he does not think that output is sufficient. He last requested these reports about 8 months ago and had them printed for a week until output increased again. Then he stopped and has not requested anything since.
At a U.S. firm every product is bar-coded and performance indicators are tracked throughout the production process; however, this information is not communicated to workers
A U.S. firm has screens in view of every line. These screens are used to display progress to daily target and other performance indicators. The manager meets with the shop floor every morning to discuss the day past and the one ahead and uses monthly company meetings to present a larger view of the goals to date and strategic direction of the business to employees. He even stamps napkins with key performance achievements to ensure everyone is aware of a target that has been hit.
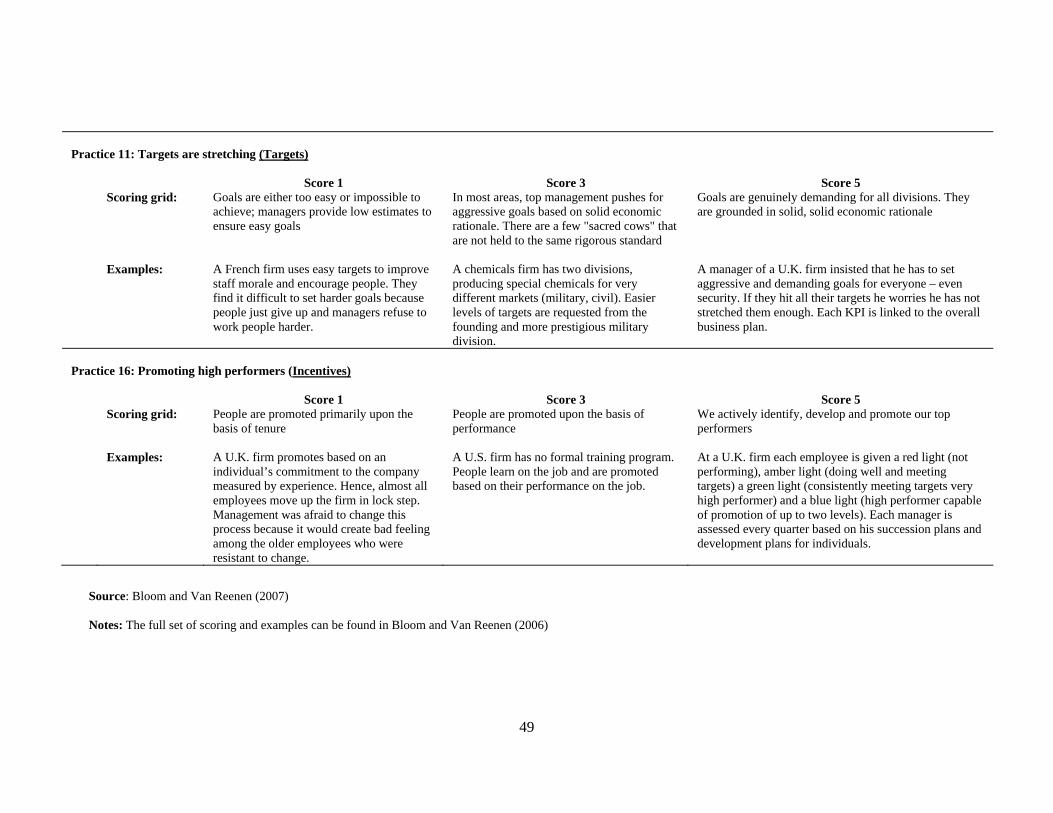
49
Practice 11: Targets are stretching (Targets)
Score 1 Score 3 Score 5 Scoring grid: Goals are either too easy or impossible to
achieve; managers provide low estimates to ensure easy goals
In most areas, top management pushes for aggressive goals based on solid economic rationale. There are a few "sacred cows" that are not held to the same rigorous standard
Goals are genuinely demanding for all divisions. They are grounded in solid, solid economic rationale
Examples: A French firm uses easy targets to improve staff morale and encourage people. They find it difficult to set harder goals because people just give up and managers refuse to work people harder.
A chemicals firm has two divisions, producing special chemicals for very different markets (military, civil). Easier levels of targets are requested from the founding and more prestigious military division.
A manager of a U.K. firm insisted that he has to set aggressive and demanding goals for everyone – even security. If they hit all their targets he worries he has not stretched them enough. Each KPI is linked to the overall business plan.
Practice 16: Promoting high performers (Incentives)
Score 1 Score 3 Score 5 Scoring grid: People are promoted primarily upon the
basis of tenure People are promoted upon the basis of performance
We actively identify, develop and promote our top performers
Examples: A U.K. firm promotes based on an individual’s commitment to the company measured by experience. Hence, almost all employees move up the firm in lock step. Management was afraid to change this process because it would create bad feeling among the older employees who were resistant to change.
A U.S. firm has no formal training program. People learn on the job and are promoted based on their performance on the job.
At a U.K. firm each employee is given a red light (not performing), amber light (doing well and meeting targets) a green light (consistently meeting targets very high performer) and a blue light (high performer capable of promotion of up to two levels). Each manager is assessed every quarter based on his succession plans and development plans for individuals.
Source: Bloom and Van Reenen (2007) Notes: The full set of scoring and examples can be found in Bloom and Van Reenen (2006)
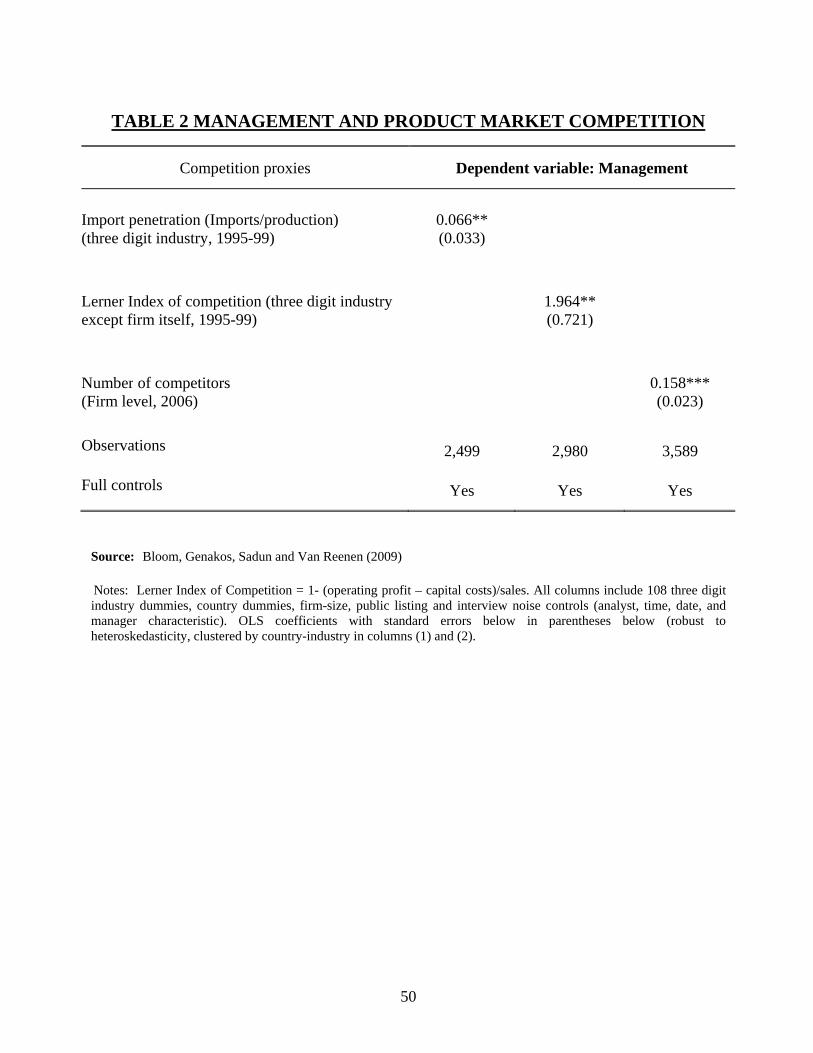
50
TABLE 2 MANAGEMENT AND PRODUCT MARKET COMPETITION
Competition proxies Dependent variable: Management
Import penetration (Imports/production) (three digit industry, 1995-99)
0.066** (0.033)
Lerner Index of competition (three digit industry except firm itself, 1995-99) 1.964**
(0.721)
Number of competitors (Firm level, 2006) 0.158***
(0.023)
Observations 2,499 2,980 3,589
Full controls Yes Yes Yes
Source: Bloom, Genakos, Sadun and Van Reenen (2009) Notes: Lerner Index of Competition = 1- (operating profit – capital costs)/sales. All columns include 108 three digit industry dummies, country dummies, firm-size, public listing and interview noise controls (analyst, time, date, and manager characteristic). OLS coefficients with standard errors below in parentheses below (robust to heteroskedasticity, clustered by country-industry in columns (1) and (2).

51
TABLE 3: DETAILS OF THE DECENTRALIZATION SURVEY QUESTIONS
For Questions D1, D3 and D4 any score can be given, but the scoring guide is only provided for scores of 1, 3 and 5.Question D1: “To hire a FULL-TIME PERMANENT SHOPFLOOR worker what agreement would your plant need from CHQ (Central Headquarters)?” Probe until you can accurately score the question – for example if they say “It is my decision, but I need sign-off from corporate HQ.” ask “How often would sign-off be given?” Score 1 Score 3 Score 5 Scoring
grid: No authority – even for replacement hires
Requires sign-off from CHQ based on the business case. Typically agreed (i.e. about 80% or 90% of the time).
Complete authority – it is my decision entirely
Question D2: “What is the largest CAPITAL INVESTMENT your plant could make without prior authorization from CHQ?” Notes: (a) Ignore form-filling (b) Please cross check any zero response by asking “What about buying a new computer – would that be possible?”, and then probe…. (c) Challenge any very large numbers (e.g. >$¼m in US) by asking “To confirm your plant could spend $X on a new piece of equipment without prior clearance from CHQ?” (d) Use the national currency and do not omit zeros (i.e. for a US firm twenty thousand dollars would be 20000). Question D3: “Where are decisions taken on new product introductions – at the plant, at the CHQ or both”? Probe until you can accurately score the question – for example if they say “It is complex, we both play a role “ask “Could you talk me through the process for a recent product innovation?” Score 1 Score 3 Score 5 Scoring
grid: All new product introduction decisions are taken at the CHQ
New product introductions are jointly determined by the plant and CHQ
All new product introduction decisions taken at the plant level
Question D4: “How much of sales and marketing is carried out at the plant level (rather than at the CHQ)”? Probe until you can accurately score the question. Also take an average score for sales and marketing if they are taken at different levels. Score 1 Score 3 Score 5 Scoring
grid: None – sales and marketing is all run by CHQ
Sales and marketing decisions are split between the plant and CHQ
The plant runs all sales and marketing
Question D5: “Is the CHQ on the site being interviewed”? Question D6: “How much do managers decide how tasks are allocated across workers in their teams” Interviewers are read out the following five options, with our scoring for these note above:
Score 1 Score 2 Score 3 Score 4 Score 5 All managers
Mostly managers
About equal Mostly workers
All workers
Question D7: “Who decides the pace of work on the shopfloor” Interviewers are read out the following five options, with “customer demand” an additional not read-out option
Score 1 Score 2 Score 3 Score 4 Score 5 All managers
Mostly managers
About equal Mostly workers
All workers
Source: Bloom, Garicano, Sadun and Van Reenen (2009) Notes: The electronic survey, training materials and survey video footage are available on http://cep.lse.ac.uk/management/default.asp

52
TABLE 4: DECENTRALIZATION
Dependent variable: Decentralization
(1) (2) (3) (4) (5)
Ln(Firm 0.052** 0.075*** 0.053** 0.050** employment) (0.022) (0.028) (0.022) (0.021) Plant employment 0.089*** 0.129*** 0.090*** 0.088*** Plant employees as a % of firm (0.030) (0.027) (0.026) (0.024)
Foreign Multinational 0.157*** 0.187*** 0.150*** 0.161*** Dummy=1 if firm belongs to a foreign multinational
(0.058) (0.054) (0.047) (0.047)
Dom. Multinational 0.018 0.043 0.018 0.022 Firm belongs to a domestic multinational
(0.040) (0.063) (0.053) (0.049)
Plant Skills 0.085*** 0.077*** 0.084*** 0.085*** % Plant employees with a College degree
(0.015) (0.019) (0.018) (0.018)
Import Penetration 0.156** (3 years lagged) (0.071) 1- Lerner index 2.937*** (3 years lagged) (1.056) No. Competitors 0.099*** (0=none, 1=between 1 and 4, 2=more than 4)
(0.038)
Trust 0.699** 1.103** 0.719** 0.815** 0.857*** Trust measured in firm's region of location
(0.317) (0.469) (0.346) (0.343) (0.303)
Rule of Law (country) 0.515*** (-2.5=low, 2.5=high) (0.125) Hierarchical Religion -0.344 -0.490** -0.514** % of Catholics, Muslims and Orthodox in firm's region of location
(0.220) (0.200) (0.213)
Observations 3,660 2,508 3,660 3,600 3,660 Regional controls (2) yes yes yes yes no Industry dummies (112) yes yes yes yes no Country dummies (12) yes yes yes yes no Other controls (60) yes yes yes yes no Source: Bloom, Sadun and Van Reenen (2009a) Notes: * significant at 10%; ** significant at 5%; *** significant at 1%. The dependent variable is the decentralization z-score index, measured by plant manager’s autonomy over hiring, investment, products and pricing. Estimation by OLS with robust standard errors in parentheses. Standard errors clustered by the firm's region of location. TRUST measures the percentage of individuals who agreed with the statement “most people can be trusted” in the firm's region of location. RULE OF LAW measures the extent to which agents have confidence in and abide by the rules of society, and in particular the quality of contract enforcement, the police, and the courts, as well as the likelihood of crime and violence. The index is compiled by the World Bank and ranges between -2.5 and 2.5. “Other controls” include regional GDP per capita, population in the region, a dummy for whether the firm is publicly listed, a dummy for whether the CEO is on the same site as the plant (“CEO onsite”) and “Noise controls” (these include 44 interviewer dummies, 6 dummies to control for the day of the week the interview took place, an interview reliability score, the manager’s seniority and tenure, the duration of the interview, and 4 dummies for missing values in seniority, tenure, duration and reliability). Country controls are GDP per capita and population. Regressions weighted by the share of World Values Survey respondents in the region in the country.

Figure 1: Management Scores and Productivity
020
ge fi
rm in
00
h th
e av
erag
and
year
0-2
0
er g
ap w
ithin
dust
ry a
-40
per
wor
kem
e co
untr
y,
-60
% s
ales
the
sam
Management score bins, from 1 (worst practice) to 5 (best practice)Note: Average across 3,803 firms in 13 countries. Revenue productivity=sales/employee. Cells show deviations from country, industry and year mean. e.g., the left column shows that firms with a management score of 1 to 1.5 have on average 50% lower revenue productivity than other firms in the same country, industry (grouped by 154 3 digit manufacturing cell) and year (2000 to 2008).

# firms
FIGURE 2: MANAGEMENT PRACTICES ACROSS COUNTRIES (Average Country Management Score)
USGermanySweden
J
# firms695336270122Japan
CanadaFrance
Italy
122344312188
Great BritainAustralia
Northern IrelandPoland
76238292231
Republic of IrelandPortugal
BrazilIndia
231102140620559
2 6 2 8 3 3 2 3 4
IndiaChina
Greece524171620
2.6 2.8 3 3.2 3.4Management scores, from 1 (worst practice) to 5 (best practice)
Note: Averages taken across all firms within each country. 5,850 observations in total. Source: Bloom, Genakos, Sadun and Van Reenen (2009)

FIGURE 3: MANAGEMENT SCORES ACROSS FIRMS: TAILS DRIVES DIFFERENCES ACROSS COUNTRIES
51
Australia Brazil Canada China
0.5
1
France Germany Great Britain Greece
0.5
India Ireland Italy Japanensi
ty0
.51D
e.5
1
Poland Portugal Sweden US
0
1 2 3 4 5 1 2 3 4 5 1 2 3 4 5 1 2 3 4 5
Source: Bloom, Genakos, Sadun and Van Reenen (2009)

FIGURE 4: OWNERSHIP AND MANAGEMENT SCORESDistribution of firm management scores by ownership. Overlaid dashed line is the kernel density for dispersed shareholders, the most common US ownership type
1
Dispersed Shareholders Family, external CEO Family, family CEO
0.5
.51
Founder Government Managers
0
Other Private Equity Private Individuals
0.5
10
1 2 3 4 5 1 2 3 4 5 1 2 3 4 5
Source: Bloom, Genakos, Sadun and Van Reenen (2009)

G
FIGURE 5: DECENTRALIZATION ACROSS COUNTRIES
Most centralized
India
Japan
Greece Most centralized• Asia• Southern Europe
Poland
China
India • Southern EuropeLeast centralized• Scandinavian countries
Portugal
France• Scandinavian countries • Anglo-Saxon countries
UK
Germany
Italy
Sweden
US
UK
-.5 0 .5Source: Bloom, Sadun and Van Reenen (2009a)

FIGURE 6, Panel A
6Source: Acemoglu, Aghion, Lelarge, Van Reenen and Zilibotti (2007

FIGURE 6, Panel B
7Source: Acemoglu, Aghion, Lelarge, Van Reenen and Zilibotti (2007

FIGURE 6, Panel C
8Source: Acemoglu, Aghion, Lelarge, Van Reenen and Zilibotti (2007