Embed Size (px)
Citation preview
REVIEW
Recent Advances in Physicochemical and ADMET Profiling in DrugDiscovery
by Jianling Wang* and Suzanne Skolnik
ADME Profiling Cambridge, Metabolism and Pharmacokinetics, Novartis Institute for BiomedicalResearch, 250 Mass Ave, Cambridge, MA 02139, USA
(phone: 0016178717140; fax: 0016178717061; e-mail: [email protected])
The drastic increase in the cost for discovering and developing a new drug along with the highattrition rate of development candidates led to shifting drug-discovery strategy to parallel assessment ofcomprehensive drug physicochemical, and absorption, distribution, metabolism, excretion, and toxicity(ADMET) properties alongside efficacy. With the proposal of a profiling paradigm and utilization ofintegrated risk assessment, one can exponentially enhance the predictive power of in vitro tools by takinginto consideration the interplay among profiling parameters. In particular, this article will review recentadvances in accurate assessment of solubility and other physicochemical parameters. The properinterpretation of these experimental data is crucial for rapid and meaningful risk assessment and rationaloptimization of drug candidates in drug discovery. The impact of these tools on assisting drug-discoveryteams in establishing in vitro– in vivo correlation (IVIVC) as well as structure–property relationship(SPR) will be presented.
Abbreviations
ADMET: Absorption, distribution, metabolism, excretion, and toxicity; CE: capillary electrophoresis;FaSSIF: fasted-state simulated intestinal fluid; FeSSIF: fed-state simulated intestinal fluid; GI:gastrointestinal; HT: high throughput; IAM: immobilized artificial membrane; IVIVC: in vitro– in vivocorrelation; MEEK: microemulsion electrokinetic chromatography; NCE: new chemical entity; PSA:polar surface area; PD: pharmacodynamic(s); PK: pharmacokinetic(s); SGA: spectral gradientanalyzer; SGF: simulated gastric fluid; SIF: simulated intestinal fluid; SPR: structure–propertyrelationship.
1. Introduction. – Recently, the chemical space of new therapeutic targets for unmetmedical needs or for alternative pathways has shifted the molecular properties of NCEstowards higher molecular weight, greater lipophilicity, and more promiscuity againstmetabolic enzymes and other non-therapeutic targets [1] [2]. These have posed greatchallenges in drug discovery and promoted parallel assessment of efficacy andcomprehensive ADMET properties of NCEs in drug discovery to optimize propertiesand foresee liabilities of drug candidates [3 – 5]. Multiple in silico, in vitro, and in vivoADMET filters are being developed and implemented in various stages of the drugdiscovery and development process to alert chemists of potential ADMET issues in theclinic [6– 9]. While computational approaches have advantages in cost-saving and nosample requirement [10 – 13], in vitro ADMET assays offer the first experimental tools
CHEMISTRY & BIODIVERSITY – Vol. 6 (2009) 1887
� 2009 Verlag Helvetica Chimica Acta AG, Z�rich
to rank and prioritize NCEs, as well as to tackle the mechanistic pathway in the earlydiscovery phase.
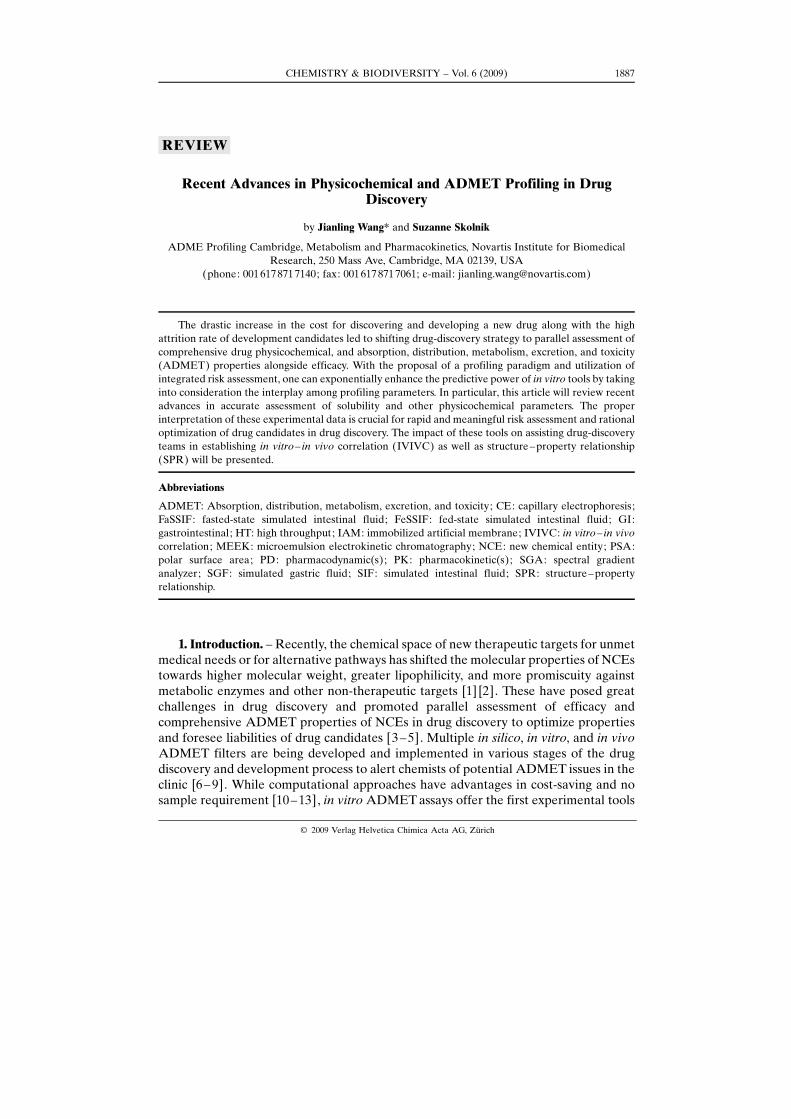
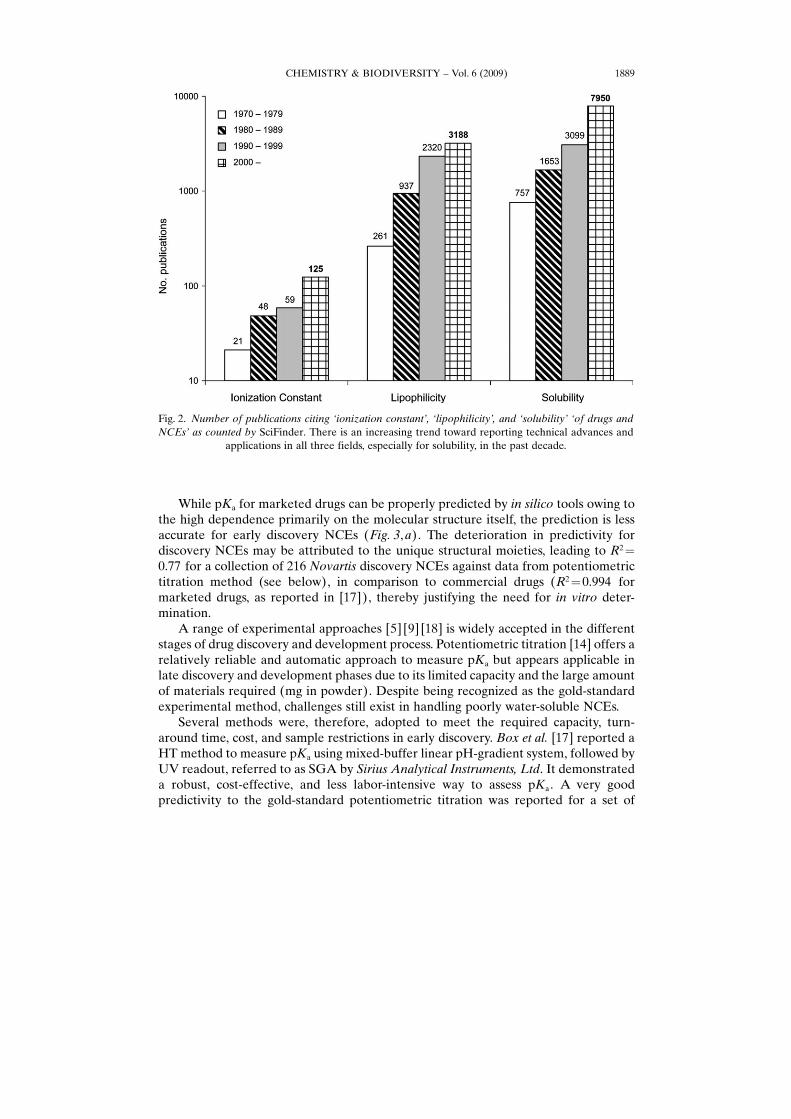
It is widely accepted that ionization constant, lipophilicity, and solubility are amongthe key physicochemical parameters critical for the predictability of drug bioavail-ability, and significantly affect drug�s behaviors in many PK, PD, and toxicologicalaspects (Fig. 1). As a result, there are drastically growing interests from both industryand academia in investigating the computational and experimental approaches toaccurately assess these properties and explore their impact on the discovery anddevelopment of new drugs (Fig. 2). The current report briefly reviews the experimentalapproaches to assess these parameters in drug-discovery phases in conjunction withselected in silico tools, with advantages and limitations outlined for the benefit of users.In addition, case studies are presented to demonstrate the impact of these parameterson PK, PD, and safety concerns of NCEs.
2. Physicochemical Parameters. – 2.1. Ionization constant (pKa). Ionizationconstant, pKa, is a useful thermodynamic parameter to modulate the charge stateand eventually solubility, permeability, and other key properties of drug candidates.Therefore, accurate assessment of pKa and ionization process of NCEs allows forproperly interpreting and predicting ADME properties due to the pH gradient of 1.0–7.0 from human stomach to GI tract [14]. In addition, pKa information is useful forestablishment of therapeutic SAR for complementary charged sites in drug discovery.Computationally or experimentally derived pKa data are also required in thedetermination of solubility – pH profiling [15], lipophilicity [16], and other drugproperties.
Fig. 1. Schematic presentation of the relationship and interplay of physicochemical properties with in vivodrug pharmacokinetics/pharmacodynamics and exposure
CHEMISTRY & BIODIVERSITY – Vol. 6 (2009)1888
While pKa for marketed drugs can be properly predicted by in silico tools owing tothe high dependence primarily on the molecular structure itself, the prediction is lessaccurate for early discovery NCEs (Fig. 3, a). The deterioration in predictivity fordiscovery NCEs may be attributed to the unique structural moieties, leading to R2¼0.77 for a collection of 216 Novartis discovery NCEs against data from potentiometrictitration method (see below), in comparison to commercial drugs (R2¼0.994 formarketed drugs, as reported in [17]), thereby justifying the need for in vitro deter-mination.
A range of experimental approaches [5] [9] [18] is widely accepted in the differentstages of drug discovery and development process. Potentiometric titration [14] offers arelatively reliable and automatic approach to measure pKa but appears applicable inlate discovery and development phases due to its limited capacity and the large amountof materials required (mg in powder). Despite being recognized as the gold-standardexperimental method, challenges still exist in handling poorly water-soluble NCEs.
Several methods were, therefore, adopted to meet the required capacity, turn-around time, cost, and sample restrictions in early discovery. Box et al. [17] reported aHT method to measure pKa using mixed-buffer linear pH-gradient system, followed byUV readout, referred to as SGA by Sirius Analytical Instruments, Ltd. It demonstrateda robust, cost-effective, and less labor-intensive way to assess pKa. A very goodpredictivity to the gold-standard potentiometric titration was reported for a set of
CHEMISTRY & BIODIVERSITY – Vol. 6 (2009) 1889
Fig. 2. Number of publications citing �ionization constant�, �lipophilicity�, and �solubility� �of drugs andNCEs� as counted by SciFinder. There is an increasing trend toward reporting technical advances and
applications in all three fields, especially for solubility, in the past decade.
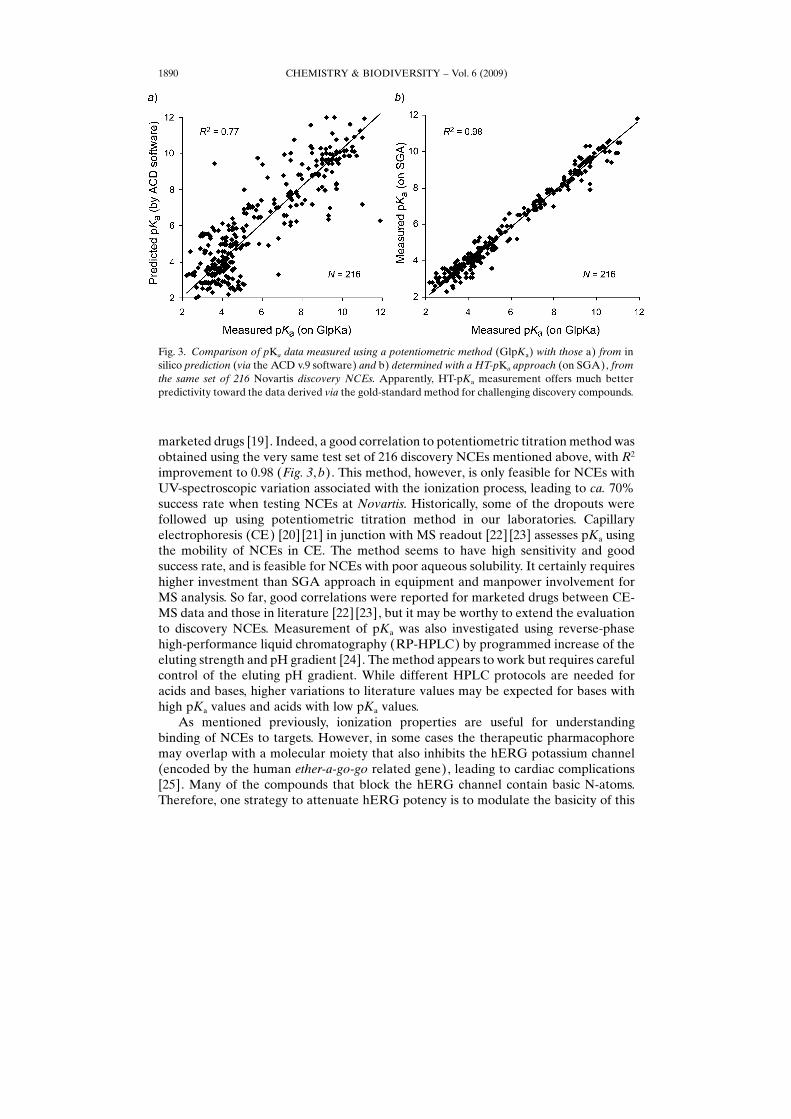
marketed drugs [19]. Indeed, a good correlation to potentiometric titration method wasobtained using the very same test set of 216 discovery NCEs mentioned above, with R2
improvement to 0.98 (Fig. 3, b). This method, however, is only feasible for NCEs withUV-spectroscopic variation associated with the ionization process, leading to ca. 70%success rate when testing NCEs at Novartis. Historically, some of the dropouts werefollowed up using potentiometric titration method in our laboratories. Capillaryelectrophoresis (CE) [20] [21] in junction with MS readout [22] [23] assesses pKa usingthe mobility of NCEs in CE. The method seems to have high sensitivity and goodsuccess rate, and is feasible for NCEs with poor aqueous solubility. It certainly requireshigher investment than SGA approach in equipment and manpower involvement forMS analysis. So far, good correlations were reported for marketed drugs between CE-MS data and those in literature [22] [23], but it may be worthy to extend the evaluationto discovery NCEs. Measurement of pKa was also investigated using reverse-phasehigh-performance liquid chromatography (RP-HPLC) by programmed increase of theeluting strength and pH gradient [24]. The method appears to work but requires carefulcontrol of the eluting pH gradient. While different HPLC protocols are needed foracids and bases, higher variations to literature values may be expected for bases withhigh pKa values and acids with low pKa values.
As mentioned previously, ionization properties are useful for understandingbinding of NCEs to targets. However, in some cases the therapeutic pharmacophoremay overlap with a molecular moiety that also inhibits the hERG potassium channel(encoded by the human ether-a-go-go related gene), leading to cardiac complications[25]. Many of the compounds that block the hERG channel contain basic N-atoms.Therefore, one strategy to attenuate hERG potency is to modulate the basicity of this
CHEMISTRY & BIODIVERSITY – Vol. 6 (2009)1890
Fig. 3. Comparison of pKa data measured using a potentiometric method (GlpKa) with those a) from insilico prediction (via the ACD v.9 software) and b) determined with a HT-pKa approach (on SGA), fromthe same set of 216 Novartis discovery NCEs. Apparently, HT-pKa measurement offers much betterpredictivity toward the data derived via the gold-standard method for challenging discovery compounds.
moiety. While correlations are expected to be weak for a large set of diversecompounds, a strategy to modulate pKa may be more successful on a specific scaffold orseries (reviewed in [26]). It should be noted that other factors such as lipophilicity areimportant in modulating hERG inhibition [27], as exemplified in the next section.
2.2. Lipophilicity (log P/D). Lipophilicity is a determinant to quantitativelydescribe a NCE�s ability to partition in the oily phase or biological membranes. It isalso frequently utilized in explaining behavior of some NCEs in the ADMET assays.Practically it is expressed as the logarithms of partition coefficient or distributioncoefficient (log P or log D) of NCEs in a lipophilic phase (e.g., octan-1-ol) and aqueousphase. Frequently, project teams are developing lipophilicity-modulated SAR, as somepharmacologic or biologic activity often correlates with log P of NCEs. As one of thekey parameters outlined in �Rule of Five� [28], lipophilicity greatly affects solubility,permeability, and other drug properties. From formulation perspective, it is difficult toformulate NCEs with low distribution coefficient (log D) at physiological pH.
The conventional gold-standard approach to quantify the log P or log D values wasreferred to as the shake-flask method, which is very time-consuming and labor-intensive, thereby not feasible in early discovery [29]. Meanwhile, the dual-phasepotentiometric titration approach is widely accepted as gold-standard method in drugdiscovery and development phases [14]. Using this approach, however, the quality oflog P data will rely greatly on the accurately determined pKa values, and, therefore,requires an ionization center. In addition, this method, albeit automated, has limitedcapacity and is, therefore, not conceivable for HT approaches in early discovery. Itshould be mentioned that precaution may be taken to handle NCEs with highlipophilicity and low aqueous solubility to avoid overestimated log P caused by the shiftin the Bjerrum plot as a result of precipitation instead of partitioning.
An alternative approach using HPLC, known as eLogP, was reported for thedetermination of log P for both neutral and ionizable NCEs [30]. With octan-1-ol as aco-eluent, log P values can be extracted using a capacity factor, without requiring anionizable group. Excellent correlations to gold-standard methods were reported bydifferent groups on marketed drugs [30] [31]. In addition, the eLogP method showshigh sensitivity for log P determination and is applicable to low-soluble compounds.Attention may be paid to the potential interference of octan-1-ol to the elution processand retention time. There was an attempt to miniaturize the traditional shake-flaskmethod in 96-well plate in conjunction with RP-HPLC readout for log D determination[32]. While a reasonable correlation was reported using marketed drugs, the methodhas challenges in dealing with NCEs with poor aqueous solubility and extremely highlog P. Microemulsion electrokinetic chromatography in combination with CE(MEEKC-CE) has been adopted for measuring log P in discovery, and its qualityrelies on the proper selection of microemulsion materials [33]. By using sodiumdodecyl sulfate for microemulsion, Jia et al. [34] reported a good correlation of theMEEKC-CE log P values to literature data from 13 marketed drugs. However, thecorrelation deteriorated when applied to discovery NCEs. While this method showsgood sensitivity for log P measurement and is also applicable to low-soluble NCEs, itmay be problematic for NCEs with high log P values (e.g. �5, where in MEEKCseparation from the micelle marker is difficult to resolve) or high pKa values (e.g. �10,where some basic NCEs do not fully partition as a result of partially charged state) [34].
CHEMISTRY & BIODIVERSITY – Vol. 6 (2009) 1891
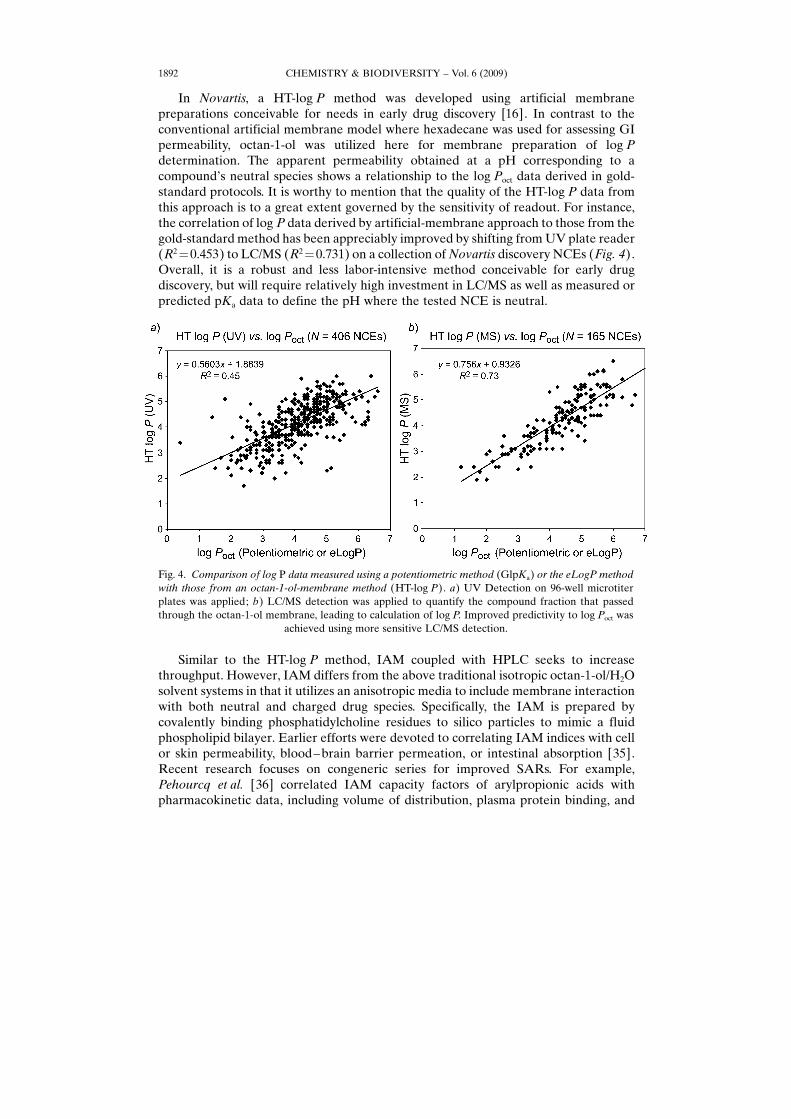
In Novartis, a HT-log P method was developed using artificial membranepreparations conceivable for needs in early drug discovery [16]. In contrast to theconventional artificial membrane model where hexadecane was used for assessing GIpermeability, octan-1-ol was utilized here for membrane preparation of log Pdetermination. The apparent permeability obtained at a pH corresponding to acompound�s neutral species shows a relationship to the log Poct data derived in gold-standard protocols. It is worthy to mention that the quality of the HT-log P data fromthis approach is to a great extent governed by the sensitivity of readout. For instance,the correlation of log P data derived by artificial-membrane approach to those from thegold-standard method has been appreciably improved by shifting from UV plate reader(R2¼0.453) to LC/MS (R2¼0.731) on a collection of Novartis discovery NCEs (Fig. 4).Overall, it is a robust and less labor-intensive method conceivable for early drugdiscovery, but will require relatively high investment in LC/MS as well as measured orpredicted pKa data to define the pH where the tested NCE is neutral.
Similar to the HT-log P method, IAM coupled with HPLC seeks to increasethroughput. However, IAM differs from the above traditional isotropic octan-1-ol/H2Osolvent systems in that it utilizes an anisotropic media to include membrane interactionwith both neutral and charged drug species. Specifically, the IAM is prepared bycovalently binding phosphatidylcholine residues to silico particles to mimic a fluidphospholipid bilayer. Earlier efforts were devoted to correlating IAM indices with cellor skin permeability, blood– brain barrier permeation, or intestinal absorption [35].Recent research focuses on congeneric series for improved SARs. For example,Pehourcq et al. [36] correlated IAM capacity factors of arylpropionic acids withpharmacokinetic data, including volume of distribution, plasma protein binding, and
Fig. 4. Comparison of log P data measured using a potentiometric method (GlpKa) or the eLogP methodwith those from an octan-1-ol-membrane method (HT-log P). a) UV Detection on 96-well microtiterplates was applied; b) LC/MS detection was applied to quantify the compound fraction that passedthrough the octan-1-ol membrane, leading to calculation of log P. Improved predictivity to log Poct was
achieved using more sensitive LC/MS detection.
CHEMISTRY & BIODIVERSITY – Vol. 6 (2009)1892
half-life (correlation coefficient 0.8 –0.9). The authors found that IAM retention was infact correlated to log P/log D 7.4 results, while this is not always the case depending onthe degree of protonation and hydrophilicity [35] [37] [38].
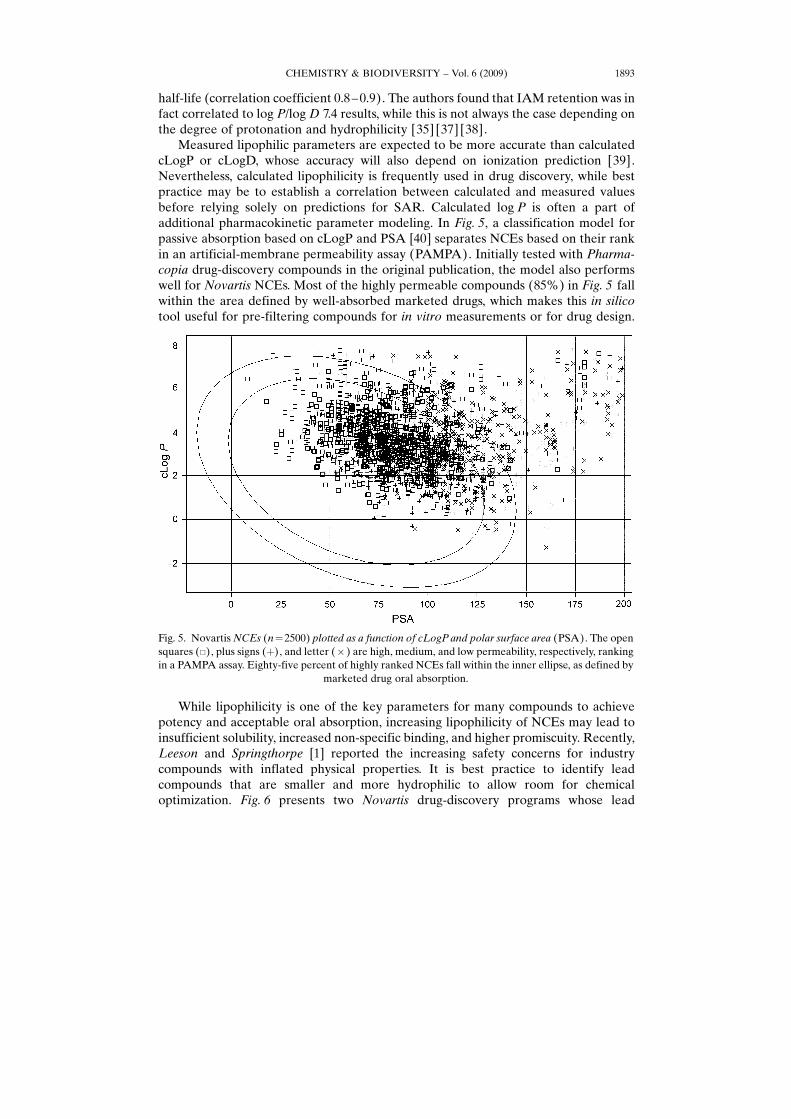
Measured lipophilic parameters are expected to be more accurate than calculatedcLogP or cLogD, whose accuracy will also depend on ionization prediction [39].Nevertheless, calculated lipophilicity is frequently used in drug discovery, while bestpractice may be to establish a correlation between calculated and measured valuesbefore relying solely on predictions for SAR. Calculated log P is often a part ofadditional pharmacokinetic parameter modeling. In Fig. 5, a classification model forpassive absorption based on cLogP and PSA [40] separates NCEs based on their rankin an artificial-membrane permeability assay (PAMPA). Initially tested with Pharma-copia drug-discovery compounds in the original publication, the model also performswell for Novartis NCEs. Most of the highly permeable compounds (85%) in Fig. 5 fallwithin the area defined by well-absorbed marketed drugs, which makes this in silicotool useful for pre-filtering compounds for in vitro measurements or for drug design.
While lipophilicity is one of the key parameters for many compounds to achievepotency and acceptable oral absorption, increasing lipophilicity of NCEs may lead toinsufficient solubility, increased non-specific binding, and higher promiscuity. Recently,Leeson and Springthorpe [1] reported the increasing safety concerns for industrycompounds with inflated physical properties. It is best practice to identify leadcompounds that are smaller and more hydrophilic to allow room for chemicaloptimization. Fig. 6 presents two Novartis drug-discovery programs whose lead
Fig. 5. Novartis NCEs (n¼2500) plotted as a function of cLogP and polar surface area (PSA). The opensquares (&), plus signs (þ), and letter (� ) are high, medium, and low permeability, respectively, rankingin a PAMPA assay. Eighty-five percent of highly ranked NCEs fall within the inner ellipse, as defined by
marketed drug oral absorption.
CHEMISTRY & BIODIVERSITY – Vol. 6 (2009) 1893
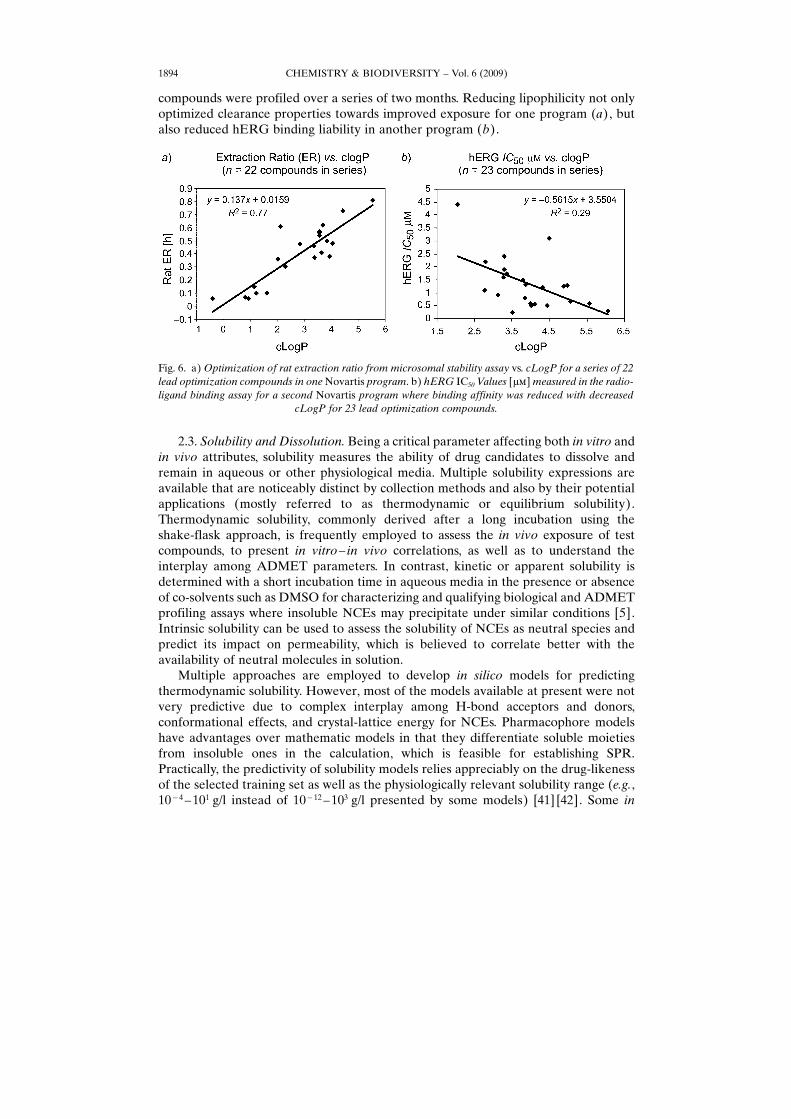
compounds were profiled over a series of two months. Reducing lipophilicity not onlyoptimized clearance properties towards improved exposure for one program (a), butalso reduced hERG binding liability in another program (b).
2.3. Solubility and Dissolution. Being a critical parameter affecting both in vitro andin vivo attributes, solubility measures the ability of drug candidates to dissolve andremain in aqueous or other physiological media. Multiple solubility expressions areavailable that are noticeably distinct by collection methods and also by their potentialapplications (mostly referred to as thermodynamic or equilibrium solubility).Thermodynamic solubility, commonly derived after a long incubation using theshake-flask approach, is frequently employed to assess the in vivo exposure of testcompounds, to present in vitro– in vivo correlations, as well as to understand theinterplay among ADMET parameters. In contrast, kinetic or apparent solubility isdetermined with a short incubation time in aqueous media in the presence or absenceof co-solvents such as DMSO for characterizing and qualifying biological and ADMETprofiling assays where insoluble NCEs may precipitate under similar conditions [5].Intrinsic solubility can be used to assess the solubility of NCEs as neutral species andpredict its impact on permeability, which is believed to correlate better with theavailability of neutral molecules in solution.
Multiple approaches are employed to develop in silico models for predictingthermodynamic solubility. However, most of the models available at present were notvery predictive due to complex interplay among H-bond acceptors and donors,conformational effects, and crystal-lattice energy for NCEs. Pharmacophore modelshave advantages over mathematic models in that they differentiate soluble moietiesfrom insoluble ones in the calculation, which is feasible for establishing SPR.Practically, the predictivity of solubility models relies appreciably on the drug-likenessof the selected training set as well as the physiologically relevant solubility range (e.g.,10�4 – 101 g/l instead of 10�12 – 103 g/l presented by some models) [41] [42]. Some in
Fig. 6. a) Optimization of rat extraction ratio from microsomal stability assay vs. cLogP for a series of 22lead optimization compounds in one Novartis program. b) hERG IC50 Values [mm] measured in the radio-ligand binding assay for a second Novartis program where binding affinity was reduced with decreased
cLogP for 23 lead optimization compounds.
CHEMISTRY & BIODIVERSITY – Vol. 6 (2009)1894
silico predictions may require other physicochemical parameters not always availablein early drug discovery, such as log P or melting point [43] [44].
The conventional thermodynamic solubility protocol starting with solid material,also referred to as �saturation shake-flask� method, reflects not only the molecularinteractions of NCEs in solution phase but also the solid packing insights (polymorphstate) [5] [45] [46]. The assay typically involves a long (24 –72 h) agitated incubation ofNCE powders in a designated buffer at a specific temperature, followed by phaseseparation (of saturated solution from solute) and quantification [47] [48]. This methodis considered the �gold standard� for solubility determination by industry and US FDA,and is widely utilized to project the in vivo GI absorption [49] and bioavailability ofNCEs together with in vitro permeability and metabolic clearance data. This approach,however, is time-consuming and labor-intensive, thereby not conceivable for HT-solubility screening in early discovery but ideal for compounds in late discovery or indevelopment phase, when only a small number of compounds but with sufficientamount of materials are available in crystalline forms.
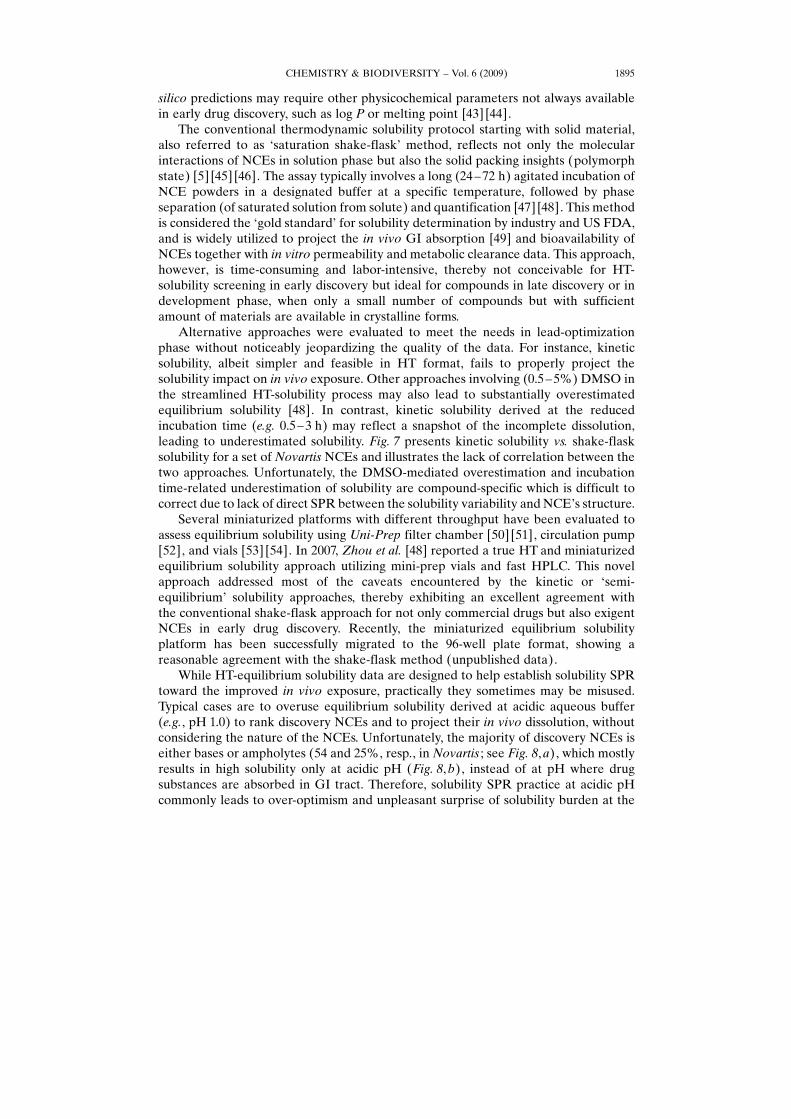
Alternative approaches were evaluated to meet the needs in lead-optimizationphase without noticeably jeopardizing the quality of the data. For instance, kineticsolubility, albeit simpler and feasible in HT format, fails to properly project thesolubility impact on in vivo exposure. Other approaches involving (0.5 – 5%) DMSO inthe streamlined HT-solubility process may also lead to substantially overestimatedequilibrium solubility [48]. In contrast, kinetic solubility derived at the reducedincubation time (e.g. 0.5– 3 h) may reflect a snapshot of the incomplete dissolution,leading to underestimated solubility. Fig. 7 presents kinetic solubility vs. shake-flasksolubility for a set of Novartis NCEs and illustrates the lack of correlation between thetwo approaches. Unfortunately, the DMSO-mediated overestimation and incubationtime-related underestimation of solubility are compound-specific which is difficult tocorrect due to lack of direct SPR between the solubility variability and NCE�s structure.
Several miniaturized platforms with different throughput have been evaluated toassess equilibrium solubility using Uni-Prep filter chamber [50] [51], circulation pump[52], and vials [53] [54]. In 2007, Zhou et al. [48] reported a true HT and miniaturizedequilibrium solubility approach utilizing mini-prep vials and fast HPLC. This novelapproach addressed most of the caveats encountered by the kinetic or �semi-equilibrium� solubility approaches, thereby exhibiting an excellent agreement withthe conventional shake-flask approach for not only commercial drugs but also exigentNCEs in early drug discovery. Recently, the miniaturized equilibrium solubilityplatform has been successfully migrated to the 96-well plate format, showing areasonable agreement with the shake-flask method (unpublished data).
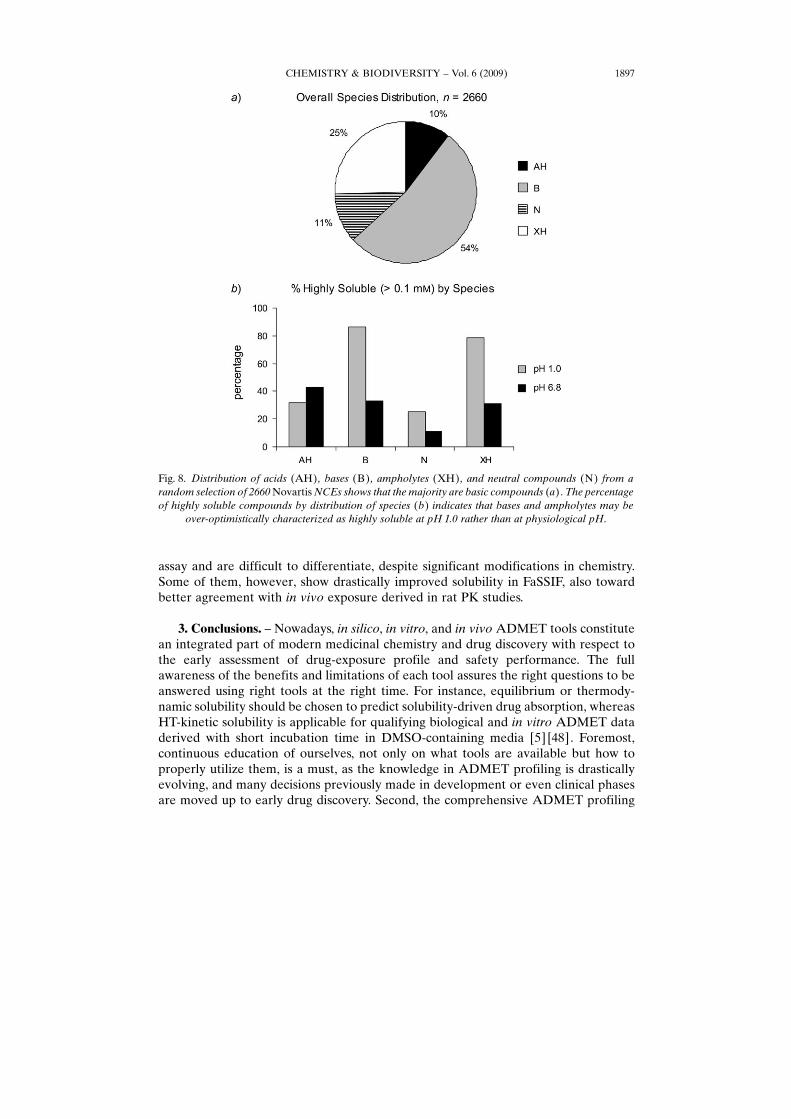
While HT-equilibrium solubility data are designed to help establish solubility SPRtoward the improved in vivo exposure, practically they sometimes may be misused.Typical cases are to overuse equilibrium solubility derived at acidic aqueous buffer(e.g., pH 1.0) to rank discovery NCEs and to project their in vivo dissolution, withoutconsidering the nature of the NCEs. Unfortunately, the majority of discovery NCEs iseither bases or ampholytes (54 and 25%, resp., in Novartis ; see Fig. 8, a), which mostlyresults in high solubility only at acidic pH (Fig. 8, b), instead of at pH where drugsubstances are absorbed in GI tract. Therefore, solubility SPR practice at acidic pHcommonly leads to over-optimism and unpleasant surprise of solubility burden at the
CHEMISTRY & BIODIVERSITY – Vol. 6 (2009) 1895
development nomination phase, when NCEs have a chance to be fully characterized.This will not only cause substantial delay in project progress but also create difficultyfor structure optimization, as most of the chemical spaces are well-defined at this stageby pharmacologic or other ADMET properties. One approach to avoid this issue is notto offer the HT-equilibrium solubility data at acidic pH until nomination of develop-ment candidates at late discovery phase.
Another challenge to use HT-equilibrium solubility to build SPR lies in the largepopulation of low-solubility data derived at neutral pH and lack of direct correlation toin vivo exposure. This observation should not be surprising, as equilibrium solubility inaqueous buffers offers simplified determinants to flag solubility risks of NCEs, while,practically, the composition of intestinal fluid is far more complex. To address this issue,pharmaceutical industry is moving toward predicting the in vivo performance of a drugsubsequent to an oral dose using SIF, SGF, FaSSIF, and FeSSIF [55– 60]. FaSSIF andFeSSIF contain a mixture of bile salts and surfactants (such as sodium taurocholate)mimicking the physiological media in human stomach and intestine, and promotingwetting process in GI tract [55]. Therefore, these biorelevant media are powerful inidentifying the dissolution limiting factor to absorption and ultimately help establishIVIVC. For example, a series of discovery NCEs with medium-to-high in vitropermeability and metabolic stability all show poor correlation between equilibriumsolubility obtained in aqueous buffer and rat bioavailability (unpublished data). In thiscase, all aqueous-solubility data cluster at the low end of the HT-equilibrium solubility
CHEMISTRY & BIODIVERSITY – Vol. 6 (2009)1896
Fig. 7. A comparison of solubility data, from a collection of 389 discovery NCEs, measured by aconventional shake-flask approach (thermodynamic solubility) with those assessed via a kinetic method(kinetic solubility). The former starting from powder was agitated for 24–72 h in vials and quantified viaHPLC-UV. The kinetic protocol, however, was determined on 96-well plates by adding DMSO stock intobuffer (0.5–2% DMSO in the buffer) and monitoring the precipitation of NCEs from solution usingnephelometric readout after a short (10–30 min) incubation time. Clearly, the kinetic solubility shouldnot be used to predict thermodynamic solubility due to lack of correlation between the two approaches.
assay and are difficult to differentiate, despite significant modifications in chemistry.Some of them, however, show drastically improved solubility in FaSSIF, also towardbetter agreement with in vivo exposure derived in rat PK studies.
3. Conclusions. – Nowadays, in silico, in vitro, and in vivo ADMET tools constitutean integrated part of modern medicinal chemistry and drug discovery with respect tothe early assessment of drug-exposure profile and safety performance. The fullawareness of the benefits and limitations of each tool assures the right questions to beanswered using right tools at the right time. For instance, equilibrium or thermody-namic solubility should be chosen to predict solubility-driven drug absorption, whereasHT-kinetic solubility is applicable for qualifying biological and in vitro ADMET dataderived with short incubation time in DMSO-containing media [5] [48]. Foremost,continuous education of ourselves, not only on what tools are available but how toproperly utilize them, is a must, as the knowledge in ADMET profiling is drasticallyevolving, and many decisions previously made in development or even clinical phasesare moved up to early drug discovery. Second, the comprehensive ADMET profiling
CHEMISTRY & BIODIVERSITY – Vol. 6 (2009) 1897
Fig. 8. Distribution of acids (AH) , bases (B) , ampholytes (XH) , and neutral compounds (N) from arandom selection of 2660 Novartis NCEs shows that the majority are basic compounds (a). The percentageof highly soluble compounds by distribution of species (b) indicates that bases and ampholytes may be
over-optimistically characterized as highly soluble at pH 1.0 rather than at physiological pH.
should be applied early enough in lead-selection and optimization phases, in a proactivemanner. Not only is this because optimizing ADMET properties is considered moredifficult and complex than optimizing potency, but also due to the limited chemicalspace for further optimization in drug properties, once lead NCEs are optimized bypotency at the primary target. Rational profiling rather than �box-checking� strategy isfound more efficient in dialing out the key ADMET issues where one should avoidrejecting NCEs based simply on poor ranking from one profiling assay, or a risk flagwithout thoroughly understanding the mechanistic relevance and potential impacts.Finally, it is worthwhile to review the success stories where rational ADMET profilinghelped advance the candidates and, more importantly, the failures of terminatedchemical series by identifying the causes of errors. The latter typically offers moreconstructive feedback to the constantly evolving ADMET profiling process.
REFERENCES
[1] P. D. Leeson, B. Springthorpe, Nat. Rev. Drug Discovery 2007, 6, 881.[2] A. Bender, J. Scheiber, M. Glick, J. W. Davies, K. Azzaoui, J. Hamon, L. Urban, S. Whitebread, J. L.
Jenkins, ChemMedChem 2007, 2, 861.[3] E. H. Kerns, L. Di, Drug Discovery Today: Technol. 2004, 1, 343.[4] V. H. Thomas, S. Bhattachar, L. Hitchingham, P. Zocharski, M. Naath, N. Surendran, C. L. Stoner,
A. El-Kattan, Expert Opin. Drug Metab. Toxicol. 2006, 2, 591.[5] J. Wang, L. Urban, D. Bojanic, Expert Opin. Drug Metab. Toxicol. 2007, 3, 641.[6] S. Biller, L. Custer, K. Dickenson, S. Durham, A. Gavai, L. Hamann, J. Josephs, F. Moulin, G. Pearl,
O. Flint, M. Sanders, A. Tymiak, R. Vaz, in �Pharmaceutical Profiling in Drug Discovery for LeadSelection�, Eds. R. Borchardt, E. H. Kerns, C. Lipinski, D. Thakker, B. Wang, AAPS Press,Washington, DC, 2004, p. 413.
[7] B. Faller, J. Wang, A. Zimmerlin, L. Bell, J. Hamon, S. Whitebread, K. Azzaoui, D. Bojanic, L.Urban, Expert Opin. Drug Metab. Toxicol. 2006, 2, 823.
[8] A. Lahoz, L. Gombau, M. T. Donato, J. V. Castell, M. J. Gomez-Lechon, Mini-Rev. Med. Chem.2006, 6, 1053.
[9] J. Wang, B. Faller, in �Comprehensive Medicinal Chemistry�, 2nd edn., Vol. 5, Eds. B. Testa, H. vande Waterbeemd, Elsevier, Oxford, 2007, p. 341.
[10] D. Clark, Expert Opin. Drug Discovery 2007, 2, 1423.[11] W. Egan, Annu. Rep. Med. Chem. 2007, 42, 449.[12] S. A. Shaikh, T. Jain, G. Sandhu, N. Latha, B. Jayaram, Curr. Pharm. Des. 2007, 13, 3454.[13] F. Lombardo, B. Faller, M. Shalaeva, I. Tetko, S. Tilton, in �Methods and Principles in Medicinal
Chemistry�, Eds. R. Mannhold, H. Kubinyi, G. Folkers, Wiley-VCH, Weinheim, 2008, p. 407.[14] A. Avdeef, Curr. Top. Med. Chem. 2001, 1, 277.[15] A. Avdeef, Pharm. Pharmacol. Commun. 1998, 4, 165.[16] B. Faller, H. P. Grimm, F. Loeuillet-Ritzler, S. Arnold, X. Briand, J. Med. Chem. 2005, 48, 2571.[17] K. Box, C. Bevan, J. Comer, A. Hill, R. Allen, D. Reynolds, Anal. Chem. 2003, 75, 883.[18] H. Wan, J. Ulander, Expert Opin. Drug Metab. Toxicol. 2006, 2, 139.[19] J. Comer, K. Box, J. Assoc. Lab. Autom. 2003, 8, 55.[20] J. A. Cleveland Jr., M. H. Benko, S. J. Gluck, Y. M. Walbroehl, J. Chromatogr., A 1993, 652, 301.[21] Y. Ishihama, M. Nakamura, T. Miwa, T. Kajima, N. Asakawa, J. Pharm. Sci. 2002, 91, 933.[22] H. Wan, A. G. Holmen, Y. Wang, W. Lindberg, M. Englund, M. B. Nagard, R. A. Thompson, Rapid
Commun. Mass Spectrom. 2003, 17, 2639.[23] M. Shalaeva, J. Kenseth, F. Lombardo, A. Bastin, J. Pharm. Sci. 2008, 97, 2581.[24] R. Kaliszan, P. Wiczling, M. J. Markuszewski, J. Chromatogr., A 2004, 1060, 165.[25] K. Finlayson, H. J. Witchel, J. McCulloch, J. Sharkey, Eur. J. Pharmacol. 2004, 500, 129.
CHEMISTRY & BIODIVERSITY – Vol. 6 (2009)1898
[26] C. Jamieson, E. M. Moir, Z. Rankovic, G. Wishart, J. Med. Chem. 2006, 49, 5029.[27] M. J. Waring, C. Johnstone, Bioorg. Med. Chem. Lett. 2007, 17, 1759.[28] C. A. Lipinski, F. Lombardo, B. W. Dominy, P. J. Feeney, Adv. Drug Delivery Rev. 2001, 46, 3.[29] S. Gocan, G. Cimpan, J. Comer, Adv. Chromatogr. 2006, 44, 79.[30] F. Lombardo, M. Y. Shalaeva, K. A. Tupper, F. Gao, M. H. Abraham, J. Med. Chem. 2000, 43, 2922.[31] X. Liu, H. Tanaka, A. Yamauchi, B. Testa, H. Chuman, J. Chromatogr., A 2005, 1091, 51.[32] L. Hitzel, A. P. Watt, K. L. Locker, Pharm. Res. 2000, 17, 1389.[33] S. E. Lucangioli, E. Kenndler, A. Carlucci, V. P. Tripodi, S. L. Scioscia, C. N. Carducci, J. Pharm.
Biomed. Anal. 2003, 33, 871.[34] Z. Jia, L. Mei, F. Lin, S. Huang, R. B. Killion, J. Chromatogr., A 2003, 1007, 203.[35] A. Taillardat-Bertschinger, P.-A. Carrupt, F. Barbato, B. Testa, J. Med. Chem. 2003, 46, 655.[36] F. Pehourcq, C. Jarry, B. Bannwarth, J. Pharm. Biomed. Anal. 2003, 33, 137.[37] C. Giaginis, A. Tsantili-Kakoulidou, J. Pharm. Sci. 2008, 97, 2984.[38] F. Barbato, V. Cirocco, L. Grumetto, M. I. La Rotonda, Eur. J. Pharm. Sci. 2007, 31, 288.[39] I. Tetko, D. J. Livingstone, in �Comprehensive Medicinal Chemistry�, 2nd edn., Vol. 5, Eds. B. Testa,
H. van de Waterbeemd, Elsevier, Oxford, 2007, p. 649.[40] W. J. Egan, K. M. Merz Jr., J. J. Baldwin, J. Med. Chem. 2000, 43, 3867.[41] C. A. Bergstrçm, K. Luthman, P. Artursson, Eur. J. Pharm. Sci. 2004, 22, 387.[42] J. Wang, L. Urban, Drug Discovery World 2004, 5, 73.[43] X.-Q. Chen, S. J. Cho, Y. Li, S. Venkatesh, J. Pharm. Sci. 2002, 91, 1838.[44] R. Liu, S.-S. So, J. Chem. Inf. Comput. Sci. 2001, 41, 1633.[45] K. James, �Solubility and Related Properties�, Dekker, New York, 1986, p. 36.[46] S. Yalkosky, S. Banerjee, �Aqueous Solubility Methods of Estimation for Organic Compounds�,
Dekker, New York, 1992, p. 149.[47] A. Avdeef, D. Voloboy, A. Foreman, in �Comprehensive Medicinal Chemistry�, 2nd edn., Vol. 5,
Eds. B. Testa, H. van de Waterbeemd, Elsevier, Oxford, 2007, p. 399.[48] L. Zhou, L. Yang, S. Tilton, J. Wang, J. Pharm. Sci. 2007, 96, 3052.[49] G. L. Amidon, H. Lennern�s, V. P. Shah, J. R. Crison, Pharm. Res. 1995, 12, 413.[50] E. H. Kerns, J. Pharm. Sci. 2001, 90, 1838.[51] A. Glomme, J. M�rz, J. B. Dressman, J. Pharm. Sci. 2005, 94, 1.[52] X.-Q. Chen, S. Venkatesh, Pharm. Res. 2004, 21, 1758.[53] C. A. S. Bergstrçm, U. Norinder, K. Luthman, P. Artursson, Pharm. Res. 2002, 19, 182.[54] H. Tan, D. Semin, M. Wacker, J. Cheetham, J. Assoc. Lab. Autom. 2005, 10, 364.[55] E. Galia, E. Nicolaides, D. Hçrter, R. Lçbenberg, C. Reppas, J. B. Dressman, Pharm. Res. 1998, 15,
698.[56] E. Nicolaides, E. Galia, C. Efthymiopoulos, J. B. Dressman, C. Reppas, Pharm. Res. 1999, 16, 1876.[57] J. B. Dressman, C. Reppas, Eur. J. Pharm. Sci. 2000, 11, S73.[58] E. S. Kostewicz, U. Brauns, R. Becker, J. B. Dressman, Pharm. Res. 2002, 19, 345.[59] E. S. Kostewicz, M. Wunderlich, U. Brauns, R. Becker, T. Bock, J. B. Dressman, J. Pharm.
Pharmacol. 2004, 56, 43.[60] M. Vertzoni, E. Pastelli, D. Psachoulias, L. Kalantzi, C. Reppas, Pharm. Res. 2007, 24, 909.
Received March 30, 2009
CHEMISTRY & BIODIVERSITY – Vol. 6 (2009) 1899


![ADMET 2012 all slides [Read-Only]](https://img.dokumen.tips/doc/110x75/616a4eca11a7b741a35112cd/admet-2012-all-slides-read-only.jpg)