Embed Size (px)
Citation preview

Recent Advances in Modelling the Sublimation of Blowing Snow
on the Canadian Prairies
John Pomeroy and Xing FangCentre for Hydrology
University of Saskatchewan

Blowing Snow

Prairie Blowing Snow Model
Blowing snow transport, and sublimation relocate snow across the landscape from sources to sinksdepending on fetch, orientation and area.
Source SinkSnowfall Sublimation Snowfall
Deposition Erosion/ Deposition
Transport Transport
Snowpack
Ground
Source
SinkPomeroy & Li Proc WSC 1997

Blowing Snow: Transport, Redistribution and Sublimation of Snow
Pomeroy and Gray, Wat Resour. Res. (1990)Pomeroy and Male, J Hydrol. (1992)Pomeroy, Gray and Male, J Hydrol. (1993)Pomeroy and Gray, NHRI Science Report No. 7 (1995)

-0.0025
-0.002
-0.0015
-0.001
-0.0005
0
SUBL
IMAT
ION
RAT
E %
/s
-40 -30 -20 -10 0 AIR TEMPERATURE °C
Sublimation Rate a Function ofAir Temperature and Humidity
RH = 30%50%70%90%
Ice Sphere Radius = 500 micronsU = 2 m/s, Q* = 100 W/m²
Exposure Coefficient = 1.0
Sublimation of an Ideal Ice Sphere

Sublimation of Blowing Snow
0.0001
0.001
0.01
0.1
1
10
0 5 10 15 20Wind Speed (m/s)
Subl
imat
ion
Rat
e (g
/m2 s)
-1 °C-15 °C-30 °C
Fresh snowRH = 80%
0.0001
0.001
0.01
0.1
1
10
0 5 10 15 20Wind Speed (m/s)
Subl
imat
ion
Rat
e (g/
m2
s)
70% RH80% RH90% RH
Fresh snowT = -10 oC
Pomeroy and Li, J Geophys Res, 2000
Can ablate up to several mm per day of SWE

Wind Eroded Snow either Sublimates or is Transported Downwind (Redistributed),
Depending on Fetch
0
0.5
1
1.5
2
2.5
3
0 1000 2000 3000 4000 5000 6000
Fetch (m)
Nor
mal
ized
Flu
x
Qt, downwind transport
dQt/dx unit area erosion feeding transport
Qe unit area sublimation flux

Blowing Snow Latent Heat Flux measured with a sonic anemometer and fast hygrometer
0
10
20
30
40
50
60
70
351.8 352.2 352.6 365.4 365.8 1.3 1.71998-1999 Julian Day
Subl
imat
ion
Flux
W/m
²
Measured
Modelled Blowing Snow Sublimation
Modelled Surface Sublimation
18 Dec 31 Dec
0.09
0.06
0.04
0.01
0
mm
/hourMeasured with Eddy Correlation
PBSM ModelledBlowing snow Sublimation
Dalton-type Surface Sublimation
Pomeroy and Essery, Hydrol Proc (1999)

Effect of Blowing Snow Sublimation on Prairie Snow Supply (mm SWE)
36.527.4Winnipeg33.823.5Portage28.618.6Yorkton48.139.4Regina29.624.9Prince Albert37.828.2Swift Current7.66.6Peace River37.519.7CalgaryFallow-fieldStubble-fieldLocation
Pomeroy and Gray, NHRI Science Report No. 7 (1995) 1970-1976 hourly simulations
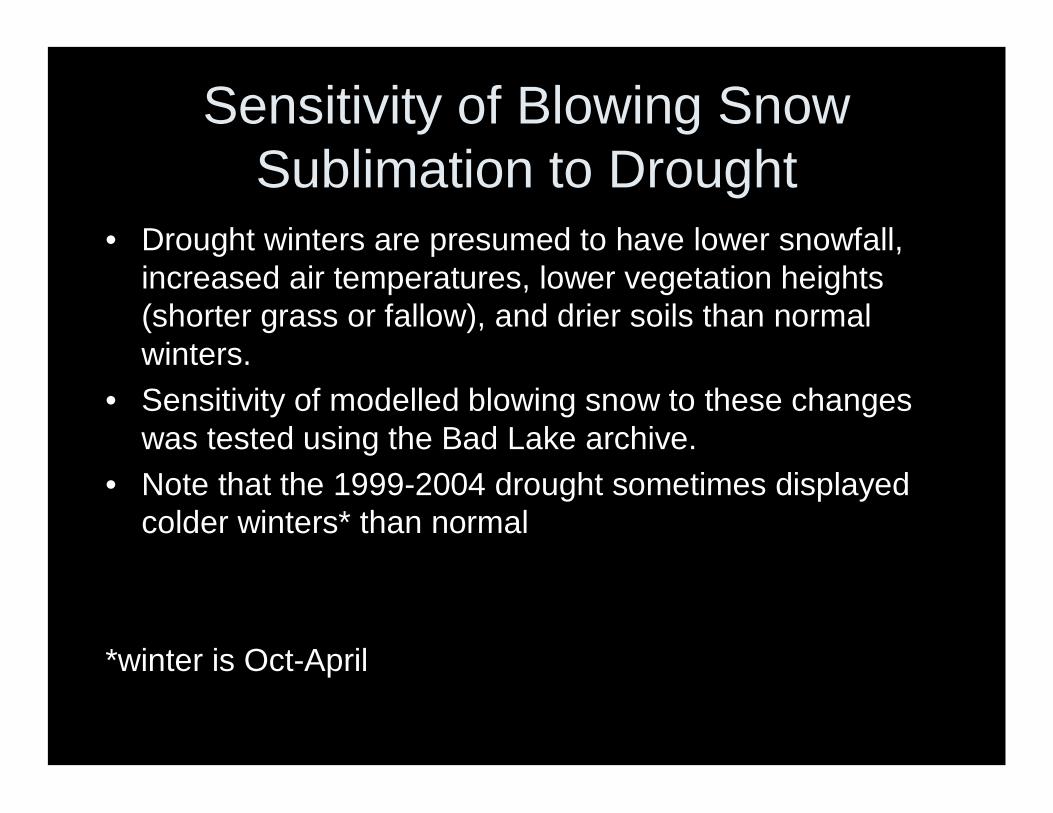
Sensitivity of Blowing Snow Sublimation to Drought
• Drought winters are presumed to have lower snowfall, increased air temperatures, lower vegetation heights (shorter grass or fallow), and drier soils than normal winters.
• Sensitivity of modelled blowing snow to these changes was tested using the Bad Lake archive.
• Note that the 1999-2004 drought sometimes displayed colder winters* than normal
*winter is Oct-April

Effect of Warmer Winter on Blowing Snow Sublimation and Snow Accumulation – Bad Lake
0
10
20
30
40
50
60
70
01/10/1974 31/10/1974 30/11/1974 30/12/1974 29/01/1975 28/02/1975 30/03/1975 29/04/1975
mm
wat
er e
quiv
alen
t
SWE (Normal)
SWE(5 C Rise in Temp)
Sublimation (Normal)
Sublimation (5 C Rise in Temp)

Effect of Drier Winter on Blowing Snow Sublimation and Snow Accumulation
0
10
20
30
40
50
60
70
01/10/1974 31/10/1974 30/11/1974 30/12/1974 29/01/1975 28/02/1975 30/03/1975 29/04/1975
mm
wat
er e
quiv
alen
t
SWE (Normal)
SWE(50% Decrease in Snowfall)
Sublimation (Normal)
Sublimation (5 0% Decrease inSnowfall)

Blowing Snow Sublimation Sensitivity Analysis
Fang and Pomeroy, Hydrol Proc (2007)
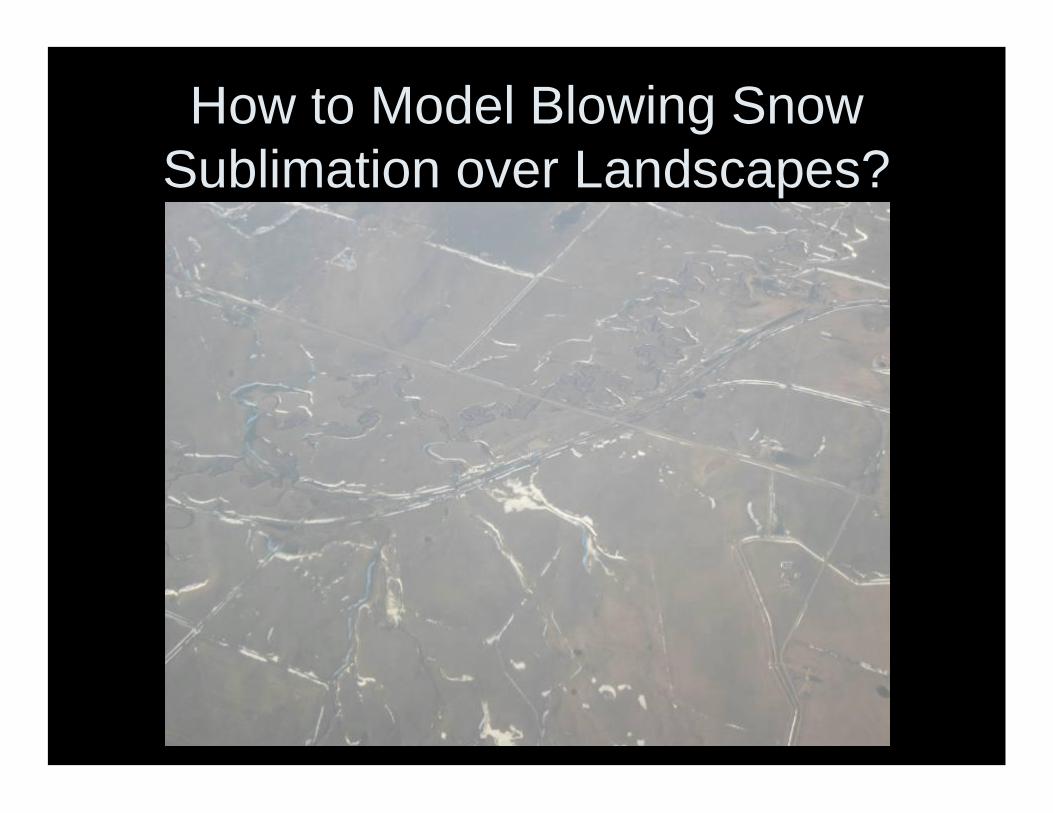
How to Model Blowing Snow Sublimation over Landscapes?

Dual Scale Approach
~250,000 grid cells 7 HRU

Spatially Distributed Snow Redistribution
Snow mass balance equation
St Denis, Saskatchewan

Results – Spatially distributed SWE
Fang and Pomeroy, Hydrol Proc, in preparation

Spatially distributed SWE cont’

Spatially distributed SWE cont’

Spatially distributed SWE cont’

Spatially distributed SWE cont’

Spatially distributed SWE cont’

Spatially distributed SWE cont’

Spatially distributed SWE cont’

Spatially distributed SWE cont’

Spatial Pattern of Blowing Snow Sublimation

Distributed vs Aggregated Simulation
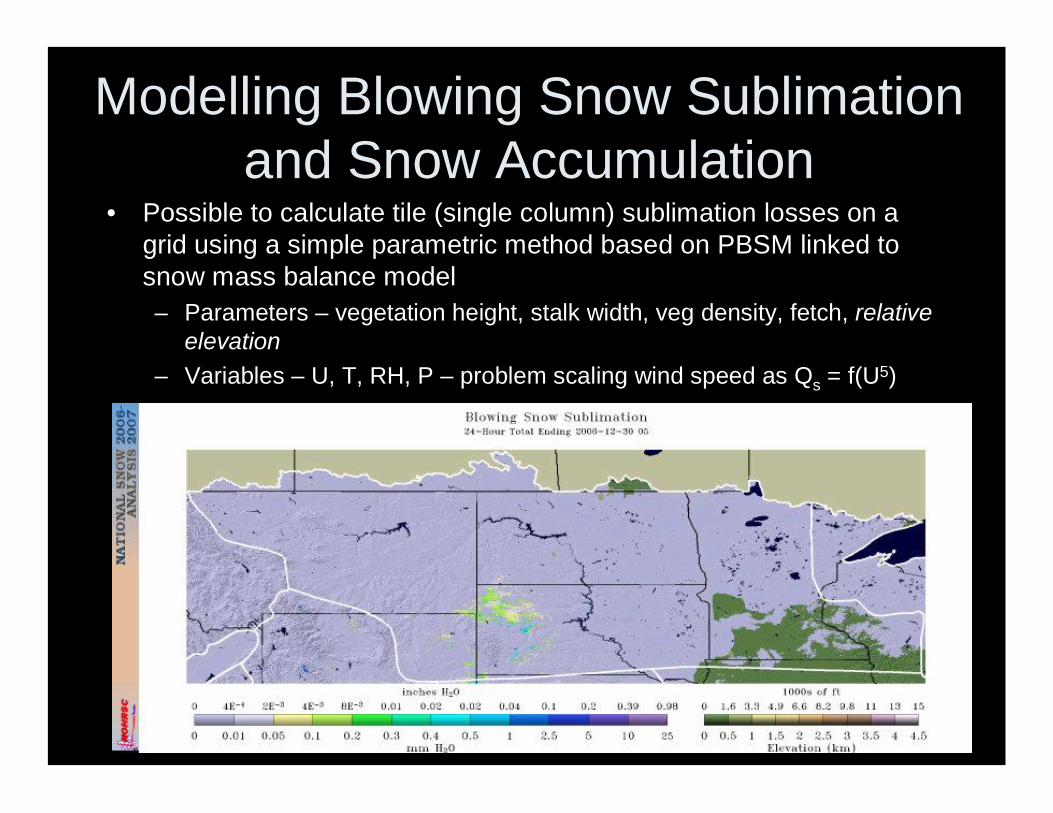
Modelling Blowing Snow Sublimation and Snow Accumulation
• Possible to calculate tile (single column) sublimation losses on a grid using a simple parametric method based on PBSM linked to snow mass balance model– Parameters – vegetation height, stalk width, veg density, fetch, relative
elevation– Variables – U, T, RH, P – problem scaling wind speed as Qs = f(U5)

Blowing Snow in Drought Modelling• For hydrological and agricultural water balance applications,
need landscape type (tile) specific calculations• To calculate mass balance for tiles need inputs from upwind
tiles (source to sink)• Possible to calculate transport from one tile to another
– Calculation order based on tile sequence (smooth to rough; high elevation to low elevation?). Transport out from one tile is transport in to next tile.
• Important to preserve continuity at multiple scales
Fallow Field
Stubble Field Grassland Brush Trees

Conclusions
• Sublimation of blowing snow can be a significant component of the Prairie water balance in years with near-normal snowfall.
• Blowing snow sublimation is greatly reduced during drought due to suppression of snow transport (low snowfall, warm temperatures)
• It is appropriate to calculate blowing snow sublimation using just a few landscape classes primarily based on vegetation characteristics