Embed Size (px)
Citation preview

Recent advances in dosimetry in reference conditions
for proton and light-ion beams
S. Vatnitskiya), P. Andreob)
and D.T.L. Jonesc)
a)
MedAustron, Wiener Neustadt, Austriab)
Medical Radiation Physics, Stockholm University -
Karolinska Institutet, Stockholm, Swedenc)
International Commission on Radiation Units the and Measurements, Bethesda, MD, USA
Presented to: IAEA Dosimetry SymposiumVienna, Austria November 8 –
12, 2010
about 30 treatment facilities are established 90,000
patients are treated with
all heavy-charged particles
another 20 light-ion centers are planned to be open in 5 years

treatment of large or deep seated
tumours
Main clinical applications of light ion beams
treatment of oculartumours
stereotactic
radiosurgery(cross-fire technique)
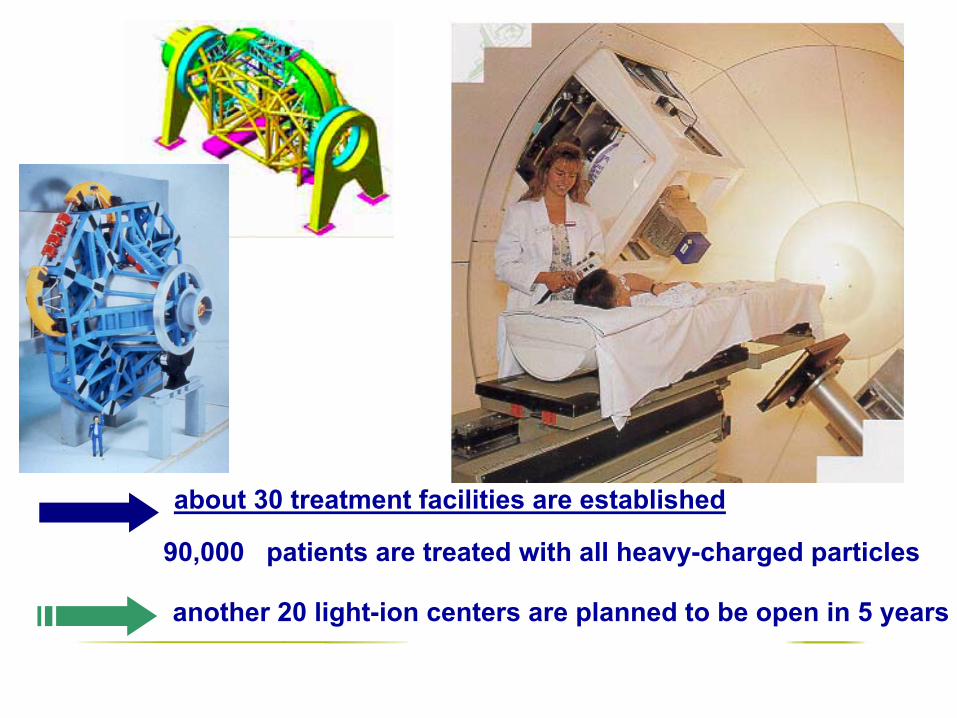
Consistent andharmonized
dosimetry guidelines
Accurate beam calibration
Perform planning of high-precision conformal therapy
Provide interchangeof clinical experience
and treatment protocols between facilities
Ensure exact delivery of prescribed dose
Provide standardizationof dosimetry in radiobiology
experiments
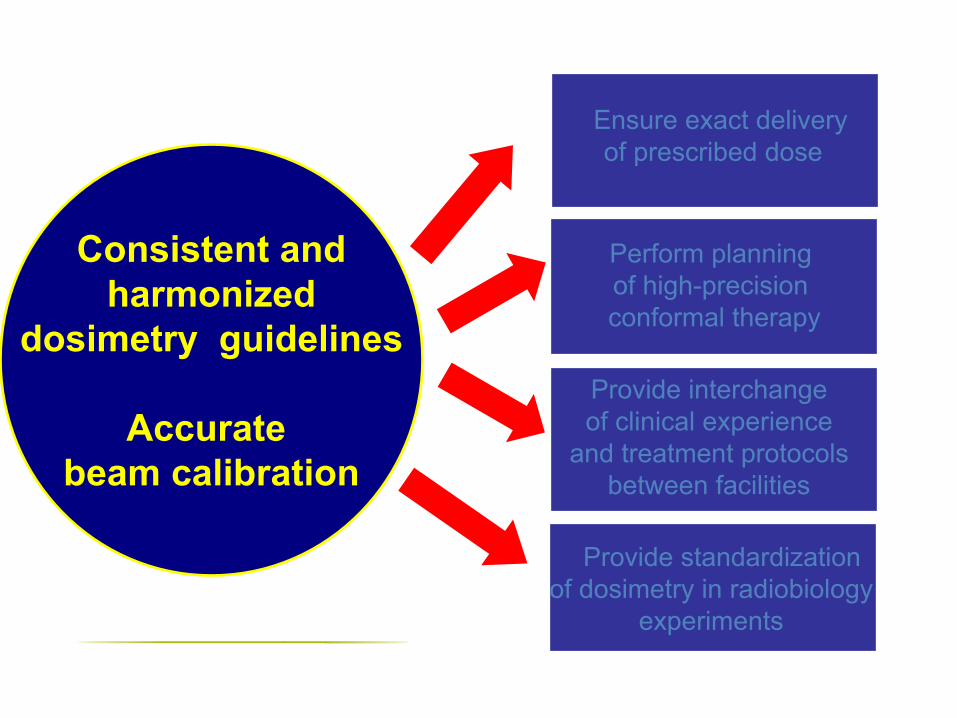
Absorbed dosedeterminationin reference
conditions for light ionbeams
Calorimeter
Thimble air-filled
ionizationchamber
Faraday Cup
Lack of national andinternational
dosimetry standards
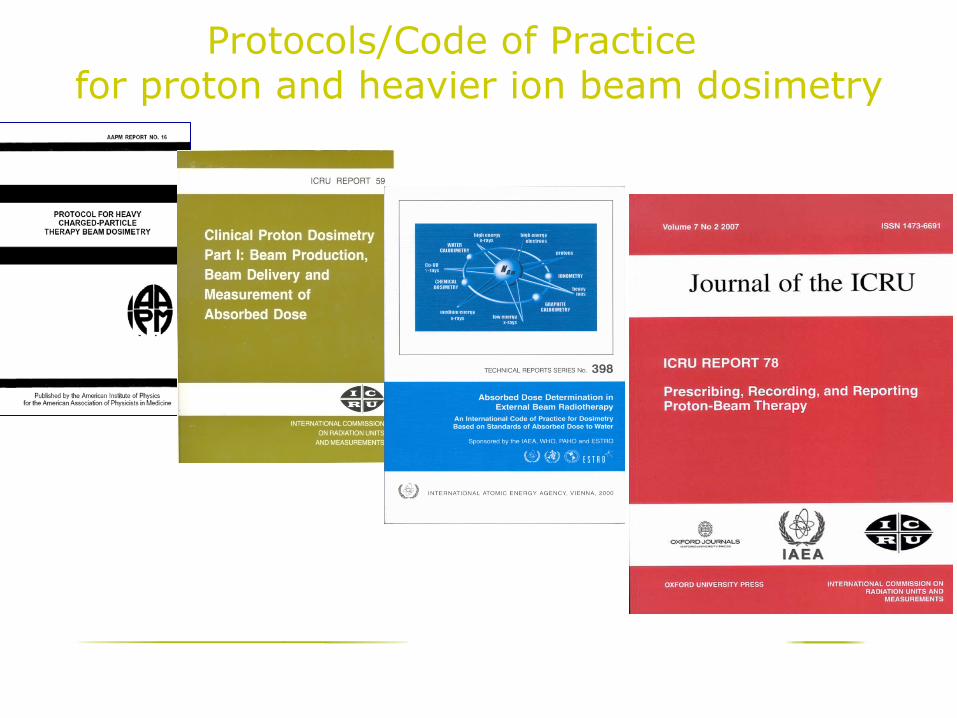
Protocols/Code of Practice for proton and heavier ion beam dosimetry
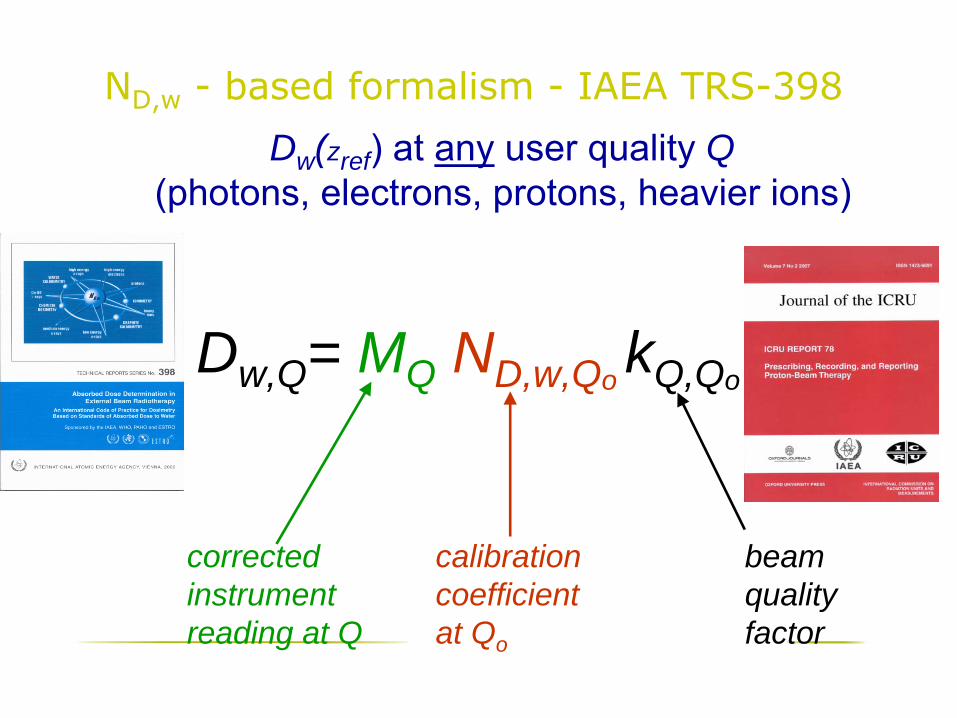
ND,w
-
based formalism -
IAEA TRS-398
Dw (zref ) at any
user quality Q (photons, electrons, protons, heavier ions)
Dw,Q = MQ ND,w,Qo kQ,Qo
beam quality factor
calibration coefficient at Qo
corrected instrument reading at Q
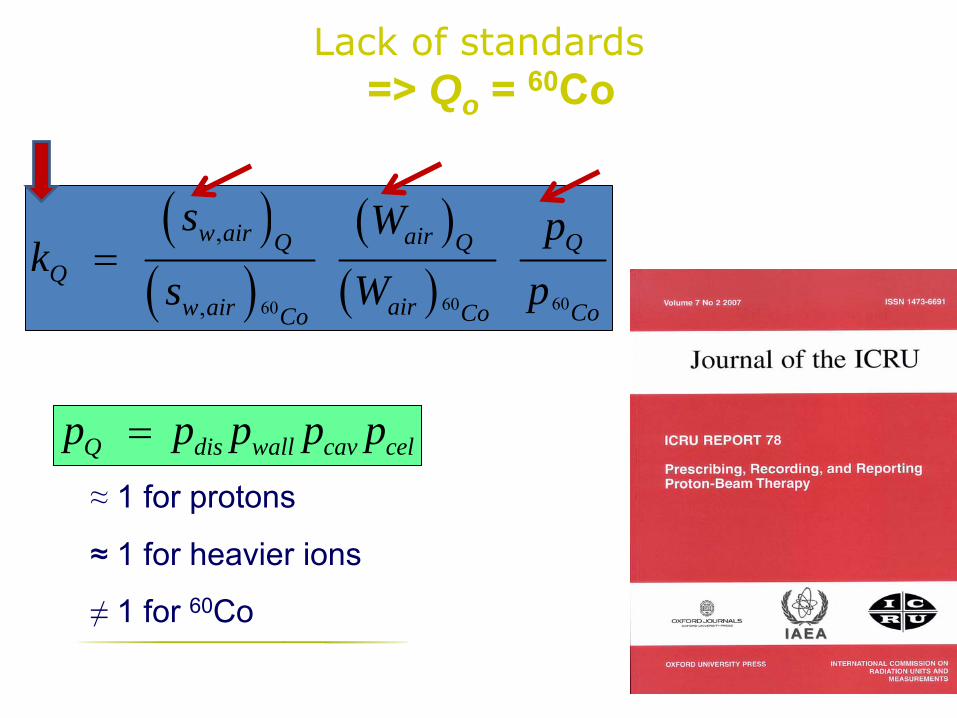
Lack of standards => Qo = 60Co
( )( )
( )( ) 606060
,
,
w air airQ Q Q
Qairw air CoCoCo
s W pk
W ps=
Q dis wall cav celp p p p p=≈
1 for protons
≈
1 for heavier ions
≠
1 for 60Co
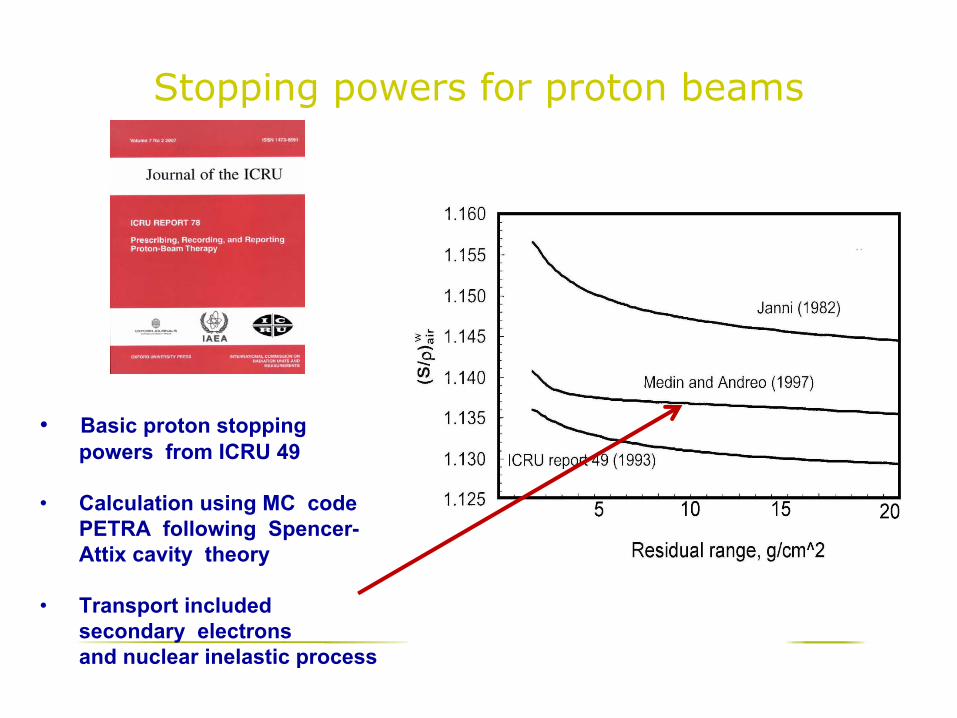
Stopping powers for proton beams
•
Basic proton stopping powers from ICRU 49
•
Calculation using MC code PETRA following Spencer-Attix cavity theory
•
Transport included secondary electrons and nuclear inelastic process
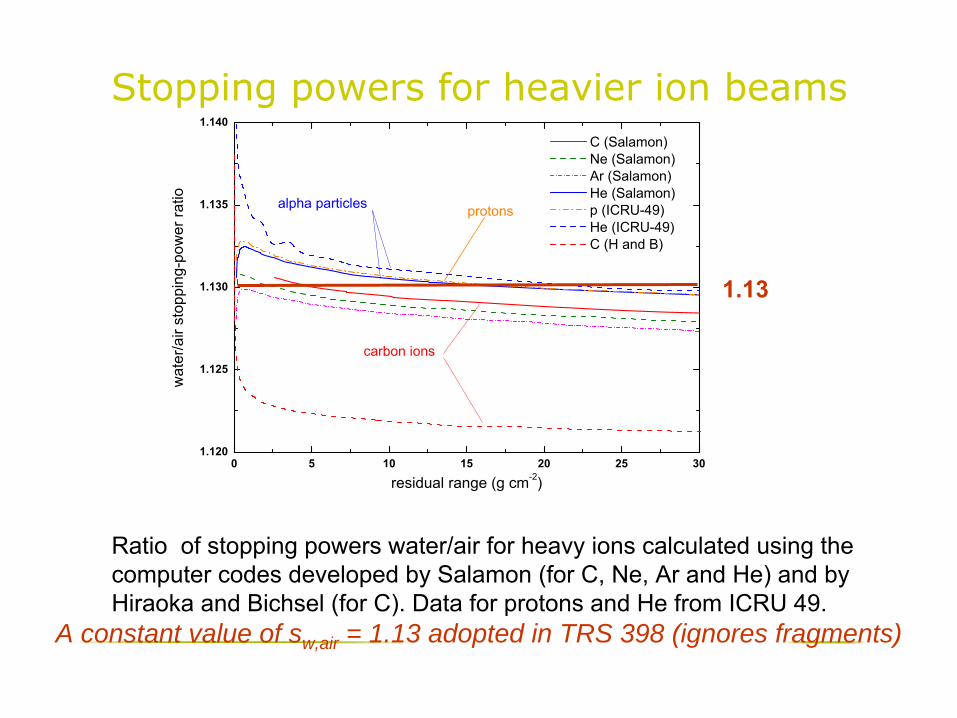
Ratio of stopping powers water/air for heavy ions calculated using the computer codes developed by Salamon (for C, Ne, Ar and He) and by Hiraoka and Bichsel (for C). Data for protons and He from ICRU 49.
0 5 10 15 20 25 301.120
1.125
1.130
1.135
1.140
protonsalpha particles
carbon ions
C (Salamon) Ne (Salamon) Ar (Salamon) He (Salamon) p (ICRU-49) He (ICRU-49) C (H and B)
wat
er/a
ir st
oppi
ng-p
ower
ratio
residual range (g cm-2)
1.13
A constant value of sw,air = 1.13 adopted in TRS 398 (ignores fragments)
Stopping powers for heavier ion beams
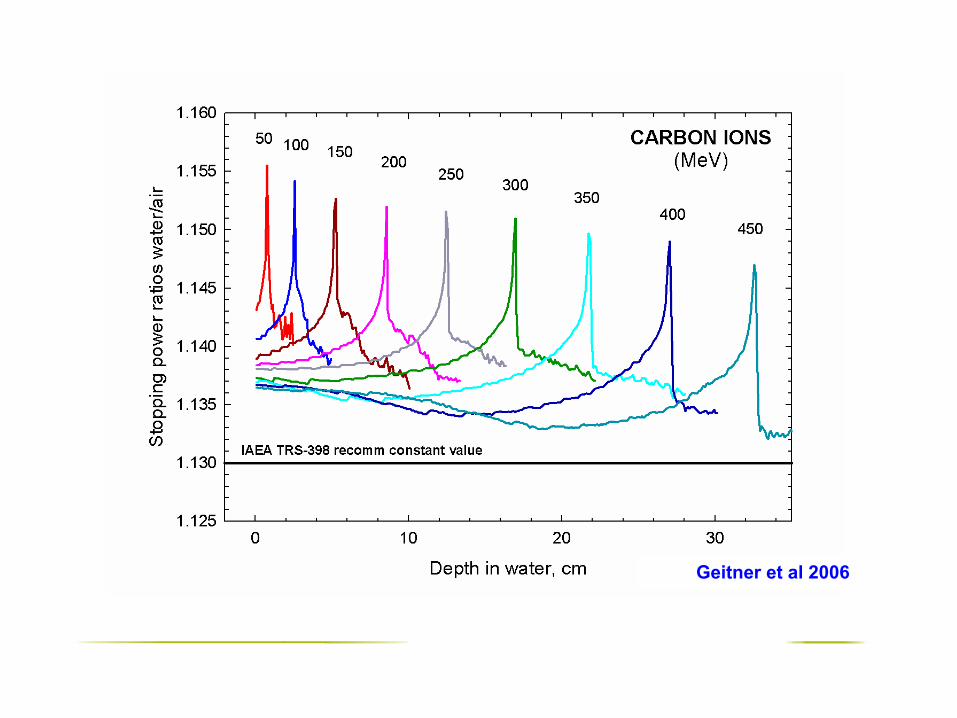
Geitner et al 2006
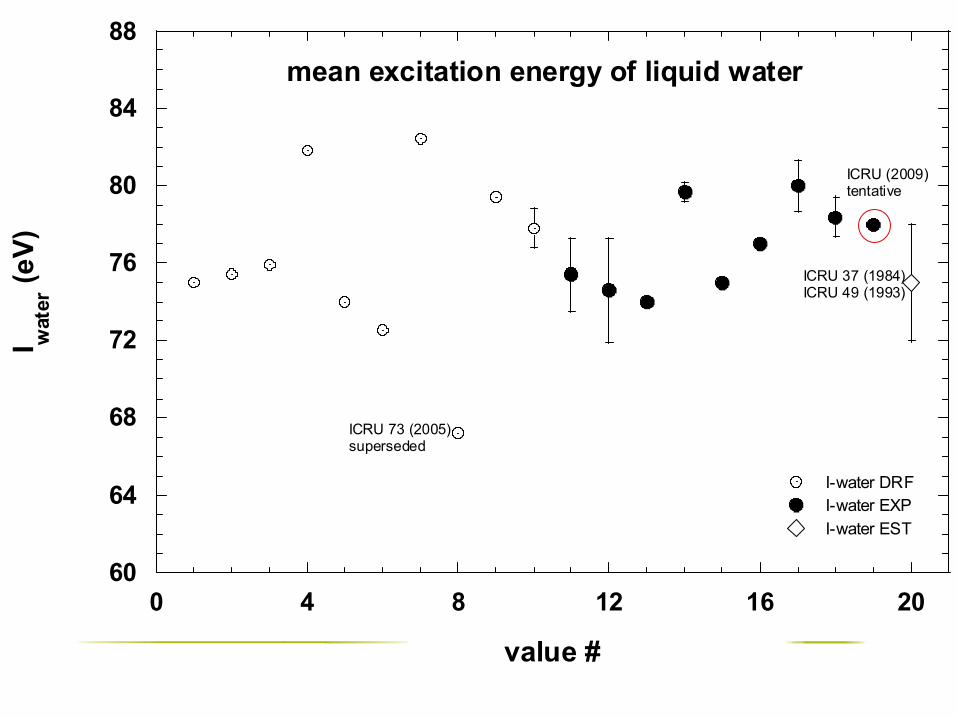
60
64
68
72
76
80
84
88
0 4 8 12 16 20
mean excitation energy of liquid water
I-water DRFI-water EXPI-water EST
I wat
er (e
V)
value #
ICRU 73 (2005)superseded
ICRU 37 (1984)ICRU 49 (1993)
ICRU (2009)tentative
0
50
100
150
200
250
300
350
400
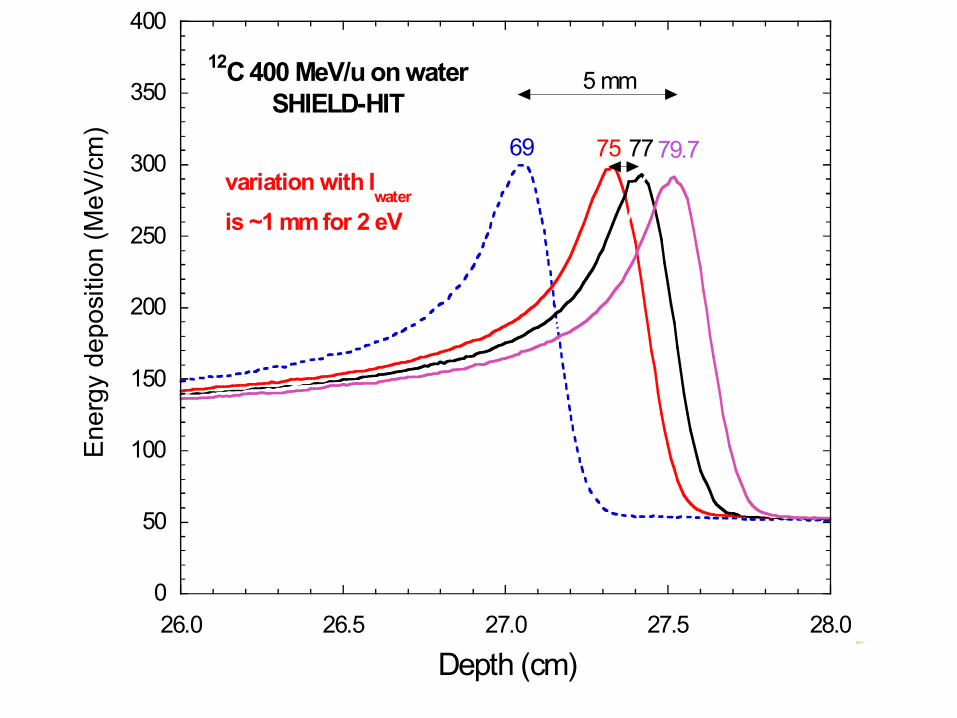
26.0 26.5 27.0 27.5 28.0
12C 400 MeV/u on water SHIELD-HIT
Ene
rgy
depo
sitio
n (M
eV/c
m)
Depth (cm)
69 7775 79.7variation with I
wateris ~1 mm for 2 eV
5 mm

Transportable water calorimeters
ProtonsCalorimetryGy/MU
IonometryGy/MU
Difference%
Scattering
Scanning
9.087*10−3
1.198*10−3
9.118*10−3
1.203*10−3
0.34
0.42
Sarfehnia et al., 2010
CalorimetryGy/MU
IonometryGy/MU
Difference%
Protons
182 MeV
C12
430
MeV/u
2.95±0.04
2.77 ±
0.05
2.97±0.09
2.69 ±
0.08
+0.7
‐
3.0
Brede et al., 2006
McGill PTB
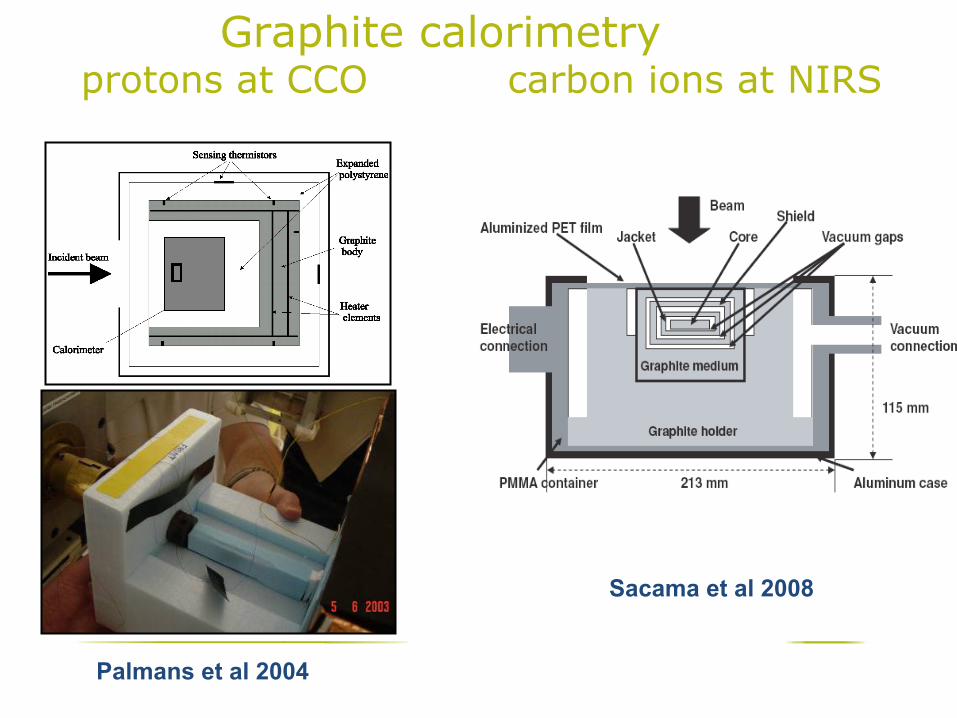
Graphite calorimetry protons at CCO carbon ions at NIRS
Palmans et al 2004
Sacama et al 2008
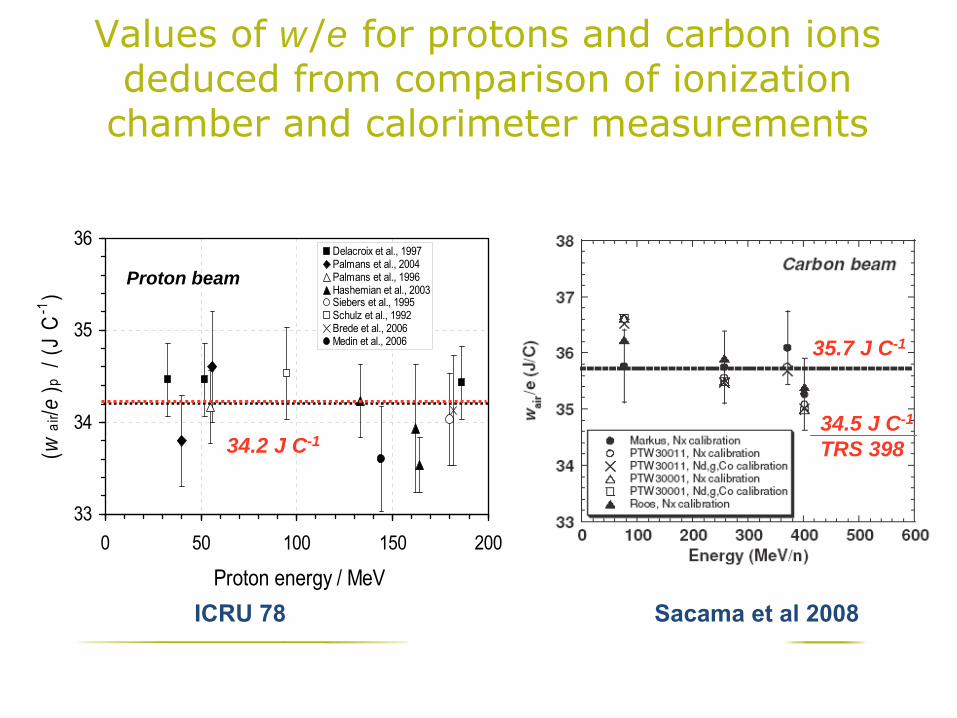
Values of w/e for protons and carbon ions deduced from comparison of ionization
chamber and calorimeter measurements
33
34
35
36
0 50 100 150 200
Proton energy / MeV
(wai
r/e) p
/ (J
C-1
)
Delacroix et al., 1997Palmans et al., 2004Palmans et al., 1996Hashemian et al., 2003Siebers et al., 1995Schulz et al., 1992Brede et al., 2006Medin et al., 2006
Sacama et al 2008ICRU 78
Proton beam
34.2 J C-1
35.7 J C-1
34.5 J C-1
TRS 398
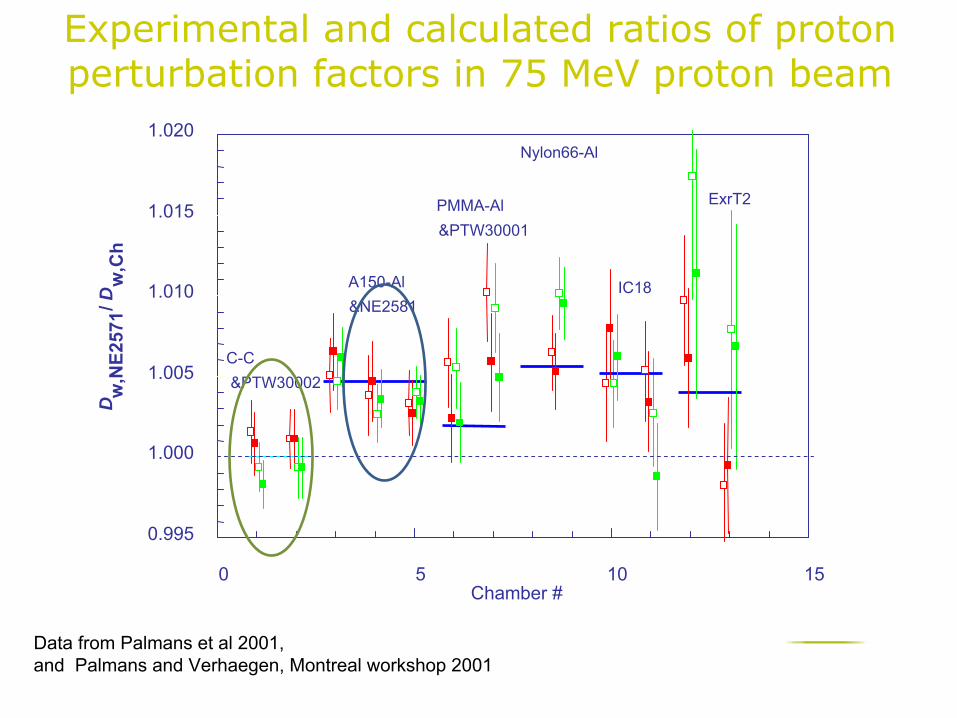
Experimental and calculated ratios of proton perturbation factors in 75 MeV proton beam
0.995
1.000
1.005
1.010
1.015
1.020
0 5 10 15Chamber #
D w,N
E257
1/ Dw
,Ch
C-C&PTW30002
A150-Al&NE2581
PMMA-Al&PTW30001
Nylon66-Al
IC18
ExrT2
Data from Palmans et al 2001, and Palmans and Verhaegen, Montreal workshop 2001

080915 18
Monte Carlo calculated pwall
and pcel
for Farmer type chambers in proton beam
0.997
0.998
0.999
1.000
1.001
0 50 100 150 200 250
proton energy / MeV
pce
l
aluminium central electrode graphite central electrode
0.994
0.996
0.998
1.000
1.002
0 50 100 150 200 250
proton energy / MeV
pce
l,Al /
pce
l,C
Monte Carlo
Medin et al. 1995
Palmans et al. 2001 - ND,w-based
Palmans et al. 2001 - NK-based
1.000
1.002
1.004
1.006
0 50 100 150 200 250
proton energy / MeV
pw
all
0.998
0.999
1.000A150
graphite
1.000
1.002
1.004
1.006
1.008
0 50 100 150 200 250
proton energy / MeV
pw
all,A
150
/ pw
all,C
A150
Palmans et al. 2001 - ND,w based
Palmans et al. 2001 - NK based
average
Details see in the poster by Palmans et al IAEA-CN182-230, this symposium.

Experimental kQ values (Medin et al., 2006)
•
Passive beam deliveryNE 2571: 1.021 ±
0.7%
FC65-G: 1.021 ±
0.7%
•
Scanning beamNE 2571:1.032 ±
1.2%
These values can be compared with the tabulated theoretical values from IAEA TRS-398,
which are 1.039 ±
1.7% for both chamber types
(details in the next presentation by J. Medin)
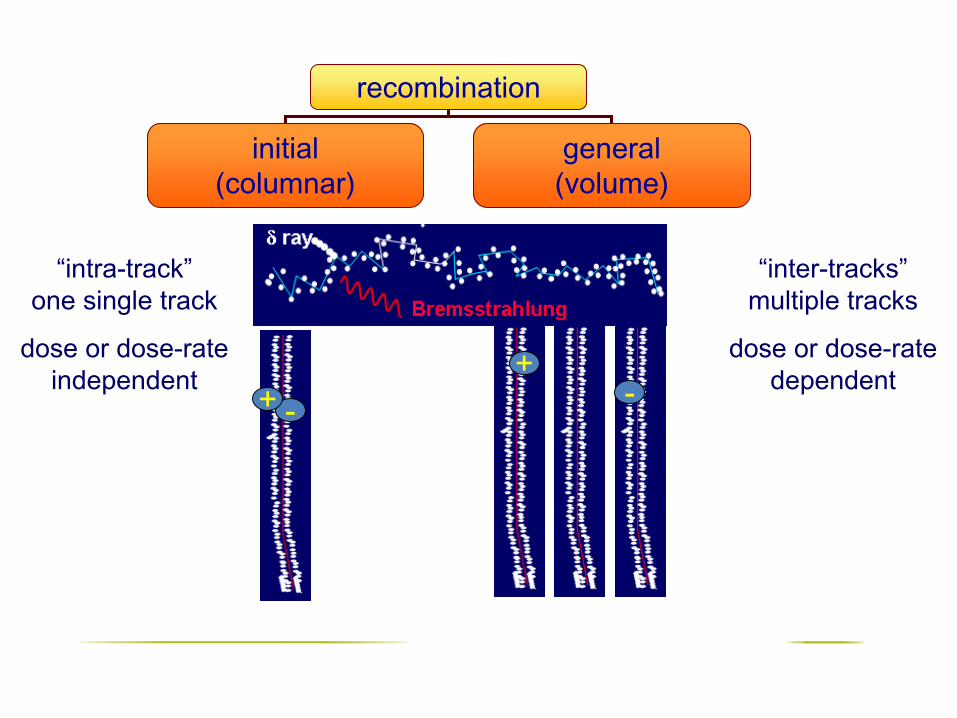
recombination
initial(columnar)
general(volume)
-++
-
“intra-track” one single track
dose or dose-rate independent
“inter-tracks” multiple tracks
dose or dose-rate dependent
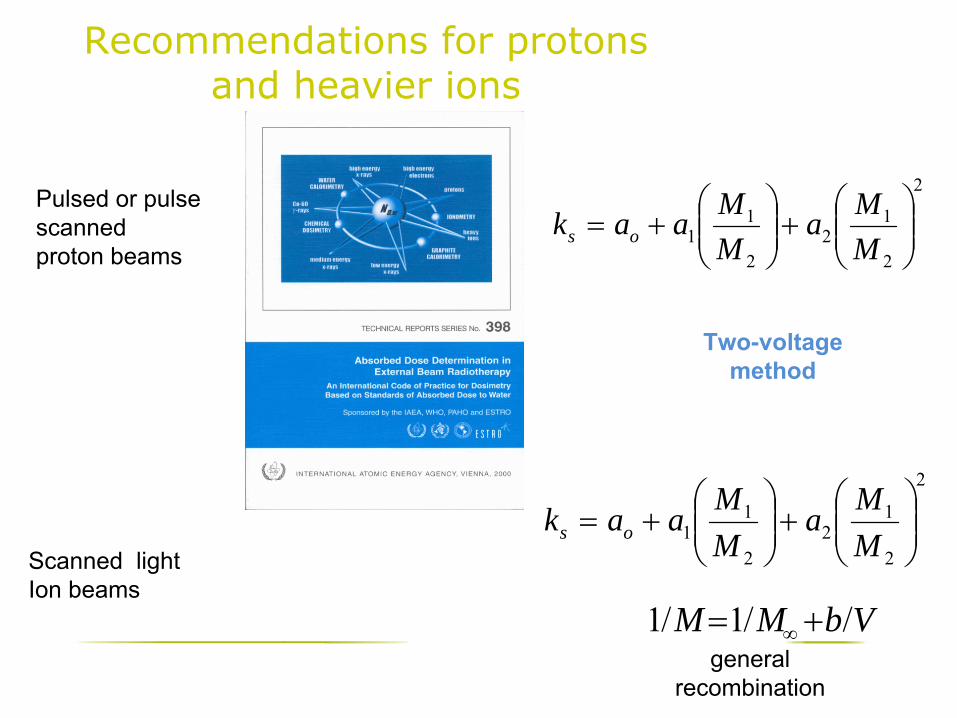
Recommendations for protons and heavier ions
Pulsed or pulse scanned proton beams
Two-voltage method
2
2
12
2
11 ⎟⎟
⎠
⎞⎜⎜⎝
⎛+⎟⎟
⎠
⎞⎜⎜⎝
⎛+=
MMa
MMaak os
VbMM //1/1 += ∞
Scanned lightIon beams
general recombination
2
2
12
2
11 ⎟⎟
⎠
⎞⎜⎜⎝
⎛+⎟⎟
⎠
⎞⎜⎜⎝
⎛+=
MMa
MMaak os
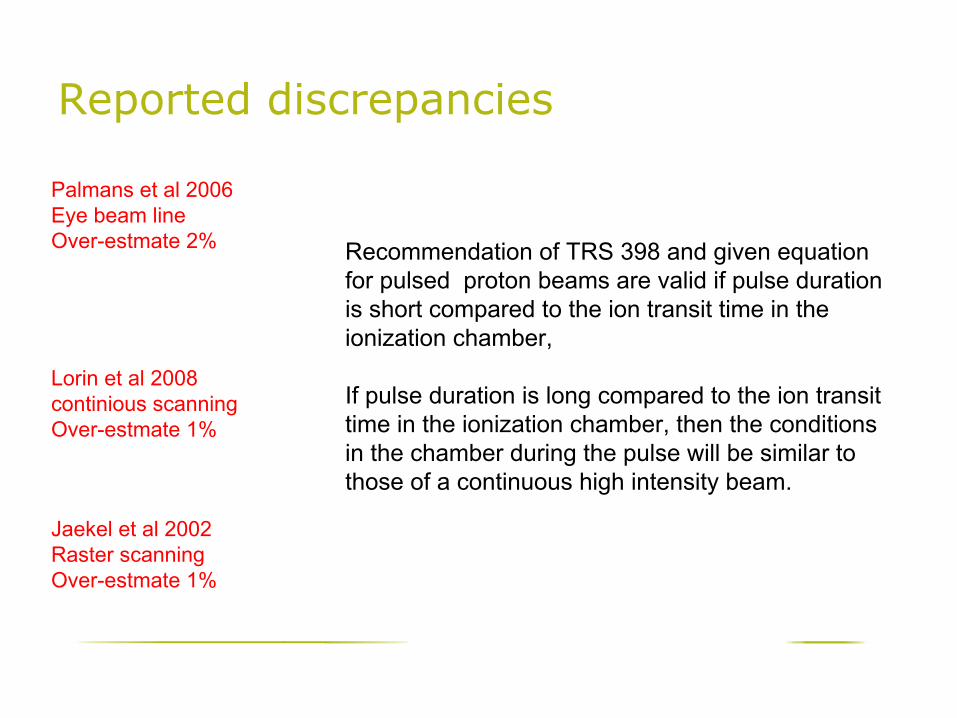
Reported discrepancies
Recommendation of TRS 398 and given equation for pulsed proton beams are valid if pulse duration is short compared to the ion transit time in the ionization chamber,
If pulse duration is long compared to the ion transit time in the ionization chamber, then the conditions in the chamber during the pulse will be similar to those of a continuous high intensity beam.
Palmans et al 2006Eye beam lineOver-estmate 2%
Lorin et al 2008continious scanningOver-estmate 1%
Jaekel et al 2002Raster scanningOver-estmate 1%
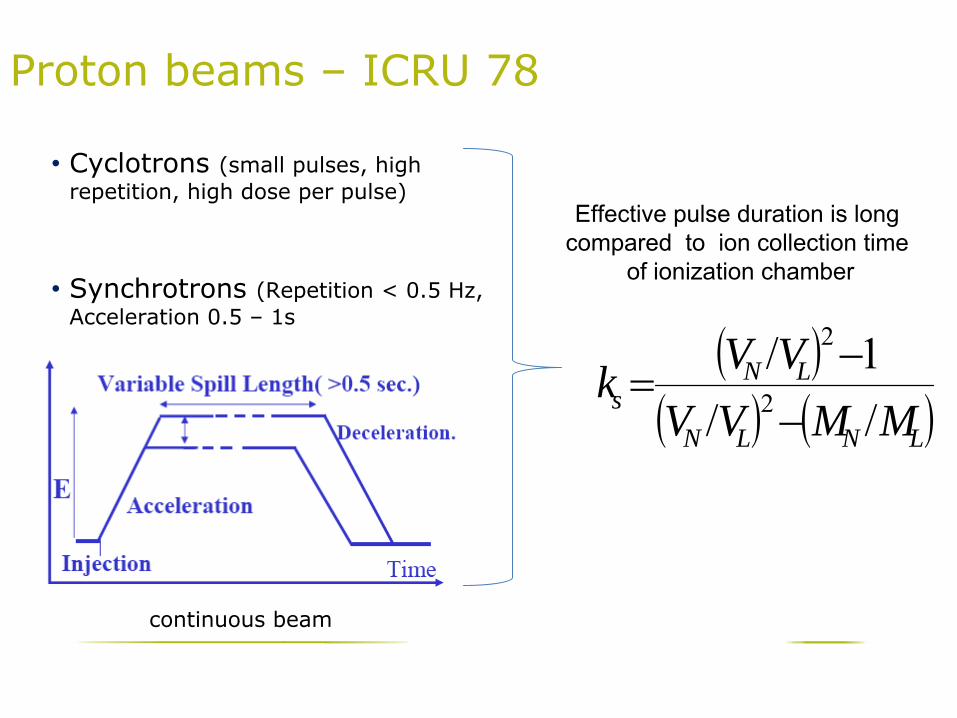
Proton beams –
ICRU 78
•
Cyclotrons (small pulses, high repetition, high dose per pulse)
•
Synchrotrons (Repetition < 0.5 Hz, Acceleration 0.5 –
1s
Effective pulse duration is long compared to ion collection time
of ionization chamber
continuous beam
( )( ) ( )LNLN
LNs MMVV
VVk//1/
2
2
−−
=
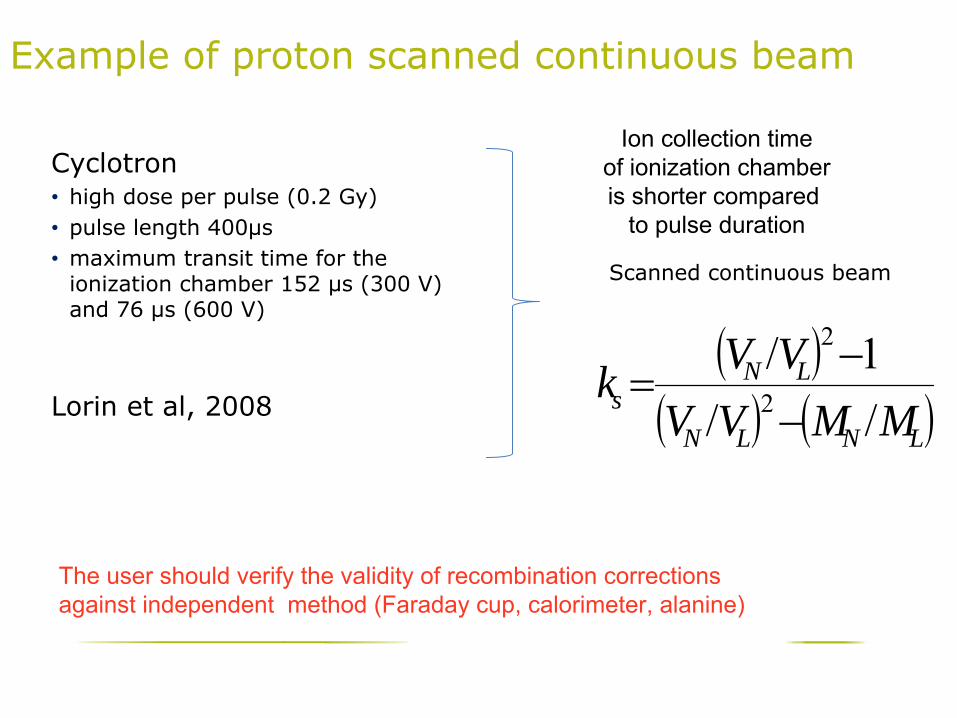
Example of proton scanned continuous beam
Cyclotron•
high dose per pulse (0.2 Gy)•
pulse length 400μs•
maximum transit time for the ionization chamber 152 μs (300 V) and 76 μs (600 V)
Lorin et al, 2008
Ion collection time of ionization chamber is shorter
compared
to pulse duration
Scanned continuous beam
( )( ) ( )LNLN
LNs MMVV
VVk//1/
2
2
−−
=
The user should verify the validity of recombination correctionsagainst independent method (Faraday cup, calorimeter, alanine)
Recommendations for scanned light ion beams
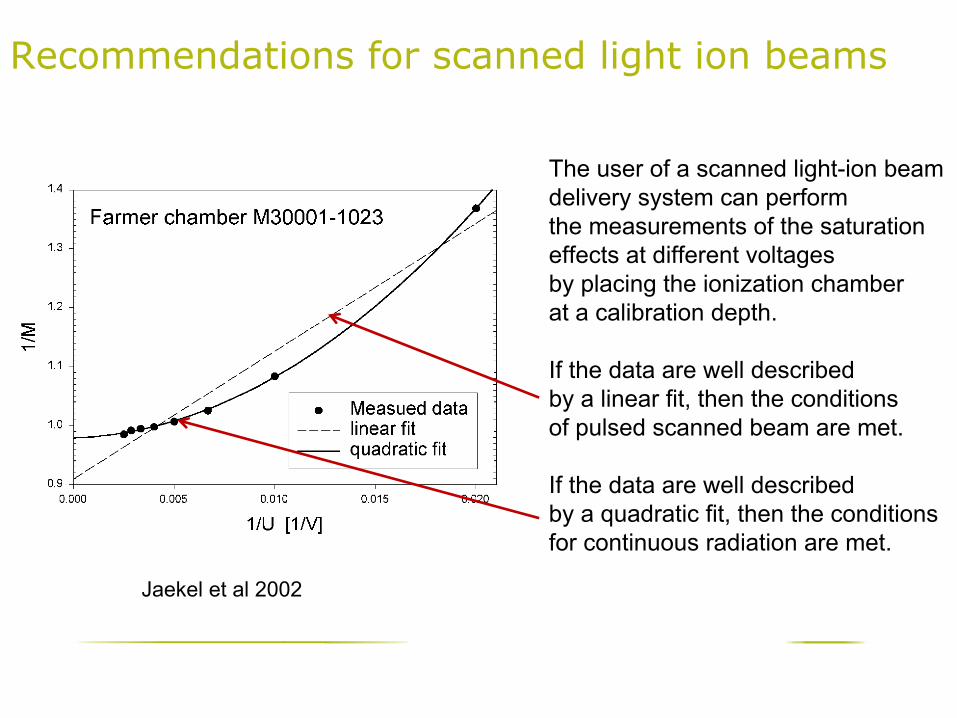
The user of a scanned light-ion beam delivery system can perform the measurements of the saturation effects at different voltages by placing the ionization chamber at a calibration depth.
If the data are well described by a linear fit, then the conditions of pulsed scanned beam are met.
If the data are well described by a quadratic fit, then the conditionsfor continuous radiation are met.
Jaekel et al 2002
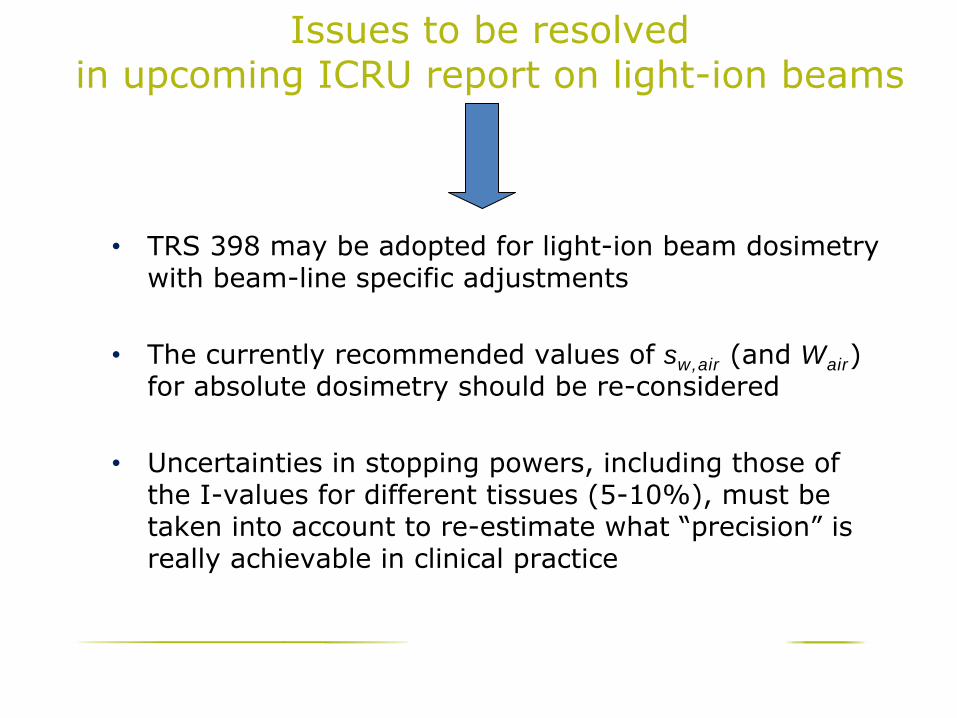
Issues to be resolved in upcoming ICRU report on light-ion beams
•
TRS 398 may be adopted for light-ion beam dosimetry with beam-line specific adjustments
•
The currently recommended values of sw,air (and Wair ) for absolute dosimetry should be re-considered
•
Uncertainties in stopping powers, including those of the I-values for different tissues (5-10%), must be taken into account to re-estimate what “precision”
is
really achievable in clinical practice
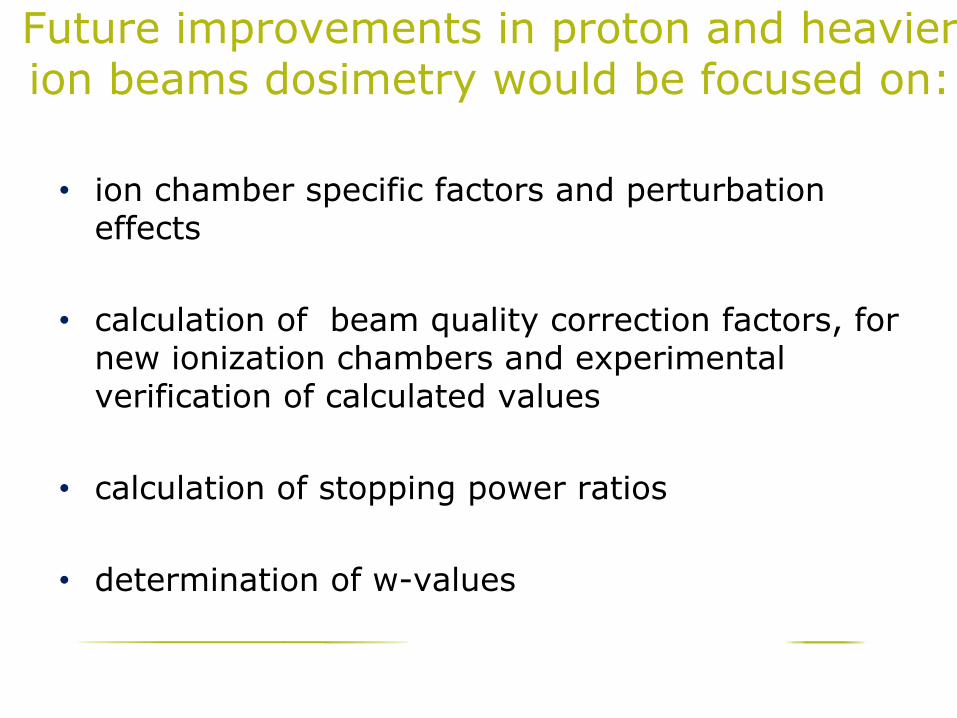
•
ion chamber specific factors and perturbation effects
•
calculation of beam quality correction factors, for new ionization chambers and experimental verification of calculated values
•
calculation of stopping power ratios
•
determination of w-values
Future
improvements in proton and heavier ion beams dosimetry would be focused on:
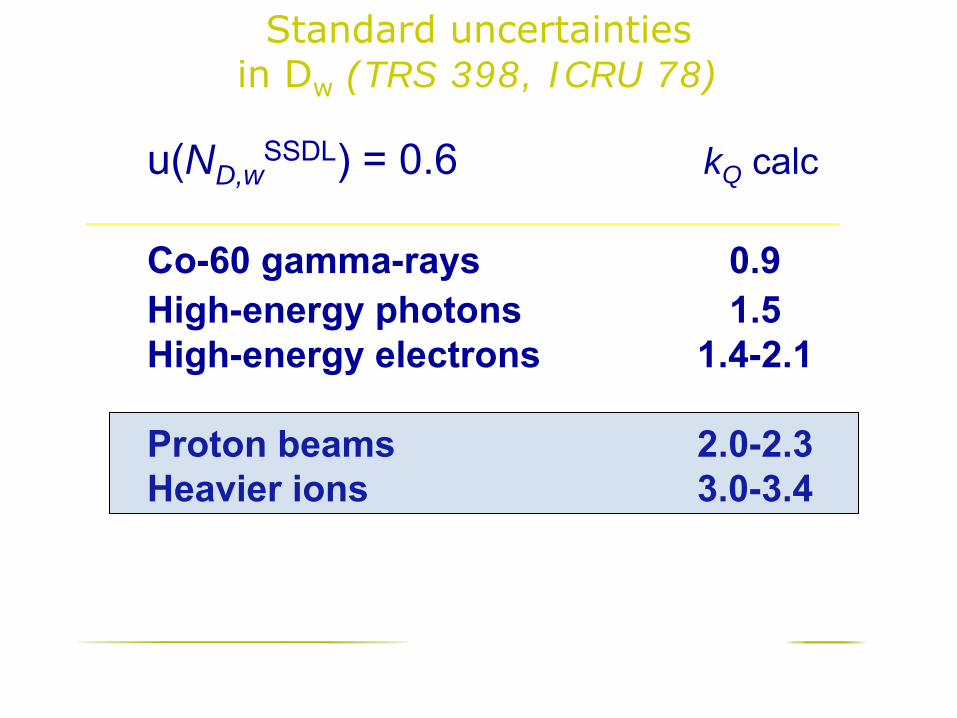
Standard uncertainties in Dw
(TRS 398, ICRU 78)
u(ND,wSSDL) = 0.6 kQ calc
Co-60 gamma-rays
0.9High-energy photons
1.5
High-energy electrons
1.4-2.1
Proton beams
2.0-2.3Heavier ions 3.0-3.4
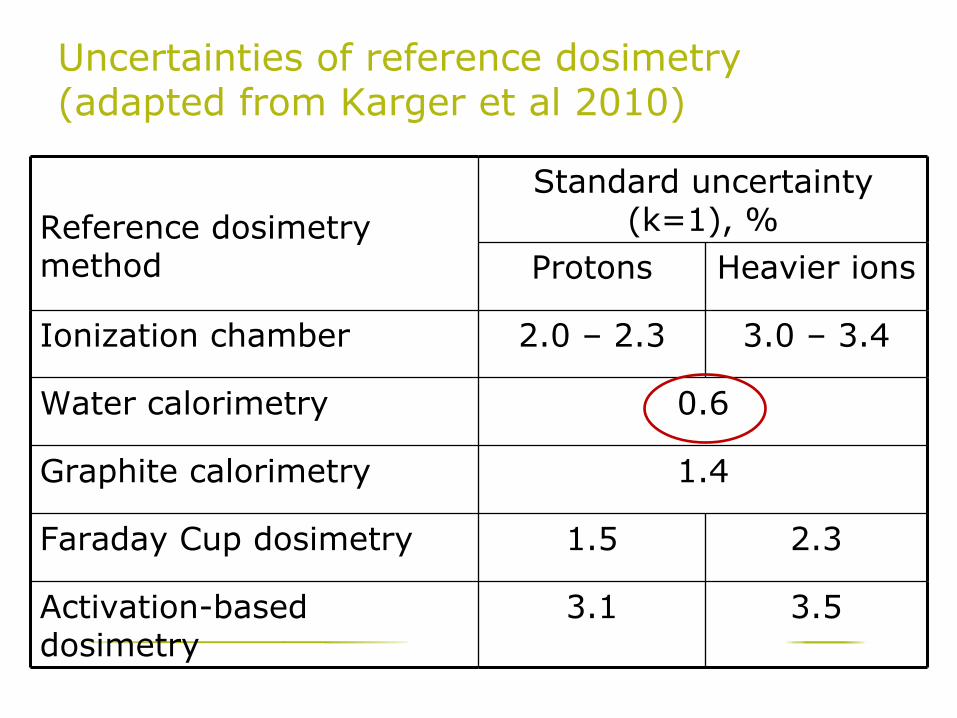
Uncertainties of reference dosimetry (adapted from Karger et al 2010)
Reference dosimetry method
Standard uncertainty (k=1), %
Protons Heavier ions
Ionization chamber 2.0 –
2.3 3.0 –
3.4
Water calorimetry 0.6
Graphite calorimetry 1.4
Faraday Cup dosimetry 1.5 2.3
Activation-based dosimetry
3.1 3.5

Implementation of ICRU Report 78IAEA TRS 398
ICRU Report xx provide a level of accuracycomparable to that
in calibration of photon and electron beams
harmonize clinical dosimetryat proton and heavier
ion beam facilities
Conclusion
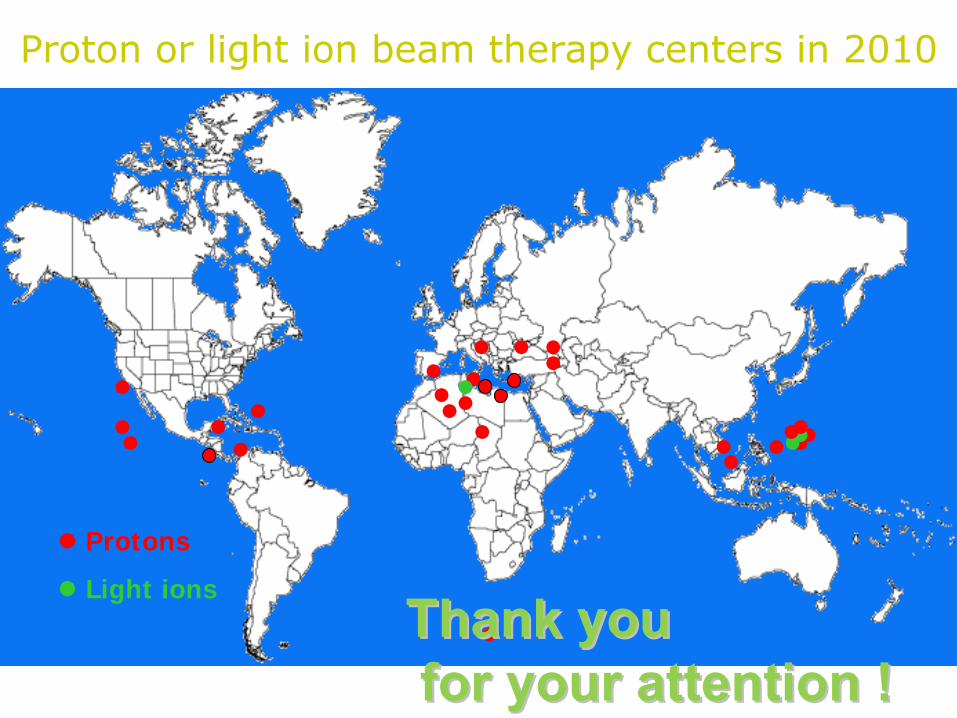
Proton or light ion beam therapy centers in 2010
Protons
Light ionsThank you Thank you for your attention !for your attention !