Embed Size (px)
Citation preview
REBOUND HARDNESS RESULTS FOR RAW MATERIAL
LOCATED NEAR PINNACLE POINT, SOUTH AFRICA
AND THE IMPLICATIONS THEREOF
by
CHRISTOPHER M. SHELTON
Presented to the Faculty of the Graduate School of
The University of Texas at Arlington in Partial Fulfillment
of the Requirements
for the Degree of
MASTER OF ARTS IN ANTHROPOLOGY
THE UNIVERSITY OF TEXAS AT ARLINGTON
May 2015

ii
Copyright © by Christopher M. Shelton 2015
All Rights Reserved

iii
Acknowledgements
I would first like to thank my advisor, Dr. Naomi Cleghorn, who first inspired and
encouraged my interest in southern African archaeology, and provided my first
opportunity for fieldwork in this region. Without her advising, teaching, encouragement,
and introduction to her professional networks, this study and my career would not have
been possible. For all of the knowledge and experience I have gained under her tutelage,
I will be eternally grateful.
I would especially like to thank Dr. Kyle Brown for providing me with this research
opportunity, and for supplying me with the quartzite and silcrete samples. I would like to
thank Dr. Curtis Marean for providing the opportunity to gain experience at Pinnacle
Point, and for allowing me to use his facilities. I would also like to thank the College of
Liberal Arts, the Department of Sociology and Anthropology, and the Ruch family for
providing the travel grants and scholarships which made this study and ensuing
conference presentations possible. I would like to thank Dr. Shelley Smith and Dr. Karl
Petruso for their time and patience on my thesis board. I would like to acknowledge Eric
Cleveland and Dr. Yu Xinbao for allowing me to use their labs and equipment. I would
also like to thank Dr. Scott Ingram who has always found the time to provide feedback on
my work and has encouraged me along the way
Finally, I would like to thank my family. Without the love, encouragement, and
support from my mother (Susan Shelton), my father (Terry Shelton), my aunt (Marcia
Boswank), and my uncle (Steve Boswank), this thesis would not have been possible.
Most importantly, I would like to express my deepest appreciation and love for Elizabeth
Nelson and Isaac Weston, who provided me with love, encouragement, support, and
immeasurable patience through the entire thesis process.
April 1, 2015
iv
Abstract
REBOUND HARDNESS RESULTS FOR RAW MATERIAL
LOCATED NEAR PINNACLE POINT, SOUTH AFRICA
AND THE IMPLICATIONS THEREOF
Student Christopher M. Shelton, M.A.
The University of Texas at Arlington, 2015
Supervising Professor: Naomi Cleghorn
The focus of this study is to test our ability to glean ancient human behavioral
ecology data through a specific form of raw material mechanical properties testing.
Through the quantitative analysis of raw material in regards to knapping quality (hereafter
referred to as knappability), collection processes and choice patterns of a study group
can be inferred. More precisely, this study serves to test the viability of the use of the
Schmidt hammer as a means of determining knappability, with the area in and around
Pinnacle Point (Western Cape, South Africa) as the focus area and silcrete and quartzite
as the focus lithologies. In the course of this study, it was found that the use of the
Schmidt hammer as a testing device and Young’s modulus of elasticity as a quantitative
measure of knappability should be discounted from future knappability studies. Finally,
this study also demonstrates that the massive silcrete located in the vicinity of Pinnacle
Point occurs in more than one form, which could have had implications for ancient raw
material selection and affects the future use of silcrete source locations as a variable in
agent based modeling and behavioral ecology studies in general.
v
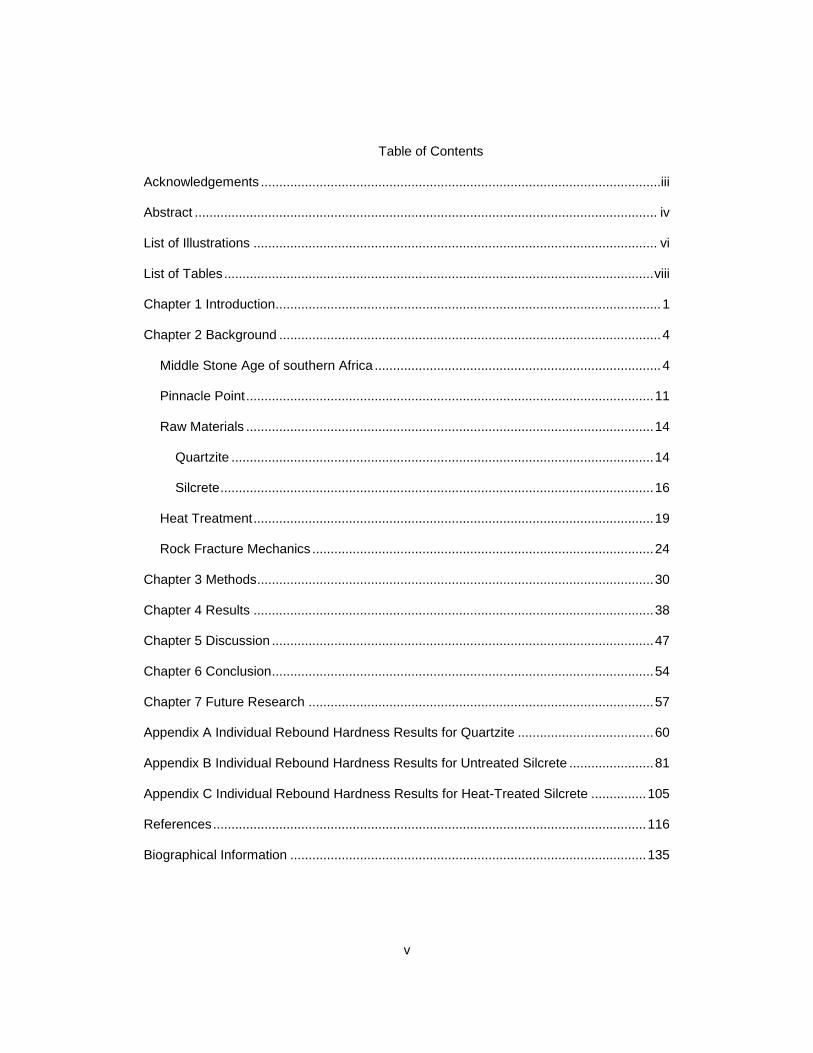
Table of Contents
Acknowledgements .............................................................................................................iii
Abstract .............................................................................................................................. iv
List of Illustrations .............................................................................................................. vi
List of Tables ..................................................................................................................... viii
Chapter 1 Introduction......................................................................................................... 1
Chapter 2 Background ........................................................................................................ 4
Middle Stone Age of southern Africa .............................................................................. 4
Pinnacle Point ............................................................................................................... 11
Raw Materials ............................................................................................................... 14
Quartzite ................................................................................................................... 14
Silcrete ...................................................................................................................... 16
Heat Treatment ............................................................................................................. 19
Rock Fracture Mechanics ............................................................................................. 24
Chapter 3 Methods ............................................................................................................ 30
Chapter 4 Results ............................................................................................................. 38
Chapter 5 Discussion ........................................................................................................ 47
Chapter 6 Conclusion ........................................................................................................ 54
Chapter 7 Future Research .............................................................................................. 57
Appendix A Individual Rebound Hardness Results for Quartzite ..................................... 60
Appendix B Individual Rebound Hardness Results for Untreated Silcrete ....................... 81
Appendix C Individual Rebound Hardness Results for Heat-Treated Silcrete ............... 105
References ...................................................................................................................... 116
Biographical Information ................................................................................................. 135

vi
List of Illustrations
Figure 1 (from Thompson et al., 2010). Typical MSA lithics found at Pinnacle Point
(cave PP13B). ..................................................................................................................... 4
Figure 2 Normalized comparison of the occurrence of quartzite and silcrete in the
Pinnacle Point cave 13B record (162 kya through ~90 kya), broken down by aggregate
(youngest on left). This is based on data from Thompson et al., 2010. .............................. 5
Figure 3 Normalized comparison of the occurrence of quartzite and silcrete in the
Pinnacle Point cave 5/6 record (90 kya through 54 kya), broken down by aggregate
(youngest on left). This is based on data from Brown, 2011. ............................................. 6
Figure 4 (from Brown et al., 2012) Tools found at the top of the figure (DBCS aggregate)
are typical Howieson’s Poort lithics from Pinnacle Point (Cave PP5/6). The Lower tools
(SADBS aggregate) are typical backed blades from the unnamed microlithic industry at
Pinnacle Point. .................................................................................................................... 7
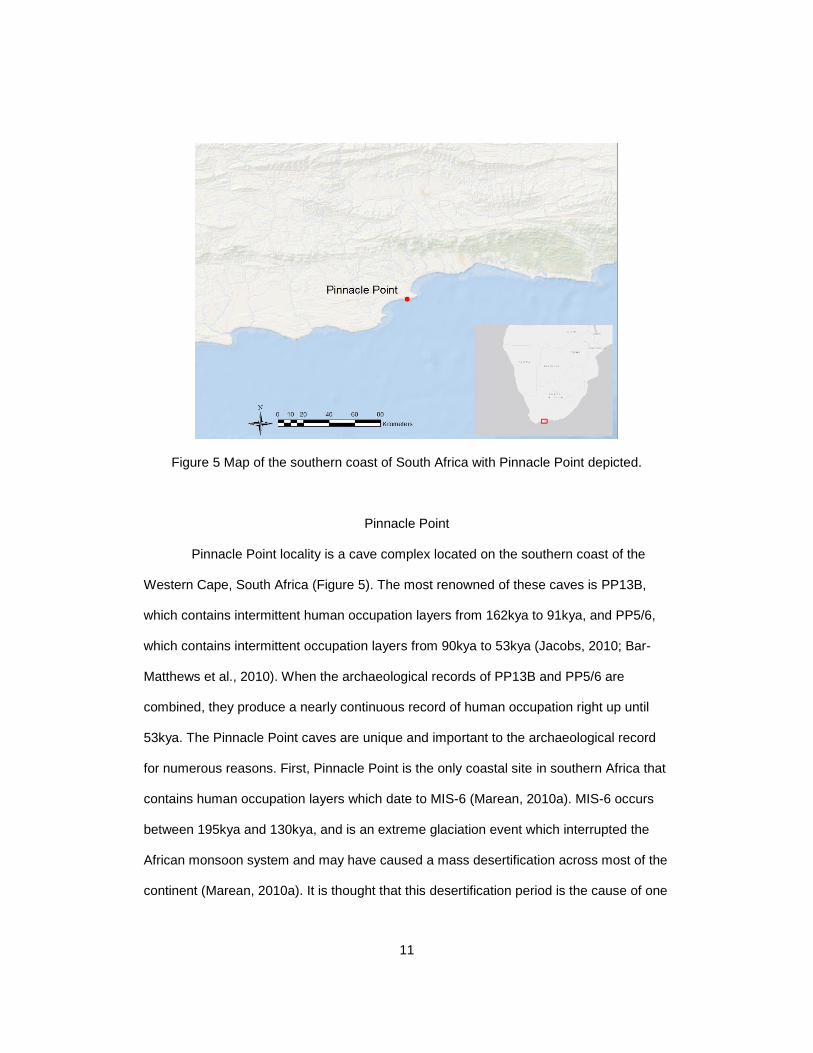
Figure 5 Map of the southern coast of South Africa with Pinnacle Point depicted. .......... 11
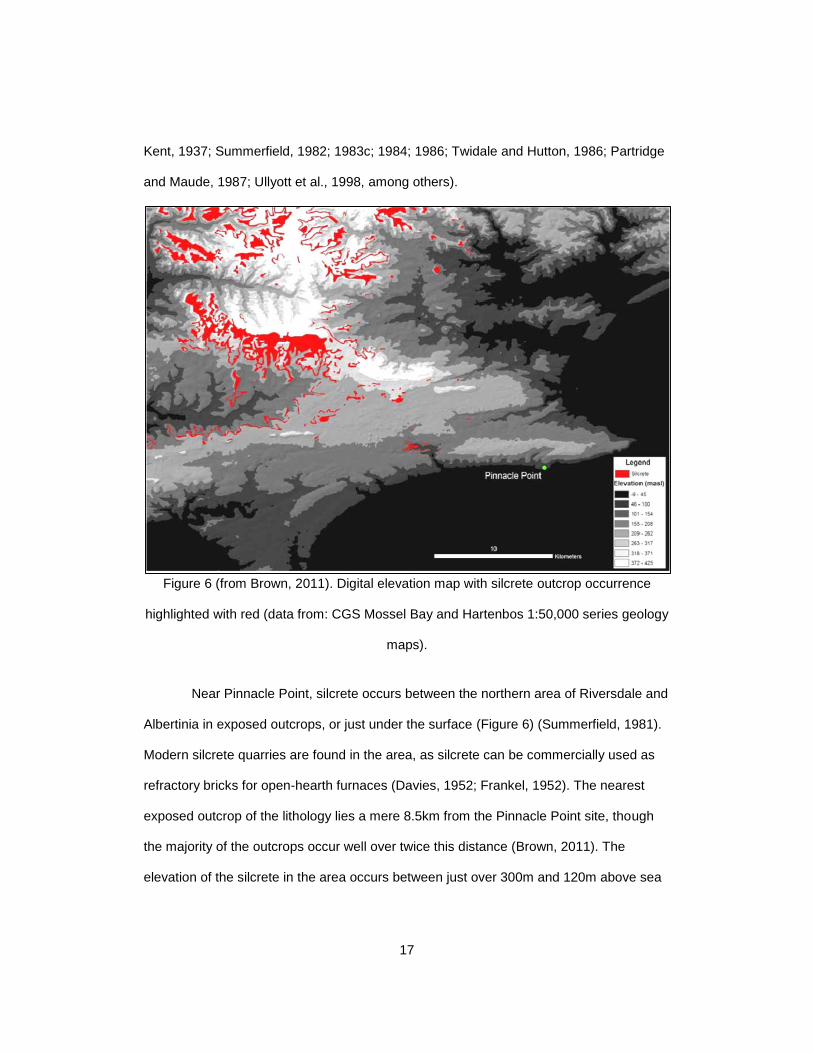
Figure 6 (from Brown, 2011). Digital elevation map with silcrete outcrop occurrence
highlighted with red (data from: CGS Mossel Bay and Hartenbos 1:50,000 series geology
maps). ............................................................................................................................... 17
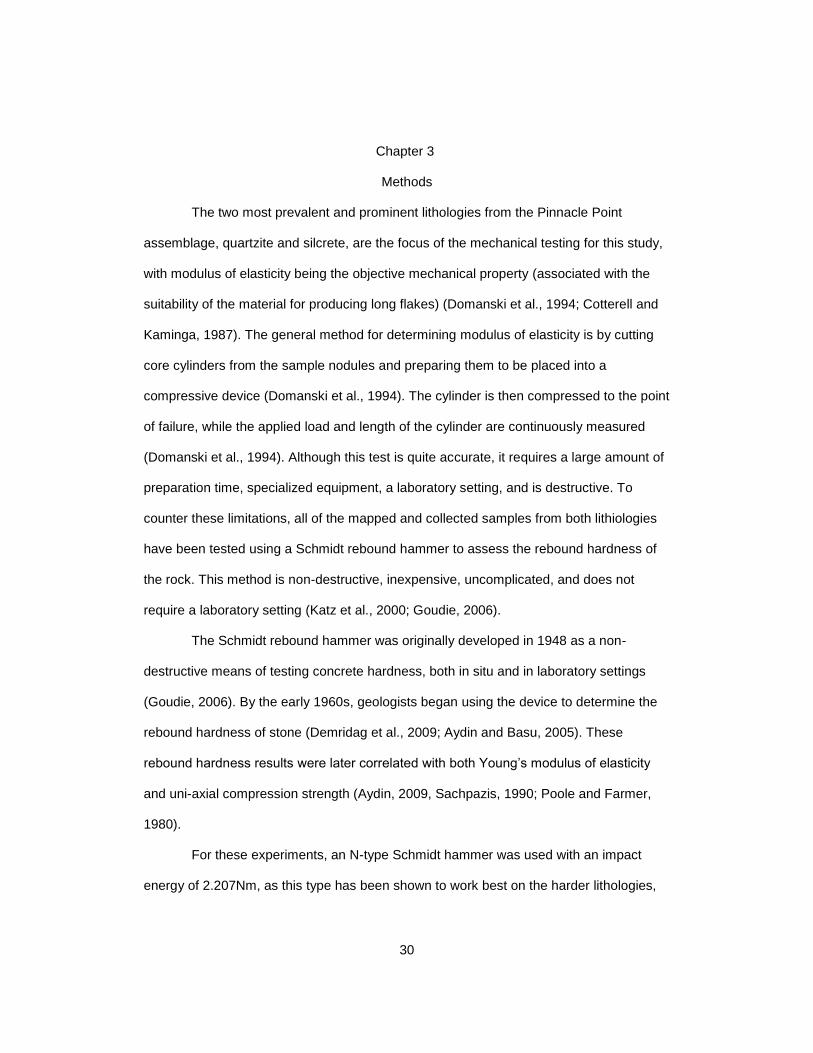
Figure 7 (from Shariati et al., 2011). Depicts the operational system of the Schmidt
Rebound Hammer. ............................................................................................................ 31
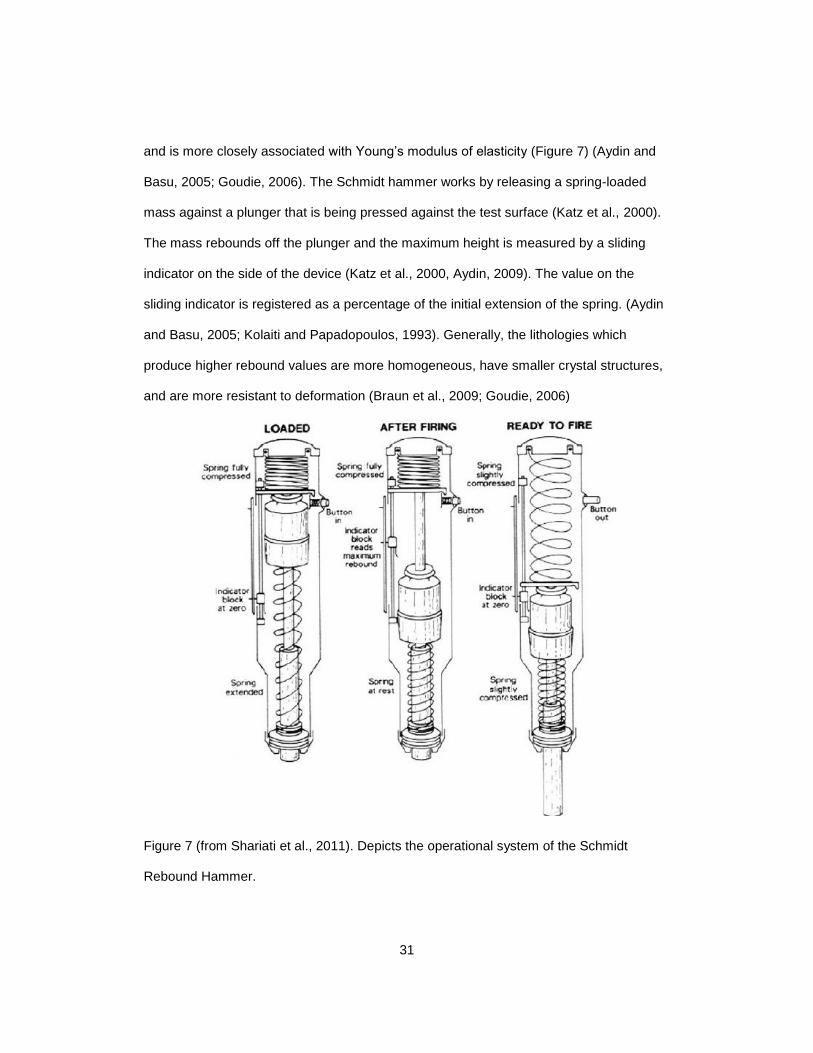
Figure 8 The author using the Schmidt Rebound Hammer in Terracon Labs; Fort Worth,
Texas (photo by Zachary Overfield). ................................................................................. 32
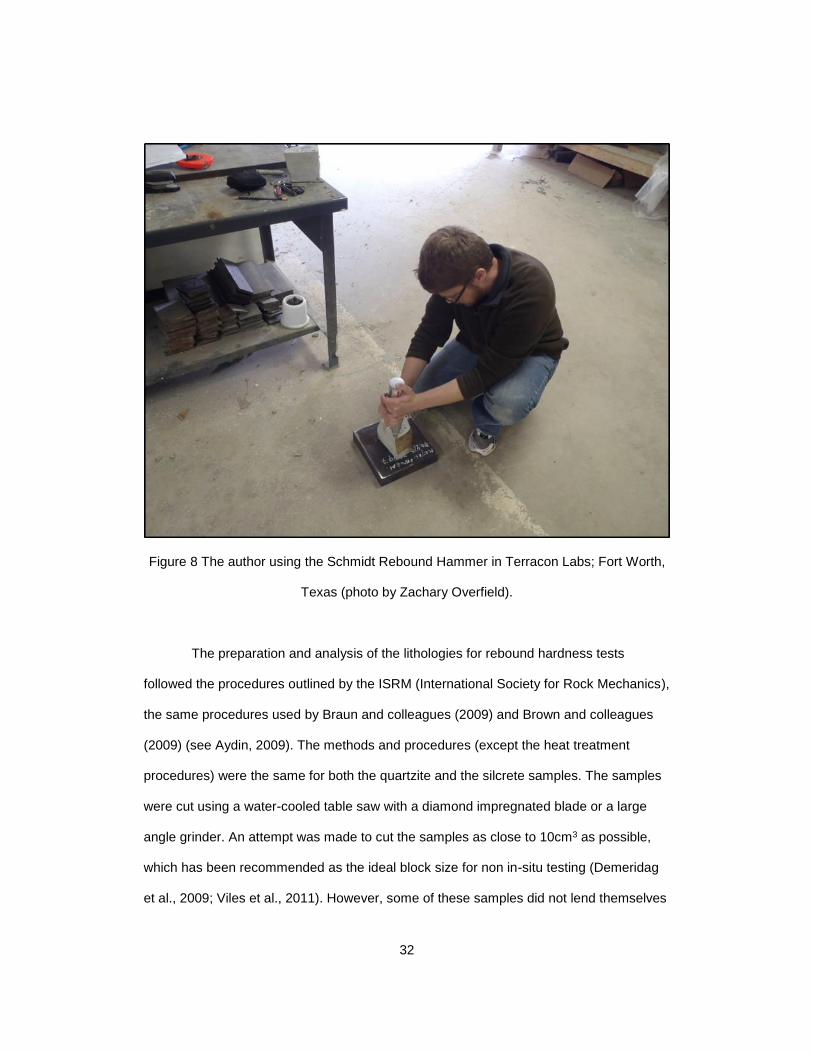
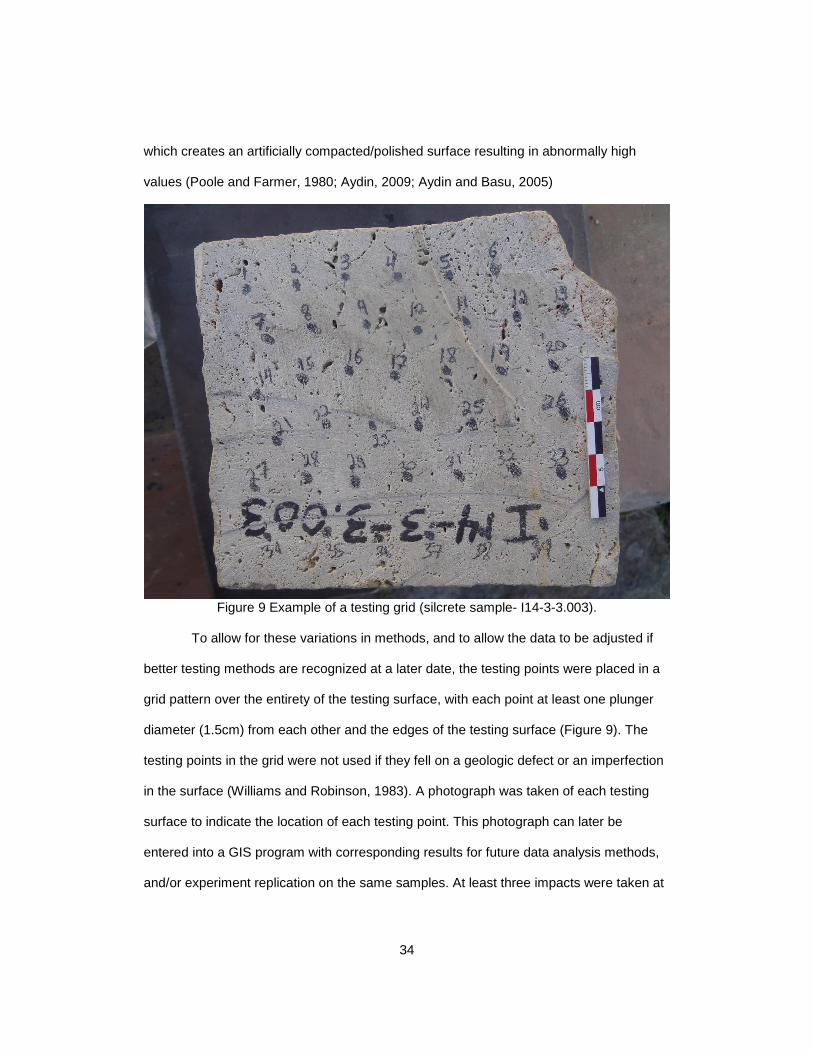
Figure 9 Example of a testing grid (silcrete sample- I14-3-3.003). ................................... 34
Figure 10 Box and whisker plot comparison of the quartzite, untreated silcrete, and heat-
treated silcrete results of this study, to the results published by Brown, 2011 ................. 40

vii
Figure 11 C-clamps holding aluminum tension bars, clamping sample to steel base. This
methods was used on three samples during testing in Fort Worth, as discussed in text. 44
Figure 12 Flaked sample exhibiting the color change and luster associated with proper
heat treatment according to Brown and colleagues (2009). ............................................. 47
viii
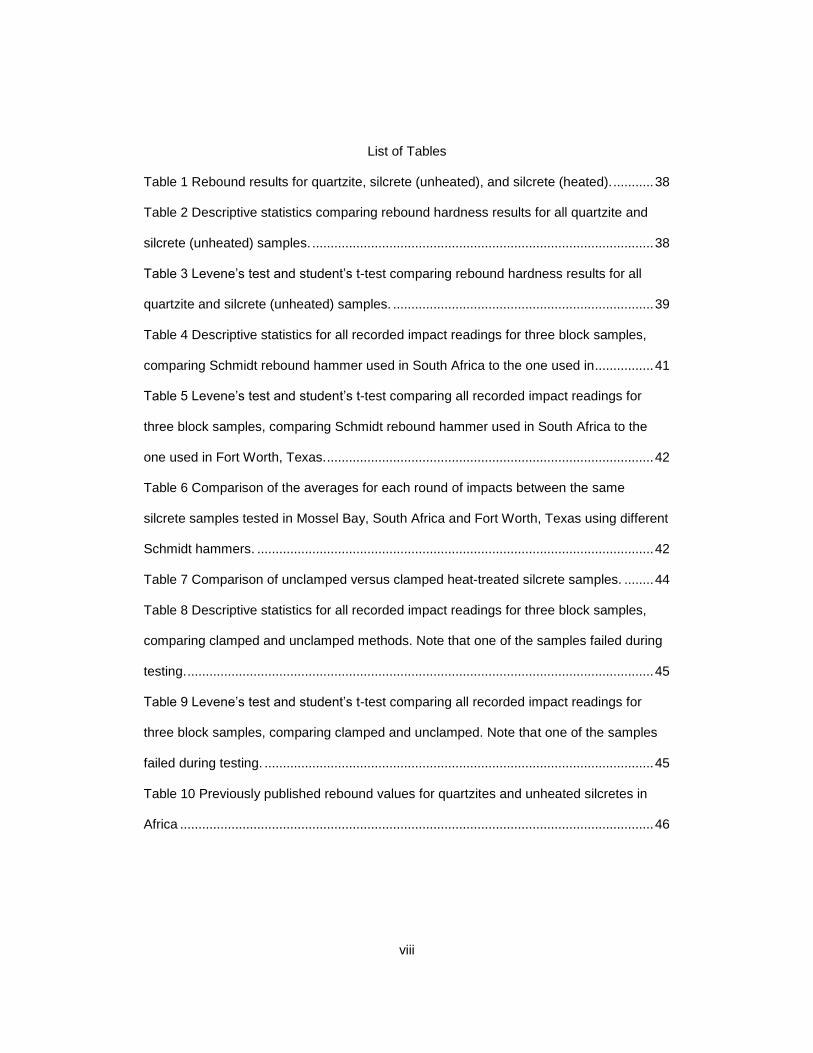
List of Tables
Table 1 Rebound results for quartzite, silcrete (unheated), and silcrete (heated). ........... 38
Table 2 Descriptive statistics comparing rebound hardness results for all quartzite and
silcrete (unheated) samples. ............................................................................................. 38
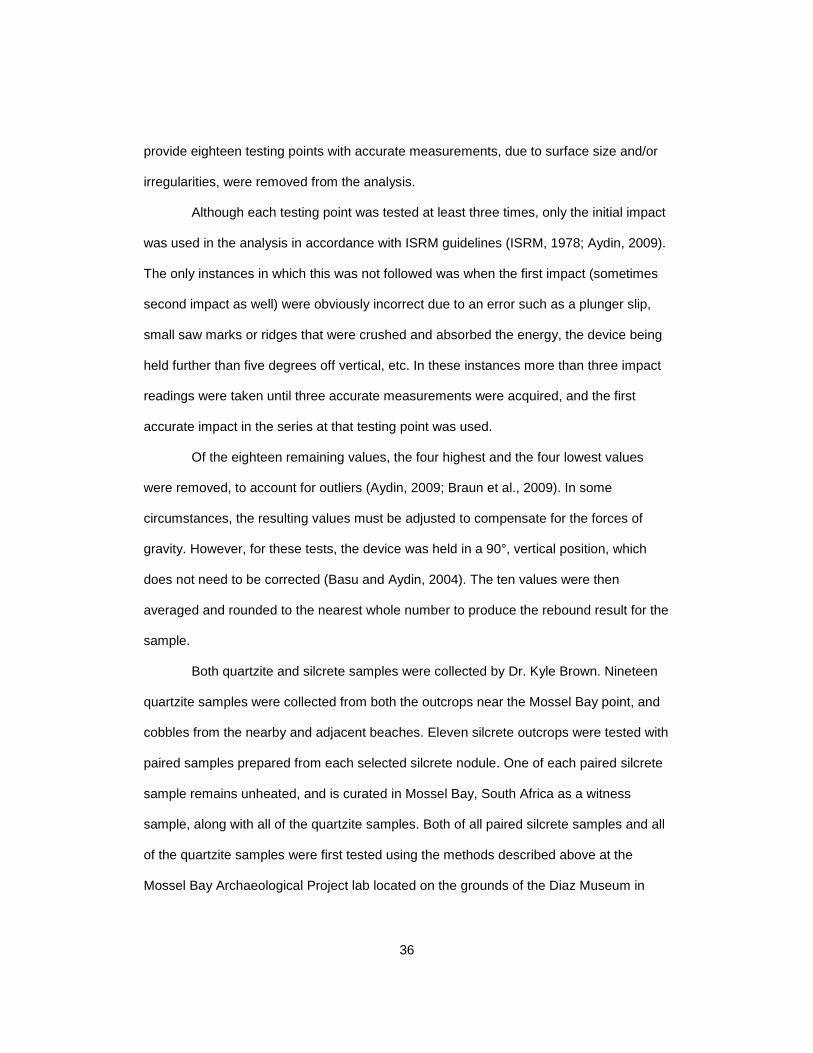
Table 3 Levene’s test and student’s t-test comparing rebound hardness results for all
quartzite and silcrete (unheated) samples. ....................................................................... 39
Table 4 Descriptive statistics for all recorded impact readings for three block samples,
comparing Schmidt rebound hammer used in South Africa to the one used in................ 41
Table 5 Levene’s test and student’s t-test comparing all recorded impact readings for
three block samples, comparing Schmidt rebound hammer used in South Africa to the
one used in Fort Worth, Texas. ......................................................................................... 42
Table 6 Comparison of the averages for each round of impacts between the same
silcrete samples tested in Mossel Bay, South Africa and Fort Worth, Texas using different
Schmidt hammers. ............................................................................................................ 42
Table 7 Comparison of unclamped versus clamped heat-treated silcrete samples. ........ 44
Table 8 Descriptive statistics for all recorded impact readings for three block samples,
comparing clamped and unclamped methods. Note that one of the samples failed during
testing. ............................................................................................................................... 45
Table 9 Levene’s test and student’s t-test comparing all recorded impact readings for
three block samples, comparing clamped and unclamped. Note that one of the samples
failed during testing. .......................................................................................................... 45
Table 10 Previously published rebound values for quartzites and unheated silcretes in
Africa ................................................................................................................................. 46
1
Chapter 1
Introduction
The Middle Stone Age record in Southern Africa is a period of increasing
technological variability in stone tool technology and lithic raw material selection (McCall,
2006; Thompson et al., 2010; Wurz, 2002; Minichillo, 2006). The lithic record fluctuates
between low and high quality raw materials and frequent concomitant shifts between
larger flaked tools and small, technologically complex microliths and bifaces (McCall,
2006; Minichillo, 2006). These shifts are both diachronic and geographic. We can
investigate the human decision making processes that resulted in this variability in terms
of a cost-benefit analysis. Specifically, we can model the trade-offs early humans would
have faced in terms of raw material procurement, transport distance, processing effort
(particularly that related to heat treatment), tool use-life and edge durability, and flexibility
of tool design.
To address this problem, mechanical properties testing can be employed to
determine the characteristics of the available raw materials that might have influenced
human choice. These data can then be integrated into a geographic analysis of raw
material sources relative to known Middle Stone Age sites. Recent research
demonstrates that ancient stone tool makers may have chosen raw materials on the
basis of two fundamental mechanical characteristics: the ease and predictability with
which the material can be flaked and the ability of the material to maintain a sharp edge
(Braun et al., 2009; Domanski et al., 1994; Yonekura and Suzuki, 2009). These
mechanical properties can be quantified and integrated with geographic source locations
to model raw material costs. With this research, we can better understand the choice
patterns of some of the first modern humans, and possibly add another line of evidence
which will ultimately allow us to explain and understand the anomalous technological

2
appearances of the Still Bay industry, the Howieson’s Poort industry, and other microlithic
industries which were precocious in comparison to the previous and subsequent stone
tool technologies (Volman, 1981; Lombard, 2005, 2009; Brown et al., 2012).
The Pinnacle Point site on the southern coast of South Africa was chosen as the
focus of this study due to the chronological span of the MSA sediments (occupation
layers ranging from 162kya to 54ky) and the variability of the lithic record (fluctuating
between coarse-grained and fine-grained material) (Marean, 2010a; Brown et al., 2009,
2012; Thompson et al., 2010). The two principal raw material lithologies in the Pinnacle
Point assemblage are quartzite and silcrete (Brown, 2011). Silcrete is non-local relative to
quartzite, and is consistently heat-treated throughout the record to produce a more
knappable material (Brown et al., 2009; Brown, 2011). The heat treatment of silcrete
appears with the earliest human occupation layers at Pinnacle Point(162kya), and is the
earliest known archaeological evidence for this practice. Yet, heat treatment is not a
permanent feature in the record (Brown et al., 2009; 2012). In fact, the lithic record at
Pinnacle Point fluctuates between the local coarse-grained quartzite and the heat-treated
exotic silcrete sporadically until the final occupation layer at 54kya (Brown et al., 2009;
Thompson et al., 2010). Not only does heat-treated silcrete fluctuate in intensity, but
towards the later MSA, technologically advanced microlithic industries made on heat-
treated silcrete appear and disappear in the record as well (Brown et al., 2009, 2012;
Marean, 2010a; Thompson et al., 2010).
It is the seemingly erratic lithic shifts in the record that are the focus of this study.
If the knappability of the available raw materials (both in raw and heat-treated form)
around Pinnacle Point can be quantitatively ranked through mechanical properties
testing, the results can be compared to gathering costs (based on distance from site to
source) in a cost-benefit model. The data from this model can be compared to the shifts

3
in the lithic record, and an investigation for trends can be conducted when assessed with
the less proximate factors (and possible drivers), such as paleoclimate, paleoecology,
sea level and coast proximity, estimated population density, availability of firewood, etc.
To produce such a model, sound methods for quantifying the knappability of raw material
must be employed. The purpose of the following study is to evaluate methods published
by Braun and colleagues (2009) as a first step in creating such a model.
4
Chapter 2
Background
Middle Stone Age of southern Africa
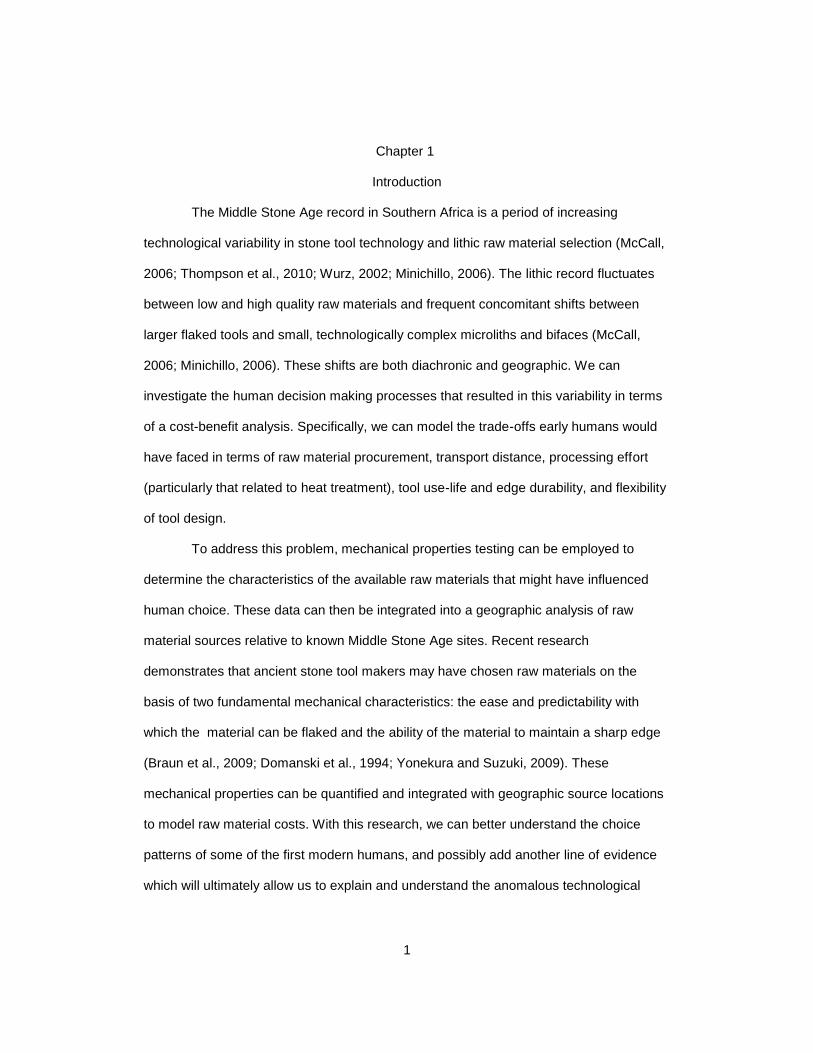
Figure 1 (from Thompson et al., 2010). Typical MSA lithics found at Pinnacle Point
(cave PP13B).
The Middle Stone Age (MSA) was first described by Goodwin and Van Riet Lowe
in 1929, and is characterized by the presence of prepared core tool technology (Figure
1). Many of the cores produced during the MSA are prepared in such a way as to yield
recurrent tools of similar shape and size with little to no platform preparation, such as
blades and points (McBrearty and Brooks, 2000). MSA cores were also prepared in such
a way as to produce one preferential flake (blank) at a time, which is known as Levallois
technology (Klein, 2009). These technologies stand in stark contrast to the Earlier Stone
5
Age (ESA) technology of large bifacial tools, and the Later Stone Age (LSA) technology
characterized by microliths made predominantly on exotic raw material (McBrearty and
Brooks, 2000). The dates for the genesis and termination of the MSA are both highly
debated, with a dearth of well dated sites and no clear shift boundary on either end.
However, for the purpose of this study, the MSA will be defined as 250kya to 40kya
(Klein, 2009)
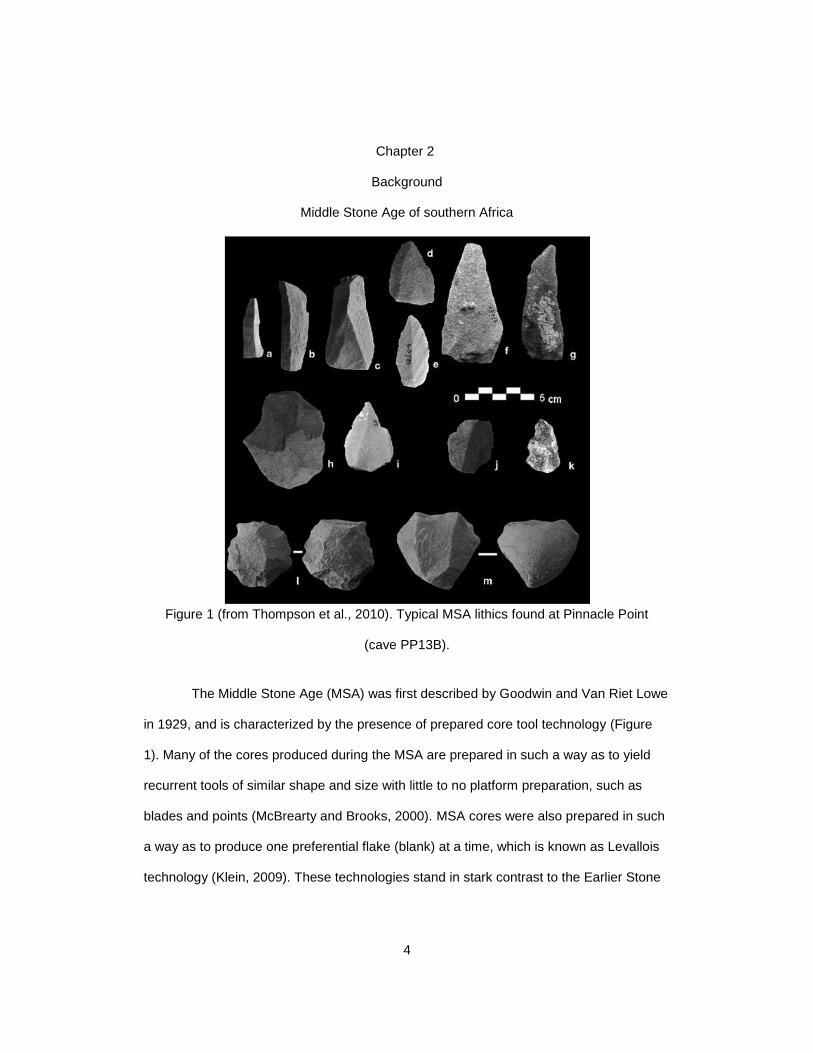
Figure 2 Normalized comparison of the occurrence of quartzite and silcrete in the
Pinnacle Point cave 13B record (162 kya through ~90 kya), broken down by aggregate
(youngest on left). This is based on data from Thompson et al., 2010.
Early humans on the southern coast of Africa had few choices for flaked stone
raw materials. During most of the Middle Stone Age, they principally exploited locally
abundant quartzite, generally in the form of beach cobbles or proximate outcrops
(Thompson and Marean, 2008; Avery et al., 1997; Thompson et al., 2010; Thackeray,
1989; Minichillo, 2006). However, exotic, fine-grained material (such as silcrete or
chalcedony) is present in some capacity throughout many occupational assemblages,

6
and seems to fluctuate in intensity through the record ( see Figures 2 and 3 for the
Pinnacle Point record) (Brown, 2011; Wurz, 2002; Minichillo, 2006; Brown et al., 2009;
Thompson, 2010).
Figure 3 Normalized comparison of the occurrence of quartzite and silcrete in the
Pinnacle Point cave 5/6 record (90 kya through 54 kya), broken down by aggregate
(youngest on left). This is based on data from Brown, 2011.
Through most of the MSA, the above mentioned prepared core technology
changed very little, save for a gradual trend of the tools becoming slightly smaller
(Volman, 1981). However, this continuity seems to be interrupted near the end of the
MSA with a number of shifts in technology which occur concurrently with dramatic
increases in the use of exotic materials, only to be replaced by the previous, less intricate
technology (Brown, 2011; Minichillo, 2006; Wurz, 2002; Brown et al., 2012).
The first of the major technological shifts away from the general prepared core
technology of the MSA is the Still Bay industry (which is not present at Pinnacle Point)
7
(Henshilwood et al., 2001). Still Bay is characterized by bifacial, foliate shaped points
made on exotic material (Henshilwood et al., 2001; Tribolo et al., 2005; Brown et al.,
2009). This industry is present in several sites in South Africa, but is best represented,
and firmly dated at Blombos cave between 76.8 and 72.7kya (Henshilwood and Dubreuil,
2011; Jacobs et al., 2006; 2013). Recently, Tribolo and colleagues (2013) have argued
for an earlier beginning to the Still Bay at 109kya, however this date is inconsistent with
all other Still Bay occurrences.
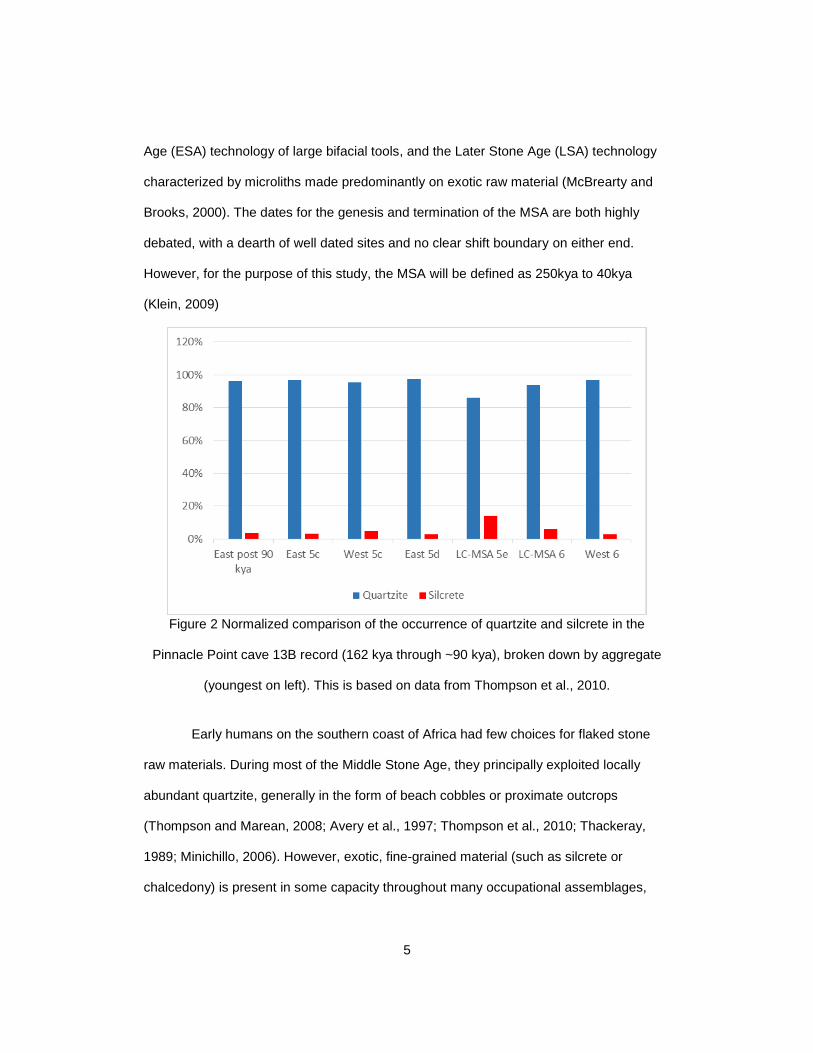
Figure 4 (from Brown et al., 2012) Tools found at the top of the figure (DBCS aggregate)
are typical Howieson’s Poort lithics from Pinnacle Point (Cave PP5/6). The Lower tools
(SADBS aggregate) are typical backed blades from the unnamed microlithic industry at
Pinnacle Point.
At Pinnacle Point site 5/6, a microlithic technology appears around 71.3kya
(Figure 4) (Brown et al., 2012). This microlithic technology is quite advanced, as it is
statistically thinner and smaller than the microliths produced in the following Howieson’s
Poort microlithic industry (Brown et al., 2012). As of yet, this technological shift is
unnamed, and has only been found at Pinnacle Point.
8
The most prominent and enigmatic of the shifts in stone technology and material
is the Howieson’s Poort industry. The Howieson’s Poort occurs widely across Southern
Africa, between 64.8 kya and 59.5 kya, and is present at Pinnacle Point (Jacobs et al.,
2008). The industry is characterized by small retouched blades, and is generally made
from exotic, fine-grained stone material (Klein, 2009; Lombard, 2005, 2009; Minichillo,
2006). The sophistication of Howieson’s Poort stone tools seems to anticipate tools that
are found much later in the African LSA (after forty thousand years ago). The Howieson’s
Poort is relatively short lived (only lasting approximately five thousand years), and
subsequent industries return to an emphasis on simpler flaked tools made largely from
quartzite (Klein, 2009; Jacobs et al., 2008; Minichillo, 2006).
Raw material selection appears to be correlated with major shifts in technology.
Some have argued that coarse-grained material, such as beach cobble quartzite,
although plentiful in the region, lacks the fine flaking qualities required for the microlithic
technology of the Howieson`s Poort and the other technological shifts (Brown et al.,
2009; Brown, 2001; Lombard, 2005; Minichillo, 2006). By comparison, quartzite-based
technologies are low cost because materials are locally abundant and do not require
alteration (Mackay et al., 2014; Minichillo, 2006; Brown et al., 2009; Brown, 2011). Exotic
materials, such as silcrete and chalcedony, likely had higher search and transport costs
(Minichillo, 2006). In addition, the use of silcrete for small tool production may have
required heat treatment, a significant time and resource investment (Brown et al., 2009).
This intensive production strategy first appears at Pinnacle Point (Western Cape) around
162 kya, and less than one hundred thousand years later it becomes a regular feature of
the unnamed microlithic industry and later, the Howieson’s Poort industry (Marean, 2010;
Brown et al., 2009; Brown, 2011).
9
Many authors have attempted to explain the dramatic shifts in technology
through behavioral ecology (Lombard, 2005, 2009; Mackay, 2011; Chase, 2010; McCall,
2007; Minichillo, 2006). After all, stone tools would have been quite necessary for
survival, and any change in technology would not necessarily have to be beneficial, but is
unlikely to have been adopted if it was maladaptive (McKay et al., 2014). Due to this,
many have attempted to argue the technological shifts as an adaptation to the
environmental changes associated with Marine Isotope Stage 4 (MIS 4) (Lombard, 2005,
2009; Chase, 2010). However, the adoption of the Howieson’s Poort was nearly
ubiquitous across southern Africa, and across different biomes and rainfall regimes which
would have had different responses to the environmental shifts (Jacobs and Roberts,
2009a,b,c; Jacobs et al., 2008 also see Chase, 2010; Mackay, 2011; McCall 2006, 2007;
Clark and Plug, 2008; Wadley, 2008; Lombard, 2005, 2009).
Another argument for the appearance of technological shifts is an increase in
social interaction between hunter gatherer bands (Jacobs and Roberts, 2009a, b, c).
Some have suggested that the dramatically increased frequency of exotic/non-local
material indicates an expansion and increased reliance on social and/or trade networks
(McCall, 2007; Cochrane, 2008 Lombard, 2005; 2008; 2009; Minichillo, 2006; Ambrose,
2006; Henshilwood and Marean, 2003). These authors claim that the limited occurrence
of the exotic raw materials, coupled with the lithic assemblages that contain a
predominance of these fine-grained materials, would indicate an intricate trade network
(McCall, 2007; Cochrane, 2008; Lombard, 2008, 2009; Henshilwood and Marean, 2003).
McCall (2007) also claims that the rarity of the material along with the increased
complexity of the chaîne opératoire would indicate an increased reliance on social
networks. He continues by arguing that the tools made during this time were exaggerated
in complexity to add value and maintain social ties through exchange, gifts, or trade
10
(McCall, 2007). The rapid expansion of social networks could explain the prevalent and
widespread appearance of the Howieson’s Poort across southern Africa.
More recently, Mackay and colleagues (2014) have argued that the lithic record
exhibits indications of both an intensification due to environmental fluctuations and an
expansion of social interaction during the Howieson’s Poort. Further, the study argues
that slight inter-site variations in the production of Howieson’s Poort tools point to the
origin of the industry being centered in the western portion of southern Africa (Mackay et
al., 2014).
Directly after each of these technological shifts, the lithic record seems to return
to the general MSA production with recurrent and preferential flakes, and raw material
seems to fluctuate in prevalence (Volman, 1981; Minichillo, 2006; Lombard, 2005). At
many sites, the post-Howieson’s Poort lithic record returns to the coarse-grained material
until the introduction of the Later Stone Age (LSA), some 20,000 years later (Volman,
1981; Minichillo, 2006; Lombard, 2005, 2009). Although there seems to be some
relationship between raw material selection and the technology produced, this correlation
does not explain why heat-treated silcrete artifacts appear in the first layers of occupation
at Pinnacle Point (162 kya), and continue to increase and decrease in prevalence
throughout the record until the dramatic increases at the above-mentioned technological
pulses. Further, the correlation does not explain what the raw material and technological
shifts directly meant to the MSA people (i.e. the costs and benefits of the material and
technological shifts). By fully understanding the mechanical properties of the stone tool
materials, the relative advantages of each lithology, and the geographic locations of the
sources, we may better understand the constraints facing the early humans, and the
relative costs and benefits of the raw materials that were being selected.
11
Figure 5 Map of the southern coast of South Africa with Pinnacle Point depicted.
Pinnacle Point
Pinnacle Point locality is a cave complex located on the southern coast of the
Western Cape, South Africa (Figure 5). The most renowned of these caves is PP13B,
which contains intermittent human occupation layers from 162kya to 91kya, and PP5/6,
which contains intermittent occupation layers from 90kya to 53kya (Jacobs, 2010; Bar-
Matthews et al., 2010). When the archaeological records of PP13B and PP5/6 are
combined, they produce a nearly continuous record of human occupation right up until
53kya. The Pinnacle Point caves are unique and important to the archaeological record
for numerous reasons. First, Pinnacle Point is the only coastal site in southern Africa that
contains human occupation layers which date to MIS-6 (Marean, 2010a). MIS-6 occurs
between 195kya and 130kya, and is an extreme glaciation event which interrupted the
African monsoon system and may have caused a mass desertification across most of the
continent (Marean, 2010a). It is thought that this desertification period is the cause of one
12
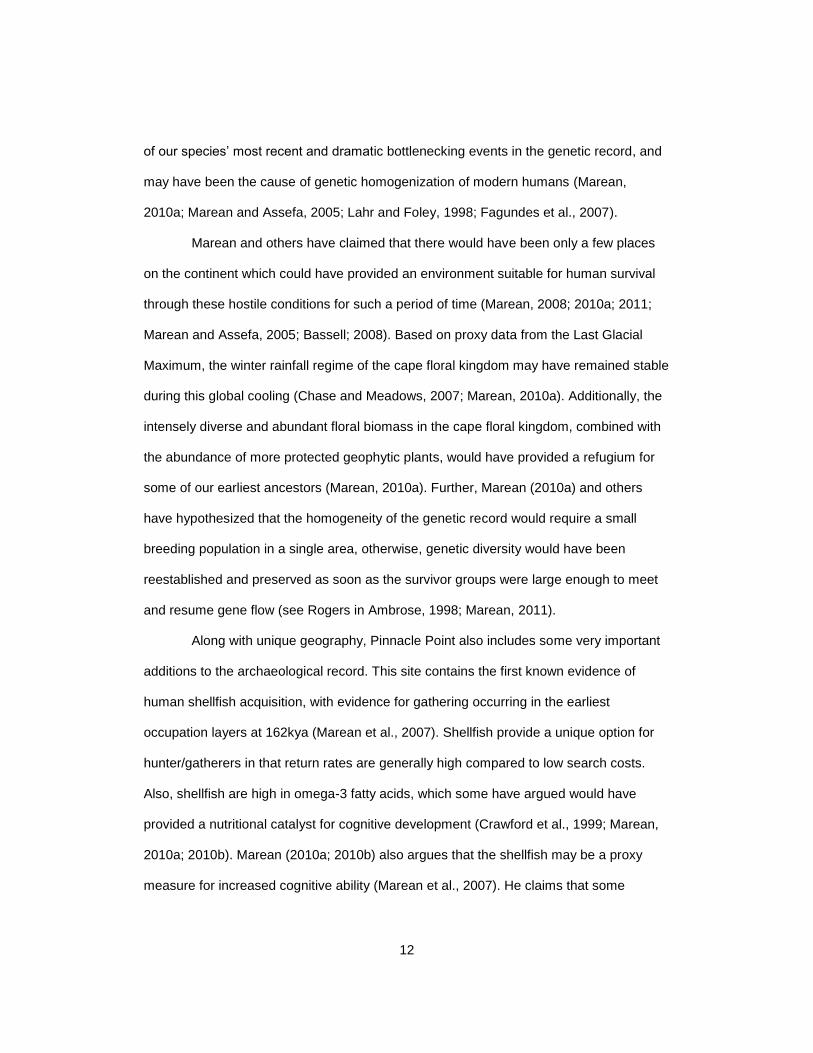
of our species’ most recent and dramatic bottlenecking events in the genetic record, and
may have been the cause of genetic homogenization of modern humans (Marean,
2010a; Marean and Assefa, 2005; Lahr and Foley, 1998; Fagundes et al., 2007).
Marean and others have claimed that there would have been only a few places
on the continent which could have provided an environment suitable for human survival
through these hostile conditions for such a period of time (Marean, 2008; 2010a; 2011;
Marean and Assefa, 2005; Bassell; 2008). Based on proxy data from the Last Glacial
Maximum, the winter rainfall regime of the cape floral kingdom may have remained stable
during this global cooling (Chase and Meadows, 2007; Marean, 2010a). Additionally, the
intensely diverse and abundant floral biomass in the cape floral kingdom, combined with
the abundance of more protected geophytic plants, would have provided a refugium for
some of our earliest ancestors (Marean, 2010a). Further, Marean (2010a) and others
have hypothesized that the homogeneity of the genetic record would require a small
breeding population in a single area, otherwise, genetic diversity would have been
reestablished and preserved as soon as the survivor groups were large enough to meet
and resume gene flow (see Rogers in Ambrose, 1998; Marean, 2011).
Along with unique geography, Pinnacle Point also includes some very important
additions to the archaeological record. This site contains the first known evidence of
human shellfish acquisition, with evidence for gathering occurring in the earliest
occupation layers at 162kya (Marean et al., 2007). Shellfish provide a unique option for
hunter/gatherers in that return rates are generally high compared to low search costs.
Also, shellfish are high in omega-3 fatty acids, which some have argued would have
provided a nutritional catalyst for cognitive development (Crawford et al., 1999; Marean,
2010a; 2010b). Marean (2010a; 2010b) also argues that the shellfish may be a proxy
measure for increased cognitive ability (Marean et al., 2007). He claims that some
13
shellfish, which occur strictly in the intertidal zone, can only be reached on or near a
strong spring tide. During low sea stands, when the coast was on the very fringes of the
gathering range for those living in the cave, they would have to have had some working
knowledge of moon phases, a way to track them, and a complex language to pass on the
knowledge in order to know when would be the opportune times to abandon inland
patches for coastal foraging (Marean, 2010a; Marean et al., 2007).
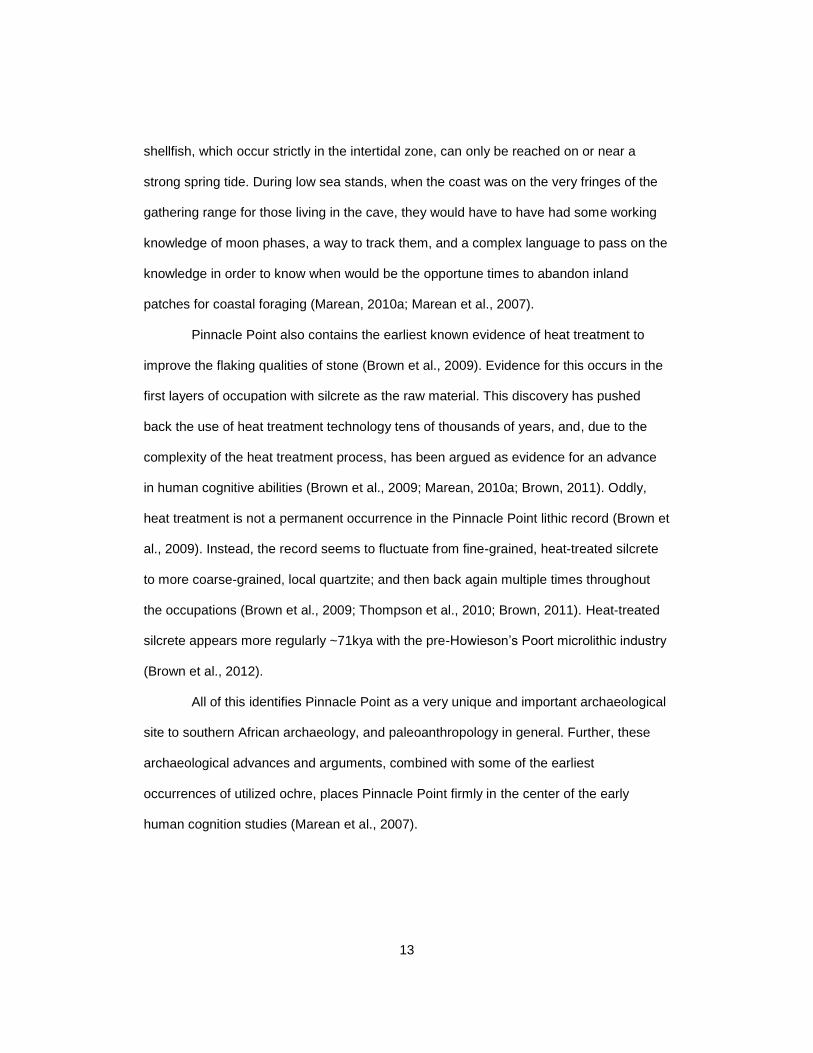
Pinnacle Point also contains the earliest known evidence of heat treatment to
improve the flaking qualities of stone (Brown et al., 2009). Evidence for this occurs in the
first layers of occupation with silcrete as the raw material. This discovery has pushed
back the use of heat treatment technology tens of thousands of years, and, due to the
complexity of the heat treatment process, has been argued as evidence for an advance
in human cognitive abilities (Brown et al., 2009; Marean, 2010a; Brown, 2011). Oddly,
heat treatment is not a permanent occurrence in the Pinnacle Point lithic record (Brown et
al., 2009). Instead, the record seems to fluctuate from fine-grained, heat-treated silcrete
to more coarse-grained, local quartzite; and then back again multiple times throughout
the occupations (Brown et al., 2009; Thompson et al., 2010; Brown, 2011). Heat-treated
silcrete appears more regularly ~71kya with the pre-Howieson’s Poort microlithic industry
(Brown et al., 2012).
All of this identifies Pinnacle Point as a very unique and important archaeological
site to southern African archaeology, and paleoanthropology in general. Further, these
archaeological advances and arguments, combined with some of the earliest
occurrences of utilized ochre, places Pinnacle Point firmly in the center of the early
human cognition studies (Marean et al., 2007).
14
Raw Materials
Quartzite
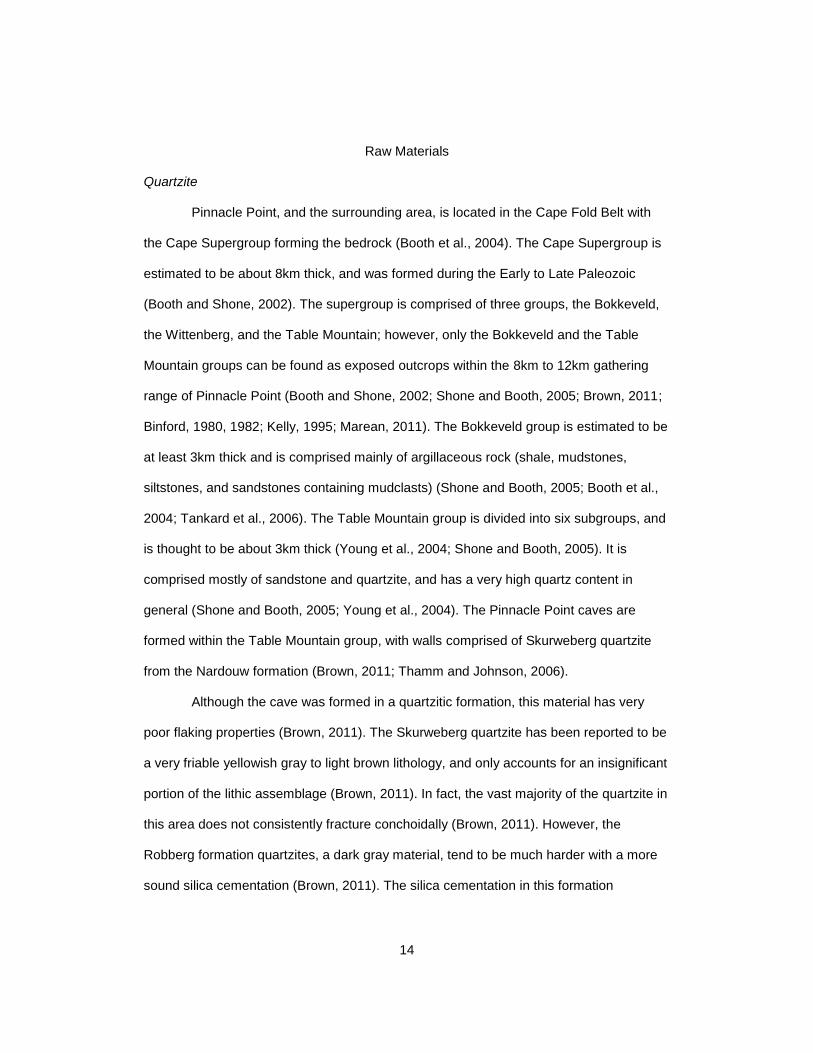
Pinnacle Point, and the surrounding area, is located in the Cape Fold Belt with
the Cape Supergroup forming the bedrock (Booth et al., 2004). The Cape Supergroup is
estimated to be about 8km thick, and was formed during the Early to Late Paleozoic
(Booth and Shone, 2002). The supergroup is comprised of three groups, the Bokkeveld,
the Wittenberg, and the Table Mountain; however, only the Bokkeveld and the Table
Mountain groups can be found as exposed outcrops within the 8km to 12km gathering
range of Pinnacle Point (Booth and Shone, 2002; Shone and Booth, 2005; Brown, 2011;
Binford, 1980, 1982; Kelly, 1995; Marean, 2011). The Bokkeveld group is estimated to be
at least 3km thick and is comprised mainly of argillaceous rock (shale, mudstones,
siltstones, and sandstones containing mudclasts) (Shone and Booth, 2005; Booth et al.,
2004; Tankard et al., 2006). The Table Mountain group is divided into six subgroups, and
is thought to be about 3km thick (Young et al., 2004; Shone and Booth, 2005). It is
comprised mostly of sandstone and quartzite, and has a very high quartz content in
general (Shone and Booth, 2005; Young et al., 2004). The Pinnacle Point caves are
formed within the Table Mountain group, with walls comprised of Skurweberg quartzite
from the Nardouw formation (Brown, 2011; Thamm and Johnson, 2006).
Although the cave was formed in a quartzitic formation, this material has very
poor flaking properties (Brown, 2011). The Skurweberg quartzite has been reported to be
a very friable yellowish gray to light brown lithology, and only accounts for an insignificant
portion of the lithic assemblage (Brown, 2011). In fact, the vast majority of the quartzite in
this area does not consistently fracture conchoidally (Brown, 2011). However, the
Robberg formation quartzites, a dark gray material, tend to be much harder with a more
sound silica cementation (Brown, 2011). The silica cementation in this formation
15
produces a harder, finer grained stone, which lends itself to knapping more readily than
other quartzites found in the Table Mountain group (Brown, 2011).
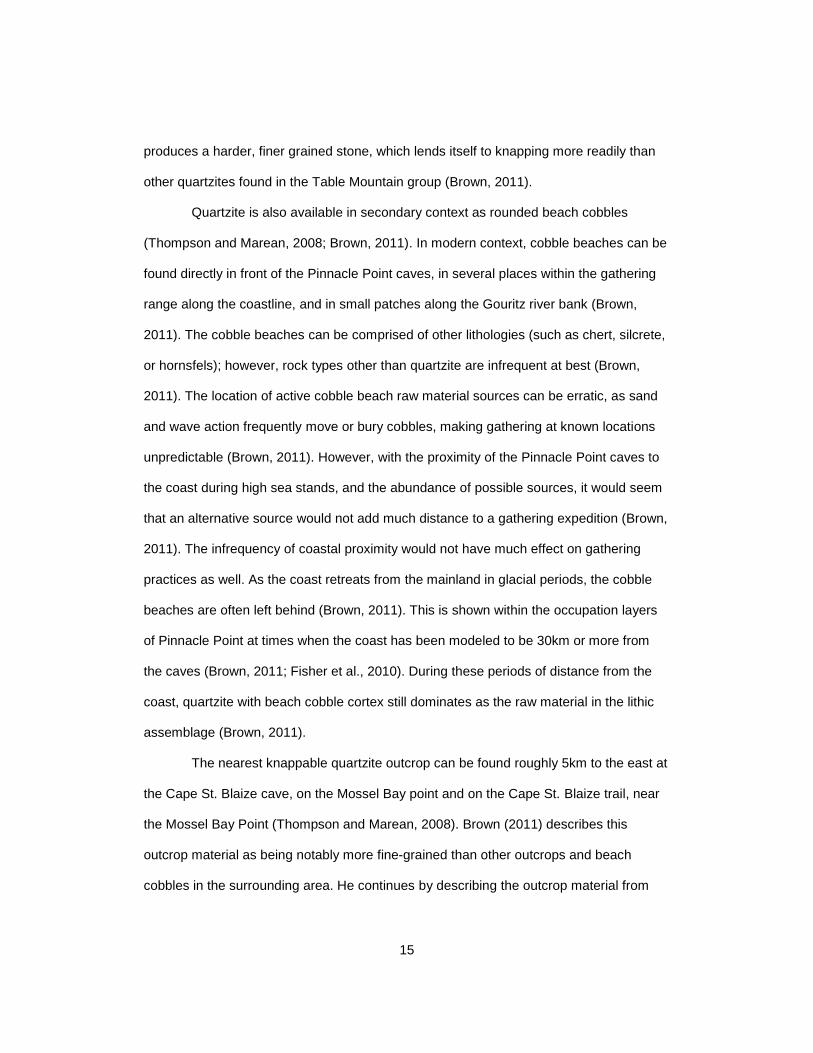
Quartzite is also available in secondary context as rounded beach cobbles
(Thompson and Marean, 2008; Brown, 2011). In modern context, cobble beaches can be
found directly in front of the Pinnacle Point caves, in several places within the gathering
range along the coastline, and in small patches along the Gouritz river bank (Brown,
2011). The cobble beaches can be comprised of other lithologies (such as chert, silcrete,
or hornsfels); however, rock types other than quartzite are infrequent at best (Brown,
2011). The location of active cobble beach raw material sources can be erratic, as sand
and wave action frequently move or bury cobbles, making gathering at known locations
unpredictable (Brown, 2011). However, with the proximity of the Pinnacle Point caves to
the coast during high sea stands, and the abundance of possible sources, it would seem
that an alternative source would not add much distance to a gathering expedition (Brown,
2011). The infrequency of coastal proximity would not have much effect on gathering
practices as well. As the coast retreats from the mainland in glacial periods, the cobble
beaches are often left behind (Brown, 2011). This is shown within the occupation layers
of Pinnacle Point at times when the coast has been modeled to be 30km or more from
the caves (Brown, 2011; Fisher et al., 2010). During these periods of distance from the
coast, quartzite with beach cobble cortex still dominates as the raw material in the lithic
assemblage (Brown, 2011).
The nearest knappable quartzite outcrop can be found roughly 5km to the east at
the Cape St. Blaize cave, on the Mossel Bay point and on the Cape St. Blaize trail, near
the Mossel Bay Point (Thompson and Marean, 2008). Brown (2011) describes this
outcrop material as being notably more fine-grained than other outcrops and beach
cobbles in the surrounding area. He continues by describing the outcrop material from
16
the point area as a darker gray quartzite, and that the material is so fine-grained that the
individual grains are, or are nearly, invisible without magnification (Brown, 2011). Despite
the knappability of the outcrop quartzite being described as much higher, as well as a
distinct selectivity for the material in the Cape St. Blaize MSA assemblage, cortex studies
from the Pinnacle Point assemblage have shown that the vast majority of the quartzite
used at Pinnacle Point was gathered from a secondary, cobble beach context (Thompson
and Marean, 2008; Thompson et al., 2010; Brown, 2011). This implies that the occupants
of the Pinnacle Point caves rarely traveled more than a few kilometers for quartzite, the
dominant raw material.
Silcrete
The term silcrete was first conceived and defined by Lamplugh (1902) and
describes a lithology formed through the near-surface, low-pressure, and low-heat
precipitation of silica (Summerfield, 1981; Roberts, 2003; Nash and Ullyott, 2007). This
silica cements or replaces, in part or completely, the parent material to become at least
85% silica (averaging over 96% by weight in the Cape Coastal region of Southern Africa)
(Nash and Ullyott, 2007; Summerfield and Goudie, 1980; Summerfield, 1983b). The
potential parent material includes a wide range of geologic formations, from bedrock to
soil (Summerfield, 1983a; 1983b). In the case of the outcrops found near Pinnacle Point,
the parent material is most likely a fine clay/slate, which then produces fine-grained
silcrete (Summerfield, 1981; 1983b, Frankel, 1952, Mountain, 1952). Due to the nature of
silcrete genesis and the variability of the parent materials, its qualities can also be quite
variable geographically, despite chemical homogeneity (Summerfield and Goudie, 1980;
Summerfield, 1986; Roberts, 2003). Most authors agree that the genesis of silcrete can
be used as a paleoclimate proxy; however, there is debate as to the climatic and
environmental conditions that must be present for this genesis to occur (Frankel and
17
Kent, 1937; Summerfield, 1982; 1983c; 1984; 1986; Twidale and Hutton, 1986; Partridge
and Maude, 1987; Ullyott et al., 1998, among others).
Figure 6 (from Brown, 2011). Digital elevation map with silcrete outcrop occurrence
highlighted with red (data from: CGS Mossel Bay and Hartenbos 1:50,000 series geology
maps).
Near Pinnacle Point, silcrete occurs between the northern area of Riversdale and
Albertinia in exposed outcrops, or just under the surface (Figure 6) (Summerfield, 1981).
Modern silcrete quarries are found in the area, as silcrete can be commercially used as
refractory bricks for open-hearth furnaces (Davies, 1952; Frankel, 1952). The nearest
exposed outcrop of the lithology lies a mere 8.5km from the Pinnacle Point site, though
the majority of the outcrops occur well over twice this distance (Brown, 2011). The
elevation of the silcrete in the area occurs between just over 300m and 120m above sea
18
level, with no known outcrops found below the minimum elevation (Figure 6)
(Summerfield, 1981). According to Brown (2011), this lack of occurrence below 140m
above sea level (slightly different than Summerfield’s minimum elevation) makes the
presence of silcrete off the present shoreline unlikely. This would mean the movement of
the shoreline relative to sea level variance would not be a factor in silcrete availability to
the Pinnacle Point cave complex, and the idea of a currently submerged outcrop (which
could have been utilized by Stone Age gatherers during a low sea stand) is improbable
(Brown, 2011). However, Nash and colleagues (2013b) report that although the
Riversdale/Albertinia silcrete outcrops have been uplifted, the discovery of silcrete up to
50m below current sea level in Noordhoek valley (approximately 350km away) should
discourage researchers from discounting inundated outcrops completely (see Rogers,
1980). Further, the peaks in silcrete use at Pinnacle Point seem to correspond with low
sea stands and the subsequent movement of the shoreline away from the caves (Brown
et al., 2009, 2012; Fisher et al., 2010; Nash et al., 2013b). However, this could be the
result of a multitude of factors, such as prey animal and environment change due to the
coast moving outside of a daily gathering range (Brown, 2011).
The Riversdale/Albertinia area is situated within the Bolkeveld shale series, and
the silcrete occurs as flat cappings on top of a fine clay (Summerfield, 1981). These
outcrops are confined by the Langeberg Mountains in the north, and the Table Mountain
Sandstone series to the south (Summerfield, 1981). Silcrete can occur in several different
forms in the Albertinia/Riversdale area; these include glaebular, conglomerate, and
massive (Summerfield, 1981; Frankel, 1952). Glaebular silcrete occurs as small, isolated
nodules found mostly overlying the massive silcrete on the high grounds and, to some
extent, within the clay layers (Summerfield, 1981). Conglomerate silcrete is composed of
angular silcrete and quartz detritous cemented by silcrete (Summerfield, 1981; Frankel,
19
1952). The silcrete detritous in the conglomerate formations is thought to be the eroded
remnants of an older silcrete layer (Marker and McFarlane, 1997; Marker et al., 2002;
Malan and Viljoen, 1990; 2008). Massive silcrete is a homogeneous, fine-grained
material with no detritous and little to no known skeletal grains (Summerfield, 1981). Due
to these characteristics, massive silcrete would be the choice material of the silcrete
forms for stone knapping (Brown, 2011) The massive silcrete near Albertinia, Riversdale,
and Mossel Bay generally occurs as benches eroding out of valley sides or flat cappings
on low hills, and is most usually present at elevations of 205m, 194m, 180m, and 170m
above sea level (Marker and McFarlane, 1997).
It has previously been determined that sourcing silcrete is not possible due to the
variation of trace elemental signatures within single outcrops (Corkill, 1999; Brown,
2011). However, recent research has shown that it is possible to pinpoint the origins of
silcrete samples based on these trace elements, though chemical changes which occur
during the heat treatment processes has thus far rendered the sourcing method null
(Nash et al., 2013a,b). Silcrete can also occur in a secondary fashion as beach or river
cobbles, though these tend to be rare (Brown, 2011). In gathering experiments at local
beaches, Brown (2011) found that silcrete cobbles composed about one percent of the
collected assemblages.
Heat Treatment
The heat treatment of siliceous stone for the purpose of improving knappability
was first recognized experimentally and reported by Crabtree and Butler (1964). Since
this recognition, a whole host of sites containing purposefully heated stone material have
been observed in many places around the world (Domanski and Webb, 2007). The
significance of heat treatment is its recognition as a complex process which greatly
increases the intricacy of the chaîne opératoire and the knappability of the resulting

20
material (Brown et al., 2009; Mourre et al., 2010; Flenniken and White, 1983; Purdy,
1971; Domanski and Webb, 2007). The heat treatment of silcrete has been recognized
archaeologically in Australia for some time, though its occurrence has just recently been
recognized in southern Africa (Brown et al., 2009; Ackerman, 1979; Flenniken and White,
1983; Domanski and Webb, 2007). The recognition of heat treatment at the Pinnacle
Point site by Brown and colleagues (2009) has pushed the earliest known occurrence of
heat treatment to 162kya, with regular occurrence by ~71kya. This discovery has cast a
spotlight on the heat treatment of silcrete on the southern coast of Africa in the debate on
early human cognition (Brown et al., 2009; Mourre et al., 2010; Schmidt et al., 2013).
The significance of the occurrence of early heat-treated silcrete in southern Africa
is its relationship to the variability of stone tool industry during the MSA, and the ramp-up
of technology in the chaîne opératoire (Brown et al., 2009). In experiments by Brown
(2011), it was determined that the process by which the silcrete was heat-treated was
quite intricate, delicate, and resource intensive (Brown et al., 2009; Brown, 2011;
Marean, 2010b). The silcrete stones must first be buried 2-3cm in a sand bath, and a fire
slowly built on top (Brown, 2011). A temperature of ~350°C must be reached and
maintained for about eight hours or more (depending on nodule size) (Brown et al., 2009;
Brown, 2011). The nodules are then allowed to cool slowly before being excavated. If the
material is heated too quickly, or reaches too high a temperature, microfracturing and
crazing will occur and the resulting material will not be suitable for knapping (Brown et al.,
2009, Brown, 2011, Brown, pers. comm.; Schmidt et al., 2013).
This has implications for understanding the South African MSA, in that the
intricacy of the chaîne opératoire is dramatically increased, and has been argued to show
increased cognition and symbolic behavior (Brown et al., 2009; Mourre et al., 2010;
Marean, 2010a, 2010b, 2011; Brown, 2011). Also, it has been argued that a fine-grained
21
material with the flaking properties of heat-treated silcrete is essential to be able to
produce the more technologically advanced industries during the southern African MSA
(such as the Howieson’s Poort, Still Bay, and other unlabeled microlithic industries)
(Brown et al., 2009; Marean, 2010a; Mourre et al., 2010; Brown et al., 2012). It has been
argued that the occurrence and disappearance of predominantly heat-treated material in
the record during the South African MSA is dependent on the availability of fire wood
resources (Brown and Marean, 2010). Experiments show that for every 3kg of raw
silcrete, 20kg of firewood is required, making heat treatment a resource- and energy-rich
investment (Brown, 2011). In short, the ability to improve raw material through heat
treatment not, although an expensive process, only provided MSA hunter/gatherers with
a higher quality stone, but allowed them to dramatically change their lithic technology with
the introduction of microliths (Brown et al., 2009; Marean, 2010b; Brown, 2011).
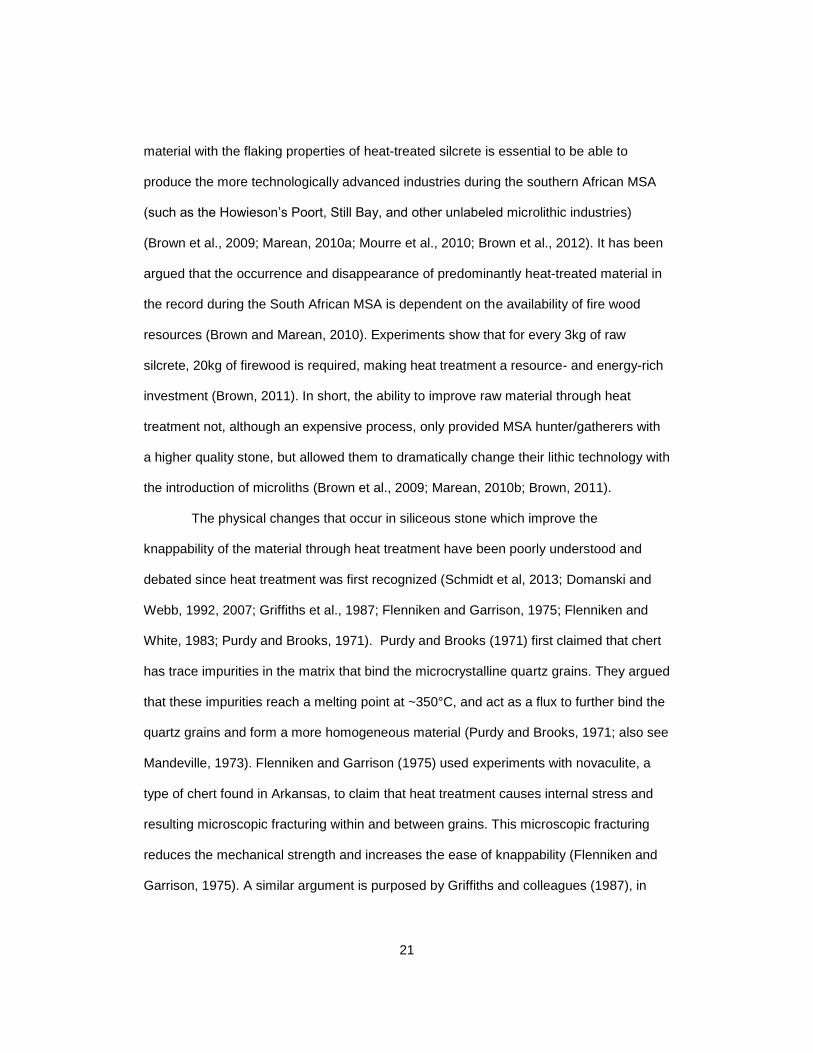
The physical changes that occur in siliceous stone which improve the
knappability of the material through heat treatment have been poorly understood and
debated since heat treatment was first recognized (Schmidt et al, 2013; Domanski and
Webb, 1992, 2007; Griffiths et al., 1987; Flenniken and Garrison, 1975; Flenniken and
White, 1983; Purdy and Brooks, 1971). Purdy and Brooks (1971) first claimed that chert
has trace impurities in the matrix that bind the microcrystalline quartz grains. They argued
that these impurities reach a melting point at ~350°C, and act as a flux to further bind the
quartz grains and form a more homogeneous material (Purdy and Brooks, 1971; also see
Mandeville, 1973). Flenniken and Garrison (1975) used experiments with novaculite, a
type of chert found in Arkansas, to claim that heat treatment causes internal stress and
resulting microscopic fracturing within and between grains. This microscopic fracturing
reduces the mechanical strength and increases the ease of knappability (Flenniken and
Garrison, 1975). A similar argument is purposed by Griffiths and colleagues (1987), in

22
which they describe the migration of water within the silica lattice as significant enough to
cause microfracturing, thus increasing ease of knappability. Experiments by Domanski
and Webb (1992) support the hypothesis first proposed by Crabtree and Butler in 1964.
In this article, Domanski and Webb claim that heat of around 400°C will cause the
recrystallization of silicic material, in which the crystals are transformed from long,
interlocking fibers to equidimensional quartz crystals (Domanski and Webb, 1992).
However, the authors admit that this transformation can be difficult to see, even with the
aid of a scanning electron microscope (Domanski and Webb, 1992).
More recent research by Schmidt and colleagues (2012 and 2013) has shed
further light on the physical changes of heat-treated siliceous stone at the mineralogical
level. These researchers claim that there is a difference in the way that chalcedony/flint
and silcrete respond to thermal alteration (Schmidt et al., 2013). Chalcedony and flint
contain about 0.7 weight percent silanole (SiOH) within the rock structure (Schmidt et al.,
2012, 2013). Upon a slow ramp-up to between 200°C and 300°C, this silanole converts
to an Si-O-Si bond and H2O (Schmidt et al., 2013). The water is evacuated from the rock
as steam, and the new Si-O-Si bonds repair defects in the crystals and shrink the pores
of the stone, thus creating a harder, more homogeneous material (Schmidt et al., 2013).
Although the authors did not test this in the article, they explain that the increased
hardness of the stone correlates with fracture toughness, a mechanical property
previously recognized by Domanski and colleagues (1994) to be closely associated with
knappability (Schmidt et al., 2013).
Silcrete on the other hand, can contain various amounts of silanole, and in most
cases will contain less than flint (Schmidt et al., 2013). Silcrete, at least the silcrete found
on the western coast by Schmidt and colleagues (2013), contains larger pores than the
tested flint, and therefore has a greater ability to evacuate heated H2O. These authors

23
claim that the same processes occur in silcrete as in flint between 200°C and 300°C, in
which the silanole is converted into Si-O-Si and evacuated water (Schmidt et al., 2013).
However, the amount of silanole is generally too low, and the pores are too large to close
and create a more homogeneous material (Schmidt et al., 2013). These authors claim
(contrary to experiments by Brown and colleagues in 2009) that a second reaction occurs
at ~500°C in which the anatase (TiO2) contained within the rock swells to up to 20% its
original size and closes the pores within the stone to make a harder, more homogeneous
material (Schmidt et al., 2013).
Schmidt and colleagues (2013) also claim that because of the larger pores that
are present in the silcrete (as compared to flint), more water can be evacuated at a
higher rate, and therefore the material can withstand a higher treating temperature and a
more rapid heat ramp during treatment. They also claim that not only are these higher
temperatures possible, they are required for full heat treatment of silcrete (~500°C)
(Schmidt et al., 2013). Although the hypothesis was not tested in this article, the authors
argue that actualistically a small nodule of silcrete could be placed in a small, slightly
cooled bed of coals for just under an hour and be completely heat-treated with a low rate
of failure due to over-heating (Schmidt et al., 2013). An earlier study by Mercieca and
Hiscock (2008) found that this method is possible with very small pebbles and blanks
(smallest sample being 1cm3 and the largest sample being 4cm3). Caution must be
taken when comparing these experiments to the African record, as they were conducted
on silcrete samples from Australia, which will have different chemistry and physical
properties (Mercieca and Hiscock, 2008). These findings are in direct disagreement with
the findings of Brown and colleagues (2009), and others, who claim the ramp-up of the
material must be slow and in a sand bath at lower temperatures for even heating without
crazing or fracturing due to over-heating (Brown, 2011; Marean, 2010b). This debate is
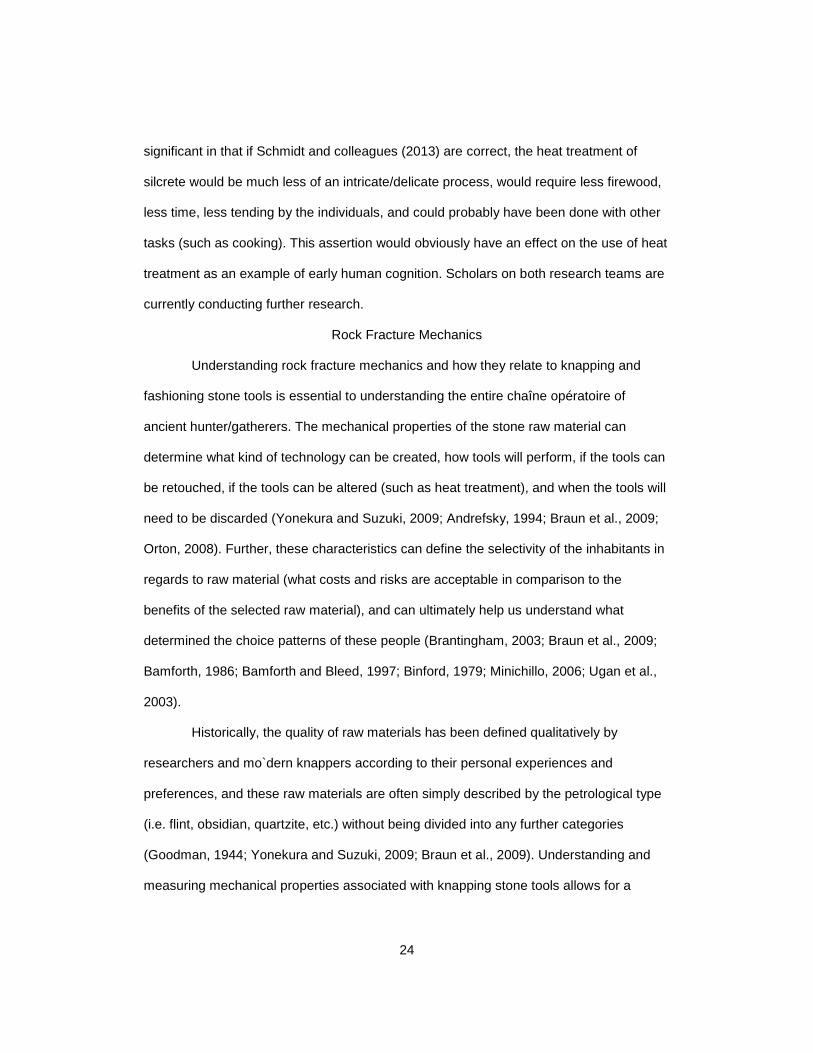
24
significant in that if Schmidt and colleagues (2013) are correct, the heat treatment of
silcrete would be much less of an intricate/delicate process, would require less firewood,
less time, less tending by the individuals, and could probably have been done with other
tasks (such as cooking). This assertion would obviously have an effect on the use of heat
treatment as an example of early human cognition. Scholars on both research teams are
currently conducting further research.
Rock Fracture Mechanics
Understanding rock fracture mechanics and how they relate to knapping and
fashioning stone tools is essential to understanding the entire chaîne opératoire of
ancient hunter/gatherers. The mechanical properties of the stone raw material can
determine what kind of technology can be created, how tools will perform, if the tools can
be retouched, if the tools can be altered (such as heat treatment), and when the tools will
need to be discarded (Yonekura and Suzuki, 2009; Andrefsky, 1994; Braun et al., 2009;
Orton, 2008). Further, these characteristics can define the selectivity of the inhabitants in
regards to raw material (what costs and risks are acceptable in comparison to the
benefits of the selected raw material), and can ultimately help us understand what
determined the choice patterns of these people (Brantingham, 2003; Braun et al., 2009;
Bamforth, 1986; Bamforth and Bleed, 1997; Binford, 1979; Minichillo, 2006; Ugan et al.,
2003).
Historically, the quality of raw materials has been defined qualitatively by
researchers and mo`dern knappers according to their personal experiences and
preferences, and these raw materials are often simply described by the petrological type
(i.e. flint, obsidian, quartzite, etc.) without being divided into any further categories
(Goodman, 1944; Yonekura and Suzuki, 2009; Braun et al., 2009). Understanding and
measuring mechanical properties associated with knapping stone tools allows for a
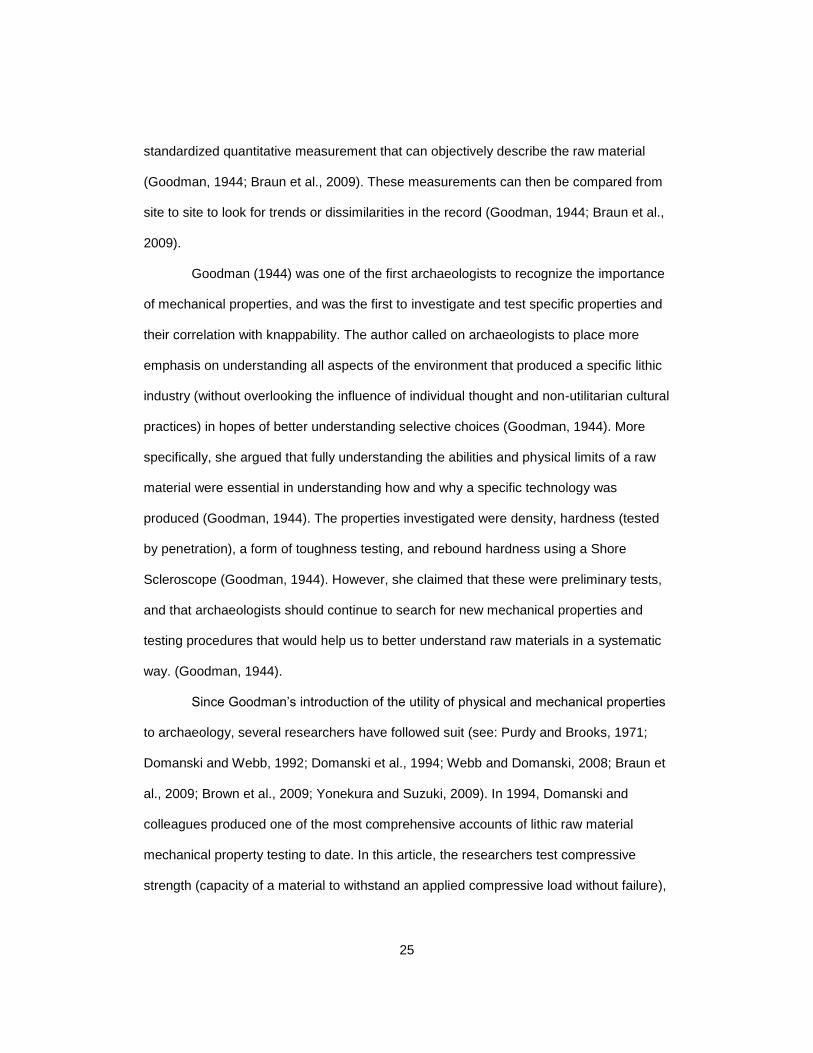
25
standardized quantitative measurement that can objectively describe the raw material
(Goodman, 1944; Braun et al., 2009). These measurements can then be compared from
site to site to look for trends or dissimilarities in the record (Goodman, 1944; Braun et al.,
2009).
Goodman (1944) was one of the first archaeologists to recognize the importance
of mechanical properties, and was the first to investigate and test specific properties and
their correlation with knappability. The author called on archaeologists to place more
emphasis on understanding all aspects of the environment that produced a specific lithic
industry (without overlooking the influence of individual thought and non-utilitarian cultural
practices) in hopes of better understanding selective choices (Goodman, 1944). More
specifically, she argued that fully understanding the abilities and physical limits of a raw
material were essential in understanding how and why a specific technology was
produced (Goodman, 1944). The properties investigated were density, hardness (tested
by penetration), a form of toughness testing, and rebound hardness using a Shore
Scleroscope (Goodman, 1944). However, she claimed that these were preliminary tests,
and that archaeologists should continue to search for new mechanical properties and
testing procedures that would help us to better understand raw materials in a systematic
way. (Goodman, 1944).
Since Goodman’s introduction of the utility of physical and mechanical properties
to archaeology, several researchers have followed suit (see: Purdy and Brooks, 1971;
Domanski and Webb, 1992; Domanski et al., 1994; Webb and Domanski, 2008; Braun et
al., 2009; Brown et al., 2009; Yonekura and Suzuki, 2009). In 1994, Domanski and
colleagues produced one of the most comprehensive accounts of lithic raw material
mechanical property testing to date. In this article, the researchers test compressive
strength (capacity of a material to withstand an applied compressive load without failure),

26
tensile strength (the maximum stress the material can endure without failing), modulus of
elasticity (resistance to being deformed by a load), and fracture toughness (resistance of
a material to catastrophic fracture propogation), and how these properties relate to
knappability. They conclude that fracture toughness is the most suitable mechanical
property for knappability prediction (though the test is destructive) (Domanski et al., 1994;
see also Domanski and Webb, 1992). Additionally, based on the previous flake
propagation studies by Cotterell and Kaminga (1987), Domanski and colleagues argue
that Young’s modulus of elasticity is notable in predicting the suitability of a material to
produce long blades and flakes (Domanski et al., 1994).
As previously stated, mechanical properties of raw material can be directly
compared and integrated into our knowledge of the archaeological record. Yonekura and
Suzuki (2009) exhibit this use of mechanical and physical properties with their analysis of
the artifacts and raw materials in and around the Ueno-A site, an upper Pleistocene
occupation found in the Yamagata Prefecture, Japan. The majority of the Ueno-A lithic
assemblage is comprised of two main tool types, blades and bifacial points, 99% of which
are some form of shale (Yonekura and Suzuki, 2009). The authors identified thirty-three
types of shale in the gathering range of the site, based on color and in-hand
characteristics (Yonekura and Suzuki, 2009). In this study, the authors use the fact that
mechanical properties have been directly associated with mineral content, grain size,
pore space, and cementing type, to test their hypothesis that the mechanical properties of
a lithology can be non-destructively determined by surface roughness (Yonekura and
Suzuki, 2009). The surface roughness of the collected raw material was tested using a
surface roughness measurement device, and the results were compared to the measured
microhardness and flexural strength (Yonekura and Suzuki, 2009).
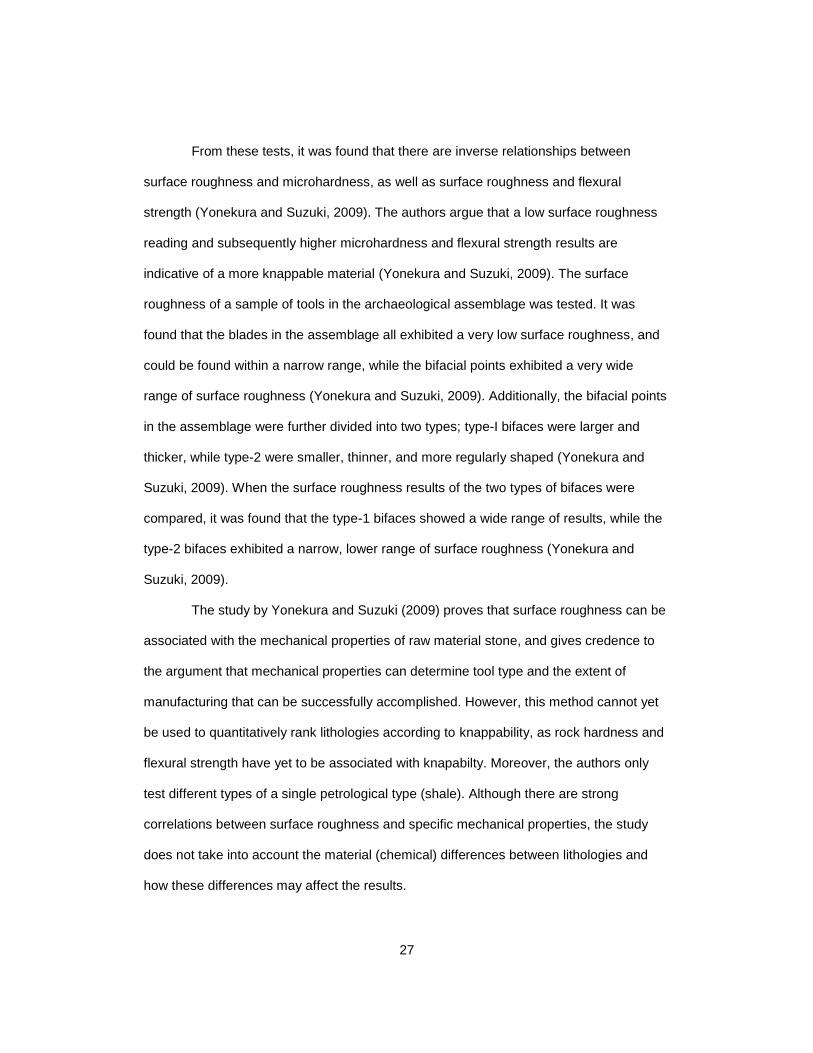
27
From these tests, it was found that there are inverse relationships between
surface roughness and microhardness, as well as surface roughness and flexural
strength (Yonekura and Suzuki, 2009). The authors argue that a low surface roughness
reading and subsequently higher microhardness and flexural strength results are
indicative of a more knappable material (Yonekura and Suzuki, 2009). The surface
roughness of a sample of tools in the archaeological assemblage was tested. It was
found that the blades in the assemblage all exhibited a very low surface roughness, and
could be found within a narrow range, while the bifacial points exhibited a very wide
range of surface roughness (Yonekura and Suzuki, 2009). Additionally, the bifacial points
in the assemblage were further divided into two types; type-I bifaces were larger and
thicker, while type-2 were smaller, thinner, and more regularly shaped (Yonekura and
Suzuki, 2009). When the surface roughness results of the two types of bifaces were
compared, it was found that the type-1 bifaces showed a wide range of results, while the
type-2 bifaces exhibited a narrow, lower range of surface roughness (Yonekura and
Suzuki, 2009).
The study by Yonekura and Suzuki (2009) proves that surface roughness can be
associated with the mechanical properties of raw material stone, and gives credence to
the argument that mechanical properties can determine tool type and the extent of
manufacturing that can be successfully accomplished. However, this method cannot yet
be used to quantitatively rank lithologies according to knappability, as rock hardness and
flexural strength have yet to be associated with knapabilty. Moreover, the authors only
test different types of a single petrological type (shale). Although there are strong
correlations between surface roughness and specific mechanical properties, the study
does not take into account the material (chemical) differences between lithologies and
how these differences may affect the results.

28
Recently, Braun and colleagues (2009) have used the properties of rebound
hardness (tested with a Schmidt rebound hammer) and resistance to abrasion (tested
with a Taber abrader) to determine that hominins in the Oldowan industry were making
raw material choices based on mechanical performance of the material. In their study, the
authors found that the hominins in the Kanjera South site in Kenya were regularly
passing up on locally available raw material that could more predictably produce a fine
edge for material with less of a capability for fine edge production, but was much more
durable. It is thought that this is due to the practice of taking and processing very large
game (Braun et al., 2009). Processing large animals with thick hide would have worn the
sharper but less durable flakes down much more quickly, and would have forced the
hominins to spend more time collecting material and knapping (Braun et al., 2009). This
study is a perfect example of how understanding and describing lithic material through
the quantitative methods of mechanical properties testing can help us to better
understand the choice patterns of even our oldest ancestors.
Despite these authors, and their contributions to interpreting the archaeological
record through mechanical properties testing, it is this author’s observation that
mechanical properties remain largely ignored by archaeological researchers. Further, too
often researchers rely on overly simplistic, subjective, and dichotomous relationships
between high- and low- quality materials (Andrefsky, 1994; Braun et al., 2009). Modern
archaeology has failed to fully realize, as Goodman asserted in 1944, the necessity of
wholly understanding the qualities of ancient environments and the raw materials that
were collected in these environments. As Goodman reasoned in 1944, as well as those
who followed in archaeological properties testing, once researchers discover and can
settle on a method and a property or suite of properties that are most closely associated
with and describe the flaking properties of stone, these methods can be applied

29
universally around the world to facilitate comparisons of various lithologies and their
knappability (Goodman, 1944; Domanski and Webb, 1992; Domanski et al., 1994).
30
Chapter 3
Methods
The two most prevalent and prominent lithologies from the Pinnacle Point
assemblage, quartzite and silcrete, are the focus of the mechanical testing for this study,
with modulus of elasticity being the objective mechanical property (associated with the
suitability of the material for producing long flakes) (Domanski et al., 1994; Cotterell and
Kaminga, 1987). The general method for determining modulus of elasticity is by cutting
core cylinders from the sample nodules and preparing them to be placed into a
compressive device (Domanski et al., 1994). The cylinder is then compressed to the point
of failure, while the applied load and length of the cylinder are continuously measured
(Domanski et al., 1994). Although this test is quite accurate, it requires a large amount of
preparation time, specialized equipment, a laboratory setting, and is destructive. To
counter these limitations, all of the mapped and collected samples from both lithiologies
have been tested using a Schmidt rebound hammer to assess the rebound hardness of
the rock. This method is non-destructive, inexpensive, uncomplicated, and does not
require a laboratory setting (Katz et al., 2000; Goudie, 2006).
The Schmidt rebound hammer was originally developed in 1948 as a non-
destructive means of testing concrete hardness, both in situ and in laboratory settings
(Goudie, 2006). By the early 1960s, geologists began using the device to determine the
rebound hardness of stone (Demridag et al., 2009; Aydin and Basu, 2005). These
rebound hardness results were later correlated with both Young’s modulus of elasticity
and uni-axial compression strength (Aydin, 2009, Sachpazis, 1990; Poole and Farmer,
1980).
For these experiments, an N-type Schmidt hammer was used with an impact
energy of 2.207Nm, as this type has been shown to work best on the harder lithologies,
31
and is more closely associated with Young’s modulus of elasticity (Figure 7) (Aydin and
Basu, 2005; Goudie, 2006). The Schmidt hammer works by releasing a spring-loaded
mass against a plunger that is being pressed against the test surface (Katz et al., 2000).
The mass rebounds off the plunger and the maximum height is measured by a sliding
indicator on the side of the device (Katz et al., 2000, Aydin, 2009). The value on the
sliding indicator is registered as a percentage of the initial extension of the spring. (Aydin
and Basu, 2005; Kolaiti and Papadopoulos, 1993). Generally, the lithologies which
produce higher rebound values are more homogeneous, have smaller crystal structures,
and are more resistant to deformation (Braun et al., 2009; Goudie, 2006)
Figure 7 (from Shariati et al., 2011). Depicts the operational system of the Schmidt
Rebound Hammer.
32
Figure 8 The author using the Schmidt Rebound Hammer in Terracon Labs; Fort Worth,
Texas (photo by Zachary Overfield).
The preparation and analysis of the lithologies for rebound hardness tests
followed the procedures outlined by the ISRM (International Society for Rock Mechanics),
the same procedures used by Braun and colleagues (2009) and Brown and colleagues
(2009) (see Aydin, 2009). The methods and procedures (except the heat treatment
procedures) were the same for both the quartzite and the silcrete samples. The samples
were cut using a water-cooled table saw with a diamond impregnated blade or a large
angle grinder. An attempt was made to cut the samples as close to 10cm3 as possible,
which has been recommended as the ideal block size for non in-situ testing (Demeridag
et al., 2009; Viles et al., 2011). However, some of these samples did not lend themselves

33
to these measurements length or width wise, and were either slightly smaller or larger
than the 10cm goal. All of the samples had a test axis (from top to bottom) of at least
10cm. A steel plate with a width and length of 25cm, a thickness of 5cm, and a weight of
25.5kg was used as a base, in conjunction with the methods employed by Braun and
colleagues (2009). The steel base is used to ensure that softer material beneath the
sample does not absorb the impact energy (ISRM, 1978, ASTM, 2001; Aydin and Basu,
2005). The steel base was placed on a flat concrete substrate to further ensure impact
energy was not being absorbed by a softer material (Figure 8) (Aydin, 2009). The
samples were visually examined for rough surfaces and geologic defects which can affect
the results (Aydin and Basu, 2005).
Slippage of the plunger on the testing surface, unseen geologic defects within the
material, and the device being held a few degrees off vertical are errors which are almost
impossible to completely avoid and can have a pronounced impact on the resulting
values (Braun et al., 2009; Brown et al., 2009; Aydin, 2009). In order to compensate for
this, several test points can be taken across the testing surface with multiple hammer
impacts per test point (Braun et al., 2009; Aydin and Basu, 2005). There is, however,
much debate over the number of testing points per testing surface, and the number of
impacts per test point when assessing stone with the Schmidt hammer (Poole and
Farmer, 1980; Aydin and Basu, 2005; Kolaiti and Papadopoulus, 1993; Demirdag et al.,
2009; Fowell and McFeat-Smith, 1976; Hucka, 1965). The debate on the number of
impacts per impact point revolves around the idea of the initial impact being cushioned by
a slightly roughened surface, and the ensuing impacts registering the true (higher) value,
after the roughened surface has been crushed. The differing argument claims that the
initial value is the correct value, while the ensuing impacts crush and compact the rock,
34
which creates an artificially compacted/polished surface resulting in abnormally high
values (Poole and Farmer, 1980; Aydin, 2009; Aydin and Basu, 2005)
Figure 9 Example of a testing grid (silcrete sample- I14-3-3.003).
To allow for these variations in methods, and to allow the data to be adjusted if
better testing methods are recognized at a later date, the testing points were placed in a
grid pattern over the entirety of the testing surface, with each point at least one plunger
diameter (1.5cm) from each other and the edges of the testing surface (Figure 9). The
testing points in the grid were not used if they fell on a geologic defect or an imperfection
in the surface (Williams and Robinson, 1983). A photograph was taken of each testing
surface to indicate the location of each testing point. This photograph can later be
entered into a GIS program with corresponding results for future data analysis methods,
and/or experiment replication on the same samples. At least three impacts were taken at

35
each testing point. The test is non-destructive, and taking several readings from the same
impact point may compensate for low initial numbers due to a roughened surface (Poole
and Farmer, 1980; Aydin and Basu, 2005).
Once the values are collected, the average value across the surface must be
taken. Although there is some evidence that multiple impacts taken at each testing point
can increase consistency (see Poole and Farmer, 1980), a goal of this project is to
provide data for cross-site comparison. Therefore, the methods outlined by the ISRM
were followed (Aydin, 2009). The only modification to these methods was the number of
impacts. Eighteen initial readings, instead of twenty, were used. This is consistent with
the archaeological applications of Braun and colleagues (2009).
To collect the values for data analysis, the most stable surface of the sample was
used as the base. Because the testing points are spread 1.5cm apart over the entirety of
the test surface, the number of testing points regularly numbered more than eighteen. To
reduce the number of testing points to eighteen in accordance with the analysis methods,
any testing points that were determined to be unstable or contain a hidden geologic
defect (as noted during testing) were removed. If the remaining number was still more
than eighteen, the photographed surface was viewed and the testing points closest to the
edge were removed according to proximity until the remaining number of testing points
was equal to eighteen. These eliminations were based on the photograph of the test
surface only, and were blind of the rebound results of each testing point. This was done
in order to eliminate bias for one point over another. The center-most values were used
due to the fact that rebound hardness is negatively affected with proximity to the sample
edge (Aydin and Basu. 2005). The center testing points provide higher, more accurate
results, with more material surrounding the impact site. Any samples that could not
36
provide eighteen testing points with accurate measurements, due to surface size and/or
irregularities, were removed from the analysis.
Although each testing point was tested at least three times, only the initial impact
was used in the analysis in accordance with ISRM guidelines (ISRM, 1978; Aydin, 2009).
The only instances in which this was not followed was when the first impact (sometimes
second impact as well) were obviously incorrect due to an error such as a plunger slip,
small saw marks or ridges that were crushed and absorbed the energy, the device being
held further than five degrees off vertical, etc. In these instances more than three impact
readings were taken until three accurate measurements were acquired, and the first
accurate impact in the series at that testing point was used.
Of the eighteen remaining values, the four highest and the four lowest values
were removed, to account for outliers (Aydin, 2009; Braun et al., 2009). In some
circumstances, the resulting values must be adjusted to compensate for the forces of
gravity. However, for these tests, the device was held in a 90°, vertical position, which
does not need to be corrected (Basu and Aydin, 2004). The ten values were then
averaged and rounded to the nearest whole number to produce the rebound result for the
sample.
Both quartzite and silcrete samples were collected by Dr. Kyle Brown. Nineteen
quartzite samples were collected from both the outcrops near the Mossel Bay point, and
cobbles from the nearby and adjacent beaches. Eleven silcrete outcrops were tested with
paired samples prepared from each selected silcrete nodule. One of each paired silcrete
sample remains unheated, and is curated in Mossel Bay, South Africa as a witness
sample, along with all of the quartzite samples. Both of all paired silcrete samples and all
of the quartzite samples were first tested using the methods described above at the
Mossel Bay Archaeological Project lab located on the grounds of the Diaz Museum in

37
Mossel Bay, South Africa. After the initial testing, one of the samples from each of the
paired samples was selected for heat treatment in the United States.
The heat treatment process was conducted at Arizona State University in the
scientific glassware office, as this department has had previous experience with heat
treatment of silcrete. Methods developed by Brown and colleagues (2009) were used.
Samples were placed in a large electric kiln and slowly heated from 40° Celsius to 350°
Celsius over a period of about four hours. The peak temperature was held for about eight
hours, and the temperature was slowly ramped back down to 40° over another four
hours. Actualistic methods could have been used with an open campfire and a shallow
sand bath (as described in Brown et al., 2009 and Brown, 2011). However, the electric
kiln method has a much narrower margin of error, which was ideal for this study with the
paired samples (Brown, 2011).
A second round of rebound hardness testing was conducted at Terracon Labs in
Fort Worth, Texas. Prior to the heat treatment process, three silcrete samples were
tested and compared to the results of the same samples tested in South Africa. This was
done in order to prove consistency and eliminate any suspicion of bias that may have
occurred due to the introduction of a new device and a different physical setting. Once
continuity was established, and after the heat treatment process was conducted, the
samples were tested again in order to determine any change in knappability. Once again,
in order to reduce any error or potential bias, the grid of test points was shifted so that the
impact points for the second round of testing were not influenced in any way by the
previous tests. Using these methods, I was theoretically able to determine and quantify
the increase in the knappability of silcrete when the heat treatment strategy is utilized
(Brown et al., 2009).

38
Chapter 4
Results
Table 1 Rebound results for quartzite, silcrete (unheated), and silcrete (heated).
Sample
Rebound Hardness
Quartzite
C9-2-62.001 64.9
C9-3-89.001 64.1
C9-3-92.001 63.4
C9-3-95.001 59.0
D11-1-100B5 64.0
D11-1-100B6 67.7
D11-1-78.001 62.3
D11-1-80 62.2
D11-1-81.001 62.6
D11-1-91C1 61.0
D11-1-94e 57.0
D11-1-97D 61.7
D11-1-98E 60.8
D11-2-1.001 63.2
D11-3-1c 65.3
E5-1-14.002 60.4
E7-1-55.002 65.2
E7-1-57.002 61.0
I5-1-83.001 56.9
Average
Rebound
Hardness
62.21
Sample
Rebound Hardness
Silcrete
(Untreated)
Rebound Hardness
Silcrete (Treated)
D9-1-10c 59.0
D9-1-12e 63.0 58.5
E3-1-5C 61.3 59.0
E3-1-5D 59.8
E3-1-6L 61.5 61.5
E3-1-6n 57.3
E4-1-2.001 57.6 53.6
E4-1-2.007 62.0 58.4
E4-1-2.014 45.1
E4-32a.002 68.0
E4-3-2a.003 65.7
E9-5-3c.001 60.7
F10-1-2A.002 65.7 63.0
G11-1-2B 57.9
I14-2-16i 67.2
I14-2-6a 67.2
I14-2-6b 66.0 58.2
I14-3-3.003 62.9
I14-3-3.004 62.4 54.7
I14-3-4.003 60.7
I14-3-5.001 60.7 57.3
I-14-3-5.006 61.3
Average
Rebound
Hardness
61.5 58.24
Table 2 Descriptive statistics comparing rebound hardness results for all quartzite and
silcrete (unheated) samples.
N Mean Std. Deviation Std. Error Mean
Quartzite 19 62.25 2.78 0.64
Silcrete (Untreated) 22 61.50 4.85 1.03
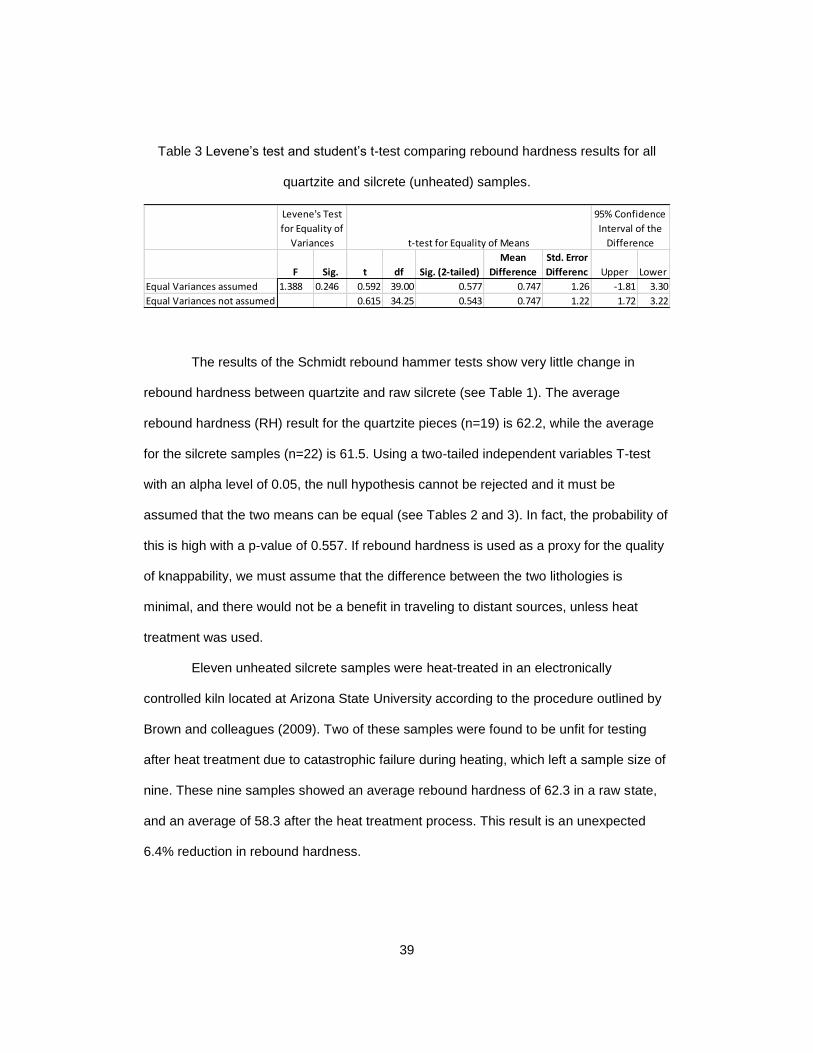
39
Table 3 Levene’s test and student’s t-test comparing rebound hardness results for all
quartzite and silcrete (unheated) samples.
The results of the Schmidt rebound hammer tests show very little change in
rebound hardness between quartzite and raw silcrete (see Table 1). The average
rebound hardness (RH) result for the quartzite pieces (n=19) is 62.2, while the average
for the silcrete samples (n=22) is 61.5. Using a two-tailed independent variables T-test
with an alpha level of 0.05, the null hypothesis cannot be rejected and it must be
assumed that the two means can be equal (see Tables 2 and 3). In fact, the probability of
this is high with a p-value of 0.557. If rebound hardness is used as a proxy for the quality
of knappability, we must assume that the difference between the two lithologies is
minimal, and there would not be a benefit in traveling to distant sources, unless heat
treatment was used.
Eleven unheated silcrete samples were heat-treated in an electronically
controlled kiln located at Arizona State University according to the procedure outlined by
Brown and colleagues (2009). Two of these samples were found to be unfit for testing
after heat treatment due to catastrophic failure during heating, which left a sample size of
nine. These nine samples showed an average rebound hardness of 62.3 in a raw state,
and an average of 58.3 after the heat treatment process. This result is an unexpected
6.4% reduction in rebound hardness.
F Sig. t df Sig. (2-tailed)
Mean
Difference
Std. Error
Differenc Upper Lower
Equal Variances assumed 1.388 0.246 0.592 39.00 0.577 0.747 1.26 -1.81 3.30
Equal Variances not assumed 0.615 34.25 0.543 0.747 1.22 1.72 3.22
Levene's Test
for Equality of
Variances t-test for Equality of Means
95% Confidence
Interval of the
Difference
40
Figure 10 Box and whisker plot comparison of the quartzite, untreated silcrete, and heat-treated silcrete results of this study, to the
results published by Brown, 2011
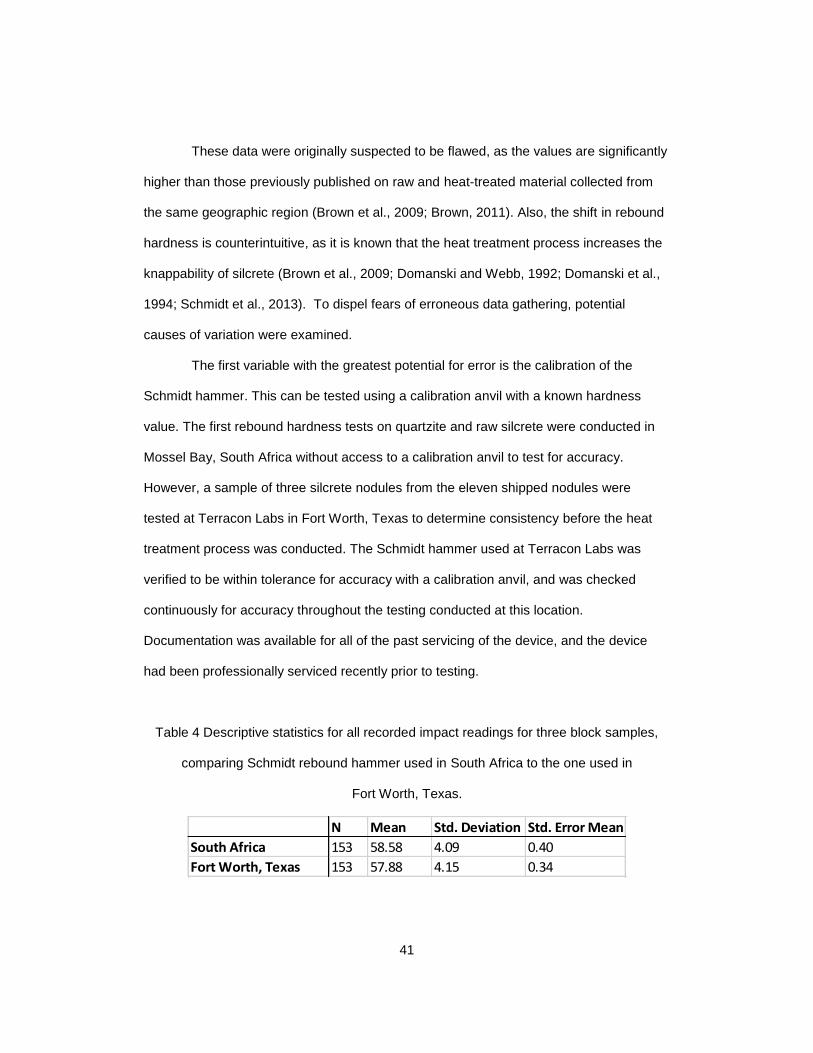
41
These data were originally suspected to be flawed, as the values are significantly
higher than those previously published on raw and heat-treated material collected from
the same geographic region (Brown et al., 2009; Brown, 2011). Also, the shift in rebound
hardness is counterintuitive, as it is known that the heat treatment process increases the
knappability of silcrete (Brown et al., 2009; Domanski and Webb, 1992; Domanski et al.,
1994; Schmidt et al., 2013). To dispel fears of erroneous data gathering, potential
causes of variation were examined.
The first variable with the greatest potential for error is the calibration of the
Schmidt hammer. This can be tested using a calibration anvil with a known hardness
value. The first rebound hardness tests on quartzite and raw silcrete were conducted in
Mossel Bay, South Africa without access to a calibration anvil to test for accuracy.
However, a sample of three silcrete nodules from the eleven shipped nodules were
tested at Terracon Labs in Fort Worth, Texas to determine consistency before the heat
treatment process was conducted. The Schmidt hammer used at Terracon Labs was
verified to be within tolerance for accuracy with a calibration anvil, and was checked
continuously for accuracy throughout the testing conducted at this location.
Documentation was available for all of the past servicing of the device, and the device
had been professionally serviced recently prior to testing.
Table 4 Descriptive statistics for all recorded impact readings for three block samples,
comparing Schmidt rebound hammer used in South Africa to the one used in
Fort Worth, Texas.
N Mean Std. Deviation Std. Error Mean
South Africa 153 58.58 4.09 0.40
Fort Worth, Texas 153 57.88 4.15 0.34

42
Table 5 Levene’s test and student’s t-test comparing all recorded impact readings for
three block samples, comparing Schmidt rebound hammer used in South Africa to the
one used in Fort Worth, Texas.
The rebound results from the readings taken in South Africa were quite similar to,
or the same as, those taken by the hammer that was known to be in calibration,
suggesting that the initial hammer produced accurate results. To compare the means of
the three samples, the results of all three impact points for each of the three samples
tested in South Africa, were compared to the same samples tested in the United States.
A students t-test, with a confidence interval of 95%, showed that the readings of these
three samples taken in South Africa were not statistically different from those taken in the
United States (p value of 0.175). See Tables 4 and 5 for greater detail.
Table 6 Comparison of the averages for each round of impacts between the same
silcrete samples tested in Mossel Bay, South Africa and Fort Worth, Texas using different
Schmidt hammers.
F Sig. t df Sig. (2-tailed)
Mean
Difference
Std. Error
Differenc Upper Lower
Equal Variances assumed 8.351 0.004 1.358 304.0 0.175 0.706 0.52 -0.317 1.728
Equal Variances not assumed 1.358 295.8 0.175 0.706 0.52 -0.317 1.728
Levene's Test
for Equality of
Variances
95% Confidence
Interval of the
Differencet-test for Equality of Means
Retest Results (United States)
Impact 1 Impact 2 Impact 3 Impact 1 Impact 2 Impact 3
Sample #
D9-1-10D 53.50 54.58 54.33 55.08 55.17 54.75
I14-2-16j 59.63 60.13 59.81 57.06 57.81 57.75
E3-1-5C 60.00 60.00 60.04 59.61 59.52 59.70
Initial Results (South Africa)

43
The results for the comparison between the two hammers can be found in Table
6. In this test, at least two of the samples did not have enough space for eighteen
accurate impacts, and therefore could not be analyzed for the final results. To
compensate for this, the averages for each round of accurate impacts across the surface
were calculated and compared for each of the three samples. Note that the impacts in the
testing conducted in the United States were performed on the same impact sites as those
in South Africa. Repeated impacts in the same location have the potential to slightly
affect the resulting values, as described above.
It is also worth noting that as the Schmidt hammer is used repeatedly, the main
spring becomes worn and lessens the impact against the plunger (McCarroll, 1989). In
most cases, errors produced by a Schmidt hammer that is out of calibration are lower
than those produced by a calibrated device. The results of this study are much higher
than those produced by Brown and colleagues (2009), further indicating that calibration
was not an issue in this study.
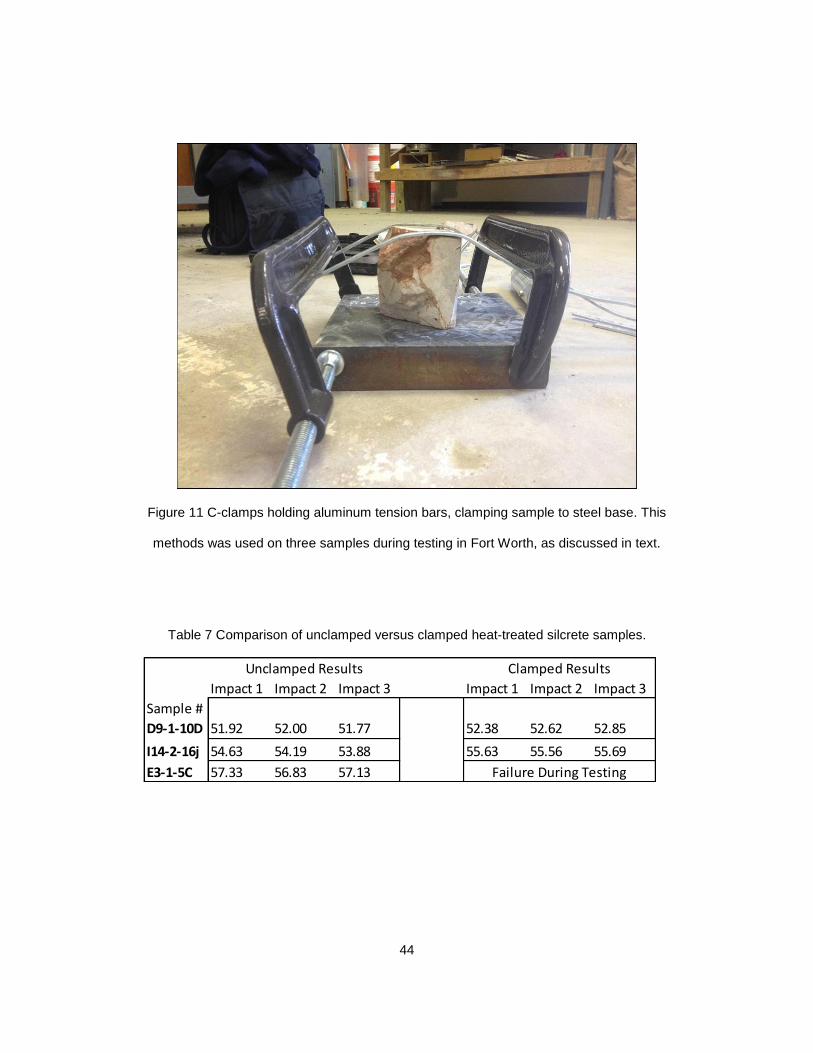
44
Figure 11 C-clamps holding aluminum tension bars, clamping sample to steel base. This
methods was used on three samples during testing in Fort Worth, as discussed in text.
Table 7 Comparison of unclamped versus clamped heat-treated silcrete samples.
Impact 1 Impact 2 Impact 3 Impact 1 Impact 2 Impact 3
Sample #
D9-1-10D 51.92 52.00 51.77 52.38 52.62 52.85
I14-2-16j 54.63 54.19 53.88 55.63 55.56 55.69
E3-1-5C 57.33 56.83 57.13
Unclamped Results Clamped Results
Failure During Testing
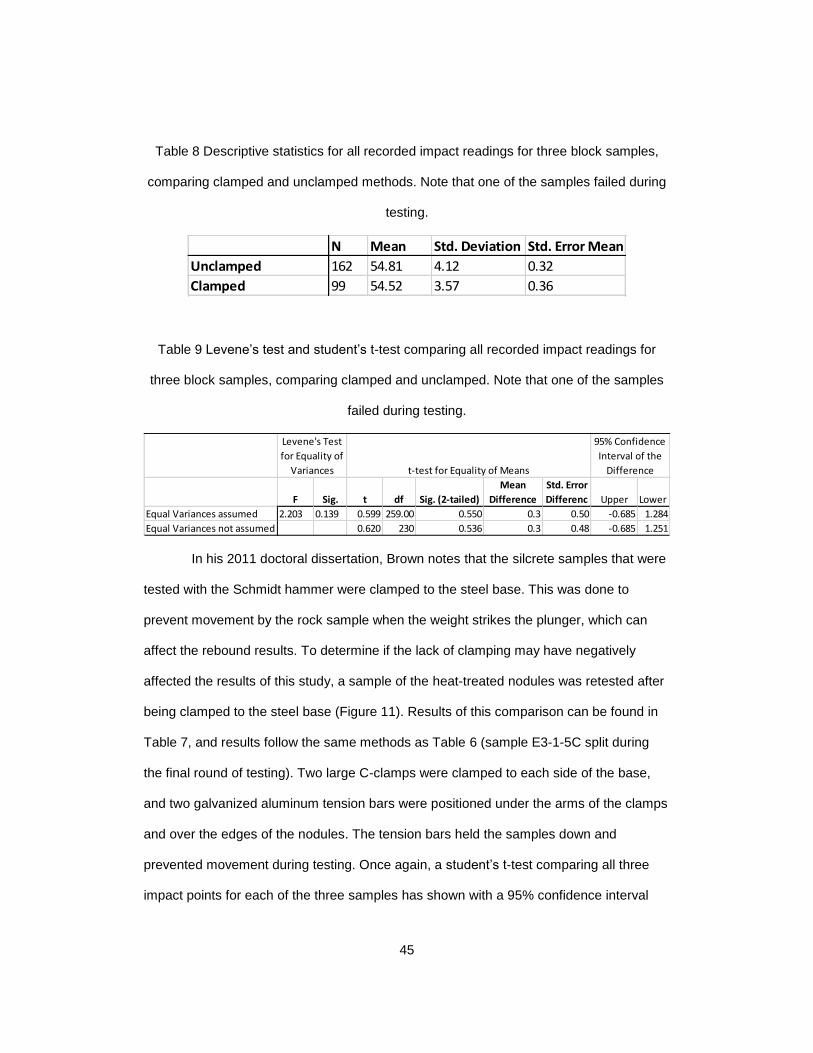
45
Table 8 Descriptive statistics for all recorded impact readings for three block samples,
comparing clamped and unclamped methods. Note that one of the samples failed during
testing.
Table 9 Levene’s test and student’s t-test comparing all recorded impact readings for
three block samples, comparing clamped and unclamped. Note that one of the samples
failed during testing.
In his 2011 doctoral dissertation, Brown notes that the silcrete samples that were
tested with the Schmidt hammer were clamped to the steel base. This was done to
prevent movement by the rock sample when the weight strikes the plunger, which can
affect the rebound results. To determine if the lack of clamping may have negatively
affected the results of this study, a sample of the heat-treated nodules was retested after
being clamped to the steel base (Figure 11). Results of this comparison can be found in
Table 7, and results follow the same methods as Table 6 (sample E3-1-5C split during
the final round of testing). Two large C-clamps were clamped to each side of the base,
and two galvanized aluminum tension bars were positioned under the arms of the clamps
and over the edges of the nodules. The tension bars held the samples down and
prevented movement during testing. Once again, a student’s t-test comparing all three
impact points for each of the three samples has shown with a 95% confidence interval
N Mean Std. Deviation Std. Error Mean
Unclamped 162 54.81 4.12 0.32
Clamped 99 54.52 3.57 0.36
F Sig. t df Sig. (2-tailed)
Mean
Difference
Std. Error
Differenc Upper Lower
Equal Variances assumed 2.203 0.139 0.599 259.00 0.550 0.3 0.50 -0.685 1.284
Equal Variances not assumed 0.620 230 0.536 0.3 0.48 -0.685 1.251
Levene's Test
for Equality of
Variances t-test for Equality of Means
95% Confidence
Interval of the
Difference
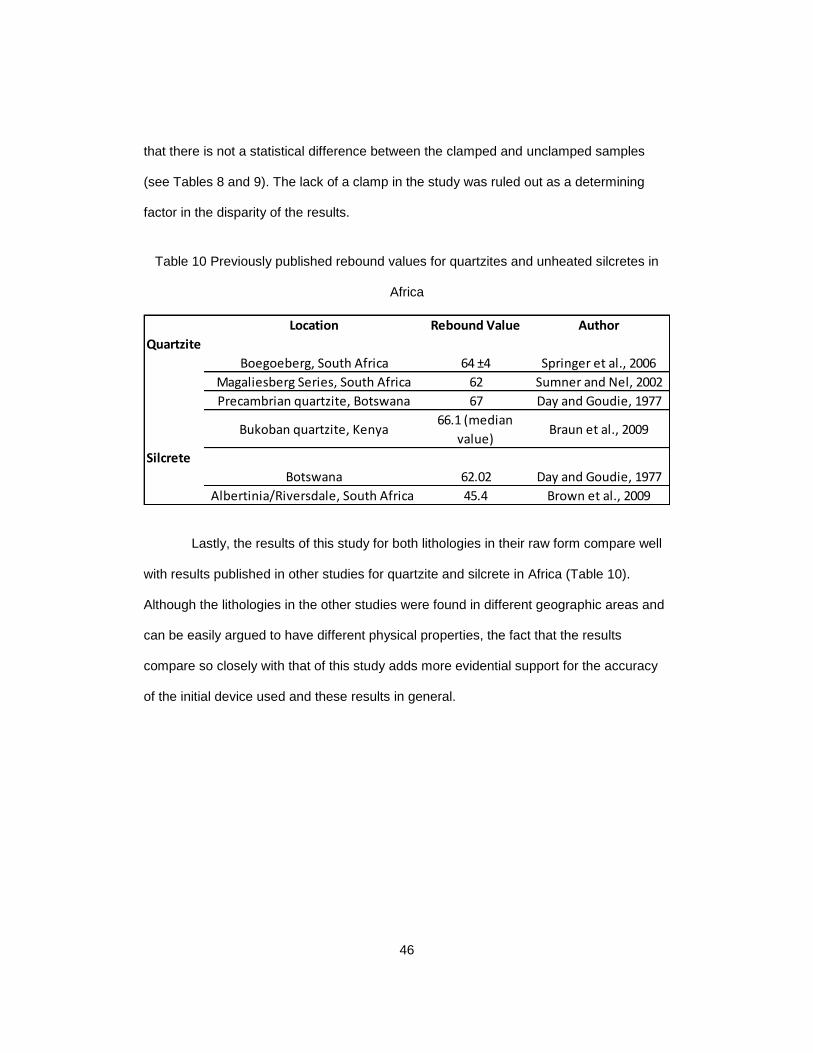
46
that there is not a statistical difference between the clamped and unclamped samples
(see Tables 8 and 9). The lack of a clamp in the study was ruled out as a determining
factor in the disparity of the results.
Table 10 Previously published rebound values for quartzites and unheated silcretes in
Africa
Lastly, the results of this study for both lithologies in their raw form compare well
with results published in other studies for quartzite and silcrete in Africa (Table 10).
Although the lithologies in the other studies were found in different geographic areas and
can be easily argued to have different physical properties, the fact that the results
compare so closely with that of this study adds more evidential support for the accuracy
of the initial device used and these results in general.
Location Rebound Value Author
Quartzite
Boegoeberg, South Africa 64 ±4 Springer et al., 2006
Magaliesberg Series, South Africa 62 Sumner and Nel, 2002
Precambrian quartzite, Botswana 67 Day and Goudie, 1977
Bukoban quartzite, Kenya66.1 (median
value)Braun et al., 2009
Silcrete
Botswana 62.02 Day and Goudie, 1977
Albertinia/Riversdale, South Africa 45.4 Brown et al., 2009

47
Chapter 5
Discussion
Figure 12 Flaked sample exhibiting the color change and luster associated with proper
heat treatment according to Brown and colleagues (2009).
The purpose of this study was to rank the lithologies quantitatively in a non-
destructive fashion and compare these rankings to distance from site to source.
However, the analysis shows that the rebound hardness results taken from the Schmidt
Hammer do not portray knappability as initially suspected. The remaining nine heat-
treated samples were inspected for microfractures and crazing from the heat treatment
process, which would have greatly affected the rebound results. However, no evidence of
poor heat treatment or overheating was detected. Small flakes were removed from the
samples after the final stages of rebound testing. The small flake samples were

48
qualitatively more knappable than pre-treatment, and exhibited the luster indicative of
proper heat treatment (Figure 12) (Brown et al., 2009; Brown, 2011).
In the 2009 study by Brown and colleagues on the heat treatment of silcrete, they
found that there was an average 27.9% increase in rock stiffness between the local
silcrete in its raw form, and after heat treatment modification (based on Young’s modulus
derived from the Schmidt Hammer). The authors attributed this rebound hardness
increase to the increase in flaking quality between the samples (Brown et al., 2009). The
average RH reading for the raw material samples was 45.4 (range: 38.4-54.1), and the
average value for the same samples after heat treatment was 51.3 (range: 47.6-61), a
direct increase in rebound hardness of 13%. The highest percent change of an individual
sample was 26% (sample ALB.A48 RH values 38.4-48.2). Two samples in their study
showed the lowest percent change with a 2% increase.
The current study not only produced a result showing a decrease in RH after
heat treatment, contrasting with the results of Brown and colleagues (2009), but yielded
different initial results than Brown and colleagues as well. The average rebound hardness
value for the raw silcrete was 61.5 (N=22), 35.5% higher than the values published by
Brown and colleagues (2009). The lowest RH value in this sample assemblage was 45,
which directly compares with the other study’s average. Yet, this value is an outlier in the
assemblage. The next lowest RH value is 57, and the remaining samples range from 58
to 68.
The difference in rebound results for both raw and heat-treated silcrete between
this study and that conducted by Brown and colleagues (2009) can best be explained by
Summerfield’s 1981 publication on silcrete in South Africa. In this study, he describes the
silcrete in the Albertinia/Riversdale area (same area sampled for both the Brown and
colleagues (2009) study and the current study) as massive fine-grained material that is

49
creamy-white in color with irregular zones of more dense, gray silcrete (Summerfield,
1981). Further, he tested both colors of silcrete with a Schmidt rebound hammer and
obtained an average reading of 42.9 for the white material, and 55.6 for the gray material
(Summerfield, 1981). Although his sample size was small (total n=10), his average result
for the less dense material is very close to the result for the raw material reported in
Brown and colleagues (2009) of 45.4, and Summerfield’s result for the more dense
material is much closer to the average for the current study (61.5) (Summerfield, 1981).
Brown (2011) acknowledges Summerfield’s finding of two types of silcrete; however,
Brown dismisses Summerfield’s descriptions of the softer, creamy-white silcrete as a
thick cortex or rind to the denser silcrete underneath. Based on the results of this study,
there are in fact at least two types of massive silcrete in the Riversdale/Albertinia area
(possibly more) with different hardness values, and these can be differentiated by color. It
would appear that the majority of the samples tested by Brown and colleagues were of
the softer type, while the majority of those collected for this study were harder.
Nash and colleagues (2013a) were the first to discover a method for
provenancing silcrete sources. In their study, based on the White Paintings Shelter in
northwest Botswana, the researchers found that the MSA hunter/gatherers were traveling
some 220km to collect silcrete for knapping, bypassing not only the local quartz and
quartzite, but the more proximate sources of silcrete as well (Nash et al., 2013a). This is
not an erratic occurrence, but appears regularly throughout the three meters of MSA
deposit at the site (Nash et al., 2013a). The silcrete samples of both the preferred source
and those more proximate that were collected by these researchers, are reported to be
similar in quality, based on simple hand analyses (Nash et al., 2013a). Therefore, a
conclusion has been made that there must be a mechanism for selectivity (cultural or
physical) that has yet to be identified (Nash et al., 2014).

50
Summerfield (1981) claims that the two types of massive silcrete in the
Riversdale/Albertinia area can be differentiated simply by color. If this is correct, then
color could be the mechanism of selectivity for the MSA people. Given the fact that the
massive silcrete can have very different physical properties (based on this study), if color
is the differentiating mechanism, this would have provided ancient gatherers with a rapid
and efficient means of making selective choices and would have improved the entire
collection process in general. Obviously, further testing is required to assess this
hypothesis.
The presence of two types of silcrete where there was previously thought to be
one does not, however, explain the discrepancy in the direction of rebound hardness
change in silcrete between this study and that of Brown and colleagues (2009) and
Brown (2011). What also remains unexplained is why quartzite has a higher RH result
than the heat-treated silcrete, when the coarse-grained quartzite is very obviously more
difficult to knap and cannot produce the same blade and edge qualities. In order to
address these incongruities, Young’s modulus of elasticity as the key mechanical
property and the Schmidt rebound hammer as the principal device in mechanical testing
for the purposes of ranking lithologies according to knappability must be reexamined.
The Schmidt rebound hammer was originally designed to test concrete for civil
engineering. A few impacts with the device are used to determine whether or not a
sample, or in situ concrete, is defective. If the concrete is determined to be defective with
the rebound hammer, a sample is prepared for further, more detailed testing using other
devices and methods (McCarroll, 1989). With this background, the Schmidt hammer was
designed with slight variances in rebound (especially in the higher range) being
meaningless for its purpose (McCarroll, 1989). It was not until later that geologists
adopted the device as a quick method for determining surface hardness. However,

51
despite the fact that both the International Society for Rock Mechanics (ISRM), and the
American Society for Testing and Materials (ASTM) have published methodologies for
testing rocks both in situ and in laboratory settings, these methods vary (ISRM, 1978;
ASTM, 2001; Aydin, 2009; Aydin and Basu, 2005). In fact, a large portion of the peer-
reviewed literature revolving around the Schmidt hammer is published with the purpose
of proposing new methodologies, or supporting/arguing against existing published
methodologies (see Poole and Farmer, 1980; Day and Goudie, 1977; Aydin and Basu,
2005; Aydin, 2009; Kolaiti and Papadopoulus, 1993; ISRM, 1978; ASTM, 2001; Goktan
and Gunes, 2005; Gupta, 2009; Kennedy and Dickson, 2006; Demirdag et al., 2009;
Williams and Robinson, 1983; Fowell and McFeat-Smith, 1976; Hucka, 1965; etc.).
Consensus does not exist on proper sample size, how the sample should be cut, how
many impacts should be taken across a surface, the spacing of the impacts, how many
impacts per test point should be taken, which impact in a series at a specific test point
should be accepted, which data should be added to the analysis and which should be
deleted, how the values should be averaged to produce a result, etc. (McCarroll, 1989).
Moreover, a change in any of these methodologies could change the results completely,
and therefore results are not parallel unless an identical methodology is followed
(Demirdag et al., 2009).
In addition to the variability of the methods and their results, the Schmidt hammer
is also very sensitive to a host of conditions and physical characteristics of the lithology.
Moisture content, unseen geologic defects, micro-fractures, and small surface
irregularities can all have a sizable impact on the resulting values (Goudie, 2006; Viles et
al., 2011). This sensitivity can make the values across the surface of a single sample
extremely variable and difficult to compare with other samples. It is this variability and

52
imprecision of the Schmidt hammer that make the device more practical for preliminary
assessments rather than concluding evaluations (McCarroll, 1989; Yagiz, 2009).
The rebound hammer has been correlated by many authors with Young’s
modulus of elasticity (Goudie, 2006; Yilmaz and Sendir, 2002; Sonmez et al., 2006;
Sachpazis, 1990; Aggistallis et al., 1996; Yilmaz and Yuksek, 2008; Yagiz, 2009; etc.).
However, the formula required to convert rebound hardness to Young’s modulus is not
agreed upon by authors (Dincer et al., 2004; Sonmez et al., 2006; Yaşar and Erdoğan,
2004; Yagiz, 2009). In truth, not only is the formula not agreed upon, but three different
correlation shapes are argued by researchers (Kiliç and Teymen, 2008 see Kidybinski,
1980; Singh et al., 1983; Deere and Miller, 1966). According to Yagiz (2009), although
many of these equations and relationships function correctly in the respective studies,
there is not a specific formula or relationship that can be applied to all rock types and
caution should be taken for any method used.
Finally, we must reevaluate whether or not Young’s modulus of elasticity is the
appropriate mechanical property to determine knappability. As mentioned above,
Cotterell and Kaminga (1987) described Young’s modulus as the property most closely
associated with the ability of a lithology to produce long flakes and blades. This idea was
furthered by Domanski and colleagues in their 1994 study. However, in 2008 Webb and
Domanski published a study which showed that the property had very little variation
between different lithologies, and therefore the researchers would no longer report on
Young’s modulus. This finding is consistent with the results of the present study.
In 1944, Goodman measured the rebound hardness of sample lithologies using a
Shore Scleroscope. The Shore Scleroscope was originally developed for testing metals in
a similar fashion to the Schmidt rebound hammer (Yaşar and Erdoğan, 2004). The device
works by freely dropping a diamond tipped weight onto the testing surface and measuring

53
the resulting rebound of the weight (Yaşar and Erdoğan, 2004). In contrast to the
rebound hammer, the Shore Scleroscope uses a smaller rebounding weight and is not
spring-loaded (Yaşar and Erdoğan, 2004). Given these characteristics, the Sceleroscope
imparts much less energy on the testing surfaces of the samples, possibly reducing the
chance of destroying the sample (Yaşar and Erdoğan, 2004). In her rebound testing,
Goodman (1944) found that there was much more variation and distance among softer
materials (such as limestone) than harder materials (such as flint). Goodman’s (1944)
findings with rebound hardness and Webb and Domanski’s (2008) findings with Young’s
modulus compare well with the findings of this study and implicate a possible hardness
ceiling, above which the differences in Young’s modulus and rebound hardness become
negligible between lithologies. This further indicates that the Schmidt rebound hammer is
not the appropriate device for measuring knappability, as typically the knapped lithologies
will be on the higher range for these measures.
The facts that: 1) there is no agreed upon method for using the Schmidt hammer;
2) there is no agreed upon method for analyzing the results; 3) there are many variables
and conditions that can affect the performance of the Schmidt hammer; 4) and Young’s
modulus of elasticity and rebound hardness seem to vary less among the harder
lithologies, all combine to indicate that the Schmidt hammer should not be the preferred
method of determining knappability. Instead, it is much better suited as a means of
quickly testing in situ lithologies for preliminary results, and should not be the primary
testing method.
54
Chapter 6
Conclusion
This study provides four conclusions that are significant to archaeological
research in the southern African MSA. The first and most important is that there are at
least two different types of massive silcrete in the Albertinia/Riversdale area. In previous
publications, silcrete has been regarded as a single selective option for the MSA
hunter/gatherers (see Brown et al., 2009; Brown 2011; Thompson et al., 2010; Brown et
al., 2012). In reality, agents during this time would have had at least two options of
silcrete available to them, occurring together, in the same geographic area. These two
massive silcrete types have different physical properties (with respect to rebound
hardness), which suggests that they have different knapping qualities, even after heat
treatment. If the knappability of the two silcrete types is substantially different, selection
would have more than likely been affected. This also has implications in raw material
selection for future agent-based modeling and behavioral ecology studies. Without an
understanding of the number of knappable stone types available to the Stone Age
population, proper cost/benefit choice models cannot be constructed.
The second significant finding of this study is that the Schmidt rebound hammer
is an inappropriate device for quantifying knappability of raw material sources. As
discussed above, the Schmidt hammer is too imprecise to compare raw materials for
archaeological purposes. There is no truly agreed upon methodology for using the
device, and there are too many factors to which the device is sensitive that prevent two
lithologies from being directly compared in detail. It is also probable that the lower ranges
of rebound hardness are more descriptive of the material, while different lithologies in the
higher range are less distinguishable, and therefore incomparable (Goodman, 1944).

55
My third significant conclusion is that the N type Schmidt hammer imparts too
much energy onto the sample and is not a truly non-destructive measurement. On
several occasions the device caused flakes (large and small) to detach from the main
sample body. These occurrences were noted during testing, and the impact values on
which they occurred were generally removed from the analysis on suspicion that the
event would cause errors in the value. On one occasion, the sample block was
completely split in two after an impact. According to at least one other researcher, cases
such as these are not rare (Braun pers. comm. 2014). The purpose of the non-destructive
test is to eventually test actual archaeological samples, and to be able to replicate testing
or conduct new methods of testing on the same samples. The Schmidt hammer has
proven to be much too destructive to use on actual archaeological samples, and
therefore is not the appropriate device for this form of testing.
Finally, I conclude that devices that measure rebound hardness with less impact,
such as the L type Schmidt hammer (uses a smaller rebounding weight than the N type)
or the Shore scleroscope, could be used with less likelihood of destroying samples.
These methods may require smaller sample sizes, and the softer impact may be able to
show variability at a finer scale. Ultrasonic p- and s-waves could also be used non-
destructively to directly measure Young’s modulus (although this would require a
laboratory setting) (Chirstaras et al., 1994). However, Goodman (1944) used a Shore
scleroscope in her first study of raw material properties, and found that the rebound
results of those lithologies in the upper range of hardness were much less distinguishable
than the lower range. These findings would suggest that any device used to determine
rebound hardness would encounter the same problems. Additionally, this study serves to
corroborate the finding of Webb and Domanski (2008), in which it was found that there is
little variation of Young’s modulus of elasticity between lithologies. Despite findings by

56
Cotterell and Kamminga (1987), this mechanical property should no longer be used to
describe knappability.

57
Chapter 7
Future Research
The original purpose of this study was to create a cost/benefit model for raw
material procurement near the Pinnacle Point Middle Stone Age site. This was to be done
by first quantitatively ranking the raw materials according to mechanical properties that
have been associated with knappability. Once the raw material outcrops were mapped
and given a numerical ranking of desirability according to quantified knapping qualities, a
GIS model was to be created with least cost distances (based on slope and the
avoidance of large bodies of water) from site to source. From this model, the cost of
collection in either calories or time could be derived for each outcrop and directly
compared to the benefit of knappability (Taliaferro et al., 2010; Howey, 2007; Tobler,
1993). Eventually, these data could be integrated into an agent-based simulation model,
developed at The School of Human Evolution and Social Change, Arizona State
University, to investigate the decision making strategies of Middle Stone Age foragers.
The costs and benefits of raw material acquisitions can be directly compared to the lithic
assemblage at Pinnacle Point, the faunal record, and proxy climatic indicators to better
understand early human choice patterns. These methods can also be employed across a
multitude of MSA sites in South Africa to form a more accurate and detailed analysis of
early Homo sapiens choice patterns and the factors which may have influenced these
patterns. However, based on the results described above, these goals could not be
accomplished in the current study. Below are listed the future steps to be taken in order
to provide the information required for a proper agent based-model for raw material
acquisition.
The first step that must be taken is a more in-depth survey of the silcrete around
Pinnacle Point. Most importantly, it must be determined whether or not the silcrete in the

58
area can consistently be placed in two (possibly more) types based on mechanical
properties. Conversely, the massive silcrete may prove a gradient of hardness
characteristics, and will not lend itself to be placed into specific types. Further, we must
determine if there is a correlation between mechanical properties and the color of the
silcrete. Although Summerfield has conducted many thorough surveys of the silcrete
along the South African southern coast, his focus was not to determine the mechanical
properties of the massive silcrete, nor to identify different types of massive silcrete that
could be used as raw material. To do this, numerous samples must be taken from the
existing outcrops, the color recorded, and a suite of mechanical tests (probably
destructive) must be performed to determine mechanical differences between silcrete
nodules sampled in the area, if this difference is consistent, by what magnitude this
difference exits, and if there is a correlation between differences and color.
Next, we must turn to the archaeological record and determine if the MSA people
were making selection choices based on these mechanical properties. One method
would be to determine if the trace elements could be sourced for the outcrops in the area,
if these trace elements could be associated with physical properties (such as color), and
if trace elements could differentiate mechanical properties as well (Nash et al., 2013a).
However, Nash and colleagues (2013b) have determined that the heat treatment process
changes the chemical composition enough to render their sourcing techniques invalid.
Additionally, the silcrete can change color after heat treatment, which makes the process
of identifying a color choice pattern of the raw material much more difficult (Brown et al.,
2009; Brown, 2011). Experiments will have to be completed in order to see if there is a
pattern from the original color of the raw material to the color after the heat treatment
experiments. In this case, actualistic experiments will need to be performed with
campfires and shallow sand baths, as this method creates environments with a very low

59
amount of oxygen (compared to the electric kiln method), which could affect the color
change process (Brown, 2011).
Ultimately, to understand the nature of the materials the MSA people were
selecting for, a truly non-destructive method which has been proven as a knapapbility
proxy must be employed. As this study has shown, Young’s modulus of elasticity and the
Schmidt rebound hammer are not appropriate for quantifying knappability. Domanski and
colleagues (1994) have shown that the chevron-notched, short-rod fracture toughness
test is the most closely associated test to knappability to date, although it is destructive
and requires a laboratory setting. Surface roughness testing by Yonekura and Suzuki
(2009) also has some promise in determining knappability, though it is destructive and
requires a great amount of laboratory preparation. However, if it can be determined
definitively what types of silcrete are being selected for from the archaeological record,
samples can be collected from the specific outcrops, and directly testing the
archaeological samples will no longer be necessary.
In the future, more emphasis should be directed towards mechanical testing and
physical properties in lithic studies and archaeology in general. It is truly surprising how
this area has been neglected in archaeological analyses. It would seem that the physical
properties of the stone which allow for knappability, and the scientific approach of
quantitatively ranking the raw materials according to their properties would be
fundamental when describing any site archaeologically. Through these investigations, we
can better understand the choices that were presented to Stone Age humans, and
possibly what drove the decisions of these people. As Goodman argued in 1944, to truly
understand an ancient people, all avenues of logic and every possible variable must be
thoroughly and exhaustively examined.

60
Appendix A
Individual Rebound Hardness Results for Quartzite
61
Appendix A shows the individual rebound analyses of each quartzite sample. In the
following table, the accepted ten impact values for each sample are in bold with an asterisk. The
mean of these ten values is the Rebound Hardness value for the sample, and can be found in
bold at the bottom of each sample. The analyses followed the methods defined by Braun and
colleagues (2009), Goudie (2006), and Brown (2011). As described in chapter 3, each point of
impact was struck at least three times. If one or more of the results were flawed due to plunger
slip, geologic defects, surface defects, or some other reason, more impacts were added to
ensure accuracy. Unless flawed, the initial impact at each impact point was used in the analysis.
Eighteen impact values were used for each testing surface. The highest four and the lowest
four values were then removed to account for outliers (this is noted as “high” and “low” in the
“Reason for exclusion” column). Due to the large size of some of the sample surfaces and the
impact points being placed in a grid 1.5cm apart, more than eighteen impact points were
regularly taken. To account for this, the values from impact points closest to the edge were
removed until eighteen remained (explained in greater detail in chapter 3).
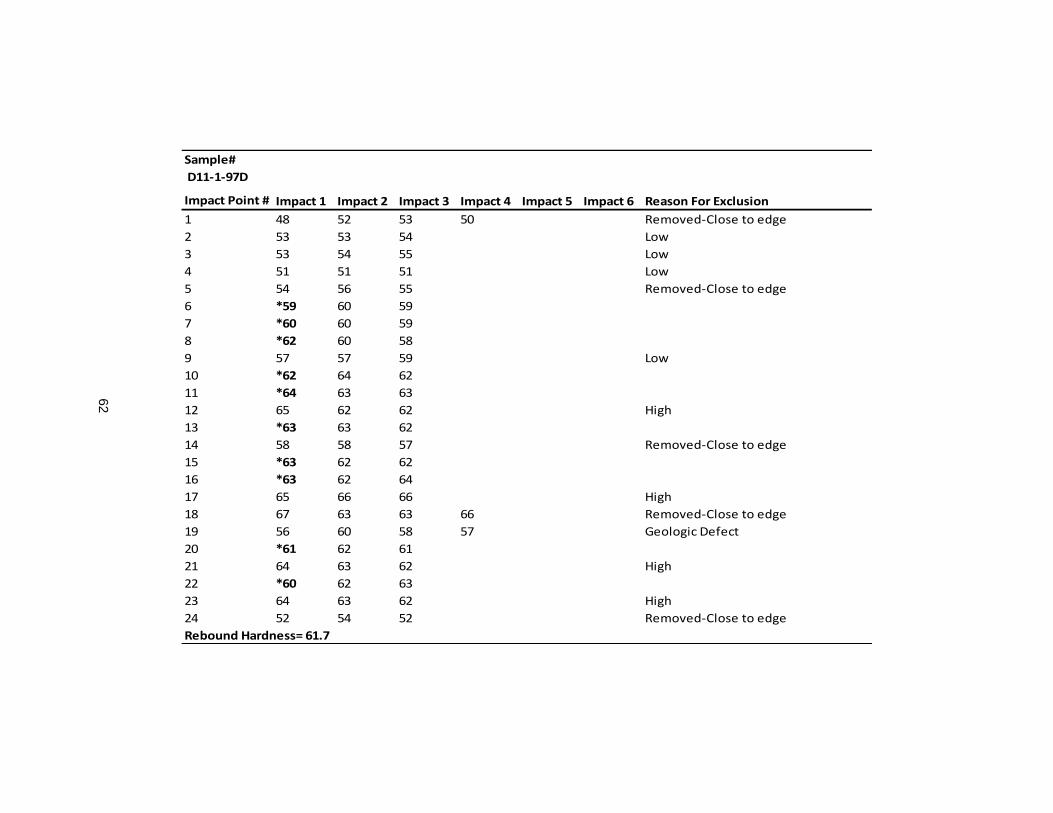
62
Sample#
D11-1-97D
Impact Point # Impact 1 Impact 2 Impact 3 Impact 4 Impact 5 Impact 6 Reason For Exclusion
1 48 52 53 50 Removed-Close to edge
2 53 53 54 Low
3 53 54 55 Low
4 51 51 51 Low
5 54 56 55 Removed-Close to edge
6 *59 60 59
7 *60 60 59
8 *62 60 58
9 57 57 59 Low
10 *62 64 62
11 *64 63 63
12 65 62 62 High
13 *63 63 62
14 58 58 57 Removed-Close to edge
15 *63 62 62
16 *63 62 64
17 65 66 66 High
18 67 63 63 66 Removed-Close to edge
19 56 60 58 57 Geologic Defect
20 *61 62 61
21 64 63 62 High
22 *60 62 63
23 64 63 62 High
24 52 54 52 Removed-Close to edge
Rebound Hardness= 61.7
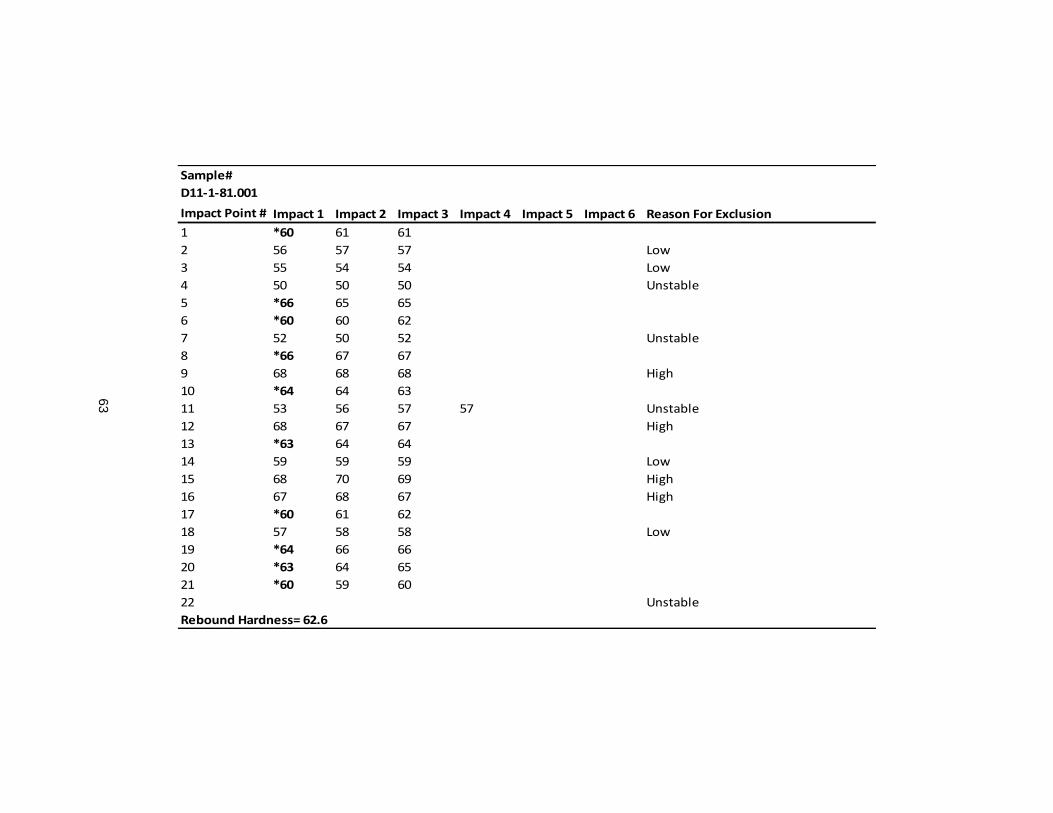
63
Sample#
D11-1-81.001
Impact Point # Impact 1 Impact 2 Impact 3 Impact 4 Impact 5 Impact 6 Reason For Exclusion
1 *60 61 61
2 56 57 57 Low
3 55 54 54 Low
4 50 50 50 Unstable
5 *66 65 65
6 *60 60 62
7 52 50 52 Unstable
8 *66 67 67
9 68 68 68 High
10 *64 64 63
11 53 56 57 57 Unstable
12 68 67 67 High
13 *63 64 64
14 59 59 59 Low
15 68 70 69 High
16 67 68 67 High
17 *60 61 62
18 57 58 58 Low
19 *64 66 66
20 *63 64 65
21 *60 59 60
22 Unstable
Rebound Hardness= 62.6
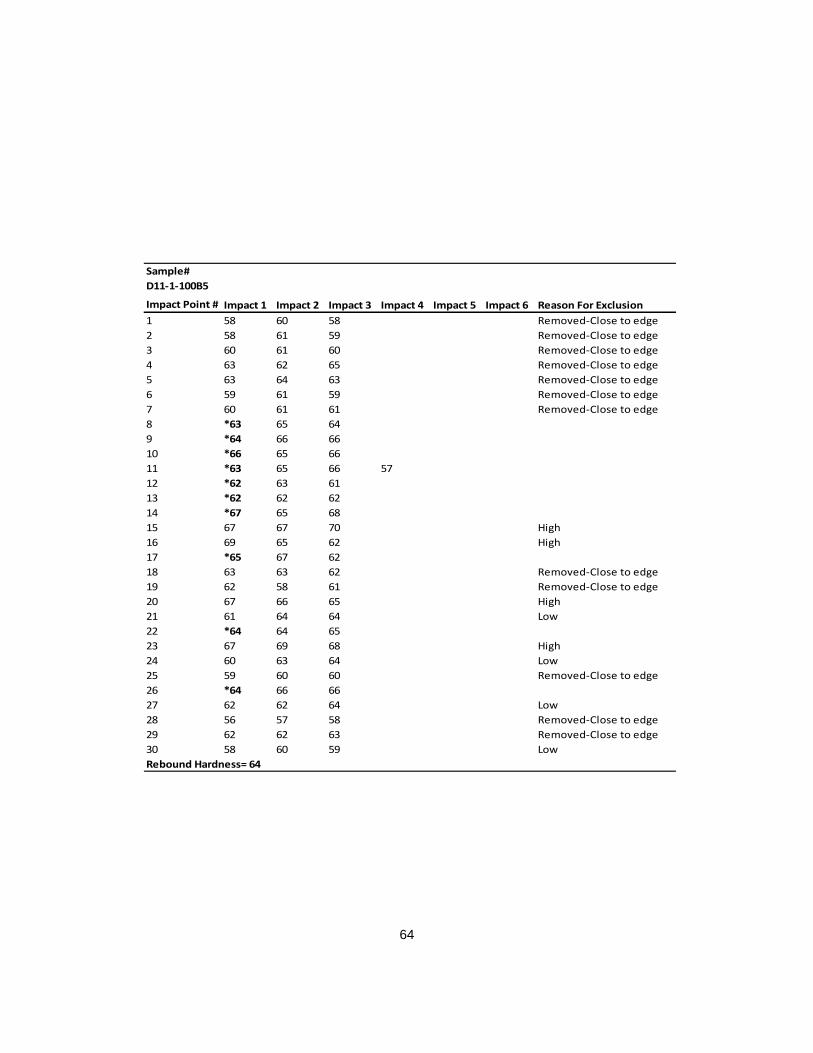
64
Sample#
D11-1-100B5
Impact Point # Impact 1 Impact 2 Impact 3 Impact 4 Impact 5 Impact 6 Reason For Exclusion
1 58 60 58 Removed-Close to edge
2 58 61 59 Removed-Close to edge
3 60 61 60 Removed-Close to edge
4 63 62 65 Removed-Close to edge
5 63 64 63 Removed-Close to edge
6 59 61 59 Removed-Close to edge
7 60 61 61 Removed-Close to edge
8 *63 65 64
9 *64 66 66
10 *66 65 66
11 *63 65 66 57
12 *62 63 61
13 *62 62 62
14 *67 65 68
15 67 67 70 High
16 69 65 62 High
17 *65 67 62
18 63 63 62 Removed-Close to edge
19 62 58 61 Removed-Close to edge
20 67 66 65 High
21 61 64 64 Low
22 *64 64 65
23 67 69 68 High
24 60 63 64 Low
25 59 60 60 Removed-Close to edge
26 *64 66 66
27 62 62 64 Low
28 56 57 58 Removed-Close to edge
29 62 62 63 Removed-Close to edge
30 58 60 59 Low
Rebound Hardness= 64
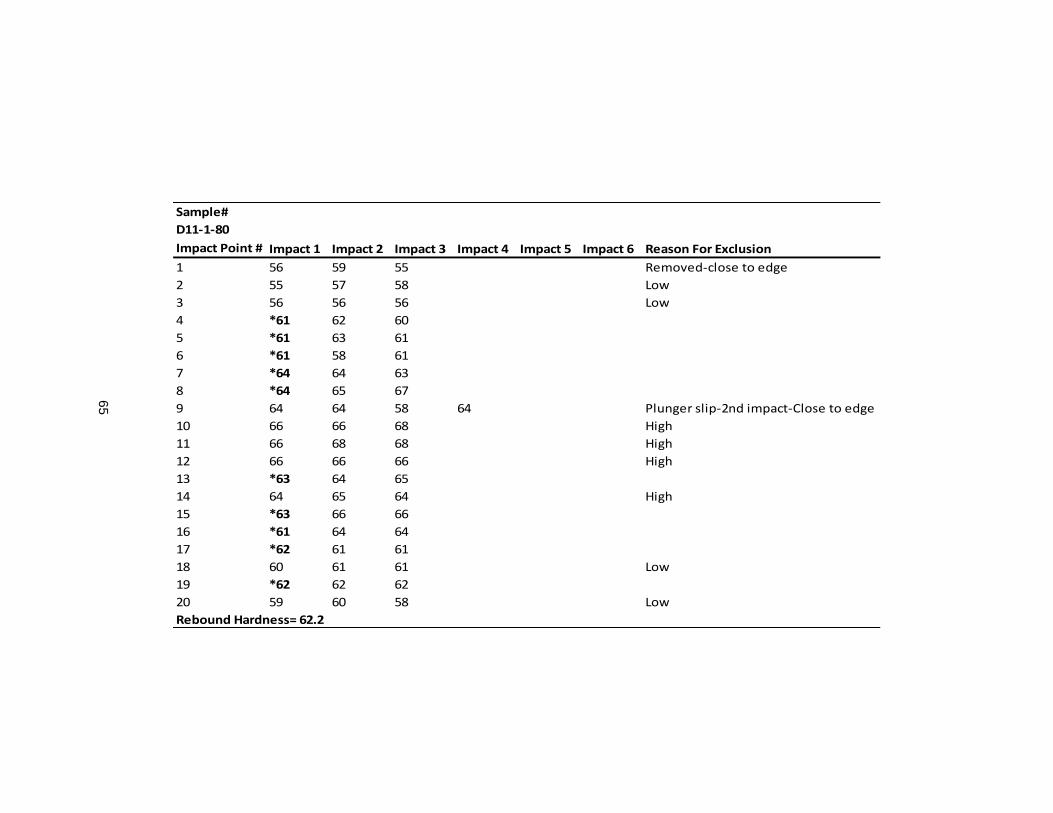
65
Sample#
D11-1-80
Impact Point # Impact 1 Impact 2 Impact 3 Impact 4 Impact 5 Impact 6 Reason For Exclusion
1 56 59 55 Removed-close to edge
2 55 57 58 Low
3 56 56 56 Low
4 *61 62 60
5 *61 63 61
6 *61 58 61
7 *64 64 63
8 *64 65 67
9 64 64 58 64 Plunger slip-2nd impact-Close to edge
10 66 66 68 High
11 66 68 68 High
12 66 66 66 High
13 *63 64 65
14 64 65 64 High
15 *63 66 66
16 *61 64 64
17 *62 61 61
18 60 61 61 Low
19 *62 62 62
20 59 60 58 Low
Rebound Hardness= 62.2
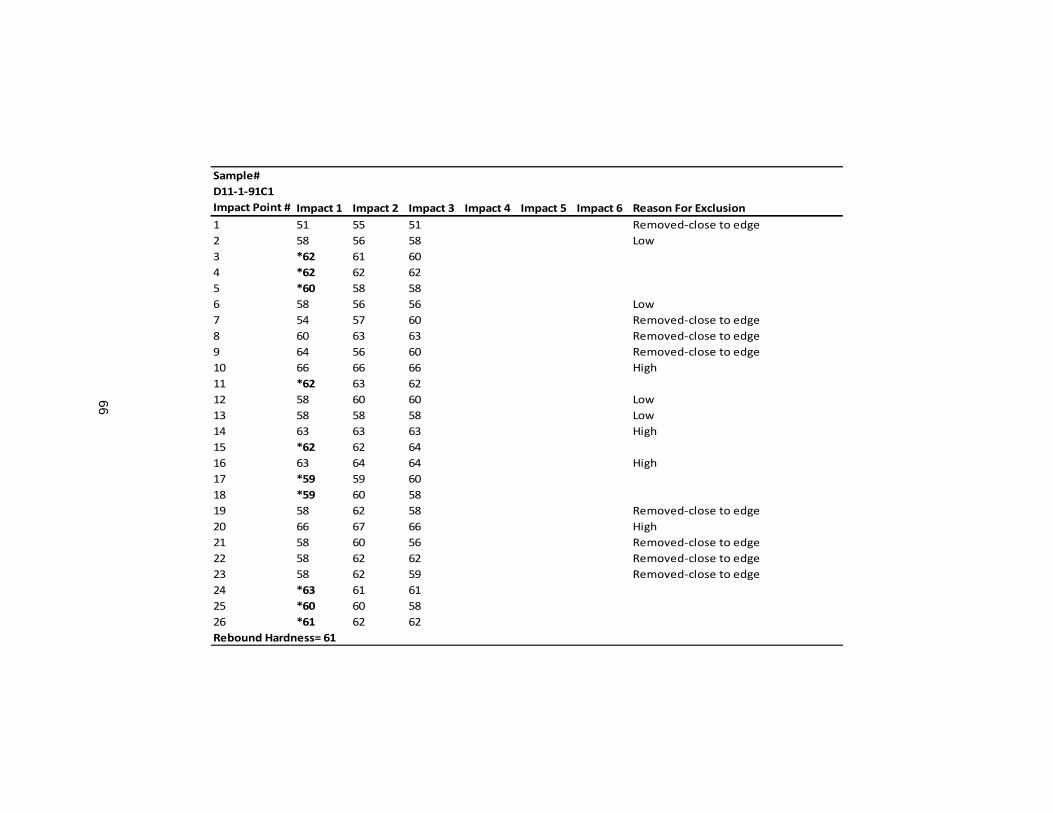
66
Sample#
D11-1-91C1
Impact Point # Impact 1 Impact 2 Impact 3 Impact 4 Impact 5 Impact 6 Reason For Exclusion
1 51 55 51 Removed-close to edge
2 58 56 58 Low
3 *62 61 60
4 *62 62 62
5 *60 58 58
6 58 56 56 Low
7 54 57 60 Removed-close to edge
8 60 63 63 Removed-close to edge
9 64 56 60 Removed-close to edge
10 66 66 66 High
11 *62 63 62
12 58 60 60 Low
13 58 58 58 Low
14 63 63 63 High
15 *62 62 64
16 63 64 64 High
17 *59 59 60
18 *59 60 58
19 58 62 58 Removed-close to edge
20 66 67 66 High
21 58 60 56 Removed-close to edge
22 58 62 62 Removed-close to edge
23 58 62 59 Removed-close to edge
24 *63 61 61
25 *60 60 58
26 *61 62 62
Rebound Hardness= 61
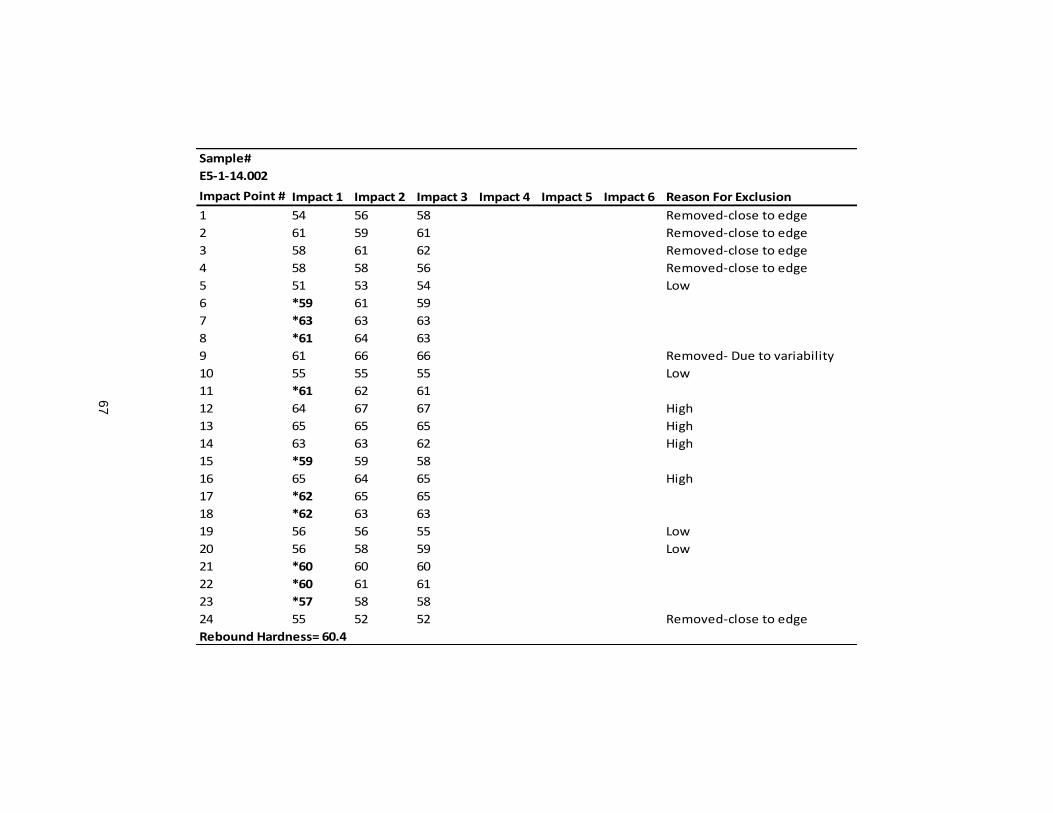
67
Sample#
E5-1-14.002
Impact Point # Impact 1 Impact 2 Impact 3 Impact 4 Impact 5 Impact 6 Reason For Exclusion
1 54 56 58 Removed-close to edge
2 61 59 61 Removed-close to edge
3 58 61 62 Removed-close to edge
4 58 58 56 Removed-close to edge
5 51 53 54 Low
6 *59 61 59
7 *63 63 63
8 *61 64 63
9 61 66 66 Removed- Due to variability
10 55 55 55 Low
11 *61 62 61
12 64 67 67 High
13 65 65 65 High
14 63 63 62 High
15 *59 59 58
16 65 64 65 High
17 *62 65 65
18 *62 63 63
19 56 56 55 Low
20 56 58 59 Low
21 *60 60 60
22 *60 61 61
23 *57 58 58
24 55 52 52 Removed-close to edge
Rebound Hardness= 60.4
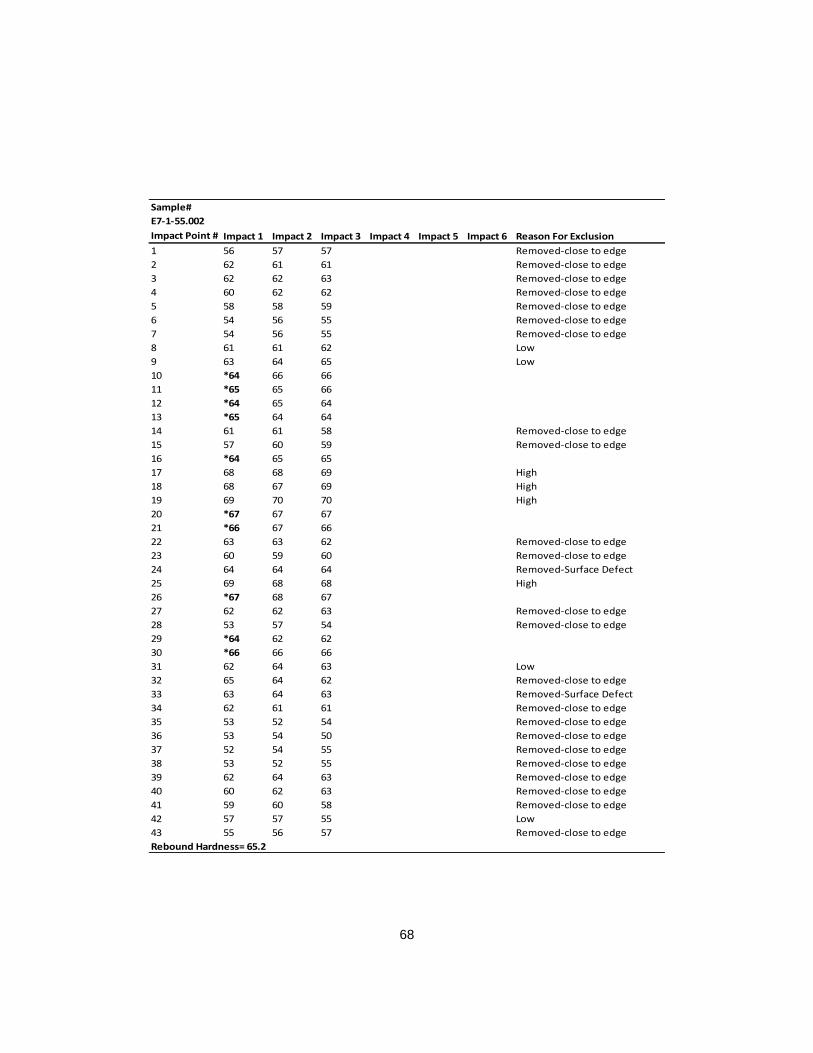
68
Sample#
E7-1-55.002
Impact Point # Impact 1 Impact 2 Impact 3 Impact 4 Impact 5 Impact 6 Reason For Exclusion
1 56 57 57 Removed-close to edge
2 62 61 61 Removed-close to edge
3 62 62 63 Removed-close to edge
4 60 62 62 Removed-close to edge
5 58 58 59 Removed-close to edge
6 54 56 55 Removed-close to edge
7 54 56 55 Removed-close to edge
8 61 61 62 Low
9 63 64 65 Low
10 *64 66 66
11 *65 65 66
12 *64 65 64
13 *65 64 64
14 61 61 58 Removed-close to edge
15 57 60 59 Removed-close to edge
16 *64 65 65
17 68 68 69 High
18 68 67 69 High
19 69 70 70 High
20 *67 67 67
21 *66 67 66
22 63 63 62 Removed-close to edge
23 60 59 60 Removed-close to edge
24 64 64 64 Removed-Surface Defect
25 69 68 68 High
26 *67 68 67
27 62 62 63 Removed-close to edge
28 53 57 54 Removed-close to edge
29 *64 62 62
30 *66 66 66
31 62 64 63 Low
32 65 64 62 Removed-close to edge
33 63 64 63 Removed-Surface Defect
34 62 61 61 Removed-close to edge
35 53 52 54 Removed-close to edge
36 53 54 50 Removed-close to edge
37 52 54 55 Removed-close to edge
38 53 52 55 Removed-close to edge
39 62 64 63 Removed-close to edge
40 60 62 63 Removed-close to edge
41 59 60 58 Removed-close to edge
42 57 57 55 Low
43 55 56 57 Removed-close to edge
Rebound Hardness= 65.2
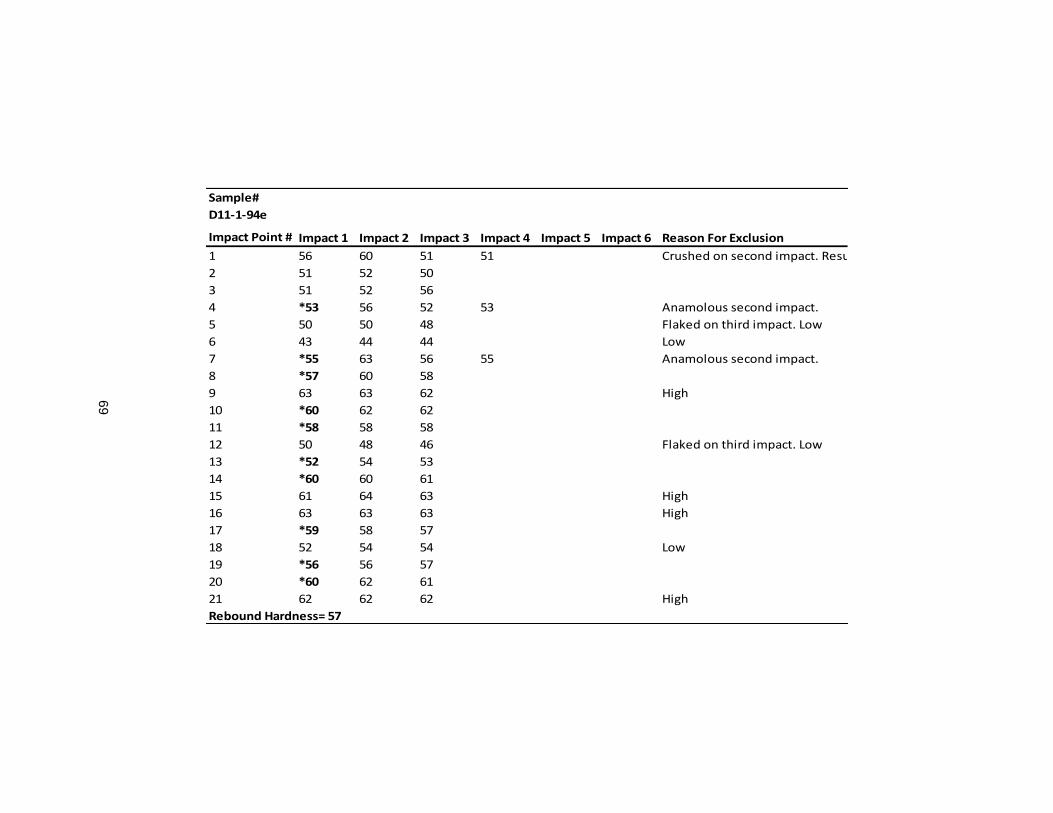
69
Sample#
D11-1-94e
Impact Point # Impact 1 Impact 2 Impact 3 Impact 4 Impact 5 Impact 6 Reason For Exclusion
1 56 60 51 51 Crushed on second impact. Results variable.
2 51 52 50
3 51 52 56
4 *53 56 52 53 Anamolous second impact.
5 50 50 48 Flaked on third impact. Low
6 43 44 44 Low
7 *55 63 56 55 Anamolous second impact.
8 *57 60 58
9 63 63 62 High
10 *60 62 62
11 *58 58 58
12 50 48 46 Flaked on third impact. Low
13 *52 54 53
14 *60 60 61
15 61 64 63 High
16 63 63 63 High
17 *59 58 57
18 52 54 54 Low
19 *56 56 57
20 *60 62 61
21 62 62 62 High
Rebound Hardness= 57
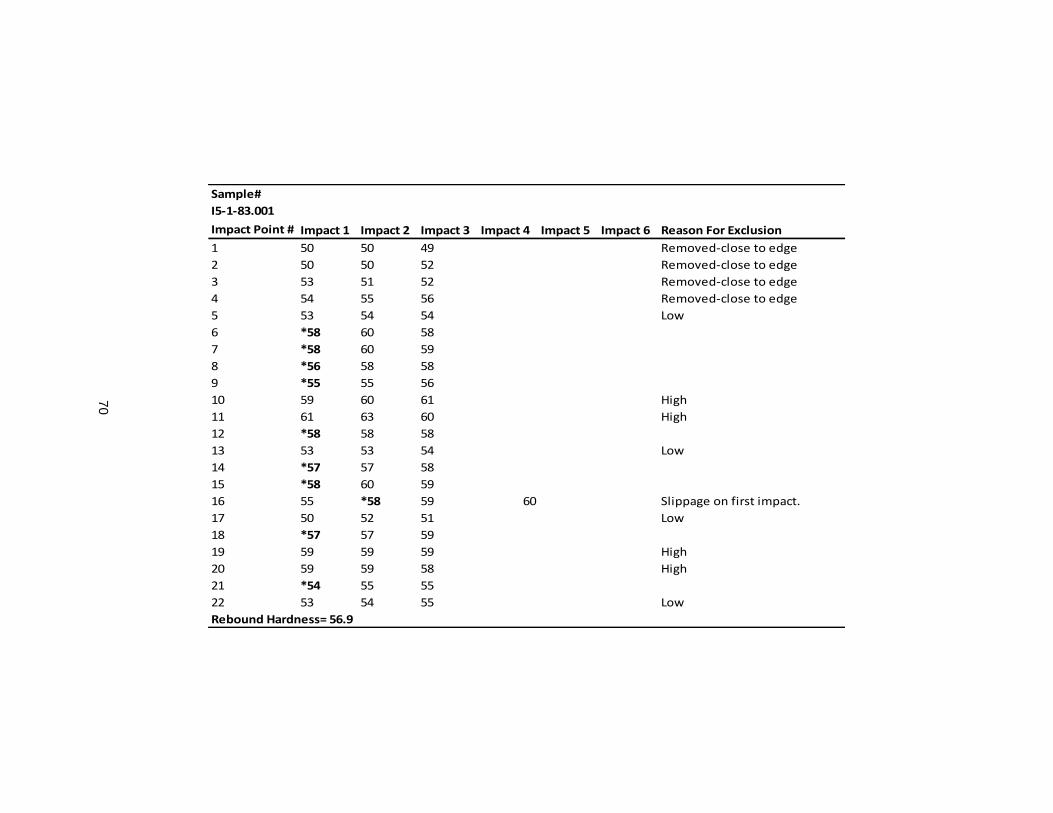
70
Sample#
I5-1-83.001
Impact Point # Impact 1 Impact 2 Impact 3 Impact 4 Impact 5 Impact 6 Reason For Exclusion
1 50 50 49 Removed-close to edge
2 50 50 52 Removed-close to edge
3 53 51 52 Removed-close to edge
4 54 55 56 Removed-close to edge
5 53 54 54 Low
6 *58 60 58
7 *58 60 59
8 *56 58 58
9 *55 55 56
10 59 60 61 High
11 61 63 60 High
12 *58 58 58
13 53 53 54 Low
14 *57 57 58
15 *58 60 59
16 55 *58 59 60 Slippage on first impact.
17 50 52 51 Low
18 *57 57 59
19 59 59 59 High
20 59 59 58 High
21 *54 55 55
22 53 54 55 Low
Rebound Hardness= 56.9

71
Sample#
D11-3-1c
Impact Point # Impact 1 Impact 2 Impact 3 Impact 4 Impact 5 Impact 6 Reason For Exclusion
1 60 58 59 Removed-close to edge
2 63 61 61 Removed-close to edge
3 65 65 65 Removed-close to edge
4 62 64 64 Removed-close to edge
5 61 61 61 Removed-close to edge
6 58 58 57 Removed- Unstable
7 58 58 58 Removed- Unstable
8 *64 65 64
9 *65 65 66
10 69 70 70 High
11 *68 68 69
12 *65 65 65
13 62 61 62 Low
14 58 60 59 Removed- Unstable
15 *65 65 64
16 68 68 68 High
17 68 70 70 High
18 68 67 67 High
19 *65 65 65
20 56 57 55 Removed- Unstable
21 *64 63 62
22 64 64 64 Low
23 *66 66 68
24 *66 66 64
25 *65 64 64
26 58 59 58 Low
27 58 58 59 Low
Rebound Hardness= 65.3
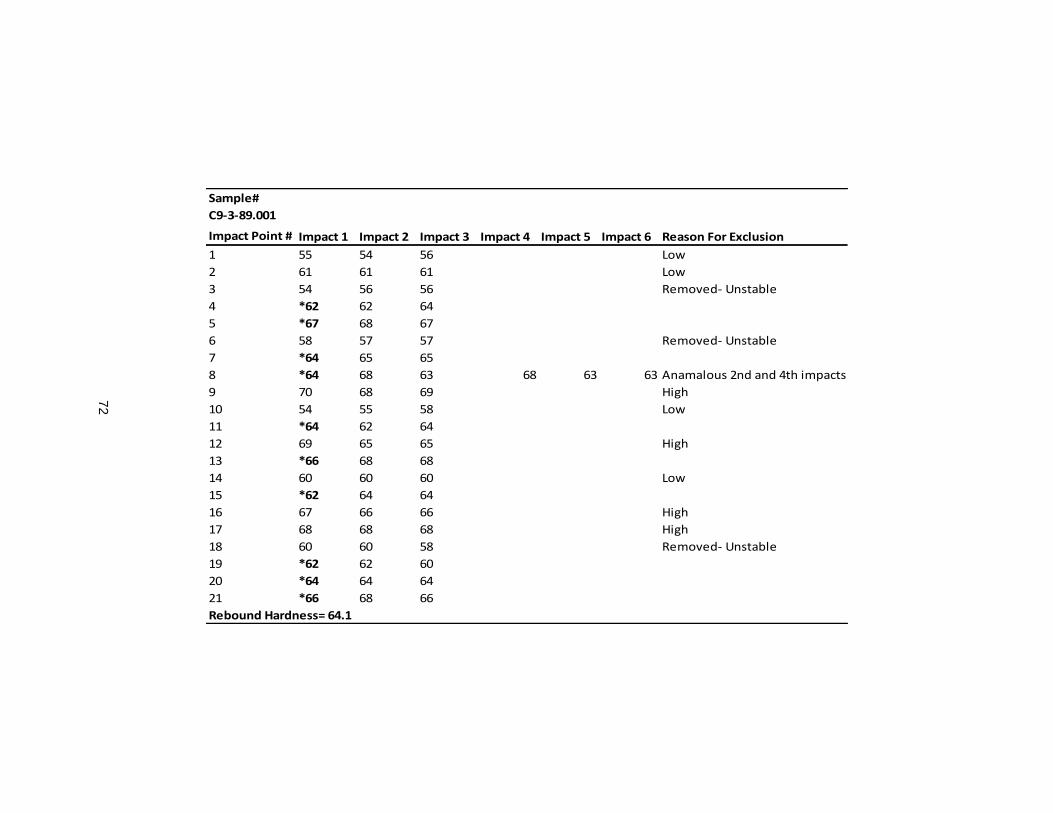
72
Sample#
C9-3-89.001
Impact Point # Impact 1 Impact 2 Impact 3 Impact 4 Impact 5 Impact 6 Reason For Exclusion
1 55 54 56 Low
2 61 61 61 Low
3 54 56 56 Removed- Unstable
4 *62 62 64
5 *67 68 67
6 58 57 57 Removed- Unstable
7 *64 65 65
8 *64 68 63 68 63 63 Anamalous 2nd and 4th impacts.
9 70 68 69 High
10 54 55 58 Low
11 *64 62 64
12 69 65 65 High
13 *66 68 68
14 60 60 60 Low
15 *62 64 64
16 67 66 66 High
17 68 68 68 High
18 60 60 58 Removed- Unstable
19 *62 62 60
20 *64 64 64
21 *66 68 66
Rebound Hardness= 64.1
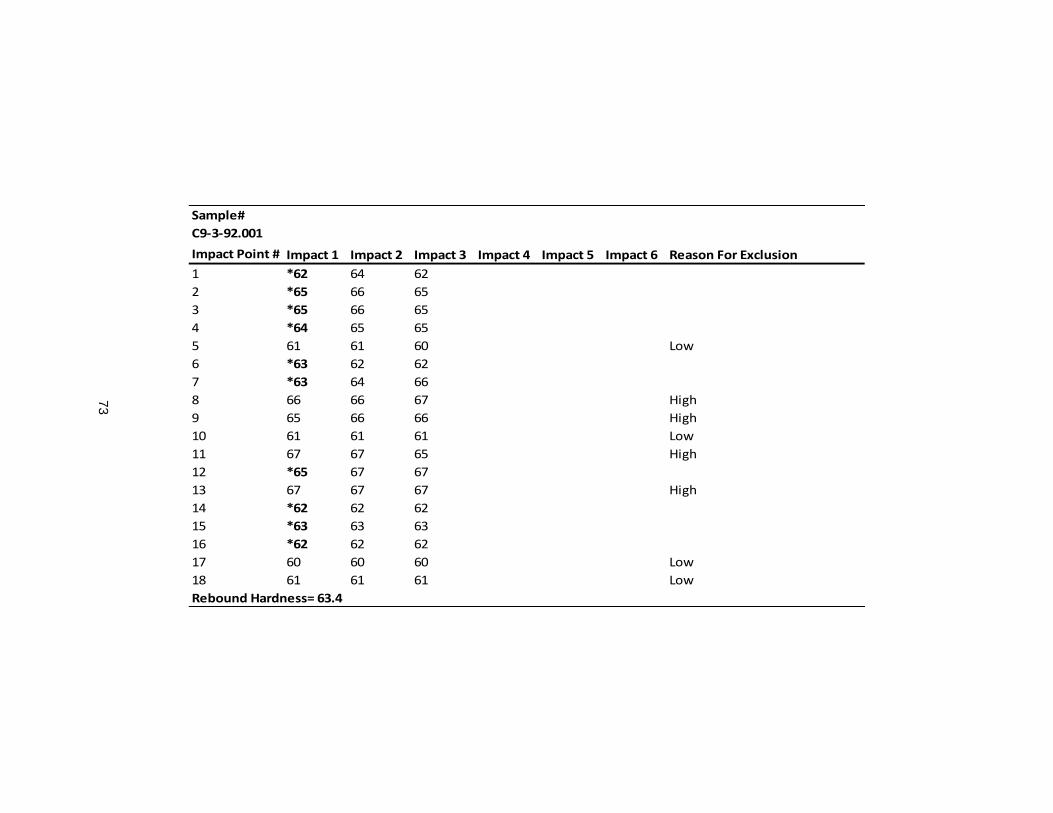
73
Sample#
C9-3-92.001
Impact Point # Impact 1 Impact 2 Impact 3 Impact 4 Impact 5 Impact 6 Reason For Exclusion
1 *62 64 62
2 *65 66 65
3 *65 66 65
4 *64 65 65
5 61 61 60 Low
6 *63 62 62
7 *63 64 66
8 66 66 67 High
9 65 66 66 High
10 61 61 61 Low
11 67 67 65 High
12 *65 67 67
13 67 67 67 High
14 *62 62 62
15 *63 63 63
16 *62 62 62
17 60 60 60 Low
18 61 61 61 Low
Rebound Hardness= 63.4
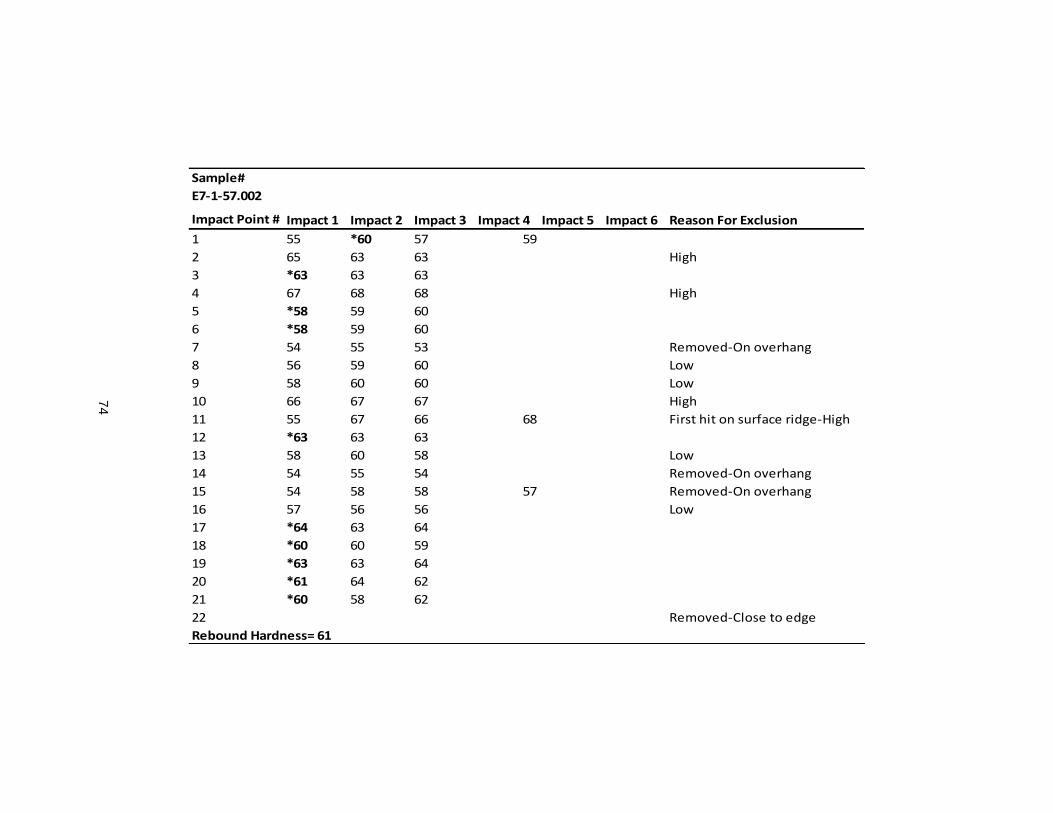
74
Sample#
E7-1-57.002
Impact Point # Impact 1 Impact 2 Impact 3 Impact 4 Impact 5 Impact 6 Reason For Exclusion
1 55 *60 57 59
2 65 63 63 High
3 *63 63 63
4 67 68 68 High
5 *58 59 60
6 *58 59 60
7 54 55 53 Removed-On overhang
8 56 59 60 Low
9 58 60 60 Low
10 66 67 67 High
11 55 67 66 68 First hit on surface ridge-High
12 *63 63 63
13 58 60 58 Low
14 54 55 54 Removed-On overhang
15 54 58 58 57 Removed-On overhang
16 57 56 56 Low
17 *64 63 64
18 *60 60 59
19 *63 63 64
20 *61 64 62
21 *60 58 62
22 Removed-Close to edge
Rebound Hardness= 61
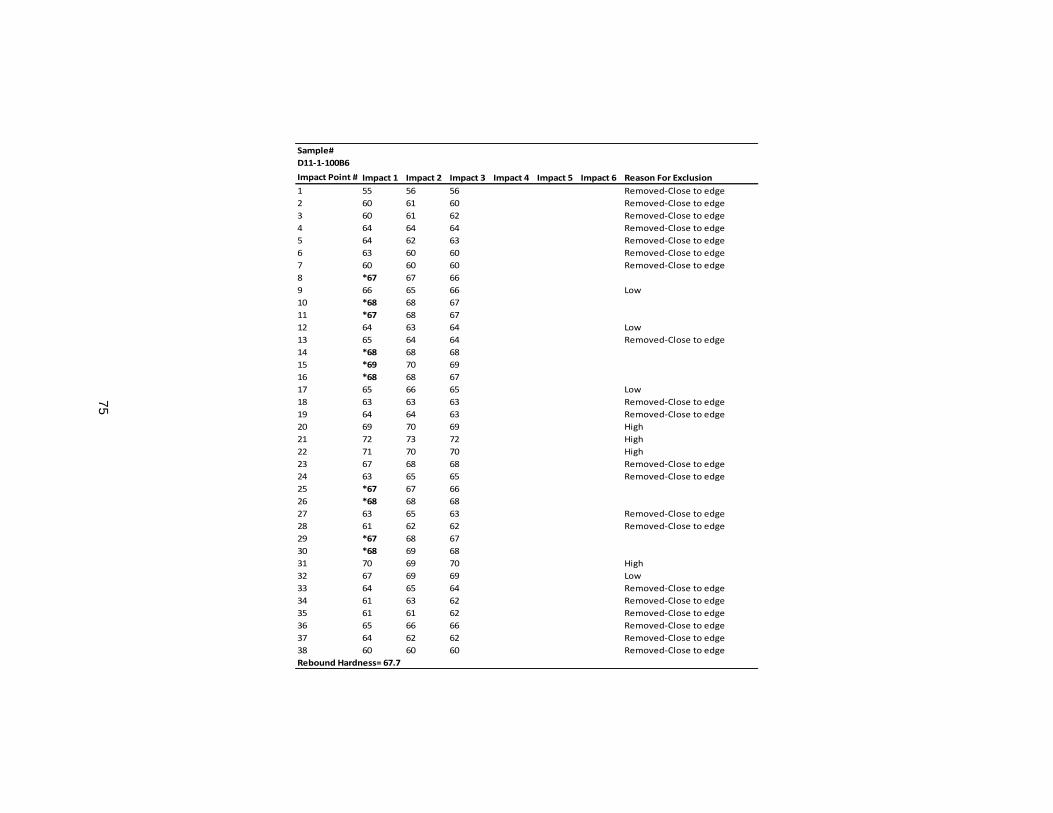
75
Sample#
D11-1-100B6
Impact Point # Impact 1 Impact 2 Impact 3 Impact 4 Impact 5 Impact 6 Reason For Exclusion
1 55 56 56 Removed-Close to edge
2 60 61 60 Removed-Close to edge
3 60 61 62 Removed-Close to edge
4 64 64 64 Removed-Close to edge
5 64 62 63 Removed-Close to edge
6 63 60 60 Removed-Close to edge
7 60 60 60 Removed-Close to edge
8 *67 67 66
9 66 65 66 Low
10 *68 68 67
11 *67 68 67
12 64 63 64 Low
13 65 64 64 Removed-Close to edge
14 *68 68 68
15 *69 70 69
16 *68 68 67
17 65 66 65 Low
18 63 63 63 Removed-Close to edge
19 64 64 63 Removed-Close to edge
20 69 70 69 High
21 72 73 72 High
22 71 70 70 High
23 67 68 68 Removed-Close to edge
24 63 65 65 Removed-Close to edge
25 *67 67 66
26 *68 68 68
27 63 65 63 Removed-Close to edge
28 61 62 62 Removed-Close to edge
29 *67 68 67
30 *68 69 68
31 70 69 70 High
32 67 69 69 Low
33 64 65 64 Removed-Close to edge
34 61 63 62 Removed-Close to edge
35 61 61 62 Removed-Close to edge
36 65 66 66 Removed-Close to edge
37 64 62 62 Removed-Close to edge
38 60 60 60 Removed-Close to edge
Rebound Hardness= 67.7
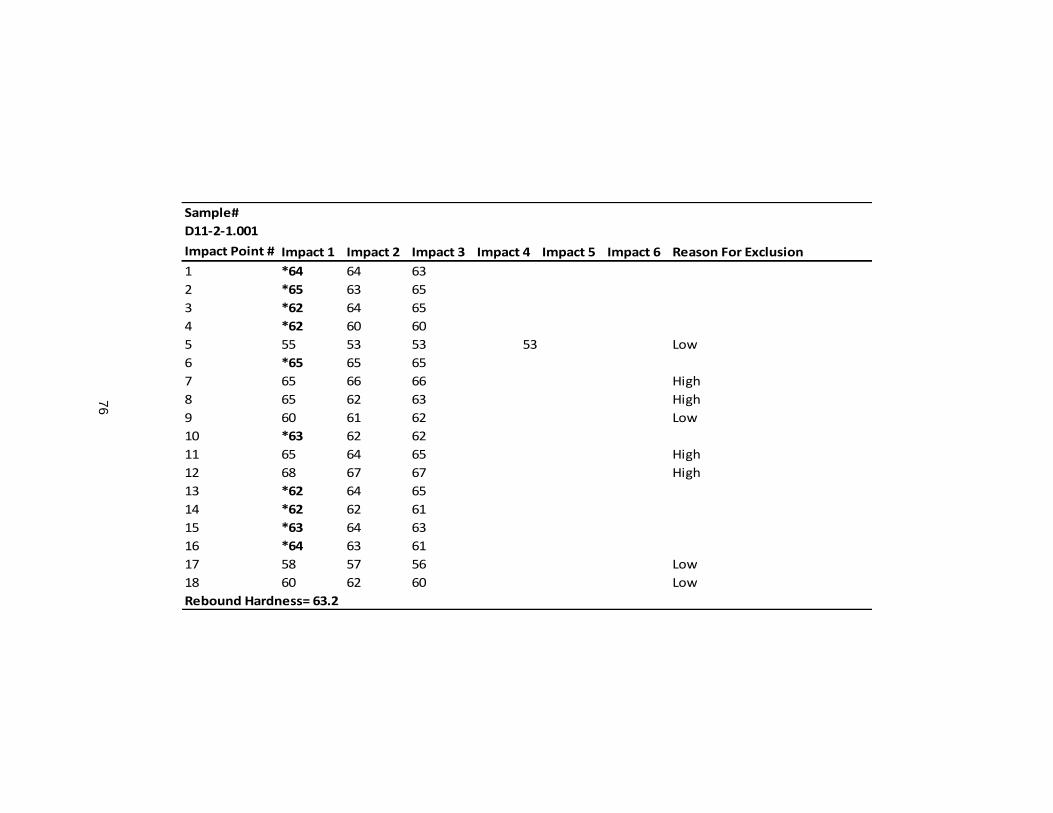
76
Sample#
D11-2-1.001
Impact Point # Impact 1 Impact 2 Impact 3 Impact 4 Impact 5 Impact 6 Reason For Exclusion
1 *64 64 63
2 *65 63 65
3 *62 64 65
4 *62 60 60
5 55 53 53 53 Low
6 *65 65 65
7 65 66 66 High
8 65 62 63 High
9 60 61 62 Low
10 *63 62 62
11 65 64 65 High
12 68 67 67 High
13 *62 64 65
14 *62 62 61
15 *63 64 63
16 *64 63 61
17 58 57 56 Low
18 60 62 60 Low
Rebound Hardness= 63.2
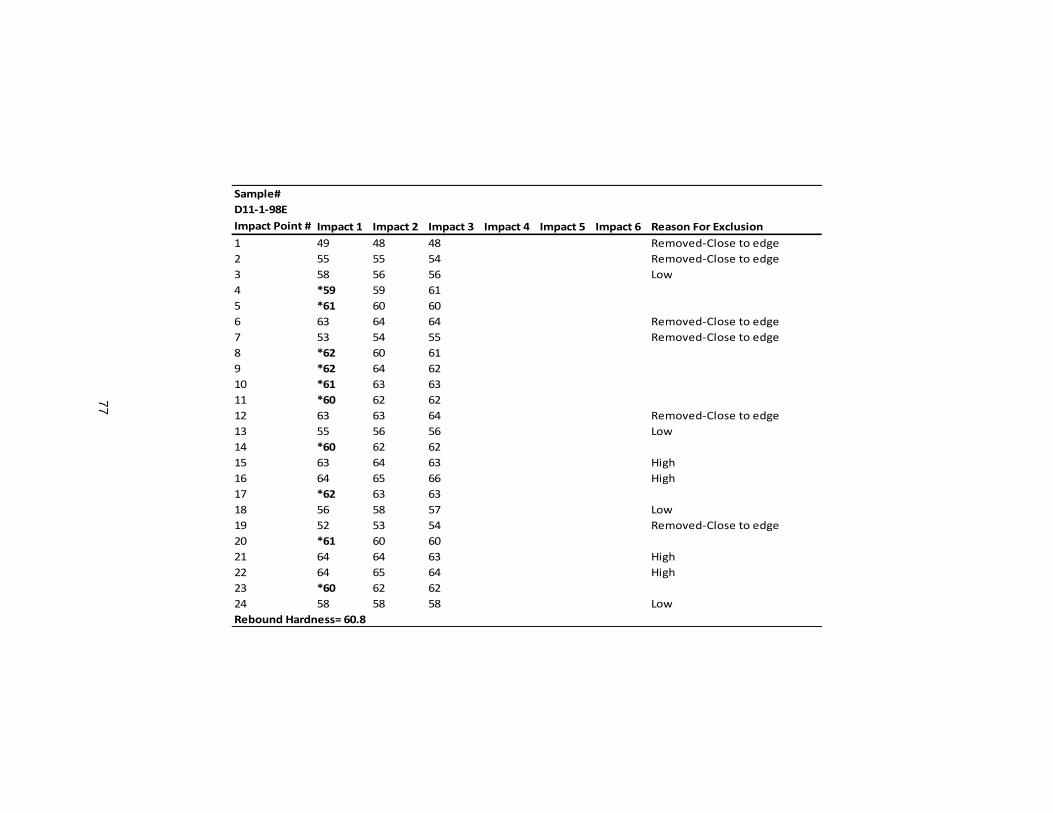
77
Sample#
D11-1-98E
Impact Point # Impact 1 Impact 2 Impact 3 Impact 4 Impact 5 Impact 6 Reason For Exclusion
1 49 48 48 Removed-Close to edge
2 55 55 54 Removed-Close to edge
3 58 56 56 Low
4 *59 59 61
5 *61 60 60
6 63 64 64 Removed-Close to edge
7 53 54 55 Removed-Close to edge
8 *62 60 61
9 *62 64 62
10 *61 63 63
11 *60 62 62
12 63 63 64 Removed-Close to edge
13 55 56 56 Low
14 *60 62 62
15 63 64 63 High
16 64 65 66 High
17 *62 63 63
18 56 58 57 Low
19 52 53 54 Removed-Close to edge
20 *61 60 60
21 64 64 63 High
22 64 65 64 High
23 *60 62 62
24 58 58 58 Low
Rebound Hardness= 60.8
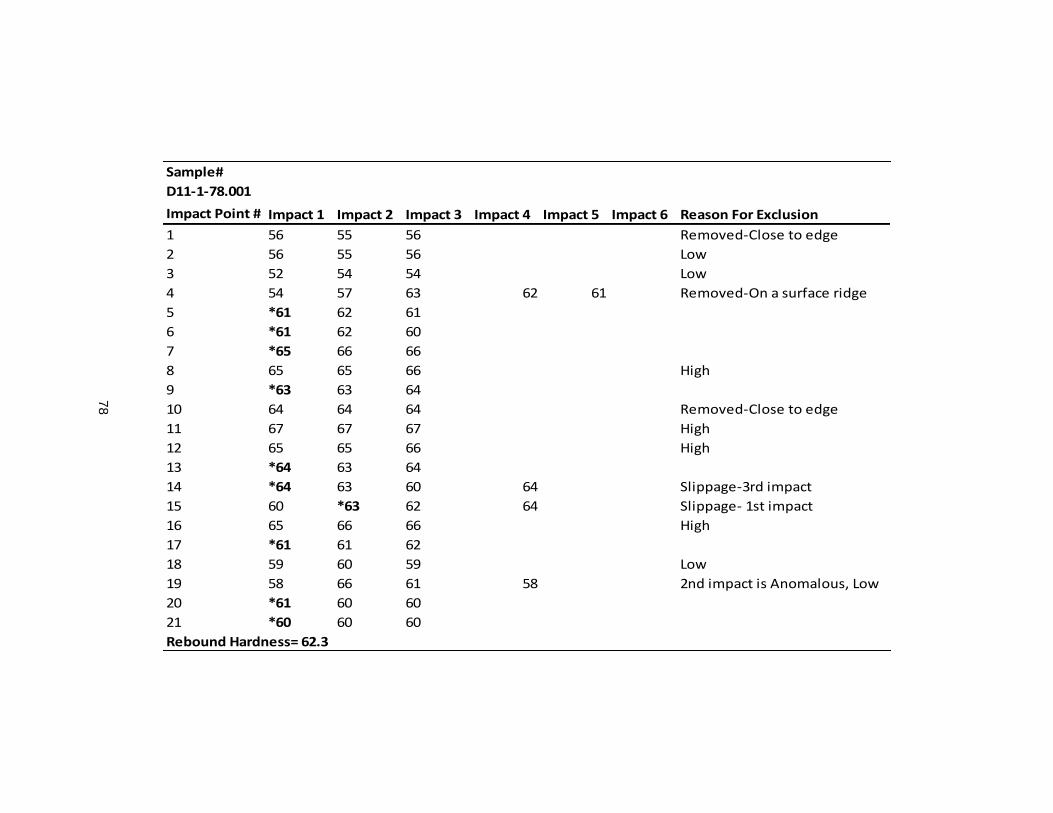
78
Sample#
D11-1-78.001
Impact Point # Impact 1 Impact 2 Impact 3 Impact 4 Impact 5 Impact 6 Reason For Exclusion
1 56 55 56 Removed-Close to edge
2 56 55 56 Low
3 52 54 54 Low
4 54 57 63 62 61 Removed-On a surface ridge
5 *61 62 61
6 *61 62 60
7 *65 66 66
8 65 65 66 High
9 *63 63 64
10 64 64 64 Removed-Close to edge
11 67 67 67 High
12 65 65 66 High
13 *64 63 64
14 *64 63 60 64 Slippage-3rd impact
15 60 *63 62 64 Slippage- 1st impact
16 65 66 66 High
17 *61 61 62
18 59 60 59 Low
19 58 66 61 58 2nd impact is Anomalous, Low
20 *61 60 60
21 *60 60 60
Rebound Hardness= 62.3
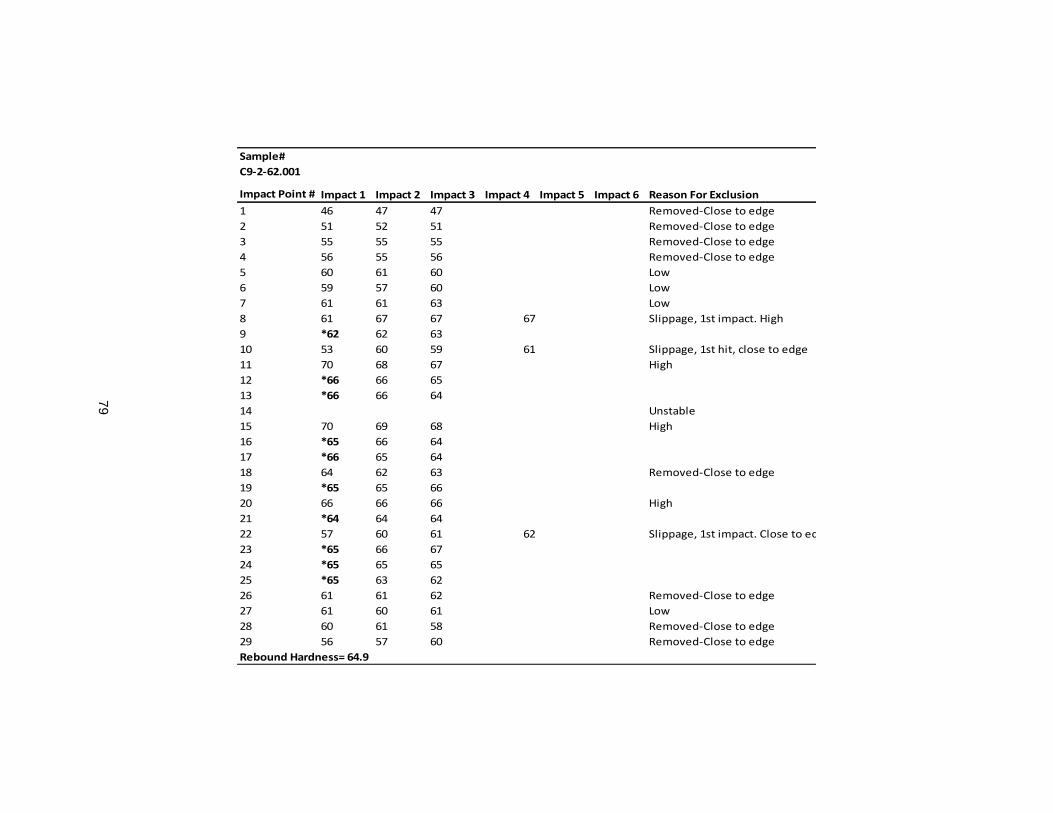
79
Sample#
C9-2-62.001
Impact Point # Impact 1 Impact 2 Impact 3 Impact 4 Impact 5 Impact 6 Reason For Exclusion
1 46 47 47 Removed-Close to edge
2 51 52 51 Removed-Close to edge
3 55 55 55 Removed-Close to edge
4 56 55 56 Removed-Close to edge
5 60 61 60 Low
6 59 57 60 Low
7 61 61 63 Low
8 61 67 67 67 Slippage, 1st impact. High
9 *62 62 63
10 53 60 59 61 Slippage, 1st hit, close to edge
11 70 68 67 High
12 *66 66 65
13 *66 66 64
14 Unstable
15 70 69 68 High
16 *65 66 64
17 *66 65 64
18 64 62 63 Removed-Close to edge
19 *65 65 66
20 66 66 66 High
21 *64 64 64
22 57 60 61 62 Slippage, 1st impact. Close to edge
23 *65 66 67
24 *65 65 65
25 *65 63 62
26 61 61 62 Removed-Close to edge
27 61 60 61 Low
28 60 61 58 Removed-Close to edge
29 56 57 60 Removed-Close to edge
Rebound Hardness= 64.9

80
Sample#
C9-3-95.001
Impact Point # Impact 1 Impact 2 Impact 3 Impact 4 Impact 5 Impact 6 Reason For Exclusion
1 unstable
2 48 52 51 52 Slippage-1st impact, Low
3 54 53 53 Low
4 48 52 51 52 Slippage-1st impact, Low
5 Unstable
6 *56 56 58
7 *57 55 57
8 *60 60 61
9 63 63 64 High
10 *61 58 59
11 *60 60 61
12 65 65 65 High
13 *61 62 61
14 65 63 63 High
15 *60 58 60
16 61 61 63 High
17 *59 60 59
18 52 52 52 Low
19 *58 58 60
20 *58 57 60
Rebound Hardness= 59

81
Appendix B
Individual Rebound Hardness Results for Untreated Silcrete
82
Appendix B shows the individual rebound analyses of each unheated silcrete sample. n
the following table, the accepted ten impact values for each sample are in bold with an asterisk.
The mean of these ten values is the Rebound Hardness value for the sample, and can be found
in bold at the bottom of each sample. The analyses followed the methods defined by Braun and
colleagues (2009), Goudie (2006), and Brown (2011). As described in chapter 3, each point of
impact was struck at least three times. If one or more of the results were flawed due to plunger
slip, geologic defects, surface defects, etc. more impacts were added to ensure accuracy.
Unless flawed, the initial impact at each impact point was used in the analysis. Eighteen impact
values were used for each testing surface. The highest four and the lowest four values were
removed to account for outliers (marked in comments as “high” and “low”). Due to the large size
of some of the sample surfaces and the impact points being placed in a grid 1.5cm apart, more
than eighteen impact points were regularly taken. To account for this, the values from impact
points closest to the edge were removed until eighteen remained (explained in greater detail in
chapter 3).

83
Sample#
E4-1-2.014Impact Point # Impact 1 Impact 2 Impact 3 Impact 4 Impact 5 Impact 6 Reason For Exclusion
1 *43 40 42
2 *45 41 43
3 *45 46 50
4 53 47 43 High
5 *44 47 43
6 *47 49 49
7 *44 44 46
8 *46 42 43
9 42 41 45 Low
10 *44 44 48
11 49 50 45 High
12 *46 46 48
13 39 41 39 Low
14 38 40 43 Low
15 40 40 42 Low
16 49 43 46 High
17 *47 48 47
18 49 45 49 High
Rebound Hardness= 45.1

84
Sample#
I14-3-5.001
Impact Point # Impact 1 Impact 2 Impact 3 Impact 4 Impact 5 Impact 6 Reason For Exclusion
1 51 56 56 Removed-Close to edge
2 50 54 53 Removed-Close to edge
3 50 54 53 Removed-Close to edge
4 55 55 55 Removed-Close to edge
5 54 57 58 Removed-Close to edge
6 *62 62 62
7 *60 62 59
8 *62 63 62
9 58 60 60 Removed-Close to edge
10 *61 62 62
11 *61 66 65
12 *62 60 63
13 52 56 60 Low
14 59 60 58 Removed-Close to edge
15 57 59 61 Low
16 64 62 64 High
17 68 68 68 High
18 65 68 68 High
19 65 65 65 High
20 *58 56 57
21 57 55 57 Removed-Close to edge
22 54 60 57 Low
23 *58 60 62
24 *63 62 61
25 *60 62 61
26 58 59 58 Low
Rebound Hardness= 60.7
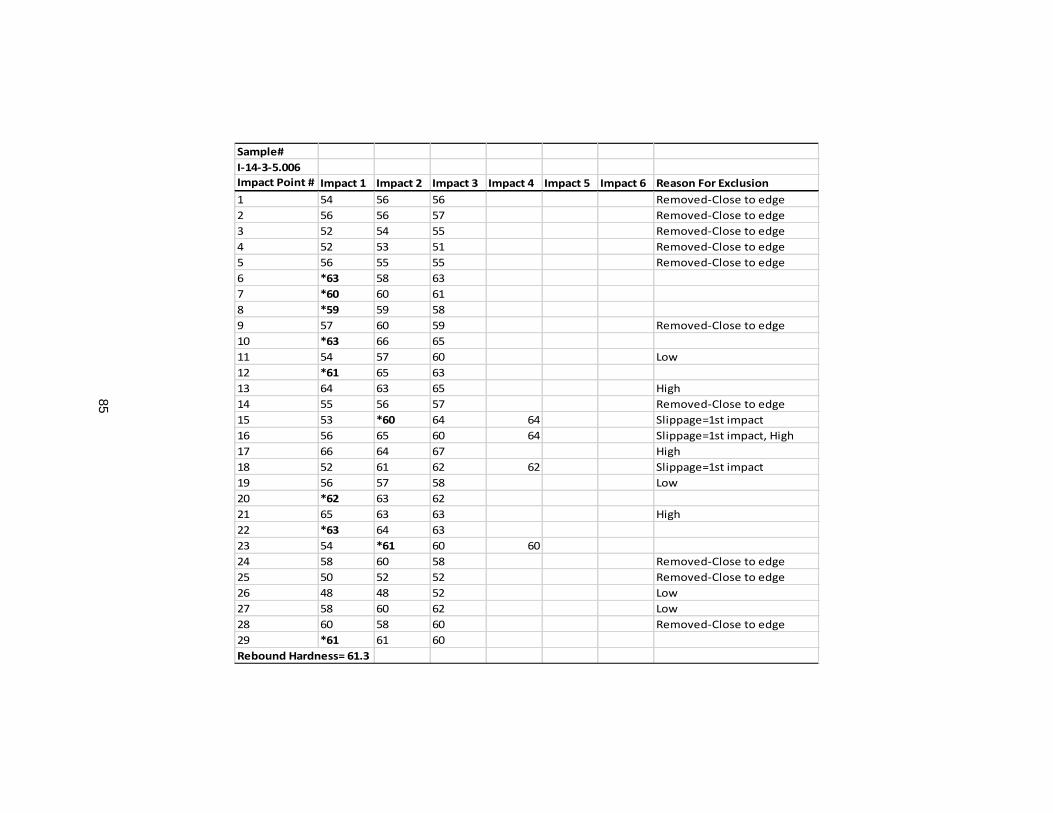
85
Sample#
I-14-3-5.006
Impact Point # Impact 1 Impact 2 Impact 3 Impact 4 Impact 5 Impact 6 Reason For Exclusion
1 54 56 56 Removed-Close to edge
2 56 56 57 Removed-Close to edge
3 52 54 55 Removed-Close to edge
4 52 53 51 Removed-Close to edge
5 56 55 55 Removed-Close to edge
6 *63 58 63
7 *60 60 61
8 *59 59 58
9 57 60 59 Removed-Close to edge
10 *63 66 65
11 54 57 60 Low
12 *61 65 63
13 64 63 65 High
14 55 56 57 Removed-Close to edge
15 53 *60 64 64 Slippage=1st impact
16 56 65 60 64 Slippage=1st impact, High
17 66 64 67 High
18 52 61 62 62 Slippage=1st impact
19 56 57 58 Low
20 *62 63 62
21 65 63 63 High
22 *63 64 63
23 54 *61 60 60
24 58 60 58 Removed-Close to edge
25 50 52 52 Removed-Close to edge
26 48 48 52 Low
27 58 60 62 Low
28 60 58 60 Removed-Close to edge
29 *61 61 60
Rebound Hardness= 61.3
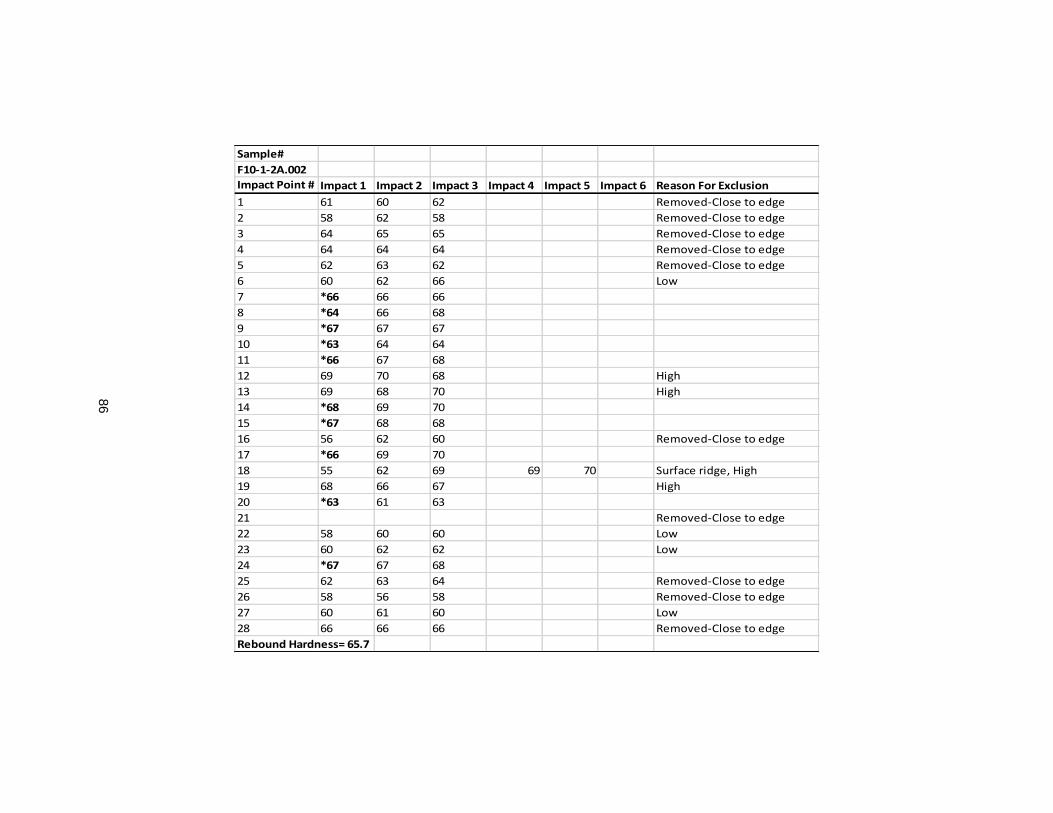
86
Sample#
F10-1-2A.002
Impact Point # Impact 1 Impact 2 Impact 3 Impact 4 Impact 5 Impact 6 Reason For Exclusion
1 61 60 62 Removed-Close to edge
2 58 62 58 Removed-Close to edge
3 64 65 65 Removed-Close to edge
4 64 64 64 Removed-Close to edge
5 62 63 62 Removed-Close to edge
6 60 62 66 Low
7 *66 66 66
8 *64 66 68
9 *67 67 67
10 *63 64 64
11 *66 67 68
12 69 70 68 High
13 69 68 70 High
14 *68 69 70
15 *67 68 68
16 56 62 60 Removed-Close to edge
17 *66 69 70
18 55 62 69 69 70 Surface ridge, High
19 68 66 67 High
20 *63 61 63
21 Removed-Close to edge
22 58 60 60 Low
23 60 62 62 Low
24 *67 67 68
25 62 63 64 Removed-Close to edge
26 58 56 58 Removed-Close to edge
27 60 61 60 Low
28 66 66 66 Removed-Close to edge
Rebound Hardness= 65.7
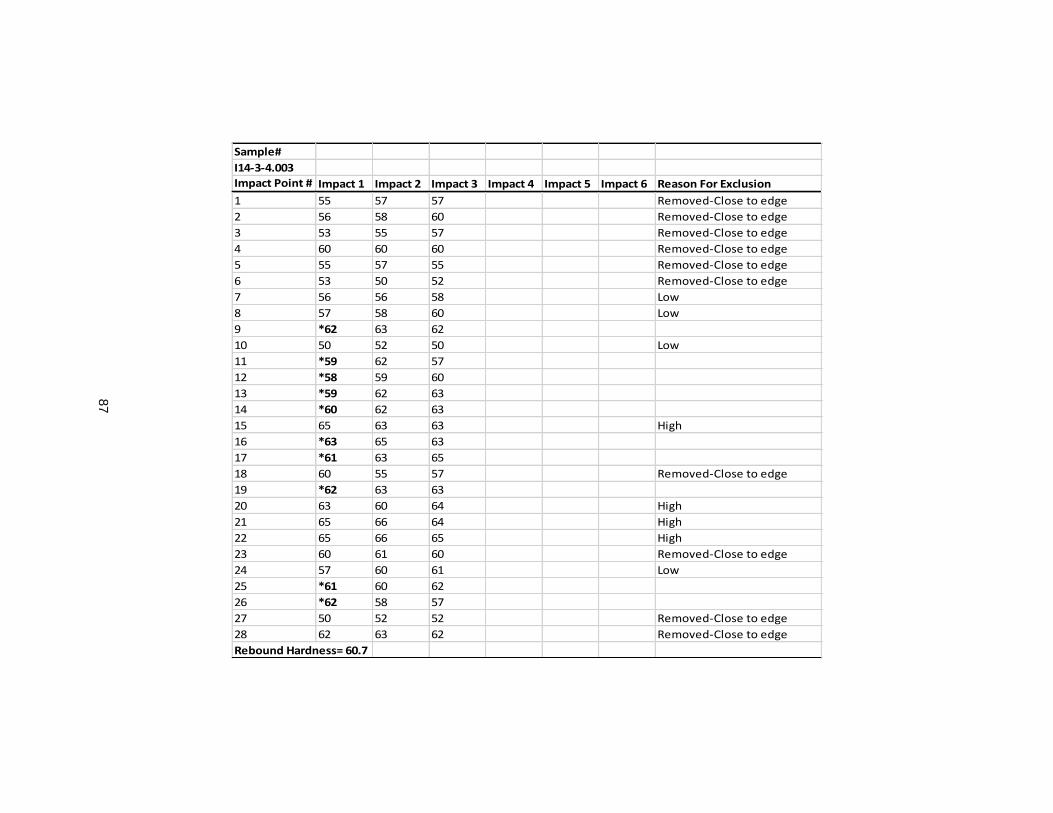
87
Sample#
I14-3-4.003
Impact Point # Impact 1 Impact 2 Impact 3 Impact 4 Impact 5 Impact 6 Reason For Exclusion
1 55 57 57 Removed-Close to edge
2 56 58 60 Removed-Close to edge
3 53 55 57 Removed-Close to edge
4 60 60 60 Removed-Close to edge
5 55 57 55 Removed-Close to edge
6 53 50 52 Removed-Close to edge
7 56 56 58 Low
8 57 58 60 Low
9 *62 63 62
10 50 52 50 Low
11 *59 62 57
12 *58 59 60
13 *59 62 63
14 *60 62 63
15 65 63 63 High
16 *63 65 63
17 *61 63 65
18 60 55 57 Removed-Close to edge
19 *62 63 63
20 63 60 64 High
21 65 66 64 High
22 65 66 65 High
23 60 61 60 Removed-Close to edge
24 57 60 61 Low
25 *61 60 62
26 *62 58 57
27 50 52 52 Removed-Close to edge
28 62 63 62 Removed-Close to edge
Rebound Hardness= 60.7

88
Sample#
E3-1-6n
Impact Point # Impact 1 Impact 2 Impact 3 Impact 4 Impact 5 Impact 6 Reason For Exclusion
1 44 42 38 Flaking on edge
2 43 44 42 Removed-Close to edge
3 44 44 42 Removed-Close to edge
4 50 44 44 Flaking on edge
5 52 54 51 Low
6 40 42 43 Low
7 *53 52 53
8 *55 57 55
9 *58 56 56
10 *56 50 51
11 *59 61 61
12 64 64 63 High
13 63 61 62 High
14 *60 61 61
15 44 45 46 Low
16 50 52 54 Low
17 62 62 60 High
18 65 64 65 High
19 *57 64 63
20 *57 58 57
21 *60 59 57
22 *58 57 57
23 48 46 42 Removed-Close to edge
Rebound Hardness= 57.3
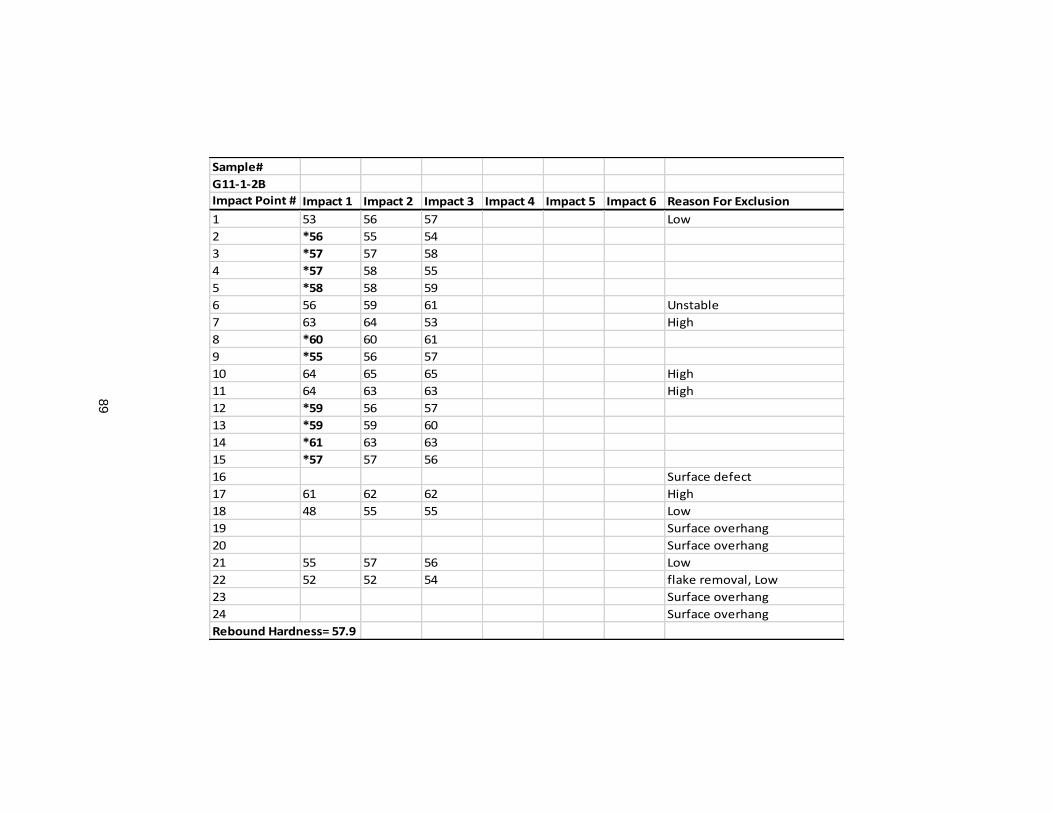
89
Sample#
G11-1-2B
Impact Point # Impact 1 Impact 2 Impact 3 Impact 4 Impact 5 Impact 6 Reason For Exclusion
1 53 56 57 Low
2 *56 55 54
3 *57 57 58
4 *57 58 55
5 *58 58 59
6 56 59 61 Unstable
7 63 64 53 High
8 *60 60 61
9 *55 56 57
10 64 65 65 High
11 64 63 63 High
12 *59 56 57
13 *59 59 60
14 *61 63 63
15 *57 57 56
16 Surface defect
17 61 62 62 High
18 48 55 55 Low
19 Surface overhang
20 Surface overhang
21 55 57 56 Low
22 52 52 54 flake removal, Low
23 Surface overhang
24 Surface overhang
Rebound Hardness= 57.9
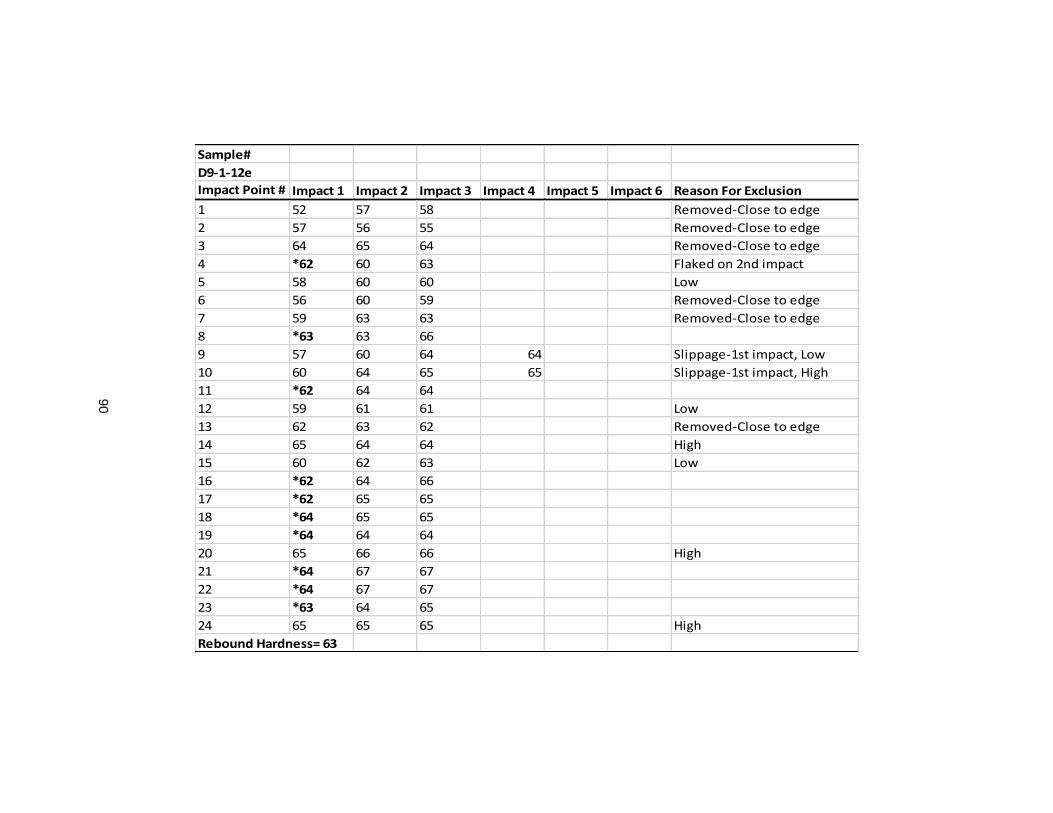
90
Sample#
D9-1-12e
Impact Point # Impact 1 Impact 2 Impact 3 Impact 4 Impact 5 Impact 6 Reason For Exclusion
1 52 57 58 Removed-Close to edge
2 57 56 55 Removed-Close to edge
3 64 65 64 Removed-Close to edge
4 *62 60 63 Flaked on 2nd impact
5 58 60 60 Low
6 56 60 59 Removed-Close to edge
7 59 63 63 Removed-Close to edge
8 *63 63 66
9 57 60 64 64 Slippage-1st impact, Low
10 60 64 65 65 Slippage-1st impact, High
11 *62 64 64
12 59 61 61 Low
13 62 63 62 Removed-Close to edge
14 65 64 64 High
15 60 62 63 Low
16 *62 64 66
17 *62 65 65
18 *64 65 65
19 *64 64 64
20 65 66 66 High
21 *64 67 67
22 *64 67 67
23 *63 64 65
24 65 65 65 High
Rebound Hardness= 63

91
Sample#
I14-3-3.003
Impact Point # Impact 1 Impact 2 Impact 3 Impact 4 Impact 5 Impact 6 Reason For Exclusion
1 46 52 43 Removed-Close to edge
2 57 57 57 Removed-Close to edge
3 60 61 60 Removed-Close to edge
4 62 64 64 Removed-Close to edge
5 53 56 58 Surface ridge
6 52 54 53 Removed-Close to edge
7 52 53 53 Removed-Close to edge
8 *61 61 60
9 *66 65 65
10 *65 60 60
11 *60 58 59
12 *60 60 58
13 On edge
14 50 53 54 Removed-Close to edge
15 60 61 61 Low
16 66 66 65 High
17 *65 66 66
18 68 70 69 High
19 60 61 62 Low
20 60 60 60 Removed-Close to edge
21 55 58 58 Removed-Close to edge
22 56 60 66 66 66 Surface ridge, 1st and 2nd impact, high
23 *62 64 63
24 57 63 63 Surface Defect
25 *65 64 64
26 61 62 60 Removed-Close to edge
27 53 54 55 Removed-Close to edge
28 57 57 60 Low
29 *63 67 66
30 66 66 66 High
31 *62 65 65
32 60 62 62 Low
33 59 58 59 Removed-Close to edge
34 52 50 53 Removed-Close to edge
35 58 58 57 Removed-Close to edge
36 61 61 62 Removed-Close to edge
37 58 63 61 Removed-Close to edge
38 58 56 58 Removed-Close to edge
39 56 56 58 Removed-Close to edge
Rebound Hardness= 62.9

92
Sample#
I14-2-16i
Impact Point # Impact 1 Impact 2 Impact 3 Impact 4 Impact 5 Impact 6 Reason For Exclusion
1 54 54 54 Flaked on 2nd impact
2 58 60 60 Removed-Close to edge
3 61 63 63 Removed-Close to edge
4 61 60 60 Removed-Close to edge
5 60 61 58 Removed-Close to edge
6 55 60 58 Removed-Close to edge
7 58 59 60 Removed-Close to edge
8 65 64 64 Low
9 *66 66 65
10 *68 68 68
11 *68 67 66
12 62 62 63 Low
13 57 60 61 Removed-Close to edge
14 55 60 61 61 Slippage-1st hit, close to edge
15 64 66 67 Low
16 *67 68 69
17 71 72 70 High
18 69 68 70 High
19 *67 66 67
20 65 64 64 Removed-Close to edge
21 54 55 60 Removed-Close to edge
22 *66 67 65
23 70 70 71 High
24 *68 72 72
25 *68 68 68
26 64 64 64 Removed-Close to edge
27 60 56 60 Removed-Close to edge
28 *66 66 68
29 *68 70 69
30 68 68 70 High
31 64 64 64 Removed-Close to edge
32 58 60 60 Removed-Close to edge
33 64 64 62 Low
34 64 64 64 Removed-Close to edge
Rebound Hardness= 67.2

93
Sample#
I14-2-6a
Impact Point # Impact 1 Impact 2 Impact 3 Impact 4 Impact 5 Impact 6 Reason For Exclusion
1 62 63 60 Removed-Close to edge
2 64 65 63 Removed-Close to edge
3 63 62 62 Removed-Close to edge
4 62 62 61 Removed-Close to edge
5 66 66 63 Removed-Close to edge
6 63 66 63 Low
7 *66 67 67
8 62 63 62 Removed-Close to edge
9 *68 67 69
10 *67 66 66
11 *68 70 71
12 66 67 66 Removed-Close to edge
13 *68 66 70
14 *68 68 70
15 66 66 67 Removed-Close to edge
16 69 69 67 High
17 70 71 73 High
18 70 71 70 High
19 *68 66 67
20 65 68 66 Low
21 *66 69 66
22 68 68 69 High
23 60 65 66 Low
24 Removed-Close to edge
25 60 64 64 Low
26 *67 67 67
27 *66 66 66
28 63 62 62 Removed-Close to edge
29 56 56 56 Surface overhang
30 62 60 60 Removed-Close to edge
Rebound Hardness= 67.2

94
Sample#
I14-3-3.004
Impact Point # Impact 1 Impact 2 Impact 3 Impact 4 Impact 5 Impact 6 Reason For Exclusion
1 Unstable
2 50 56 57 Removed-Close to edge
3 54 54 53 Removed-Close to edge
4 54 62 62 62 Removed-Close to edge
5 52 58 54 60 Removed-Close to edge
6 59 59 60 Removed-Close to edge
7 50 56 52 50 Removed-Close to edge
8 57 57 55 Removed-Close to edge
9 50 50 50 Removed-Close to edge
10 Unstable
11 57 61 61 Low
12 *62 64 64
13 60 64 64 Low
14 50 67 64 58 64 Surface Defect
15 57 64 62 Surface Defect
16 *61 62 60
17 55 55 55 Removed-Close to edge
18 60 60 61 Removed-Close to edge
19 *65 65 62
20 *62 60 66
21 67 67 68 High
22 68 66 64 High
23 *66 66 66
24 59 60 61 Low
25 57 60 60 Removed-Close to edge
26 62 58 60 Removed-Close to edge
27 66 68 68 High
28 *63 67 68
29 68 68 69 High
30 *61 64 65
31 *60 62 61
32 61 60 58 Removed-Close to edge
33 62 64 64 Removed-Close to edge
34 *60 62 62
35 60 62 64 Low
36 *64 64 64
37 Unstable
38 Unstable
Rebound Hardness= 62.4

95
Sample#
I14-2-6b
Impact Point # Impact 1 Impact 2 Impact 3 Impact 4 Impact 5 Impact 6 Reason For Exclusion
1 57 57 56 Removed-Close to edge
2 62 61 62 Removed-Close to edge
3 60 58 61 Removed-Close to edge
4 66 65 66 Removed-Close to edge
5 62 62 63 Removed-Close to edge
6 61 61 60 Removed-Close to edge
7 57 60 60 Removed-Close to edge
8 55 57 55 Removed-Close to edge
9 61 61 61 Low
10 60 65 63 Low
11 69 70 69 High
12 *67 68 66
13 *67 66 65
14 63 63 63 Removed-Close to edge
15 60 61 61 Removed-Close to edge
16 *65 66 66
17 70 69 68 High
18 70 70 70 High
19 65 66 65 Removed-Close to edge
20 61 61 61 Removed-Close to edge
21 *66 67 68
22 *66 64 65
23 70 71 72 High
24 *68 70 70
25 65 66 65 Removed-Close to edge
26 61 62 61 Removed-Close to edge
27 *64 68 66
28 *67 68 68
29 *68 68 68
30 64 64 64 Removed-Close to edge
31 59 59 60 Low
32 62 64 61 Low
33 *62 62 62
Rebound Hardness= 66

96
Sample#
E4-3-2a.003
Impact Point # Impact 1 Impact 2 Impact 3 Impact 4 Impact 5 Impact 6 Reason For Exclusion
1 *63 63 62
2 *65 65 61
3 60 63 63 Low
4 *68 68 69
5 *68 70 68
6 70 70 69 High
7 *67 70 71
8 70 70 70 High
9 *69 70 69
10 70 69 69 High
11 70 69 69 High
12 *65 67 67
13 62 64 64 Low
14 *65 66 66
15 60 60 60 Flaking on impacts, Low
16 *63 63 63
17 *64 64 64
18 60 61 59 Removed-Close to edge
19 58 60 60 Low
20 59 60 61 Removed-Close to edge
Rebound Hardness= 65.7

97
Sample#
E9-5-3c.001
Impact Point # Impact 1 Impact 2 Impact 3 Impact 4 Impact 5 Impact 6 Reason For Exclusion
1 54 56 56 Low
2 55 58 55 Low
3 *58 58 60
4 50 54 64 55 57 Geologic Defect, Low
5 *57 59 58
6 *60 62 62
7 67 67 68 High
8 67 68 67 High
9 *62 61 61
10 67 67 67 High
11 65 67 65 High
12 *62 63 62
13 *57 59 59
14 *63 64 64
15 *63 65 65
16 *63 64 64
17 *62 62 63
18 56 57 58 Low
Rebound Hardness= 60.7

98
Sample#
E4-1-2.007
Impact Point # Impact 1 Impact 2 Impact 3 Impact 4 Impact 5 Impact 6 Reason For Exclusion
1 50 52 51 Low
2 58 58 58 Low
3 58 58 58 Low
4 54 55 55 Removed-Close to edge
5 *58 58 58
6 *64 65 64
7 *63 63 63
8 *61 61 60
9 55 58 58 Removed-Close to edge
10 67 67 67 High
11 67 66 66 High
12 61 61 62 Removed-Close to edge
13 61 61 67 67 67 On ridge- 1st and 2nd impact, High
14 67 67 68 High
15 *65 66 64
16 *62 62 62
17 *62 64 63
18 *64 64 64
19 *61 62 61
20 60 59 59 Removed-Close to edge
21 55 *60 60 59
22 55 51 50 55 54 Slippage on 2nd and 3rd impact. Low
Rebound Hardness= 62
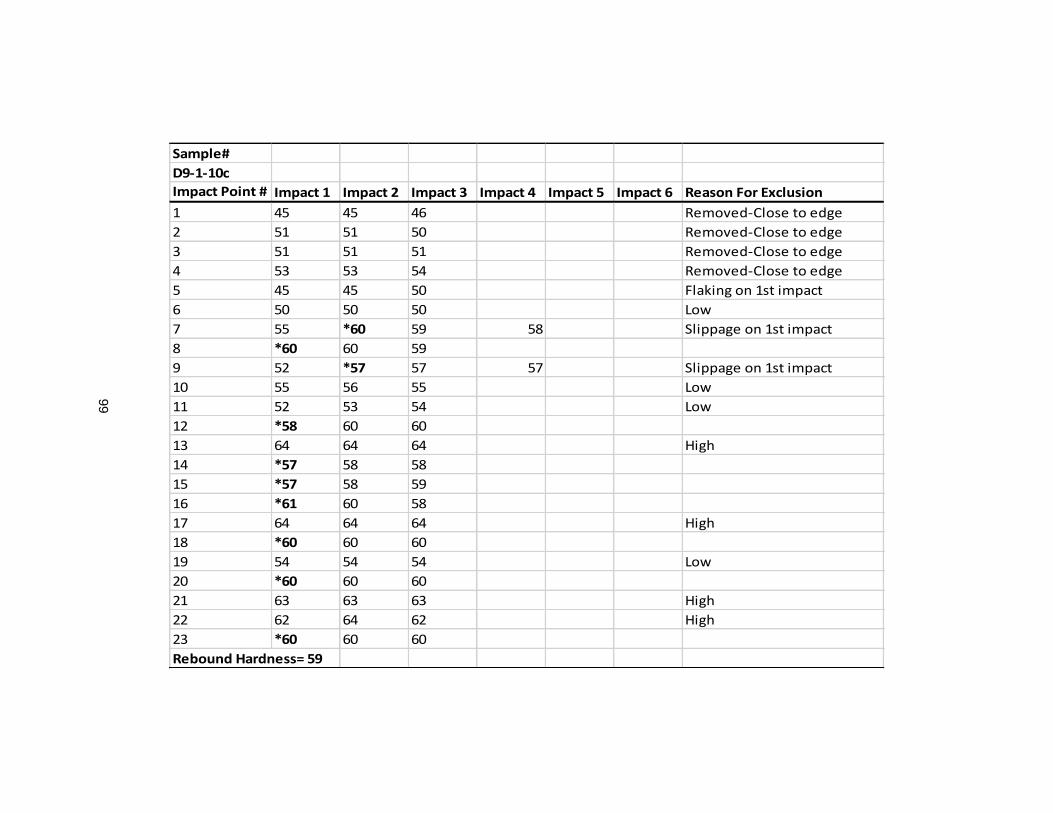
99
Sample#
D9-1-10c
Impact Point # Impact 1 Impact 2 Impact 3 Impact 4 Impact 5 Impact 6 Reason For Exclusion
1 45 45 46 Removed-Close to edge
2 51 51 50 Removed-Close to edge
3 51 51 51 Removed-Close to edge
4 53 53 54 Removed-Close to edge
5 45 45 50 Flaking on 1st impact
6 50 50 50 Low
7 55 *60 59 58 Slippage on 1st impact
8 *60 60 59
9 52 *57 57 57 Slippage on 1st impact
10 55 56 55 Low
11 52 53 54 Low
12 *58 60 60
13 64 64 64 High
14 *57 58 58
15 *57 58 59
16 *61 60 58
17 64 64 64 High
18 *60 60 60
19 54 54 54 Low
20 *60 60 60
21 63 63 63 High
22 62 64 62 High
23 *60 60 60
Rebound Hardness= 59
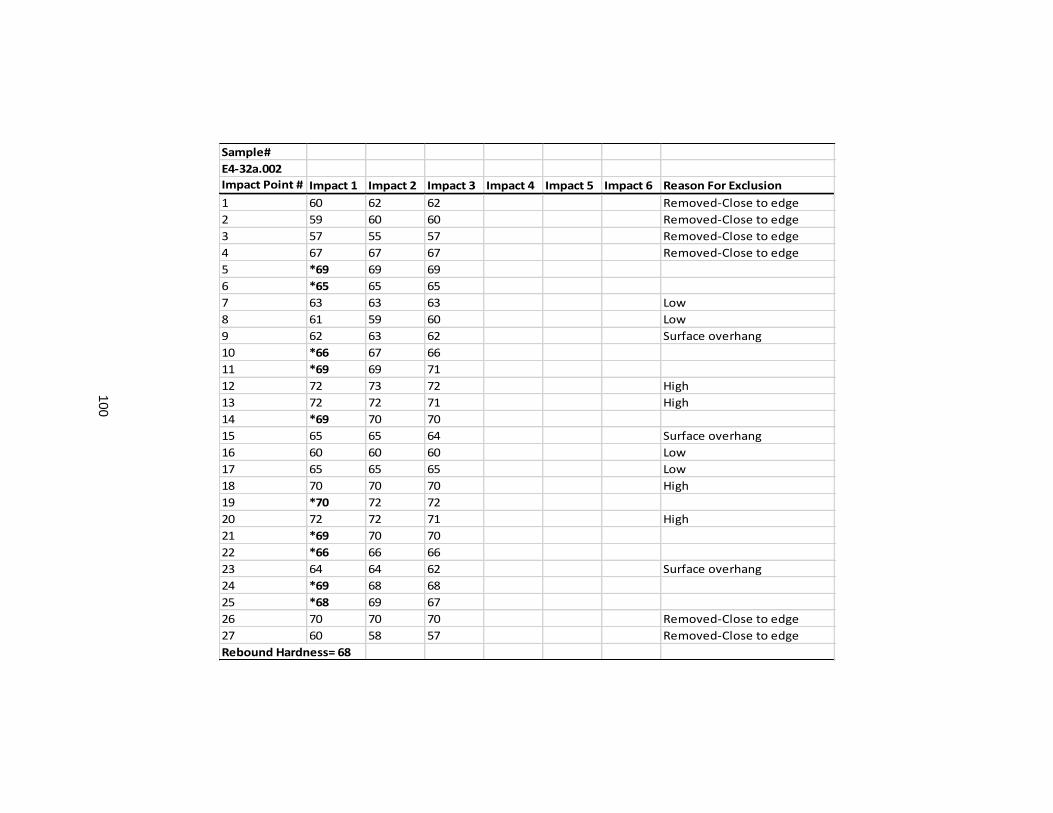
100
Sample#
E4-32a.002
Impact Point # Impact 1 Impact 2 Impact 3 Impact 4 Impact 5 Impact 6 Reason For Exclusion
1 60 62 62 Removed-Close to edge
2 59 60 60 Removed-Close to edge
3 57 55 57 Removed-Close to edge
4 67 67 67 Removed-Close to edge
5 *69 69 69
6 *65 65 65
7 63 63 63 Low
8 61 59 60 Low
9 62 63 62 Surface overhang
10 *66 67 66
11 *69 69 71
12 72 73 72 High
13 72 72 71 High
14 *69 70 70
15 65 65 64 Surface overhang
16 60 60 60 Low
17 65 65 65 Low
18 70 70 70 High
19 *70 72 72
20 72 72 71 High
21 *69 70 70
22 *66 66 66
23 64 64 62 Surface overhang
24 *69 68 68
25 *68 69 67
26 70 70 70 Removed-Close to edge
27 60 58 57 Removed-Close to edge
Rebound Hardness= 68
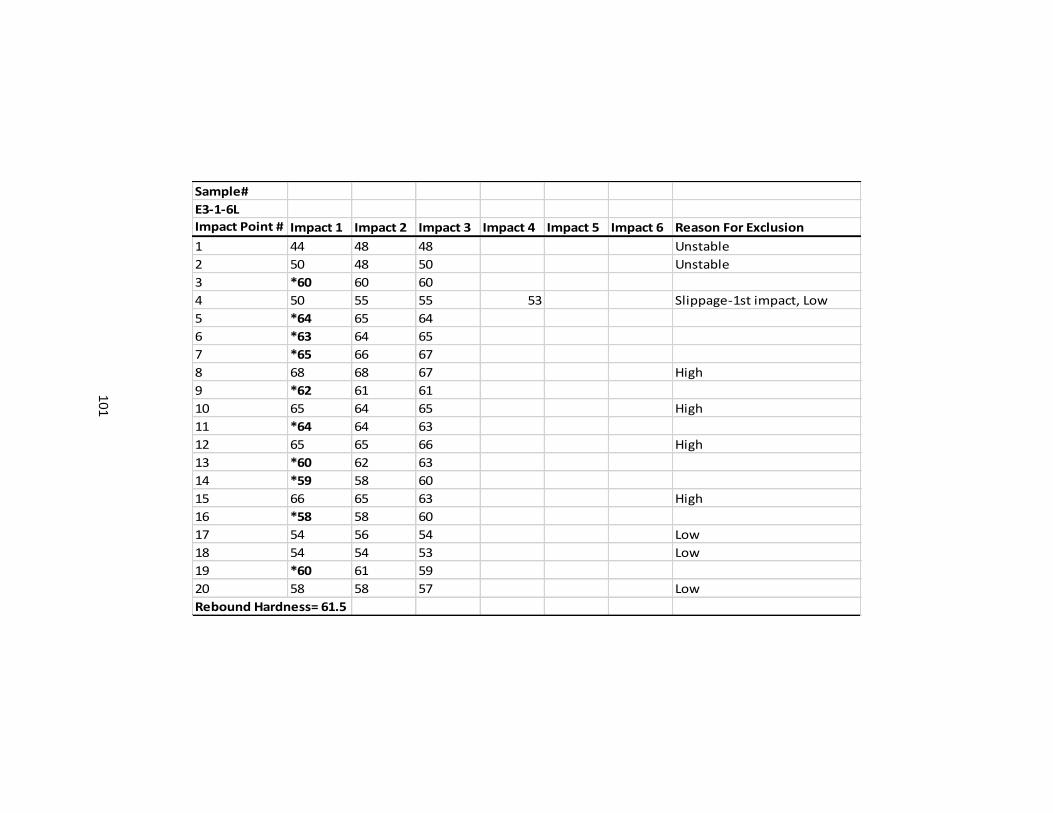
101
Sample#
E3-1-6L
Impact Point # Impact 1 Impact 2 Impact 3 Impact 4 Impact 5 Impact 6 Reason For Exclusion
1 44 48 48 Unstable
2 50 48 50 Unstable
3 *60 60 60
4 50 55 55 53 Slippage-1st impact, Low
5 *64 65 64
6 *63 64 65
7 *65 66 67
8 68 68 67 High
9 *62 61 61
10 65 64 65 High
11 *64 64 63
12 65 65 66 High
13 *60 62 63
14 *59 58 60
15 66 65 63 High
16 *58 58 60
17 54 56 54 Low
18 54 54 53 Low
19 *60 61 59
20 58 58 57 Low
Rebound Hardness= 61.5
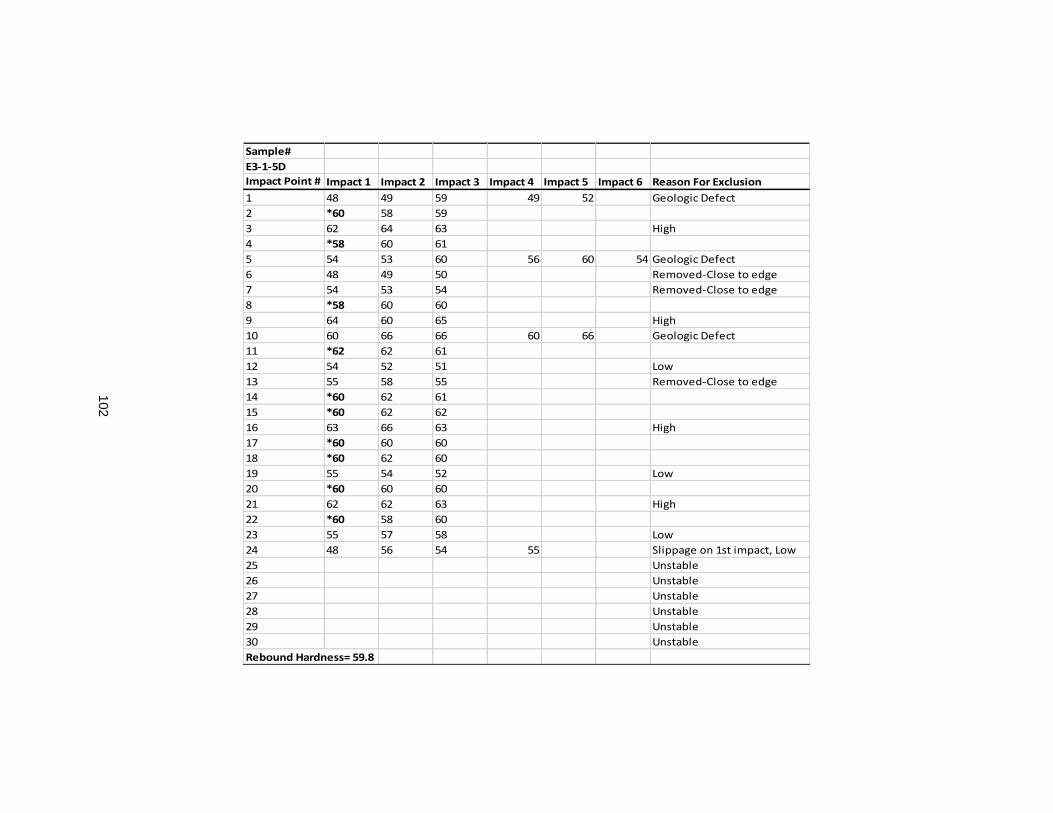
102
Sample#
E3-1-5D
Impact Point # Impact 1 Impact 2 Impact 3 Impact 4 Impact 5 Impact 6 Reason For Exclusion
1 48 49 59 49 52 Geologic Defect
2 *60 58 59
3 62 64 63 High
4 *58 60 61
5 54 53 60 56 60 54 Geologic Defect
6 48 49 50 Removed-Close to edge
7 54 53 54 Removed-Close to edge
8 *58 60 60
9 64 60 65 High
10 60 66 66 60 66 Geologic Defect
11 *62 62 61
12 54 52 51 Low
13 55 58 55 Removed-Close to edge
14 *60 62 61
15 *60 62 62
16 63 66 63 High
17 *60 60 60
18 *60 62 60
19 55 54 52 Low
20 *60 60 60
21 62 62 63 High
22 *60 58 60
23 55 57 58 Low
24 48 56 54 55 Slippage on 1st impact, Low
25 Unstable
26 Unstable
27 Unstable
28 Unstable
29 Unstable
30 Unstable
Rebound Hardness= 59.8
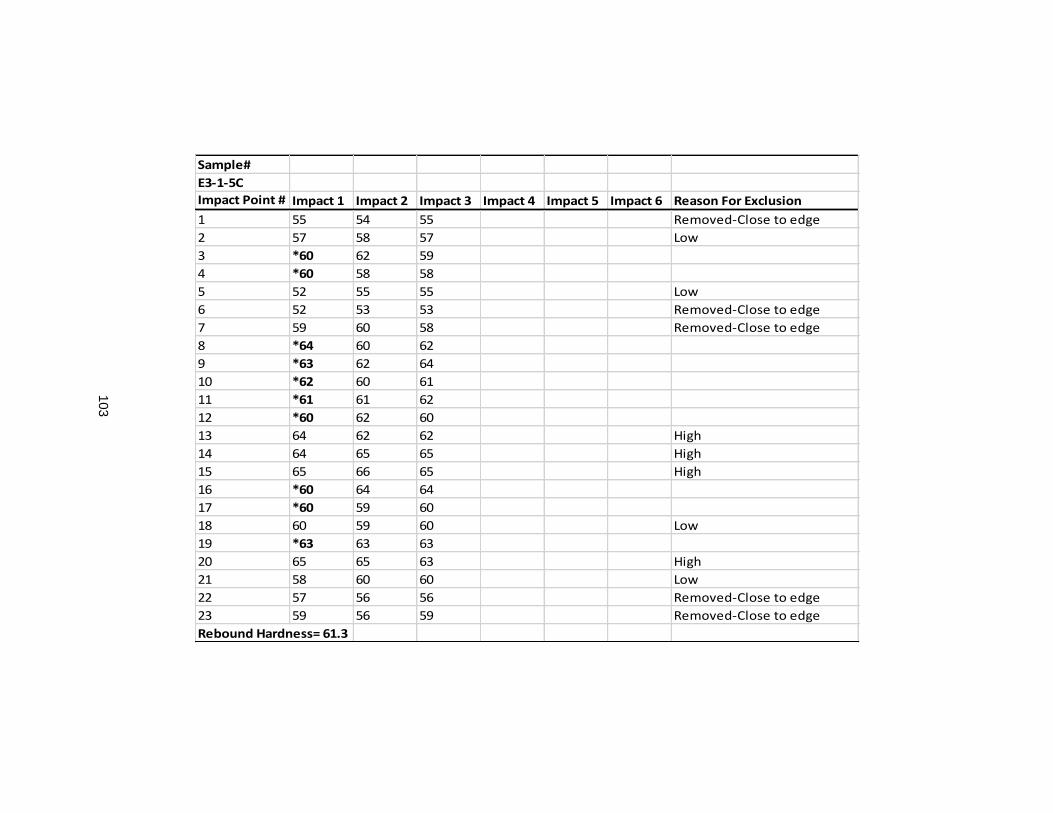
103
Sample#
E3-1-5C
Impact Point # Impact 1 Impact 2 Impact 3 Impact 4 Impact 5 Impact 6 Reason For Exclusion
1 55 54 55 Removed-Close to edge
2 57 58 57 Low
3 *60 62 59
4 *60 58 58
5 52 55 55 Low
6 52 53 53 Removed-Close to edge
7 59 60 58 Removed-Close to edge
8 *64 60 62
9 *63 62 64
10 *62 60 61
11 *61 61 62
12 *60 62 60
13 64 62 62 High
14 64 65 65 High
15 65 66 65 High
16 *60 64 64
17 *60 59 60
18 60 59 60 Low
19 *63 63 63
20 65 65 63 High
21 58 60 60 Low
22 57 56 56 Removed-Close to edge
23 59 56 59 Removed-Close to edge
Rebound Hardness= 61.3
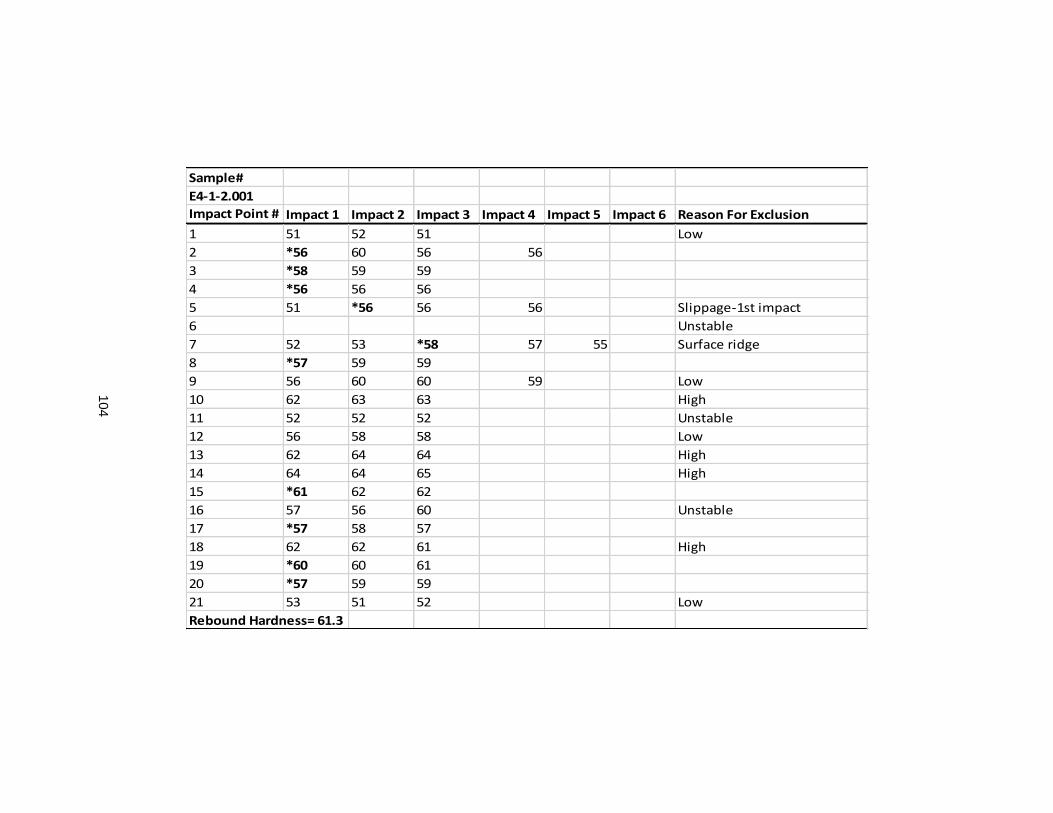
104
Sample#
E4-1-2.001
Impact Point # Impact 1 Impact 2 Impact 3 Impact 4 Impact 5 Impact 6 Reason For Exclusion
1 51 52 51 Low
2 *56 60 56 56
3 *58 59 59
4 *56 56 56
5 51 *56 56 56 Slippage-1st impact
6 Unstable
7 52 53 *58 57 55 Surface ridge
8 *57 59 59
9 56 60 60 59 Low
10 62 63 63 High
11 52 52 52 Unstable
12 56 58 58 Low
13 62 64 64 High
14 64 64 65 High
15 *61 62 62
16 57 56 60 Unstable
17 *57 58 57
18 62 62 61 High
19 *60 60 61
20 *57 59 59
21 53 51 52 Low
Rebound Hardness= 61.3

105
Appendix C
Individual Rebound Hardness Results for Heat-Treated Silcrete
106
Appendix C shows the individual rebound analyses of each heat-treated silcrete sample. In the
following table, the accepted ten impact values for each sample are in bold with an asterisk. The
mean of these ten values is the Rebound Hardness value for the sample, and can be found in
bold at the bottom of each sample. The analyses followed the methods defined by Braun and
colleagues (2009), Goudie (2006), and Brown (2011). As described in chapter 3, each point of
impact was struck at least three times. If one or more of the results were flawed due to plunger
slip, geologic defects, surface defects, etc. more impacts were added to ensure accuracy.
Unless flawed, the initial impact at each impact point was used in the analysis. Eighteen impact
values were used for each testing surface. The highest four and the lowest four values were
removed to account for outliers (marked in comments as “high” and “low”). Due to the large size
of some of the sample surfaces and the impact points being placed in a grid 1.5cm apart, more
than eighteen impact points were regularly taken. To account for this, the values from impact
points closest to the edge were removed until eighteen remained (explained in greater detail in
chapter 3).

107
Sample#
E3-1-5C
Impact Point # Impact 1 Impact 2 Impact 3 Impact 4 Impact 5 Impact 6 Reason For Exclusion
1 57 53 56 Removed-Close to edge
2 57 58 59 Removed-Close to edge
3 *58 59 59
4 *61 61 60
5 *58 57 55
6 50 49 50 Removed-Close to edge
7 *57 60 60
8 62 63 63 High
9 62 58 60 High
10 62 62 58 High
11 53 54 54 55 Geologic Defect
12 54 52 52 Geologic Defect
13 *61 59 62
14 *60 58 58
15 63 62 58 59 High
16 *58 56 58
17 57 60 56 57 Low
18 54 *58 58 58 Slippage- 1st impact
19 *61 58 57 56 58
20 *58 58 56
21 53 53 54 Low
22 52 54 54 Surface defect
23 51 50 53 Low
24 56 58 57 Low
Rebound Hardness= 59
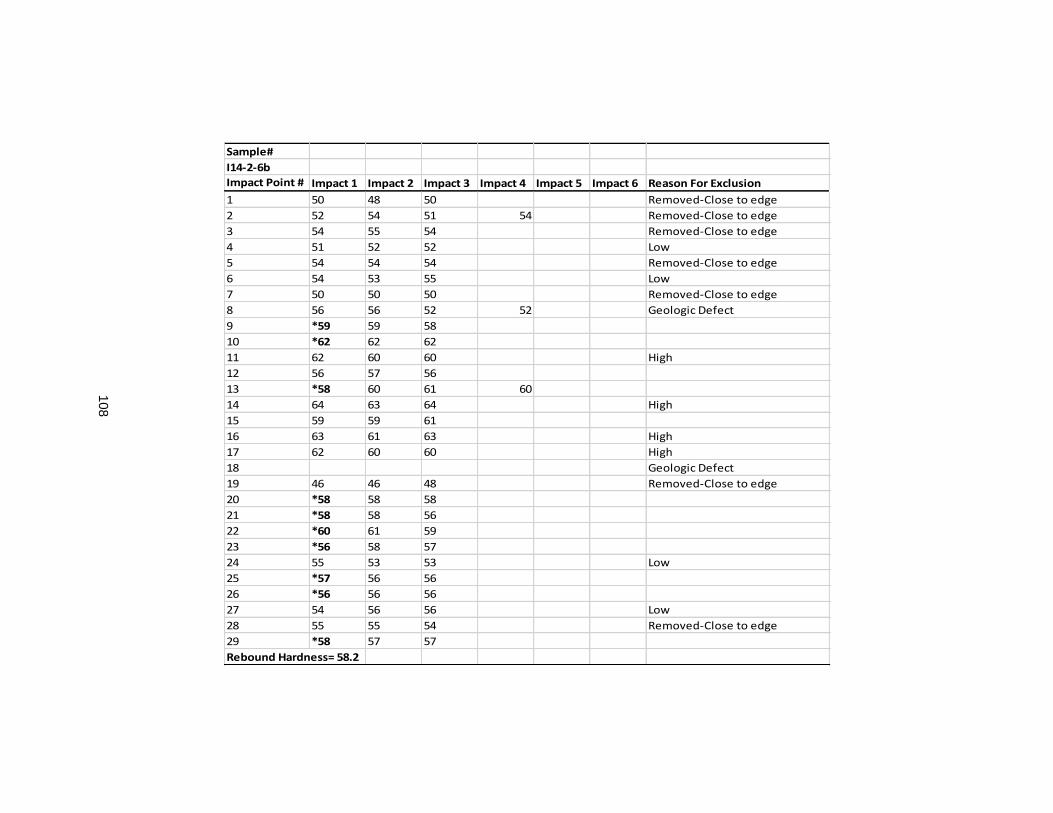
108
Sample#
I14-2-6b
Impact Point # Impact 1 Impact 2 Impact 3 Impact 4 Impact 5 Impact 6 Reason For Exclusion
1 50 48 50 Removed-Close to edge
2 52 54 51 54 Removed-Close to edge
3 54 55 54 Removed-Close to edge
4 51 52 52 Low
5 54 54 54 Removed-Close to edge
6 54 53 55 Low
7 50 50 50 Removed-Close to edge
8 56 56 52 52 Geologic Defect
9 *59 59 58
10 *62 62 62
11 62 60 60 High
12 56 57 56
13 *58 60 61 60
14 64 63 64 High
15 59 59 61
16 63 61 63 High
17 62 60 60 High
18 Geologic Defect
19 46 46 48 Removed-Close to edge
20 *58 58 58
21 *58 58 56
22 *60 61 59
23 *56 58 57
24 55 53 53 Low
25 *57 56 56
26 *56 56 56
27 54 56 56 Low
28 55 55 54 Removed-Close to edge
29 *58 57 57
Rebound Hardness= 58.2

109
Sample#
D9-1-12e
Impact Point # Impact 1 Impact 2 Impact 3 Impact 4 Impact 5 Impact 6 Reason For Exclusion
1 57 55 57
2 56 47 Failure with flaking
3 56 *59 59 60
4 *58 59 58
5 *58 57 56
6 53 53 54 Low
7 *59 61 61
8 *60 59 61
9 *60 60 63 60
10 *58 59 56
11 *57 60 57
12 63 61 62 High
13 62 64 65 62 High
14 56 56 56 Low
15 60 62 59 High
16 63 64 64 High
17 62 62 60 Removed-Close to edge
18 57 58 57 Low
19 *58 60 60
20 *58 56 57
21 54 56 55 Low
Rebound Hardness= 58.5
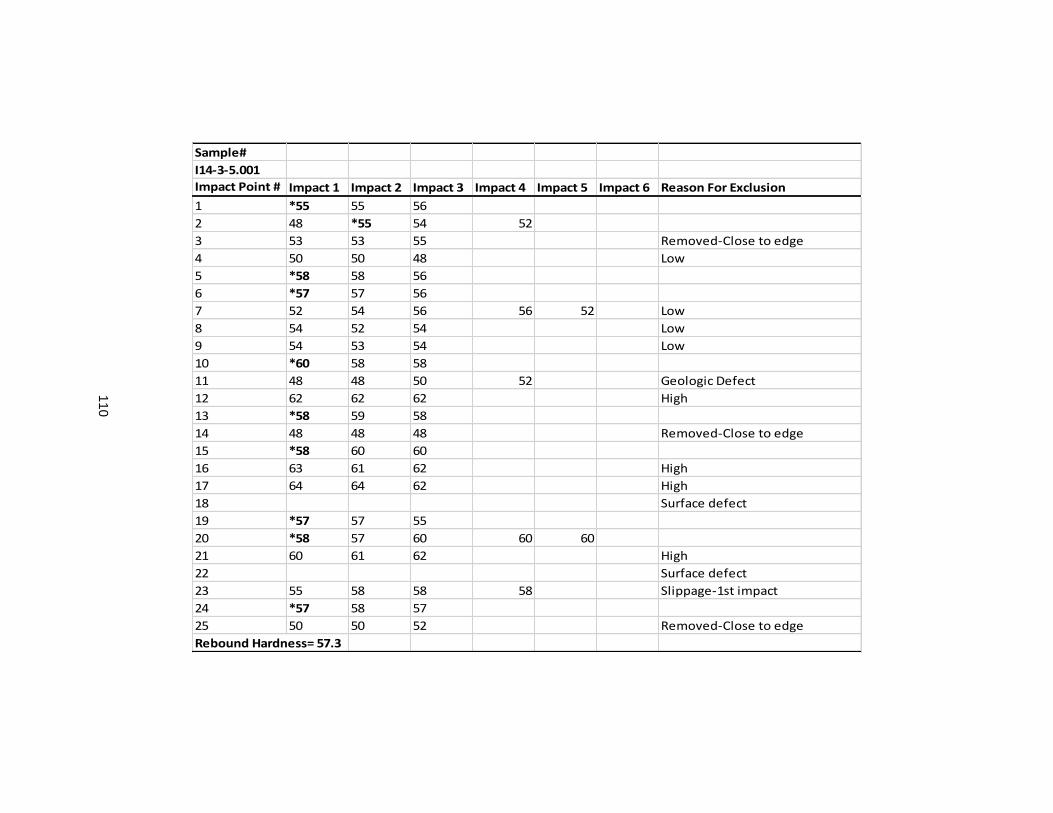
110
Sample#
I14-3-5.001
Impact Point # Impact 1 Impact 2 Impact 3 Impact 4 Impact 5 Impact 6 Reason For Exclusion
1 *55 55 56
2 48 *55 54 52
3 53 53 55 Removed-Close to edge
4 50 50 48 Low
5 *58 58 56
6 *57 57 56
7 52 54 56 56 52 Low
8 54 52 54 Low
9 54 53 54 Low
10 *60 58 58
11 48 48 50 52 Geologic Defect
12 62 62 62 High
13 *58 59 58
14 48 48 48 Removed-Close to edge
15 *58 60 60
16 63 61 62 High
17 64 64 62 High
18 Surface defect
19 *57 57 55
20 *58 57 60 60 60
21 60 61 62 High
22 Surface defect
23 55 58 58 58 Slippage-1st impact
24 *57 58 57
25 50 50 52 Removed-Close to edge
Rebound Hardness= 57.3
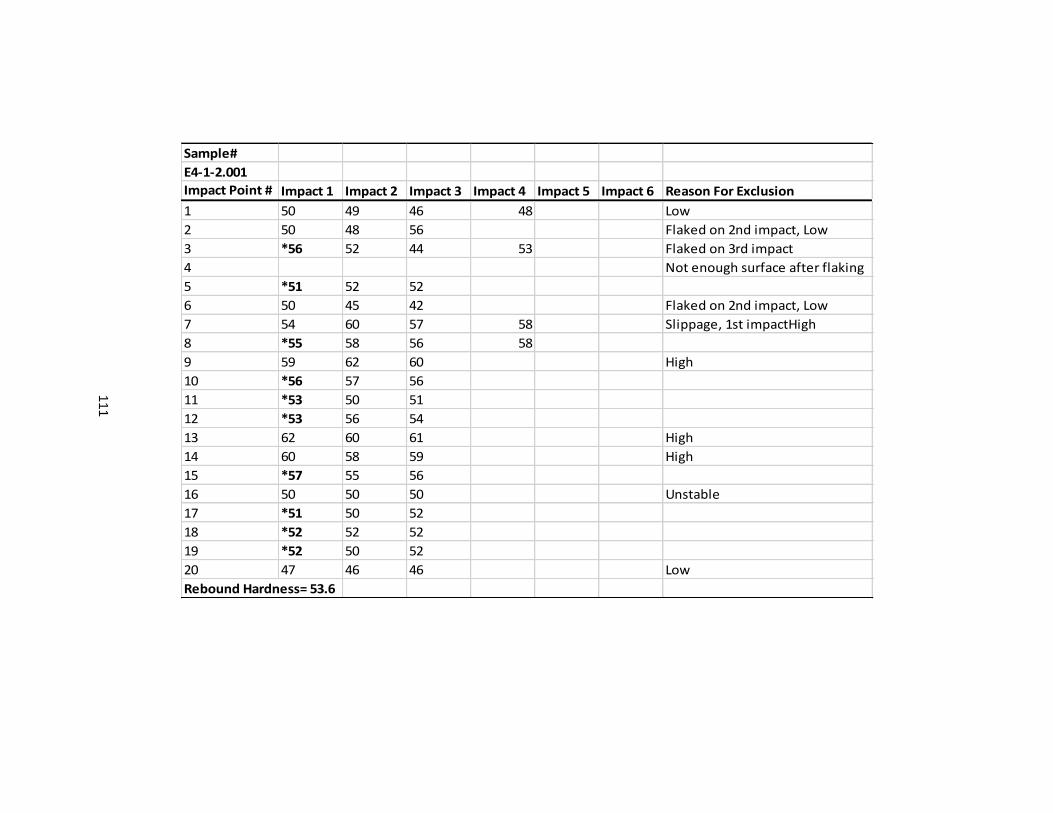
111
Sample#
E4-1-2.001
Impact Point # Impact 1 Impact 2 Impact 3 Impact 4 Impact 5 Impact 6 Reason For Exclusion
1 50 49 46 48 Low
2 50 48 56 Flaked on 2nd impact, Low
3 *56 52 44 53 Flaked on 3rd impact
4 Not enough surface after flaking
5 *51 52 52
6 50 45 42 Flaked on 2nd impact, Low
7 54 60 57 58 Slippage, 1st impactHigh
8 *55 58 56 58
9 59 62 60 High
10 *56 57 56
11 *53 50 51
12 *53 56 54
13 62 60 61 High
14 60 58 59 High
15 *57 55 56
16 50 50 50 Unstable
17 *51 50 52
18 *52 52 52
19 *52 50 52
20 47 46 46 Low
Rebound Hardness= 53.6

112
Sample#
E4-1-2.007
Impact Point # Impact 1 Impact 2 Impact 3 Impact 4 Impact 5 Impact 6 Reason For Exclusion
1 50 51 51 Low
2 54 54 55 Removed-Close to edge
3 55 55 56 Removed-Close to edge
4 49 49 50 Removed-Close to edge
5 52 52 52 Low
6 62 60 60 High
7 *60 59 58
8 *57 58 58
9 51 50 52 Removed-Close to edge
10 Surface defect
11 *60 58 60
12 *60 63 62 62
13 60 60 58 Removed-Close to edge
14 53 53 53 Low
15 61 58 61 60 High
16 64 65 63 High
17 *60 62 62
18 61 59 58 High
19 Unstable
20 *58 60 58
21 *58 59 60
22 *59 57 60
23 *57 58 57
24 *55 55 56
25 Flaked-too much surface removal
26 55 55 52 Low
Rebound Hardness= 58.4

113
Sample#
E3-1-6L
Impact Point # Impact 1 Impact 2 Impact 3 Impact 4 Impact 5 Impact 6 Reason For Exclusion
1 Surface uneven
2 38 40 44 42 45 Low
3 38 38 38 Cortex
4 55 56 54 Low
5 *58 58 58
6 49 48 51 Low
7 *60 62 62
8 *63 64 63
9 65 63 62 63 High
10 66 65 68 High
11 *63 62 64
12 66 65 66 High
13 64 65 64 High
14 *62 62 60
15 *64 66 66
16 *63 62 62
17 *63 64 66 64 66
18 *59 59 57
19 *60 57 59
20 Flaking-Affected results
21 55 56 55 Low
Rebound Hardness= 61.5
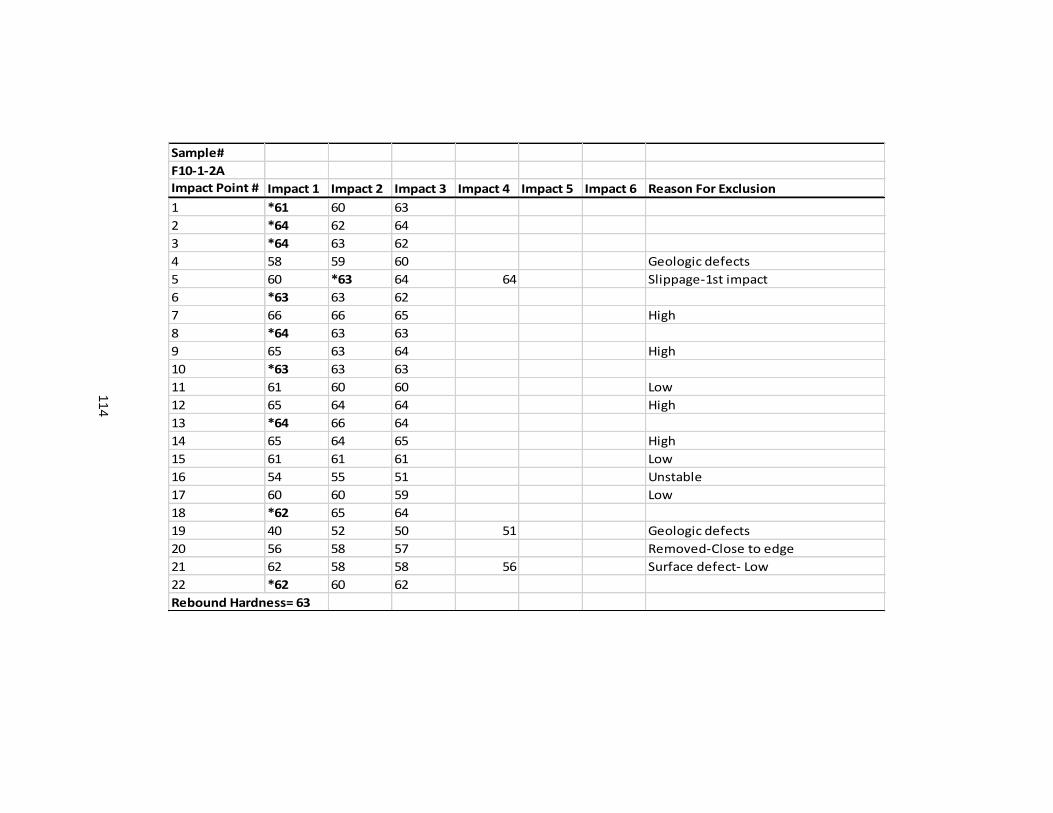
114
Sample#
F10-1-2A
Impact Point # Impact 1 Impact 2 Impact 3 Impact 4 Impact 5 Impact 6 Reason For Exclusion
1 *61 60 63
2 *64 62 64
3 *64 63 62
4 58 59 60 Geologic defects
5 60 *63 64 64 Slippage-1st impact
6 *63 63 62
7 66 66 65 High
8 *64 63 63
9 65 63 64 High
10 *63 63 63
11 61 60 60 Low
12 65 64 64 High
13 *64 66 64
14 65 64 65 High
15 61 61 61 Low
16 54 55 51 Unstable
17 60 60 59 Low
18 *62 65 64
19 40 52 50 51 Geologic defects
20 56 58 57 Removed-Close to edge
21 62 58 58 56 Surface defect- Low
22 *62 60 62
Rebound Hardness= 63
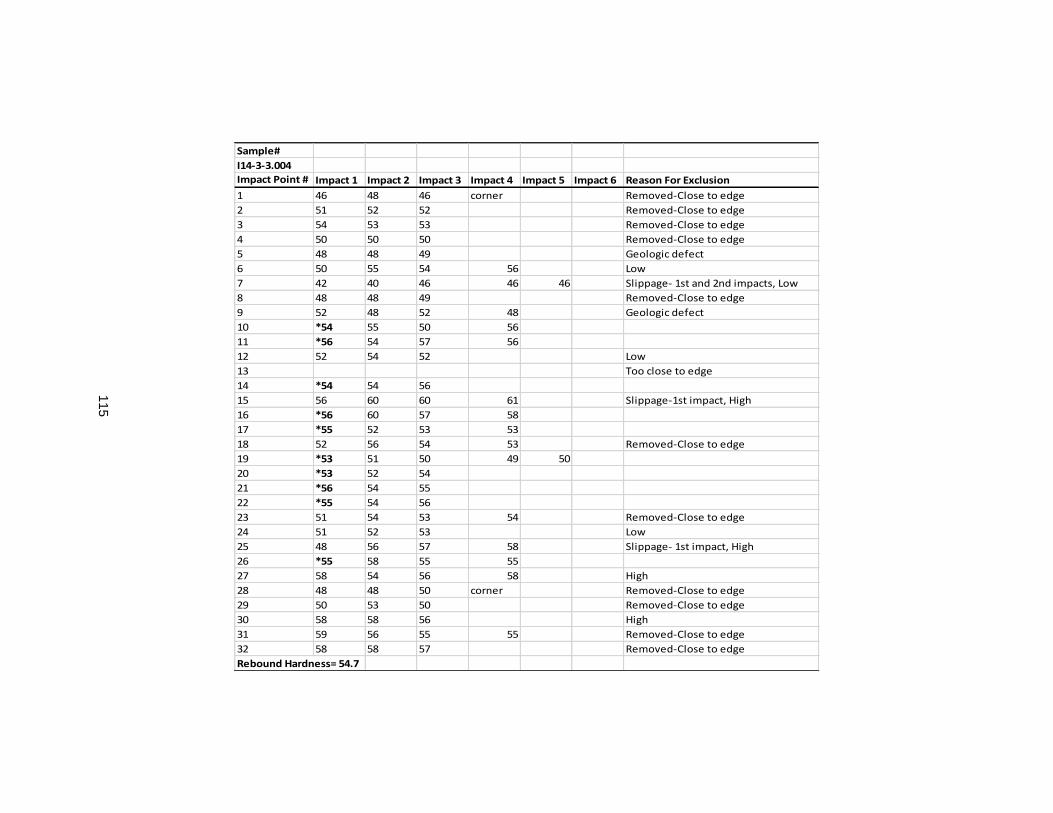
115
Sample#
I14-3-3.004
Impact Point # Impact 1 Impact 2 Impact 3 Impact 4 Impact 5 Impact 6 Reason For Exclusion
1 46 48 46 corner Removed-Close to edge
2 51 52 52 Removed-Close to edge
3 54 53 53 Removed-Close to edge
4 50 50 50 Removed-Close to edge
5 48 48 49 Geologic defect
6 50 55 54 56 Low
7 42 40 46 46 46 Slippage- 1st and 2nd impacts, Low
8 48 48 49 Removed-Close to edge
9 52 48 52 48 Geologic defect
10 *54 55 50 56
11 *56 54 57 56
12 52 54 52 Low
13 Too close to edge
14 *54 54 56
15 56 60 60 61 Slippage-1st impact, High
16 *56 60 57 58
17 *55 52 53 53
18 52 56 54 53 Removed-Close to edge
19 *53 51 50 49 50
20 *53 52 54
21 *56 54 55
22 *55 54 56
23 51 54 53 54 Removed-Close to edge
24 51 52 53 Low
25 48 56 57 58 Slippage- 1st impact, High
26 *55 58 55 55
27 58 54 56 58 High
28 48 48 50 corner Removed-Close to edge
29 50 53 50 Removed-Close to edge
30 58 58 56 High
31 59 56 55 55 Removed-Close to edge
32 58 58 57 Removed-Close to edge
Rebound Hardness= 54.7
116
References
Aggistalis, G., A. Alivizatos, D. Stamoulis, and G. Stournaras. 1980. “Correlating uniaxial
compressive strength with schmidt hardness, point load index, Young’s modulus,
and mineralogy of gabbros and basalts (Northern Greece).” Bulletin of the
International Association of Engineering Geology - Bulletin de l’Association
Internationale de Géologie de l’Ingénieur 22 1 (December 1): 3–11.
Akerman, K. 1979. “Heat and Lithic Technology in the Kimberleys, W. A.” Archaelogy and
Physical Anthropology in Oceania Sydney 14 2: 144–151.
Ambrose, S.H., 1998. Late Pleistocene human population bottlenecks, volcanic
winter, and differentiation of modern humans. Journal of Human Evolution 34, 623-651.
———.2006. “Howiesons Poort lithic raw material procurement patterns and the
evolution of modern human behavior: A response to.” Journal of Human
Evolution 50 3 (March): 365–369.
Andrefsky, W. 1994. “Raw-Material Availability and the Organization of Technology.”
American Antiquity 59 1 (January 1): 21–34.
ASTM, 2001. Standard test method for determination of rock hardness by rebound
hammer method. ASTM Standards. 04.09 (D 5873-00).
Avery, G., K. Cruz-Uribe, P. Goldberg, F.E. Grine, R.G. Klein, M.J. Lenardi, C.W.
Marean, et al. 1997. “The 1992–1993 Excavations at the Die Kelders Middle and
Later Stone Age Cave Site, South Africa.” Journal of Field Archaeology 24 3
(January 1): 263–291.
Aydin, A. 2009. “ISRM Suggested method for determination of the Schmidt hammer
rebound hardness: Revised version.” International Journal of Rock Mechanics
and Mining Sciences 46 3 (April): 627–634.
117
Aydin, A., and A. Basu. 2005. “The Schmidt hammer in rock material characterization.”
Engineering Geology 81 1 (September): 1–14.
Bamforth, D. B. 1986. Technological efficiency and tool curation. American Antiquity, 38-
50.
Bamforth, D.B., and P. Bleed. 1997. “Technology, Flaked Stone Technology, and Risk.”
Archeological Papers of the American Anthropological Association 7 1 (January
1): 109–139.
Bar-Matthews, M., C.W. Marean, Z. Jacobs, P. Karkanas, E.C. Fisher, A.I.R. Herries, K.
Brown, et al. 2010. “A high resolution and continuous isotopic speleothem record
of paleoclimate and paleoenvironment from 90 to 53 ka from Pinnacle Point on
the south coast of South Africa.” Quaternary Science Reviews 29 17-18 (August):
2131–2145.
Basell, L.S., 2008. Middle Stone Age (MSA) site distributions in eastern Africa and their
relationship to Quaternary environmental change, refugia and the evolution of
Homo sapiens. Quaternary Science Reviews 27.27 (2008): 2484-2498.
Basu, A., and A. Aydin, 2004. “A method for normalization of Schmidt hammer rebound
values.” International journal of rock mechanics and mining sciences 41 7: 1211–
1214.
Binford, L.R. 1979. “Organization and formation processes: Looking at curated
technologies.” Journal of Anthropological Research 35 3 (October 1): 255–273.
———.1980. Willow smoke and dogs tails: hunter-gatherer settlement systems and
archaeological site formation. American Antiquity 45: 4–20.
———.1982. The archaeology of place. Journal of Anthropological Archaeology 1: 5–31.
Booth, P.W.K., and R.W. Shone. 2002. “A review of thrust faulting in the Eastern Cape
Fold Belt, South Africa, and the implications for current lithostratigraphic
118
interpretation of the Cape Supergroup.” Journal of African Earth Sciences 34 3–
4. 18th Colloquium of African Geology (April): 179–190.
Booth, P.W.K., G. Brunsdon, and R.W. Shone. 2004. “A Duplex Model for the Eastern
Cape Fold Belt? Evidence from the Palaeozoic Witteberg and Bokkeveld Groups
(Cape Supergroup), Near Steytlerville, South Africa.” Gondwana Research 7 1
(January): 211–222.
Brantingham, P.J. 2003. “A neutral model of stone raw material procurement.” American
Antiquity 68 3 (July 1): 487–509.
Braun, D.R., T. Plummer, J.V. Ferraro, P. Ditchfield, and L.C. Bishop. 2009. “Raw
material quality and Oldowan hominin toolstone preferences: evidence from
Kanjera South, Kenya.” Journal of Archaeological Science 36 7 (July): 1605–
1614.
Brown, K.S. 2011. “The Sword in the Stone: Lithic Raw Material Exploitation in the Middle
Stone Age at Pinnacle Point Site 5-6, Southern Cape, South Africa.” PhD
Dissertation, Cape Town, South Africa: University of Cape Town.
Brown, K.S., and C.W. Marean. 2010. “Wood fuel availability for heat treatment drives the
rise and fall of silcrete as a raw material in the Midde Stone Age of South Africa.”
Abstracts of the Paleoantrhopology Society 2010 Meetings: A0001–A0040.
Brown, K.S., C.W. Marean, A.I.R. Herries, Z. Jacobs, C. Tribolo, D. Braun, D.L. Roberts,
M.C. Meyer, and J. Bernatchez. 2009. “Fire As an Engineering Tool of Early
Modern Humans.” Science 325 5942: 859 –862.
Brown, K.S., C.W. Marean, Z. Jacobs, B.J. Schoville, S. Oestmo, E.C. Fisher, J.
Bernatchez, P. Karkanas, and T. Matthews. 2012. “An early and enduring
advanced technology originating 71,000 years ago in South Africa.” Nature 491
7425 (November 22): 590–593.
119
Chase, B.M. 2010. “South African palaeoenvironments during marine oxygen isotope
stage 4: a context for the Howiesons Poort and Still Bay industries.” Journal of
Archaeological Science 37 6 (June): 1359–1366.
Chase, B.M., M.E. Meadows, 2007. Late Quaternary dynamics of southern Africa’s winter
rainfall zone. Earth Science Review 84, 103-138.
Christaras, B., F. Auger, and E. Mosse. 1994. “Determination of the moduli of elasticity of
rocks. Comparison of the ultrasonic velocity and mechanical resonance
frequency methods with direct static methods.” Materials and Structures 27 4:
222–228..
Clark, J.L., and I. Plug. 2008. Animal exploitation strategies during the South African
Middle Stone Age: Howiesons Poort and post-Howiesons Poort fauna from
Sibudu Cave.” Journal of Human Evolution 54 6 (June): 886–898.
Cochrane, G.W.G. 2008. “The Transition from Howieson’s Poort to Post-Howieson’s
Poort Industries in Southern Africa.” Goodwin Series: 157–167.
Cotterell, B., and J. Kamminga. 1987. “The Formation of Flakes.” American Antiquity 52 4
(October 1): 675–708.
Corkill, T. 1999. “Here and there: Links between stone sources and Aboriginal
archaeological sites in Sydney, Australia.” Thesis, University of Sydney.
Crabtree, D.E., and B.R. Butler. 1964. “Notes on experiments in flintknapping: 1. Heat
treatment of silica materials.” Tebiwa 7 1: 1–6.
Crawford M.A., M. Bloom, C.L. Broadhurst, W.F. Schmidt, S.C.G.C. Cunnae, K.
Gehbresmeskel, F. Linseisen, J. Lloyd-Smith, J. Parkington, “Evidence for the
unique function of docosahexaenoic acid during the evolution of the modern
hominid brain,” Lipids 34, no. S1 (1999): S39-S47.
120
Davies, W. 1952. “Low silica brick symposium. No. 3- Raw Materials.” Transactions of the
British Ceramic Society 51: 95–112.
Day, M. J., & A.S. Goudie, 1977. Field assessment of rock hardness using the Schmidt
test hammer. British Geomorphological Research Group Technical Bulletin, 18,
19-29.
Deacon, H.J., J. Deacon, 1999. Human Beginnings in South Africa: Uncovering the
Secrets of the Stone Age (David Philip, Cape Town, South Africa).
Deere, D. U., & R.P. Miller, 1966. Engineering classification and index properties for
intact rock. Illinois University at Urbana Department of Civil Engineering.
(Technical report for United States Air Force).
Demirdag, S., H. Yavuz, and R. Altindag. 2009. “The effect of sample size on Schmidt
rebound hardness value of rocks.” International Journal of Rock Mechanics and
Mining Sciences 46 4 (June): 725–730.
Dinçer, I., A. Acar, I. Çobanoğlu, and Y. Uras. 2004. “Correlation between Schmidt
hardness, uniaxial compressive strength and Young’s modulus for andesites,
basalts and tuffs.” Bulletin of Engineering Geology and the Environment 63 2
(June 1): 141–148.
Domanski, M., and J.A. Webb. 1992. “Effect of heat treatment on siliceous rocks used in
prehistoric lithic technology.” Journal of Archaeological Science 19 6
(November): 601–614.
———. 2007. “A review of heat treatment research.” Lithic Technology 32 2 (October 1):
153–194.
Domanski, M., J.A. Webb, and J. Boland. 1994. “Mechanical Properties of Stone Artefact
Materials and the Effect of Heat Treatment.” Archaeometry 36 2 (August 1): 177–
208.
121
Fagundes, N. J., N. Ray, M. Beaumont, S. Neuenschwander, F.M. Salzano, S.L. Bonatto,
& L. Excoffier, (2007). Statistical evaluation of alternative models of human
evolution. Proceedings of the National Academy of Sciences, 104(45), 17614-
17619.
Fisher, E.C., M. Bar-Matthews, A. Jerardino, and C.W. Marean. 2010. “Middle and Late
Pleistocene paleoscape modeling along the southern coast of South Africa.”
Quaternary Science Reviews 29 11-12 (June): 1382–1398.
Fowell, R. J., & I. McFeat-Smith, 1976. Factors influencing the cutting performance of a
selective tunnelling machine. In Proceedings of tunnelling symposium (Vol. 76,
pp. 301-309).
Frankel, J. 1952. “Silcrete near Albertinia, Cape Province.” South African Journal of
Science 49: 173–182.
Frankel, J., and L. Kent. 1937. “Grahamstown surface quartzites (silcretes).”
Transactions of the Geological Society of South Africa 40: 1–42.
Flenniken, J.J., and E.G. Garrison. 1975. “Thermally altered novaculite and stone tool
manufacturing techniques.” Journal of Field Archaeology 2 1-2 (January 1): 125–
131.
Flenniken, J.J., and J.P. White. 1983. “Heat treatment of siliceous rocks and its
implications for Australian prehistory.” Australian Aboriginal Studies 1: 43–47.
Gamble, C. 1994. Timewalkers: The prehistory of global colonization. Cambridge:
Harvard University Press.
Goktan RM, N. Gunes, 2005. A comparative study of Schmidt hammer testing
procedures with reference to rock cutting machine performance prediction.
International Journal of Rock Mechanics and Mining Sciences 42: 466–472.
122
Goodman, M.E. 1944.. “The Physical Properties of Stone Tool Materials.” American
Antiquity 9 4 (April 1): 415–433.
Goodwin, A. J. H., & C. van Riet Lowe, 1929. The Stone Age cultures of South Africa.
Annals of the South African Museum, 27, 1-289.
Goudie, A.S. 2006. “The Schmidt Hammer in Geomorphological Research.” Progress in
Physical Geography 30 6 (December 1): 703–718.
Griffiths, D.R., C.A. Bergman, C.J. Clayton, K. Ohnuma, G.V. Robins, and N.J. Seeley.
1987. “Experimental investigations of the heat treatment of flint.” In The Human
Uses of Flint and Chert, edited by, G.G. Sieveking and M.H. Newcomer 43–51.
Cambridge, UK: Cambridge University Press.
Gupta V. 2009. Non-destructive testing of some higher Himalayan rocks in the Satluj
Valley. Bulletin of Engineering Geology and Environment 68: 409–416.
Henshilwood, C.S., F. d’Errico, C.W. Marean, R.G. Milo, and R. Yates. 2001. “An early
bone tool industry from the Middle Stone Age at Blombos Cave, South Africa:
implications for the origins of modern human behaviour, symbolism and
language.” Journal of Human Evolution 41 6 (December): 631–678.
Henshilwood, C.S., F. d’ Errico, R. Yates, Z. Jacobs, C. Tribolo, G.A.T. Duller, N. Mercier,
et al. 2002. “Emergence of Modern Human Behavior: Middle Stone Age
Engravings from South Africa.” Science 295 5558 (February 15): 1278 –1280.
Henshilwood, C.S., and C.W. Marean. 2003. “The Origin of Modern Human Behavior:
Critique of the Models and Their Test Implications.” Current Anthropology 44 5
(December 1): 627–651.
Henshilwood, C., F. d’ Errico, M. Vanhaeren, K. van Niekerk, and Z. Jacobs. 2004.
“Middle Stone Age Shell Beads from South Africa.” Science 304 5669 (April 16):
404.

123
Henshilwood, C.S., F. d’ Errico, and I. Watts. 2009. “Engraved ochres from the Middle
Stone Age levels at Blombos Cave, South Africa.” Journal of Human Evolution 57
1 (July): 27–47.
Henshilwood, C. S., & B. Dubreuil, 2011. The Still Bay and Howiesons Poort, 77–59 ka.
Current Anthropology, 52(3), 361-400.
Howey, M.C.L. 2007. “Using multi-criteria cost surface analysis to explore past regional
landscapes: a case study of ritual activity and social interaction in Michigan, AD
1200–1600.” Journal of Archaeological Science 34 11 (November): 1830–1846.
Hucka, V. 1965. A rapid method of determining the strength of rocks in situ. International
Journal of Rock Mechanics and Mining Sciences (Vol. 2, No. 2, pp. 127-134).
ISRM, 1978. Suggested methods for determining hardness and abrasiveness of rocks.
International Journal of Rock Mechanics and Mining Science, Geomechanical
Abstracts 15, 89– 97.
Jacobs, Z. 2010. “An OSL chronology for the sedimentary deposits from Pinnacle Point
Cave 13B—A punctuated presence.” Journal of Human Evolution 59 3–4
(September): 289–305.
Jacobs, Z., G.A. Duller, & A.G. Wintle, 2006. Interpretation of single grain De distributions
and calculation of De. Radiation Measurements, 41(3), 264-277.
Jacobs, Z., R. G. Roberts, R. F. Galbraith, H. J. Deacon., R. Grün, A. Mackay, P.
Mitchell, R. Vogelsang, L. Wadley, 2008. Ages for the Middle Stone Age of
Southern Africa: Implications for Human Behavior and Dispersal. Science,
322(5902), 733–735.
Jacobs, Z., & R. G. Roberts. (2009a). Human History Written in Stone and Blood.
American scientist, 97(4), 302–309.
124
———. (2009b). Were environmental or demographic factors the driving force behind
Middle Stone Age innovations in southern Africa? South African Journal of
Science, 105(9-10), 333–334.
———. (2009c). Catalysts for Stone Age innovations: What might have triggered two
short-lived bursts of technological and behavioral innovation in southern Africa
during the Middle Stone Age? Communicative & Integrative Biology, 2(2), 191–
193.
Jacobs, Z., E.H. Hayes, R.G. Roberts, R.F. Galbraith, & C.S. Henshilwood, 2013. An
improved OSL chronology for the Still Bay layers at Blombos Cave, South Africa:
further tests of single-grain dating procedures and a re-evaluation of the timing of
the Still Bay industry across southern Africa. Journal of Archaeological Science,
40(1), 579-594.
Katz, O., Z. Reches, J. –C. Roegiers, 2000. “Evaluation of mechanical rock properties
using a Schmidt hammer.” International Journal of Rock Mechanics and Mining
Sciences 37: 723–728.
Kdybinski A. 1980. Bursting liability indices of coal. International Journal of Rock
Mechanichs and Mineral Science. Geomechanical Abstracts 17:167–171.
Kelly, R.L. 1995. The Foraging Spectrum.Washington D.C.: Smithsonian Institution
Press.
Kennedy D.M., M.E. Dickson. 2006. Lithological control on the elevation of shore
platforms in a microtidal setting. Earth Surface Processes and Landforms 31:
1575–1584.
Kılıç, A., and A. Teymen. 2008. “Determination of mechanical properties of rocks using
simple methods.” Bulletin of Engineering Geology and the Environment 67 2
(May 1): 237–244.
125
Klein, R.G. 1995. “Anatomy, behavior, and modern human origins,” Journal of World
Prehistory 9, no. 2: 167-198.
———. 2000. “Archeology and the evolution of human behavior,” Evolutionary
Anthropology: 17-36.
———. 2008. Out of Africa and the evolution of human behavior. Evolutionary
Anthropology: Issues, News, and Reviews, 17(6), 267-281.
———. 2009. The Human Career: Human Biological and Cultural Origins (2nd ed.).
Chicago: University of Chicago Press.
Kolaiti, E., & Z. Papadopoulos, 1993. Evaluation of Schmidt rebound hammer testing: a
critical approach. Bulletin of the International Association of Engineering
Geology-Bulletin de l'Association Internationale de Géologie de l'Ingénieur, 48(1),
69-76.
Lahr, M.M., R.A. Foley, 1998. Towards a theory of modern human origins: geography,
demography, and diversity in recent human evolution. Yearbook of Physical
Anthropologhy 41, 137-176.
Lamplugh, G.W. 1902. “‘Calcrete.’” Geological Magazine (Decade IV) 9 12: 575–575.
Lombard, M. 2005. “The Howieson’s Poort of South Africa: what we know, what we think
we know, what we need to know.” Southern African Humanities 17: 33–55.
———. 2008. “Finding resolution for the Howieson’s Poort through the microscope:
micro-residue analysis of segments from Sibudu Cave, South Africa.” Journal of
Archaeological Science 35 1 (January): 26–41.
———. 2009. “The Howieson’s Poort Of South Africa Amplified.” The South African
Archaeological Bulletin 64 189 (June 1): 4–12.
126
Mackay, A. 2011. “Nature and significance of the Howiesons Poort to post-Howiesons
Poort transition at Klein Kliphuis rockshelter, South Africa.” Journal of
Archaeological Science 38 7 (July): 1430–1440.
Mackay, A., B. A Stewart, and B. M. Chase. (2014). Coalescence and fragmentation in
the late Pleistocene archaeology of southernmost Africa. Journal of human
evolution, 72, 26-51.
Malan, J.A., and J.H.A. Viljoen. 1990. “Geological guide to the Southern Cape:
Geocongress ’90 Excursion Guide.” Geological Society of South Africa: 81.
———. 2008. Southern Cape Geology: Evolution of a Rifted Margin. Field Excursion
FT07 Guidebook. Prepared for the American Association of Petroleum
Geologists International Conference and Exhibition, 26-29th of Oct., 2008, Cape
Town, South Africa.
Mandeville, M.D. 1973. “A consideration of the thermal pretreatment of chert.” The Plains
Anthropologist: 177–202.
Marean, C.W., 2008. The African Origins of Modern Human Behavior. NobelConference
44. Available from: http://gustavus.edu/events/nobelconference/2008/.
———. 2010a. “Pinnacle Point Cave 13B (Western Cape Province, South Africa) in
context: The Cape Floral kingdom, shellfish, and modern human origins.” Journal
of Human Evolution 59 3–4 (October): 425–443.
———. 2010b. “When the Sea Saved Humanity.” Scientific American 303 2: 54–61.
———. 2011. “Coastal South Africa and the Coevolution of the Modern Human Lineage
and the Coastal Adaptation.” In Trekking the Shore, edited by, N. F. Bicho, J. A.
Haws, and Loren G. Davis, 421–440. Interdisciplinary Contributions to
Archaeology. Springer New York, January 1.
127
Marean, C. W., & Z. Assefa, 2005. The Middle and Upper Pleistocene African record for
the biological and behavioral origins of modern humans. African archaeology, 93-
129.
Marean, C.W., M. Bar-Matthews, J. Bernatchez, E. Fisher, P. Goldberg, A.I.R. Herries, Z.
Jacobs, et al. 2007. “Early human use of marine resources and pigment in South
Africa during the Middle Pleistocene.” Nature 449 (October 18): 905–908.
Marker, M.E., and M.J. McFarlane. 1997. “Cartographic analysis of the African surface
complex between Albertinia and Mossel Bay, Southern Cape, South Africa.”
South African Journal of Geology 100 3 (September 1): 185–194.
Marker, M.E., M.J. McFarlane, and R.J. Wormald. 2002. “A laterite profile near Albertinia,
Southern Cape, South Africa: its significance in the evolution of the African
Surface.” South African Journal of Geology 105 1 (March 1): 67–74.
McBrearty, S., & A.S. Brooks, (2000). The revolution that wasn't: a new interpretation of
the origin of modern human behavior. Journal of human evolution, 39(5), 453-
563.
McCall, G.S. 2006. “Multivariate perspectives on change and continuity in the Middle
Stone Age lithics from Klasies River Mouth, South Africa.” Journal of Human
Evolution 51 4 (October): 429–439.
McCall, G.S. 2007. “Behavioral ecological models of lithic technological change during
the later Middle Stone Age of South Africa.” Journal of Archaeological Science 34
10 (October): 1738–1751.
McCarroll, D. 1989. “Potential and Limitations of the Schmidt Hammer for Relative-Age
Dating: Field Tests on Neoglacial Moraines, Jotunheimen, Southern Norway.”
Arctic and Alpine Research 21 3 (August 1): 268–275.

128
Mellars P.A., K. Gibson, Eds. 1996. Modelling the Early Human Mind (McDonald Institute
Monographs, Cambridge).
Mercieca, A., & P. Hiscock, 2008. Experimental insights into alternative strategies of lithic
heat treatment. Journal of Archaeological Science, 35(9), 2634-2639.
Minichillo, T. 2006. “Raw material use and behavioral modernity: Howiesons Poort lithic
foraging strategies.” Journal of Human Evolution 50 3 (March): 359–364.
Mountain, E. D. 1952. The origin of silcrete. South African Journal of Science, 48, 201-
204.
Mourre, V., P. Villa, and C.S. Henshilwood. 2010. “Early Use of Pressure Flaking on
Lithic Artifacts at Blombos Cave, South Africa.” Science 330 6004 (October 29):
659–662.
Nash, D.J., and J.S. Ullyott. 2007. “Silcrete.” In Geochemical Sediments & Landscapes,
edited by, David J. Nash and Sue McLaren, 95–143.
Nash, D.J., S. Coulson, S. Staurset, J.S. Ullyott, M. Babutsi, L. Hopkinson, and M.P.
Smith. 2013a. April. “Provenancing of silcrete raw materials indicates long-
distance transport to Tsodilo Hills, Botswana, during the Middle Stone Age.”
Journal of Human Evolution 64 4 (April): 280–288.
Nash, D.J., S. Coulson, S. Staurset, M.P. Smith, and J.S. Ullyott. 2013b. November.
“Provenancing silcrete in the Cape coastal zone: Implications for Middle Stone
Age research in South Africa.” Journal of Human Evolution 65 5 (November).
Nash, D., S. Coulson, S. Staurset, S. Ullyot, 2014.Provenancing of silcrete artifacts: new
insights into Middle Stone Age human behavior from northwest Botswana.
Abstracts of the Society for American Archaeology 2014 Meeting. 58.
129
Orton, J. (2008). A useful measure of the desirability of different raw materials for retouch
within and between assemblages: the raw material retouch index (RMRI).
Journal of Archaeological Science, 35(4), 1090-1094.
Partridge, T.C., and R.R. Maud. 1987. “Geomorphic evolution of Southern Africa since
the Mesozoic.” South African Journal of Geology 90 2 (June 1): 179–208.
Poole, R.W., and I.W. Farmer. 1980. “Consistency and repeatability of Schmidt Hammer
rebound data during field testing.” International Journal of Rock Mechanics and
Mining Sciences & Geomechanics Abstracts 17 3 (June): 167–171.
Purdy, B.A. 1971. “Investigations Concerning the Thermal Alteration of Silica Minerals:
An Archaeological Approach.” Ph.D., United States -- Florida: University of
Florida.
Purdy, B.A., and H.K. Brooks. 1971. “Thermal Alteration of Silica Minerals: An
Archeological Approach.” Science 173 3994 (July 23): 322–325.
Roberts, D.L. 2003. “Age, Genesis, and Significance of South African Coastal Belt
Silcretes.” Council for Geoscience 95.
Rogers, J. 1980. “First Report on the Cenozoic Sediments between Cape Town and
Elands Bay.” Geological Survey of South Africa Open File 136.
Sachpazis, C. 1990. “Correlating schmidt hardness with compressive strength and
Young’s modulus of carbonate rocks.” Bulletin of Engineering Geology and the
Environment 42 1: 75–83.
Schmidt, P., S. Masse, G. Laurent, A. Slodczyk, E. Le Bourhis, C. Perrenoud, J. Livage,
and F. Fröhlich. 2012. “Crystallographic and structural transformations of
sedimentary chalcedony in flint upon heat treatment.” Journal of Archaeological
Science 39 1 (January):
130
Schmidt, P., G. Porraz, A. Slodczyk, L. Bellot-gurlet, W. Archer, and C.E. Miller. 2013.
“Heat treatment in the South African Middle Stone Age: temperature induced
transformations of silcrete and their technological implications.” Journal of
Archaeological Science 40 9. (September): 3519–3531.
Shariati, M., N.H. Ramli-Sulong, P. Shafigh, and H. Sinaei. 2011. Assessing the strength
of reinforced concrete structures through Ultrasonic Pulse Velocity and Schmidt
Rebound Hammer tests. Scientific Research and Essays 6-1: 213-220.
Shone, R.W., and P.W.K. Booth. 2005. “The Cape Basin, South Africa: A review.” Journal
of African Earth Sciences 43 1–3. Phanerozoic Evolution of Africa (October):
196–210.
Singh, R. N., F.P. Hassani, & P.A.S. Elkington, 1983. The application of strength and
deformation index testing to the stability assessment of coal measures
excavations. In The 24th US Symposium on Rock Mechanics (USRMS).
American Rock Mechanics Association.
Sonmez, H., C. Gokceoglu, H.A. Nefeslioglu, and A. Kayabasi. 2006. “Estimation of rock
modulus: For intact rocks with an artificial neural network and for rock masses
with a new empirical equation.” International Journal of Rock Mechanics and
Mining Sciences 43 2 (February): 224–235.
Stringer, C. (2002). Modern human origins: progress and prospects. Philosophical
Transactions of the Royal Society of London. Series B: Biological Sciences,
357(1420), 563-579.
Summerfield, M.A. 1981. The nature and occurrence of silcrete, southern Cape Province,
South Africa. Research paper / School of Geography, University of Oxford,0305-
8190 ;28. Oxford: School of Geography, University of Oxford.
131
———. 1982. “Distribution, nature and probable genesis of silcrete in arid and semi-arid
southern Africa.” Acidic soils and geomorphic processes : proceedings of the
International Conference of the International Society of Soil Science, Jerusalem,
Israel, March 19-April 4, 1981 / D.H.
———. 1983a. “Petrography and Diagenesis of Silcrete from the Kalahari Basin And
Cape Coastal Zone, Southern Africa.” Journal of Sedimentary Research 53 3.
———. 1983b. “Silcrete.” In Chemical Sediments and Geomorphology: Precipitates and
Residua in the Near-Surface Environment, edited by, Kenneth. Pye and Andrew.
Goudie, 59–91. London, UK: Academic Press.
———. 1983c. February. “Silcrete as a palaeoclimatic indicator: evidence from southern
Africa.” Palaeogeography, Palaeoclimatology, Palaeoecology 41 1–2 (February):
65–79.
———. 1984. March 1. “Isovolumetric weathering and silcrete formation, southern Cape
Province, South Africa.” Earth Surface Processes and Landforms 9 2 (March 1):
135–141.
———. 1986. “Reply to discussion of-- Silcrete as a Palaeoclimatic indicator: Evidence
from Southern Africa.” Palaeogeography, Palaeoclimatology, Palaeoecology 52
3: 356–360.
Summerfield, M.A., and A. Goudie. 1980. “The sarsens of southern England: their
palaeoenvironmental interpretation with reference to other silcretes.” The shaping
of southern England 11: 71–100.
Taliaferro, M.S., B.A. Schriever, and M.S. Shackley. 2010. “Obsidian procurement, least
cost path analysis, and social interaction in the Mimbres area of southwestern
New Mexico.” Journal of Archaeological Science 37 3 (March): 536–548.

132
Tankard, A., H. Welsink, P. Aukes, R. Newton, and E. Stettler. 2009. “Tectonic evolution
of the Cape and Karoo basins of South Africa.” Marine and Petroleum Geology
26 8 (September): 1379–1412.
Tattersall, I. 2009. “Human origins: Out of Africa.” Proceedings of the National Academy
of Sciences 106 38 (September 22): 16018–16021.
Thackeray, A.I. 1989. “Changing Fashions in the Middle Stone Age: The Stone Artefact
Sequence from Klasies River Main Site, South Africa.” The African
Archaeological Review 7 (January 1): 33–57.
Thamm, A.G, M.R. Johnson, 2006. The Cape Super Group In: B. Thomas Ed. The
Geology of South Africa. Geological Society of South Africa: Johannesburg, 443-
460.
Thompson, E., and C.W. Marean. 2008. “The Mossel Bay lithic variant: 120 years of
Middle Stone Age research from Cape St Blaize Cave to Pinnacle Point.”
Goodwin Series 10 (December 1): 90–104.
Thompson, E., H.M. Williams, and T. Minichillo. 2010. “Middle and late Pleistocene
Middle Stone Age lithic technology from Pinnacle Point 13B (Mossel Bay,
Western Cape Province, South Africa).” Journal of Human Evolution 59 3–4
(October): 358–377.
Tobler, W. 1993. Three presentations on geographical analysis and modeling (pp. 93-1).
NCGIA.
Tribolo C., N. Mercier, H. Valladas, 2005. Chronology of the Howieson’s Poort and Still
Bay Techno-Complexes: Assessment and New Data from Luminescence, in
d’Errico F, Backwell L, Editors , From Tools to Symbols: From Early Hominids to
Modern Humans, Wits University Press, Johannesburg: p. 493-511.
133
Tribolo, C., N. Mercier, E. Douville, J.-L. Joron, J.-L. Reyss, D. Rufer, N. Cantin, Y.
Lefrais, C.E. Miller, G. Porraz, J. Parkington, J.-P. Rigaud, P.-J. Texier. 2013.
OSL and TL dating of the Middle Stone Age sequence at Diepkloof Rock Shelter
(South Africa): a clarification. Journal of Archaeological Science, 40(9), 3401–
3411.
Trinkaus, E. 2005. Early modern humans. Annual Review of Anthropology, 34, 207-230.
Twidale, C., and J. Hutton. 1986. “Silcrete as a climatic indicator: discussion.”
Palaeogeography, Palaeoclimatology, Palaeoecology 52 3: 351–356.
Ugan, A., J. Bright, & A. Rogers, 2003. When is technology worth the trouble?. Journal of
Archaeological Science, 30(10), 1315-1329.
Ullyott, J.S., D.J. Nash, and P.A. Shaw. 1998. “Recent advances in silcrete research and
their implications for the origin and palaeoenvironmental significance of sarsens.”
Proceedings of the Geologists’ Association 109 4: 255–270.
Viles, H., A. Goudie, S. Grab, & J. Lalley, 2011. The use of the Schmidt Hammer and
Equotip for rock hardness assessment in geomorphology and heritage science: a
comparative analysis. Earth Surface Processes and Landforms, 36(3), 320-333.
Volman, T. P. 1981. The Middle Stone Age of the Southern Cape. Ph.D. Thesis,
University of Chicago.
Wadley, L. 2008. “The Howieson’s Poort Industry Of Sibudu Cave.” Goodwin Series 10
(December 1): 122–132.
Webb, J. A., & M. Domanski, 2008. The relationship between lithology, flaking properties,
and artefact manufacture for Australian silcretes. Archaeometry, 50(4), 555-575.
Williams, R. B. G., & D.A. Robinson, 1983. The effect of surface texture on the
determination of the surface hardness of rock using the Schmidt hammer. Earth
Surface Processes and Landforms, 8(3), 289-292.
134
Wurz, S. 2002. “Variability in the Middle Stone Age Lithic Sequence, 115,000–60,000
Years Ago at Klasies River, South Africa.” Journal of Archaeological Science 29
9 (September): 1001–1015.
Yagiz, S. 2009. Predicting uniaxial compressive strength, modulus of elasticity and index
properties of rocks using the Schmidt hammer. Bulletin of engineering geology
and the environment, 68(1), 55-63.
Yaşar, E., and Y. Erdoğan. 2004. “Estimation of rock physicomechanical properties using
hardness methods.” Engineering Geology 71 3–4 (February): 281–288.
Yellen, J. E., A.S. Brooks., E. Cornelissen., M.J. Mehlman, & K. Stewart, 1995. A middle
stone age worked bone industry from Katanda, Upper Semliki Valley, Zaire.
Science, 268(52
Yılmaz, I., and H. Sendır. 2002. “Correlation of Schmidt hardness with unconfined
compressive strength and Young’s modulus in gypsum from Sivas (Turkey).”
Engineering Geology 66 3–4 (November): 211–219.
Yilmaz, I., and G. Yuksek. 2009. “Prediction of the strength and elasticity modulus of
gypsum using multiple regression, ANN, and ANFIS models.” International
Journal of Rock Mechanics and Mining Sciences 46 4 (June): 803–810.
Yonekura, K., and T. Suzuki. 2009. “Microhardness analysis and characterization of
Palaeolithic stone tool materials for understanding primary material selections
and utilizations.” Materials Characterization 60 4 (April): 282–291.
Young, G.M., W.E.L. Minter, and J.N. Theron. 2004. “Geochemistry and
palaeogeography of upper Ordovician glaciogenic sedimentary rocks in the Table
Mountain Group, South Africa.” Palaeogeography, Palaeoclimatology,
Palaeoecology 214 4 (November 25): 323–345.

135
Biographical Information
Since beginning his graduate career at the University of Texas at Arlington,
Christopher Shelton has participated in field projects at three different archaeological
sites (Knysna Eastern Heads Cave 1 (KEH-1), Pinnacle Point 5/6, and Vleesbaai), as
well as archaeological surveys, and lithic laboratory analysis in South Africa. After
completing his M.A., he is scheduled to return to South Africa as the assistant director at
KEH-1 for the 2015 field season. His interests include African Stone Age lithics analysis,
raw material acquisition patterns, the mechanical properties of stone and how they relate
to producing stone tools, and human paleoecology in southern Africa.
Currently, Mr. Shelton is employed as a staff archaeologist at the SWCA cultural
resource management firm in Arlington, Texas. He plans to continue his research in
Africa, while pursuing a PhD. in the near future.