Embed Size (px)
Citation preview
Real World Drug Utilization, Cost and Value Facts
Burt ZweigenhaftManaging Partner Upstream Partners NYCPresident Emeritus National Association Specialty Pharmacy Wash. DCFounder and Former CEO OncoMed Onco360
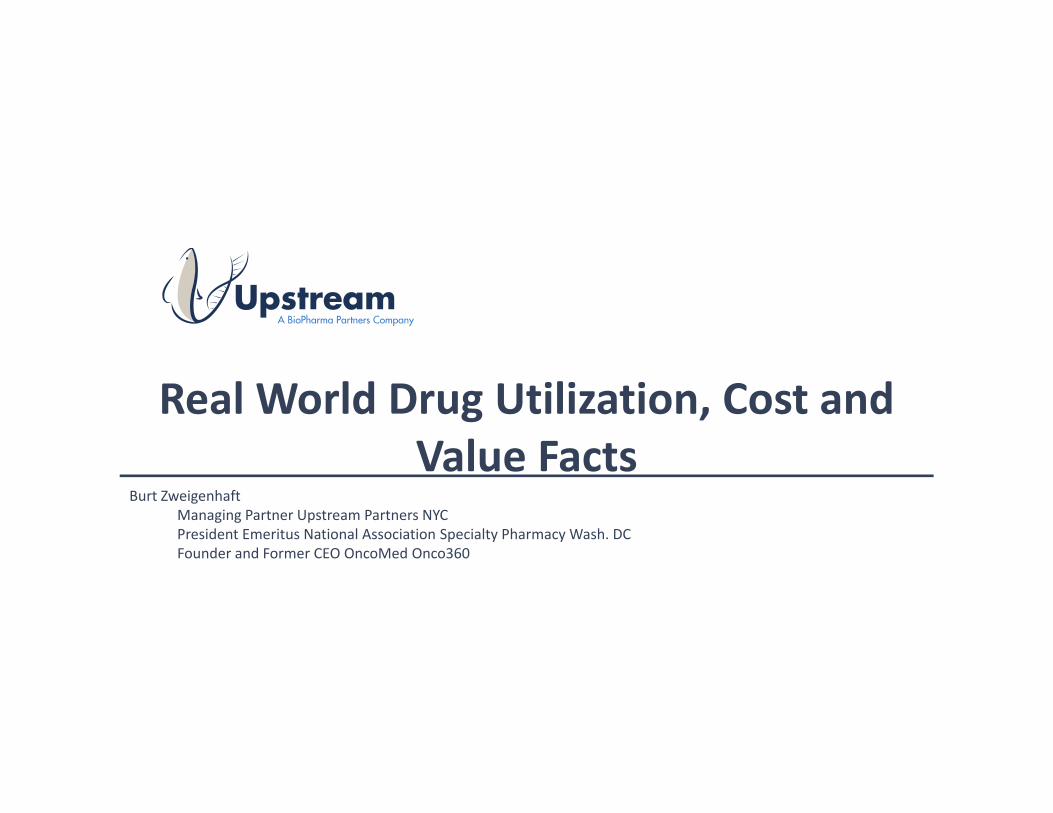
Not The Poster Child of Pharmaceutical Industry
This is the Face
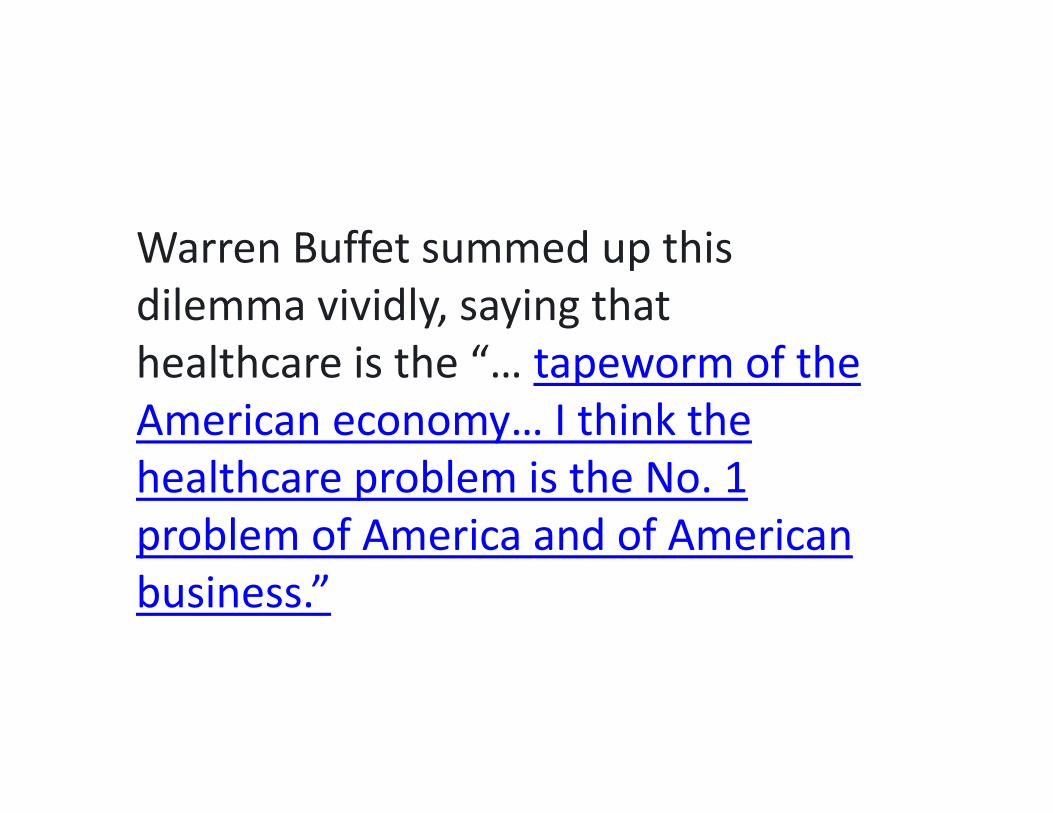
Warren Buffet summed up this dilemma vividly, saying that healthcare is the “… tapeworm of the American economy… I think the healthcare problem is the No. 1 problem of America and of American business.”
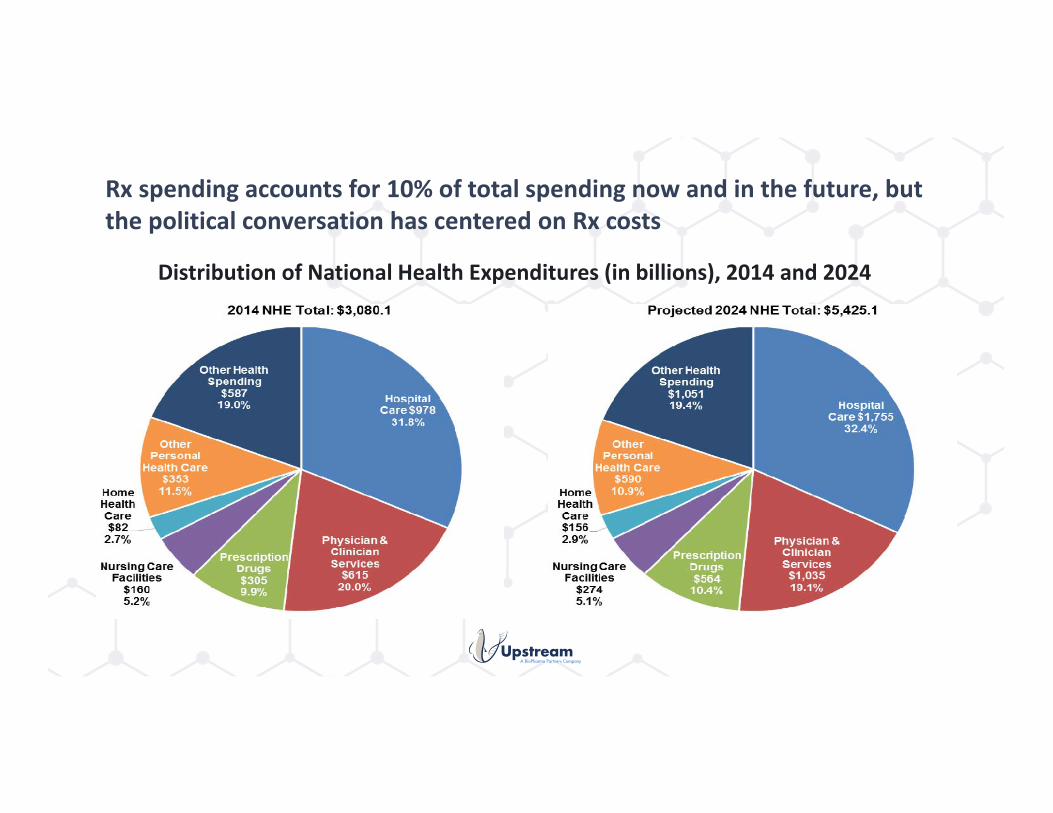
Rx spending accounts for 10% of total spending now and in the future, but the political conversation has centered on Rx costs
Distribution of National Health Expenditures (in billions), 2014 and 2024
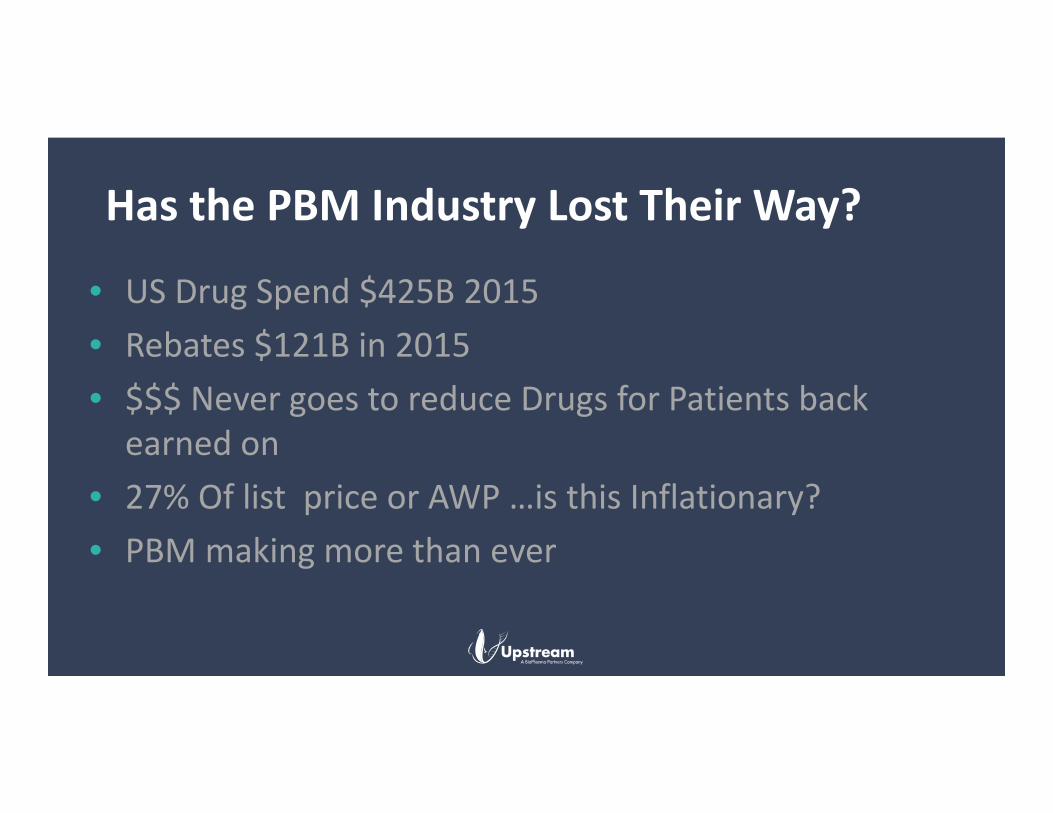
Has the PBM Industry Lost Their Way?
• US Drug Spend $425B 2015• Rebates $121B in 2015• $$$ Never goes to reduce Drugs for Patients back earned on
• 27% Of list price or AWP …is this Inflationary?• PBM making more than ever
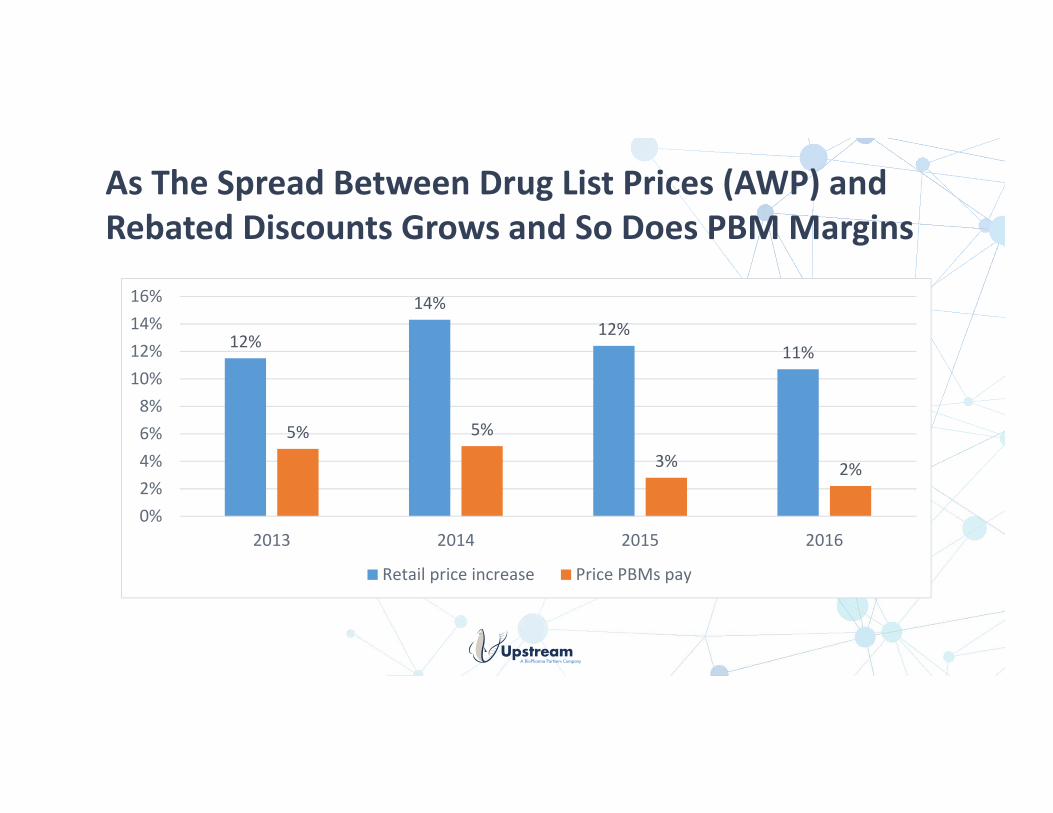
As The Spread Between Drug List Prices (AWP) and Rebated Discounts Grows and So Does PBM Margins
12%
14%12%
11%
5% 5%
3% 2%
0%2%4%6%8%10%12%14%16%
2013 2014 2015 2016
Retail price increase Price PBMs pay
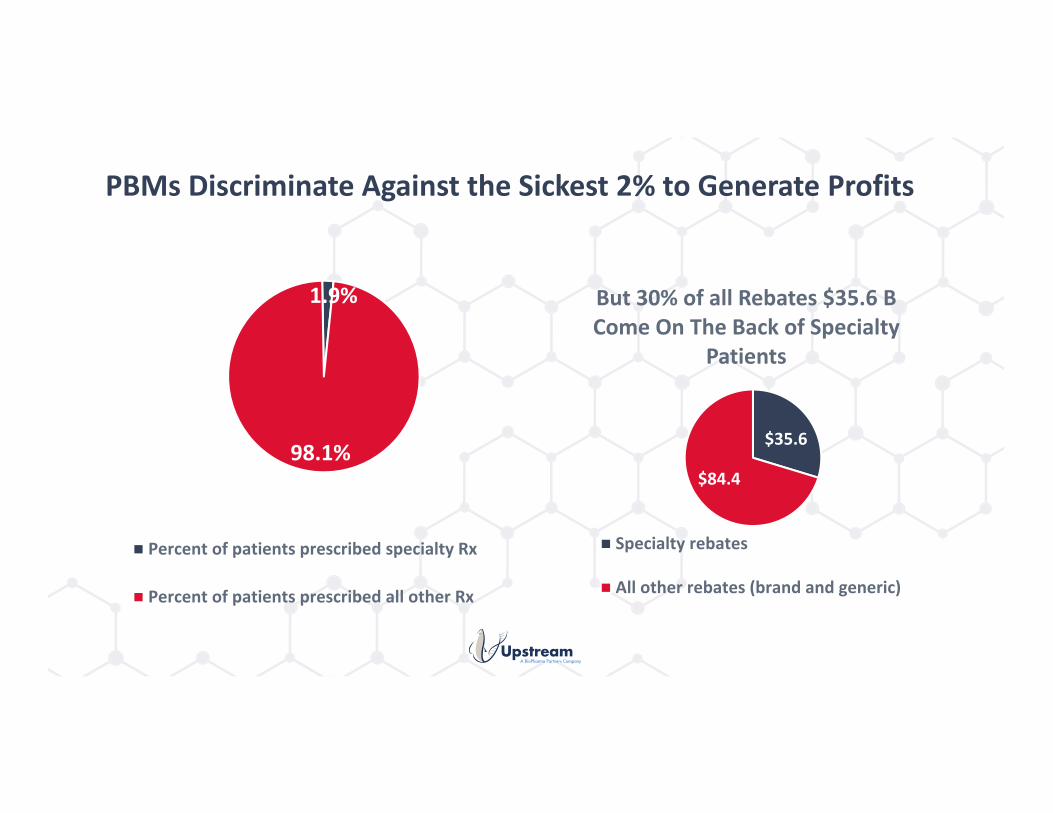
PBMs Discriminate Against the Sickest 2% to Generate Profits
1.9%
98.1%
Percent of patients prescribed specialty Rx
Percent of patients prescribed all other Rx
$35.6
$84.4
But 30% of all Rebates $35.6 B Come On The Back of Specialty
Patients
Specialty rebates
All other rebates (brand and generic)
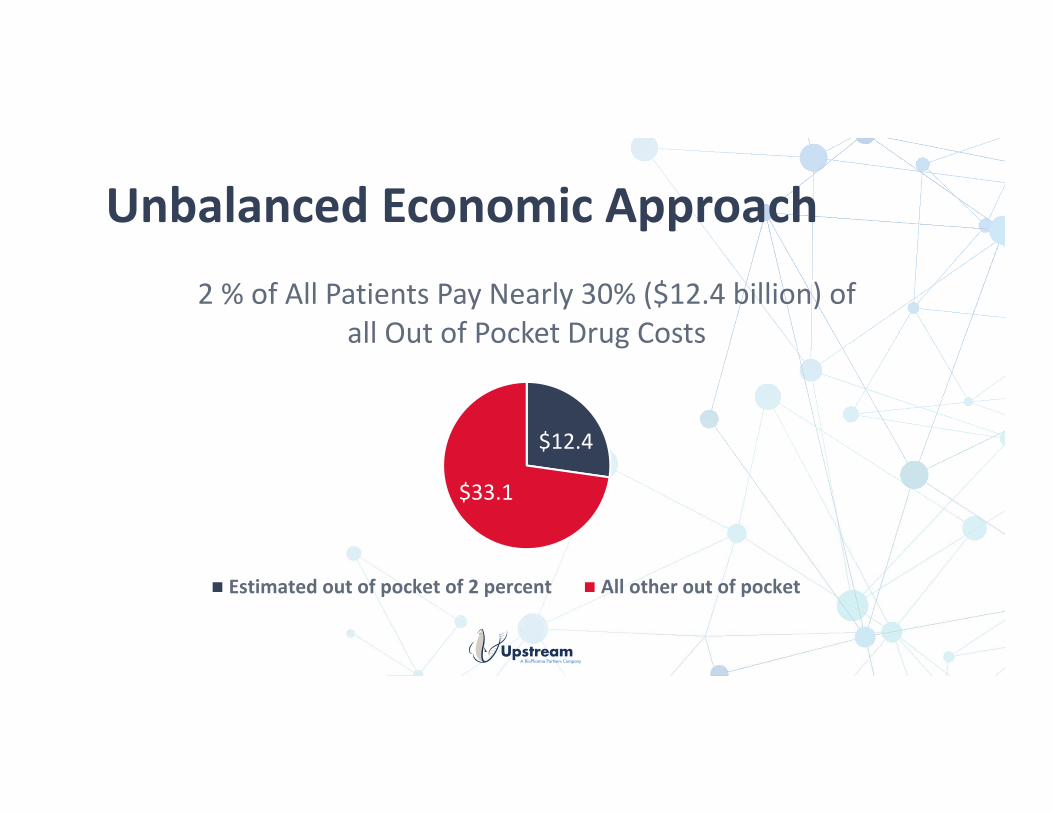
Unbalanced Economic Approach
$12.4
$33.1
2 % of All Patients Pay Nearly 30% ($12.4 billion) of all Out of Pocket Drug Costs
Estimated out of pocket of 2 percent All other out of pocket
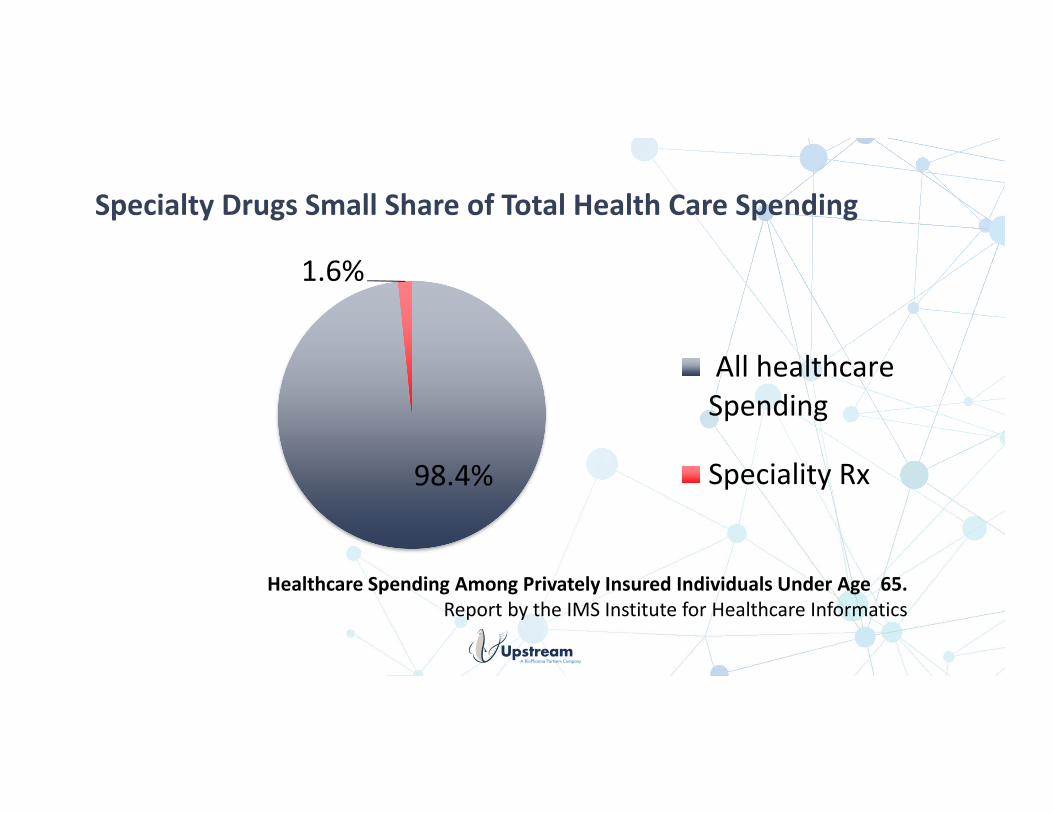
Specialty Drugs Small Share of Total Health Care Spending
98.4%
1.6%
All healthcareSpending
Speciality Rx
Healthcare Spending Among Privately Insured Individuals Under Age 65.Report by the IMS Institute for Healthcare Informatics
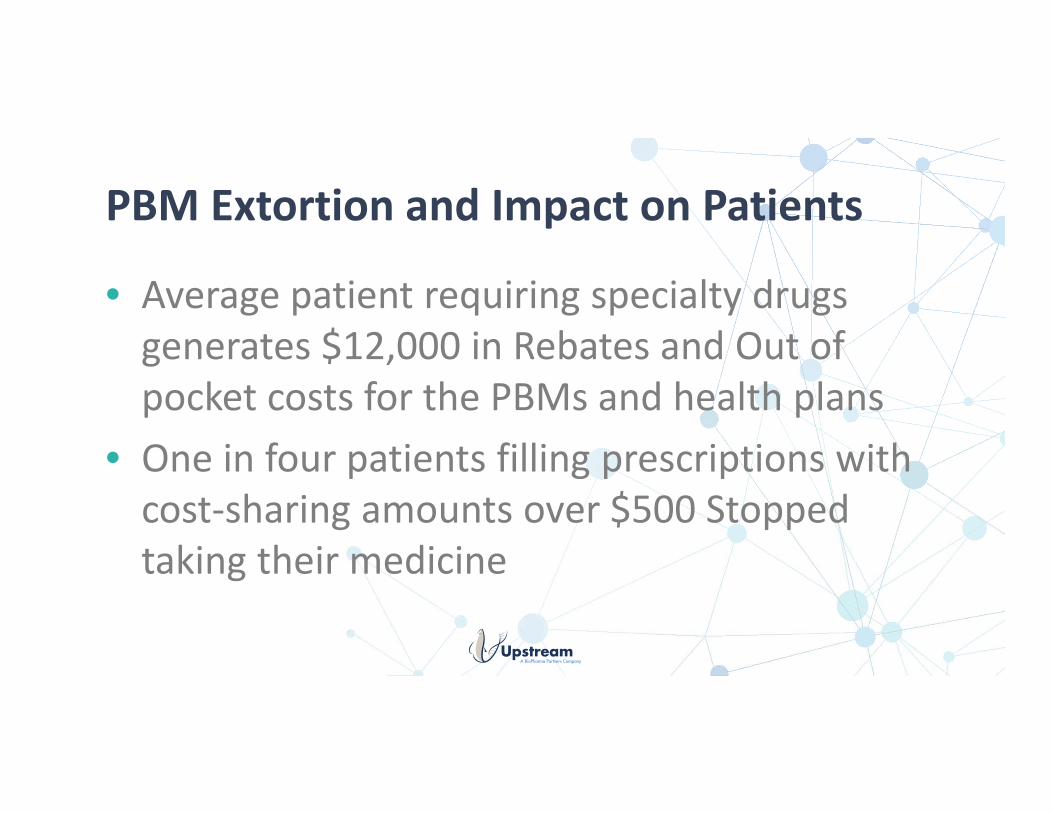
PBM Extortion and Impact on Patients
• Average patient requiring specialty drugs generates $12,000 in Rebates and Out of pocket costs for the PBMs and health plans
• One in four patients filling prescriptions with cost‐sharing amounts over $500 Stopped taking their medicine
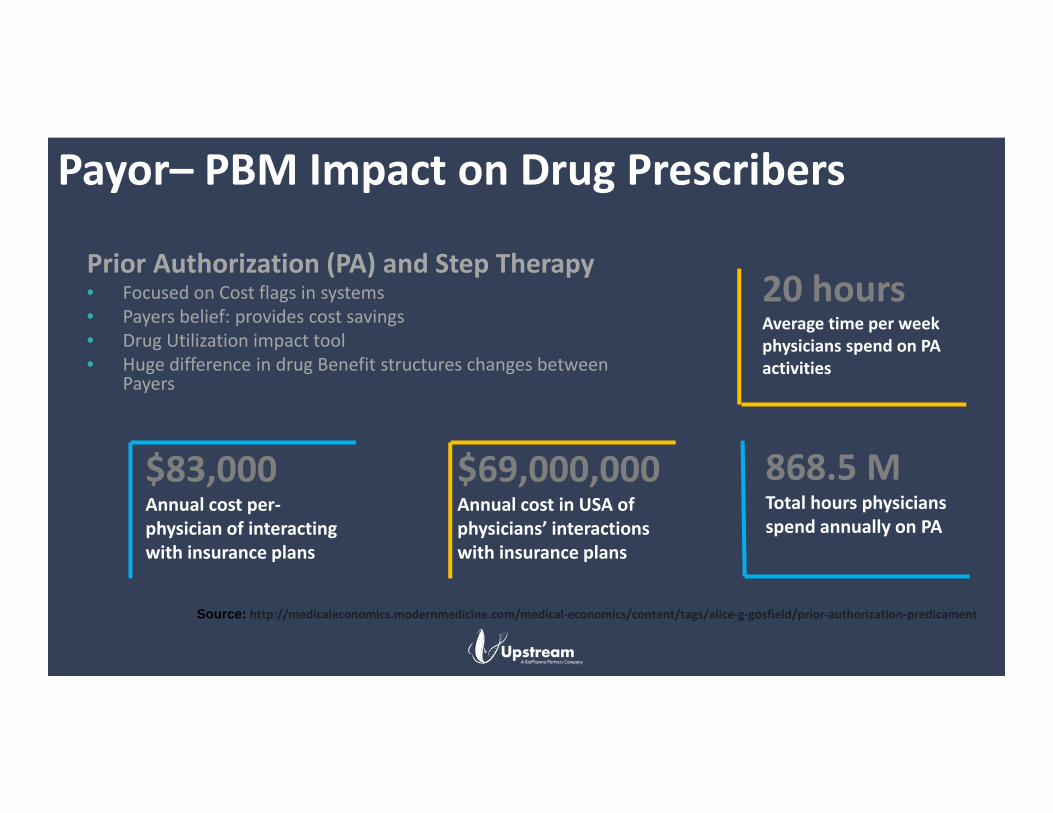
Prior Authorization (PA) and Step Therapy• Focused on Cost flags in systems• Payers belief: provides cost savings• Drug Utilization impact tool• Huge difference in drug Benefit structures changes between
Payers
Payor– PBM Impact on Drug Prescribers
20 hoursAverage time per week physicians spend on PA activities
868.5 MTotal hours physicians spend annually on PA
Source: http://medicaleconomics.modernmedicine.com/medical‐economics/content/tags/alice‐g‐gosfield/prior‐authorization‐predicament
$83,000Annual cost per‐physician of interacting with insurance plans
$69,000,000Annual cost in USA of physicians’ interactions with insurance plans
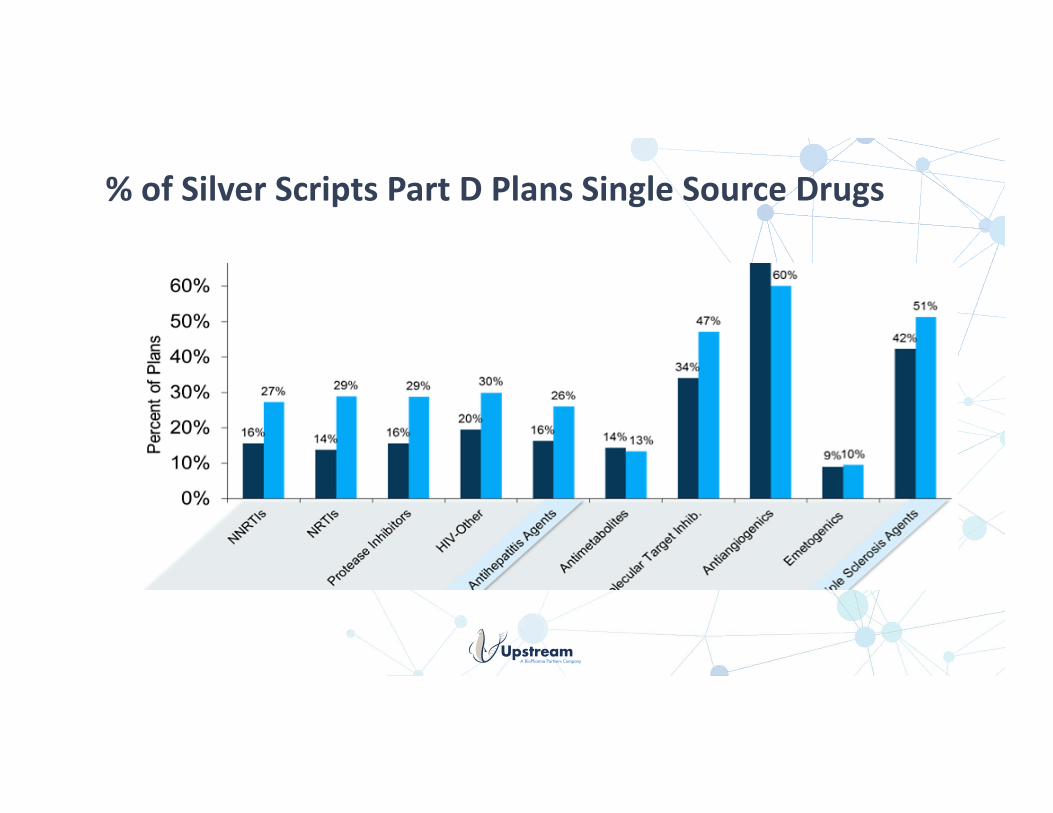
% of Silver Scripts Part D Plans Single Source Drugs
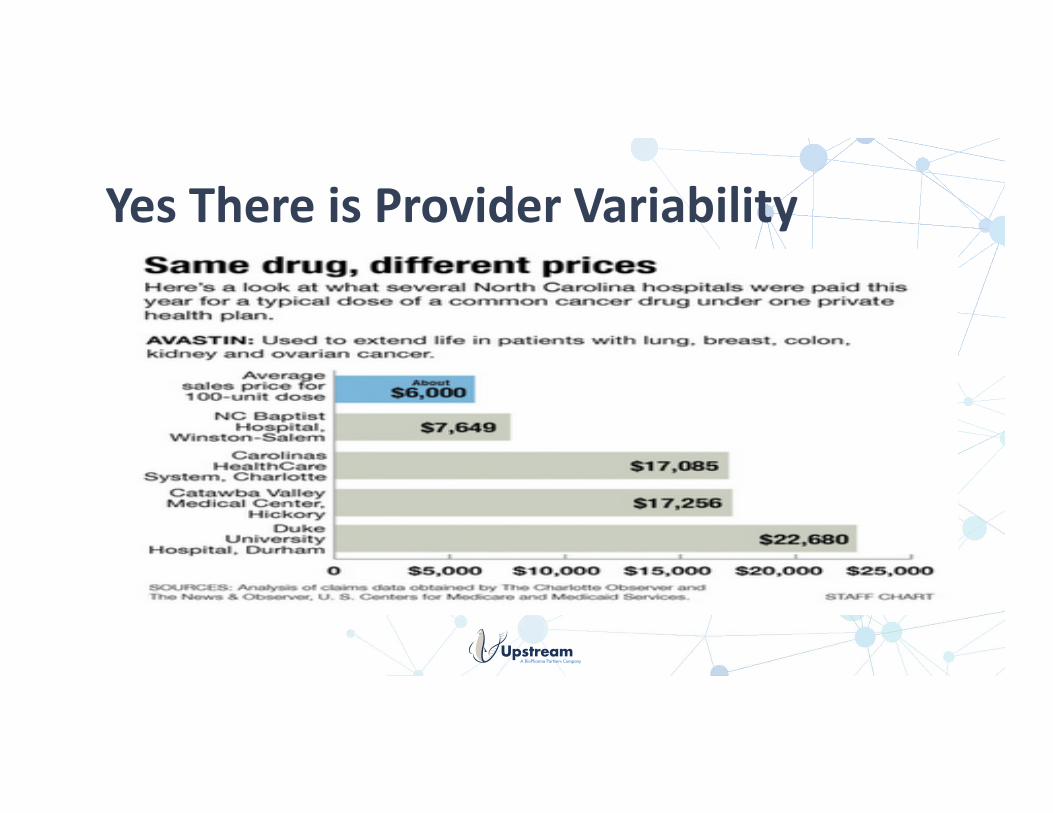
Yes There is Provider Variability
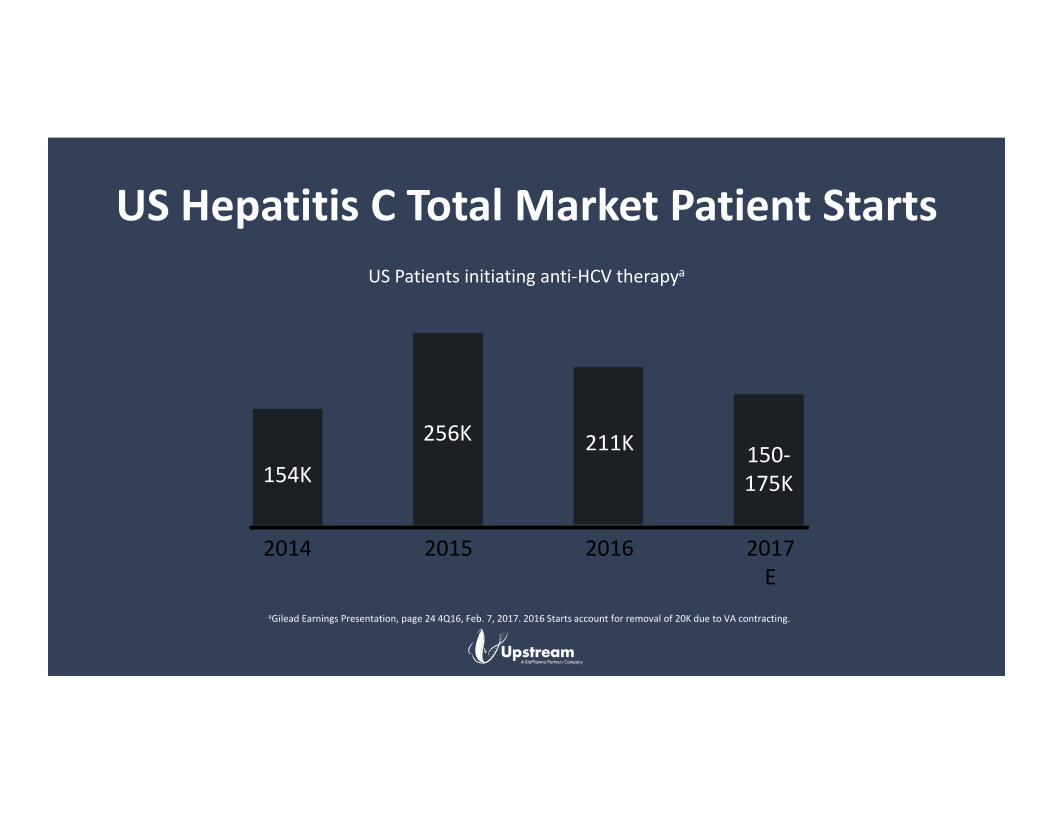
US Hepatitis C Total Market Patient Starts
2014 2017E
20162015
154K
256K 211K 150‐175K
aGilead Earnings Presentation, page 24 4Q16, Feb. 7, 2017. 2016 Starts account for removal of 20K due to VA contracting.
US Patients initiating anti‐HCV therapya
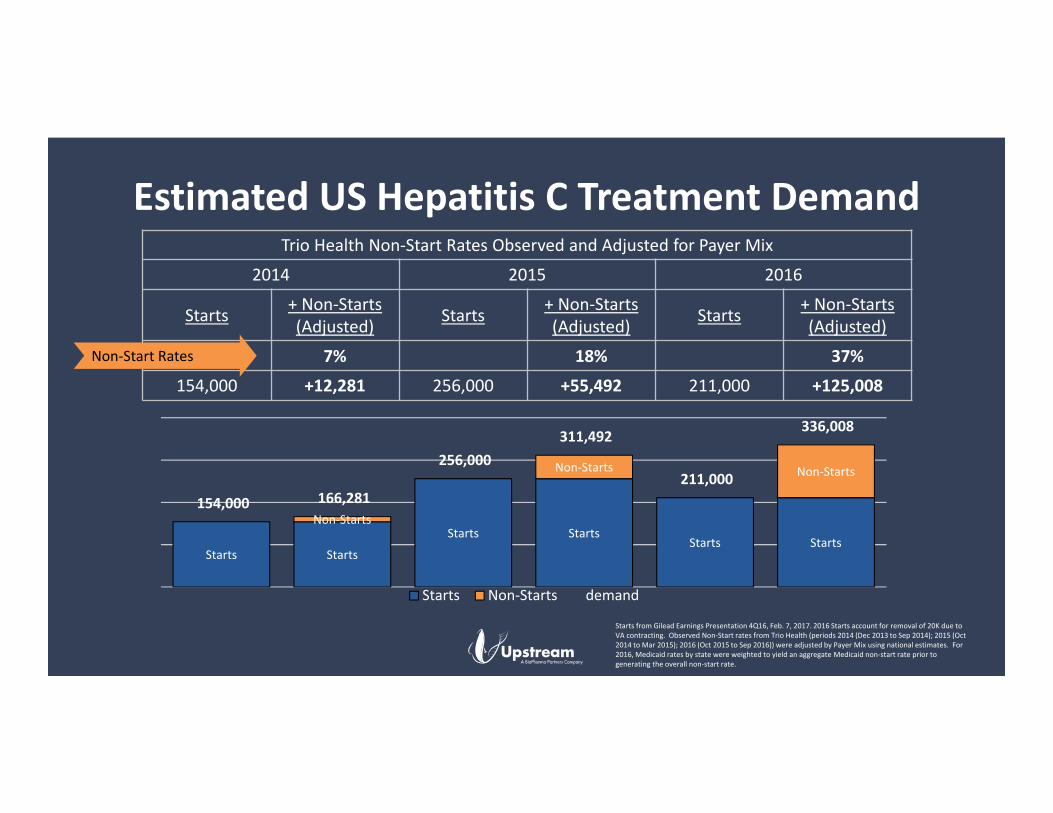
Estimated US Hepatitis C Treatment Demand
Starts Starts
Starts StartsStarts Starts
Non‐Starts
Non‐Starts Non‐Starts
154,000 166,281
256,000 311,492
211,000
336,008
Starts Non‐Starts demand
Starts from Gilead Earnings Presentation 4Q16, Feb. 7, 2017. 2016 Starts account for removal of 20K due to VA contracting. Observed Non‐Start rates from Trio Health (periods 2014 (Dec 2013 to Sep 2014); 2015 (Oct 2014 to Mar 2015); 2016 (Oct 2015 to Sep 2016)) were adjusted by Payer Mix using national estimates. For 2016, Medicaid rates by state were weighted to yield an aggregate Medicaid non‐start rate prior to generating the overall non‐start rate.
Trio Health Non‐Start Rates Observed and Adjusted for Payer Mix
2014 2015 2016
Starts + Non‐Starts (Adjusted) Starts + Non‐Starts
(Adjusted) Starts + Non‐Starts (Adjusted)
7% 18% 37%
154,000 +12,281 256,000 +55,492 211,000 +125,008
Non‐Start Rates
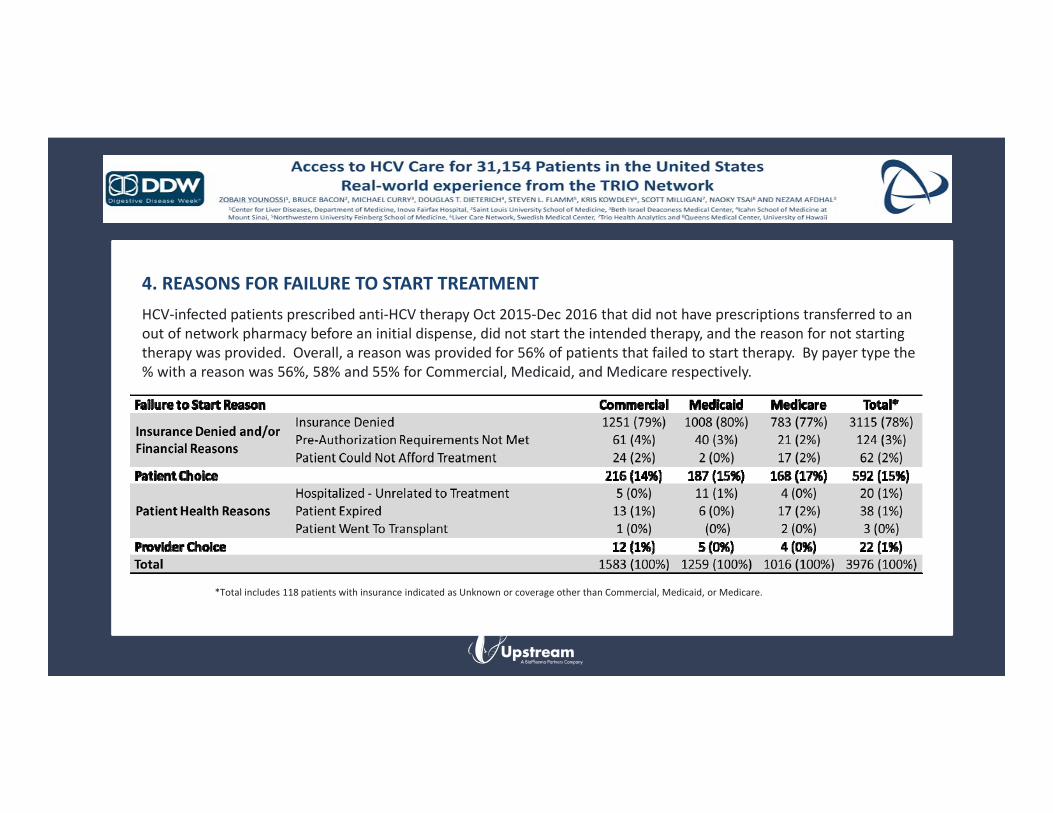
4. REASONS FOR FAILURE TO START TREATMENTHCV‐infected patients prescribed anti‐HCV therapy Oct 2015‐Dec 2016 that did not have prescriptions transferred to an out of network pharmacy before an initial dispense, did not start the intended therapy, and the reason for not starting therapy was provided. Overall, a reason was provided for 56% of patients that failed to start therapy. By payer type the % with a reason was 56%, 58% and 55% for Commercial, Medicaid, and Medicare respectively.
*Total includes 118 patients with insurance indicated as Unknown or coverage other than Commercial, Medicaid, or Medicare.
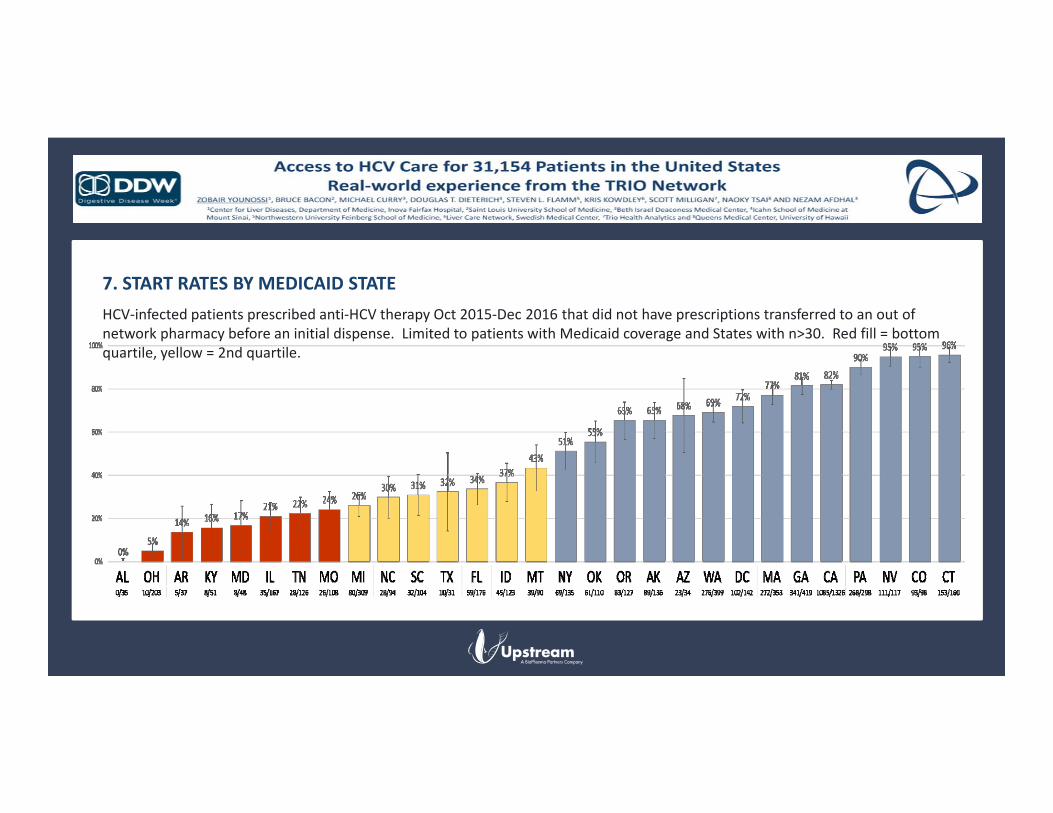
7. START RATES BY MEDICAID STATEHCV‐infected patients prescribed anti‐HCV therapy Oct 2015‐Dec 2016 that did not have prescriptions transferred to an out of network pharmacy before an initial dispense. Limited to patients with Medicaid coverage and States with n>30. Red fill = bottom quartile, yellow = 2nd quartile.
Standard Healthcare Network Ecosystem
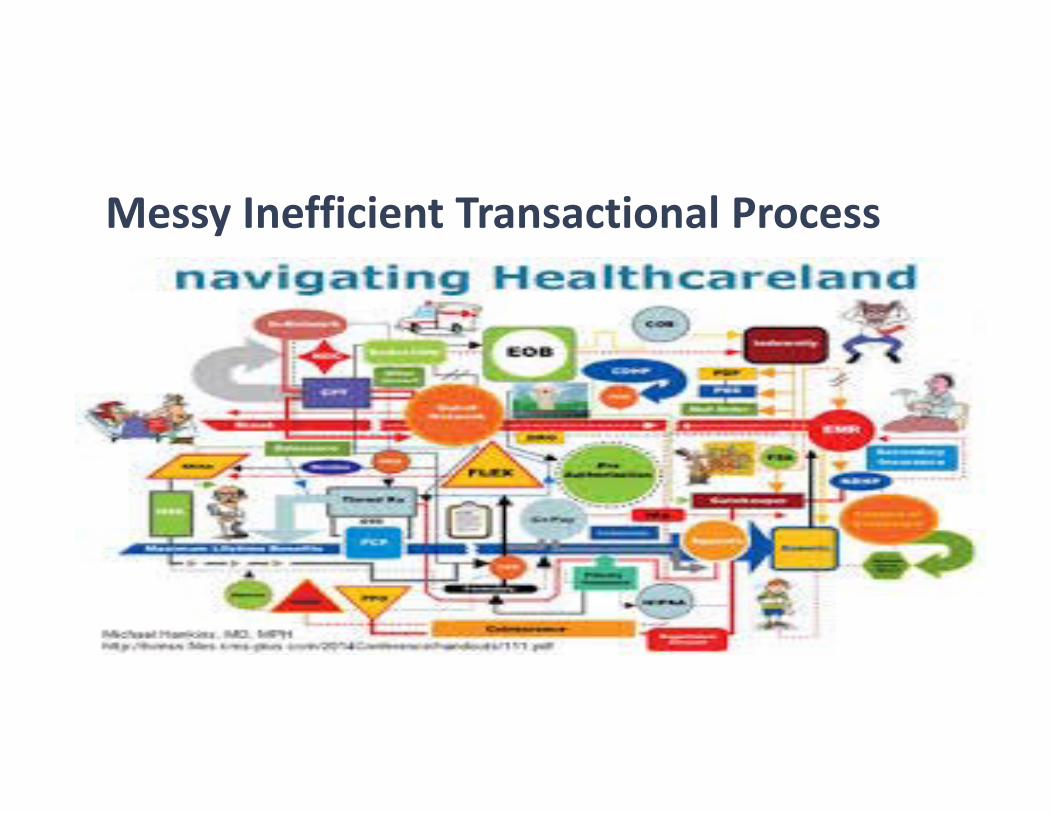
Messy Inefficient Transactional Process
Rational Transparency in Real Time
24
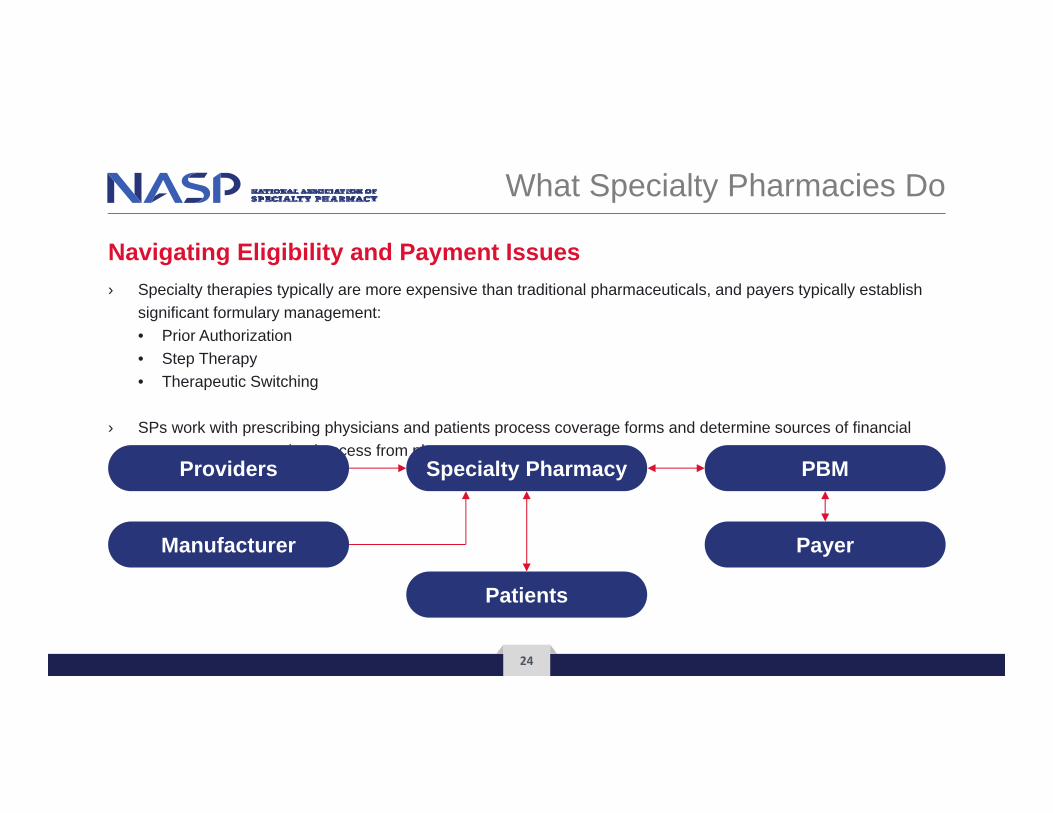
What Specialty Pharmacies Do
Navigating Eligibility and Payment Issues› Specialty therapies typically are more expensive than traditional pharmaceuticals, and payers typically establish
significant formulary management:• Prior Authorization• Step Therapy• Therapeutic Switching
› SPs work with prescribing physicians and patients process coverage forms and determine sources of financial support to ensure optimal access from plan sponsors.
Specialty Pharmacy
Patients
Providers PBM
Manufacturer Payer
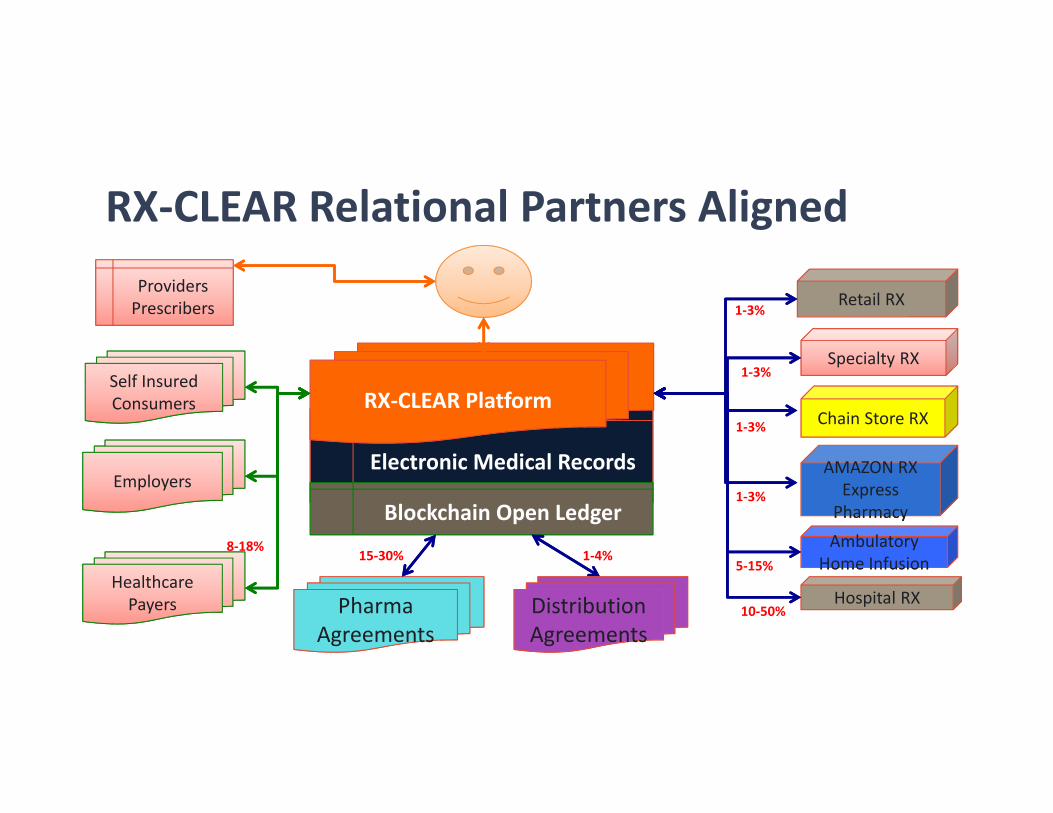
RX‐CLEAR Relational Partners Aligned
Specialty RX
Chain Store RX
Pharmacy
AMAZON RXExpress Pharmacy
Home InfusionAmbulatory
Home Infusion
Electronic Medical Records
Hospital RX
Retail RX
Blockchain Open Ledger
Providers Prescribers
AgreementsPharma
Agreements
ConsumersSelf Insured Consumers
Employers
Healthcare Payers
RX‐CLEAR Platform
AgreementsDistribution Agreements
1‐3%
1‐3%
1‐3%
1‐3%
10‐50%
5‐15%1‐4%15‐30%
8‐18%
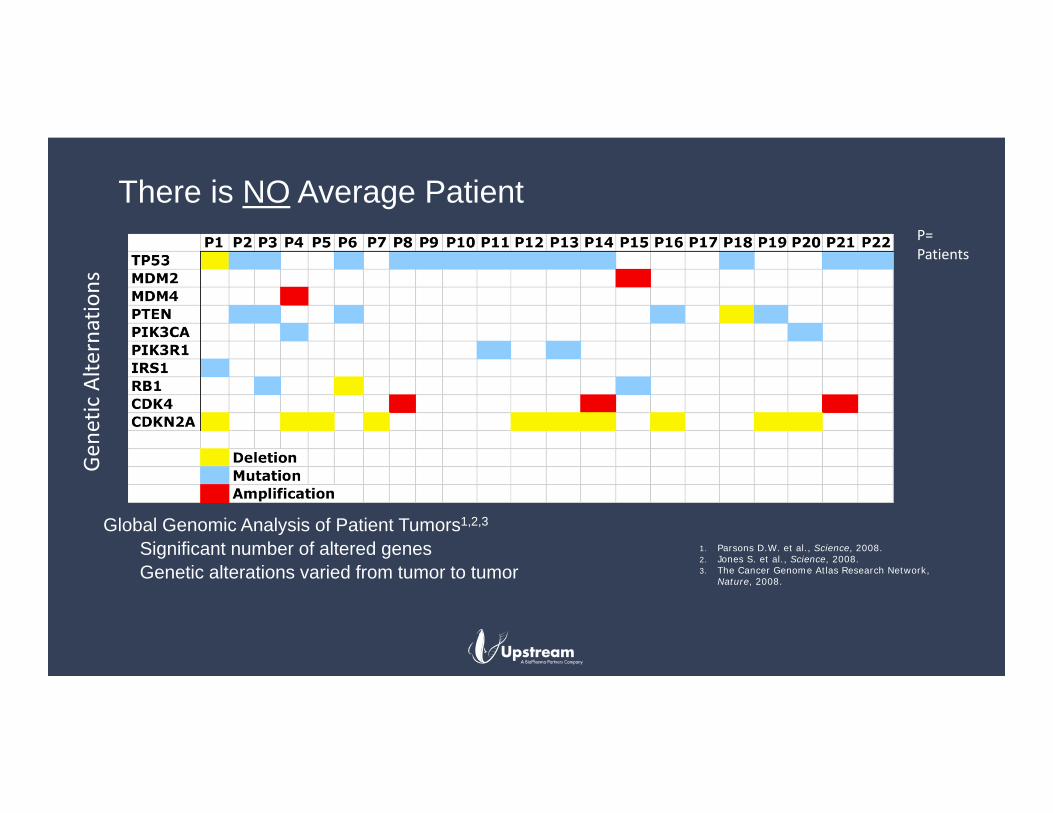
Global Genomic Analysis of Patient Tumors1,2,3
• Significant number of altered genes• Genetic alterations varied from tumor to tumor
1. Parsons D.W. et al., Science, 2008.2. Jones S. et al., Science, 2008.3. The Cancer Genome Atlas Research Network,
Nature, 2008.
There is NO Average Patient
Gen
etic Alte
rnations
P=Patients
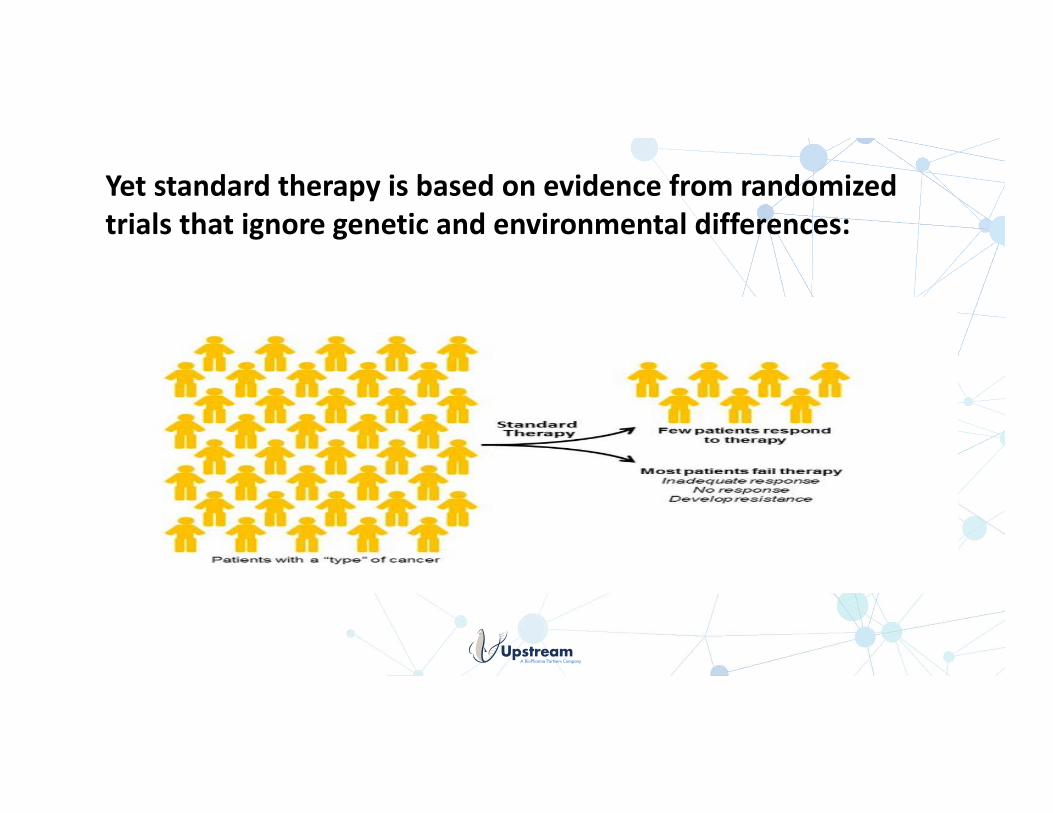
Yet standard therapy is based on evidence from randomized trials that ignore genetic and environmental differences:
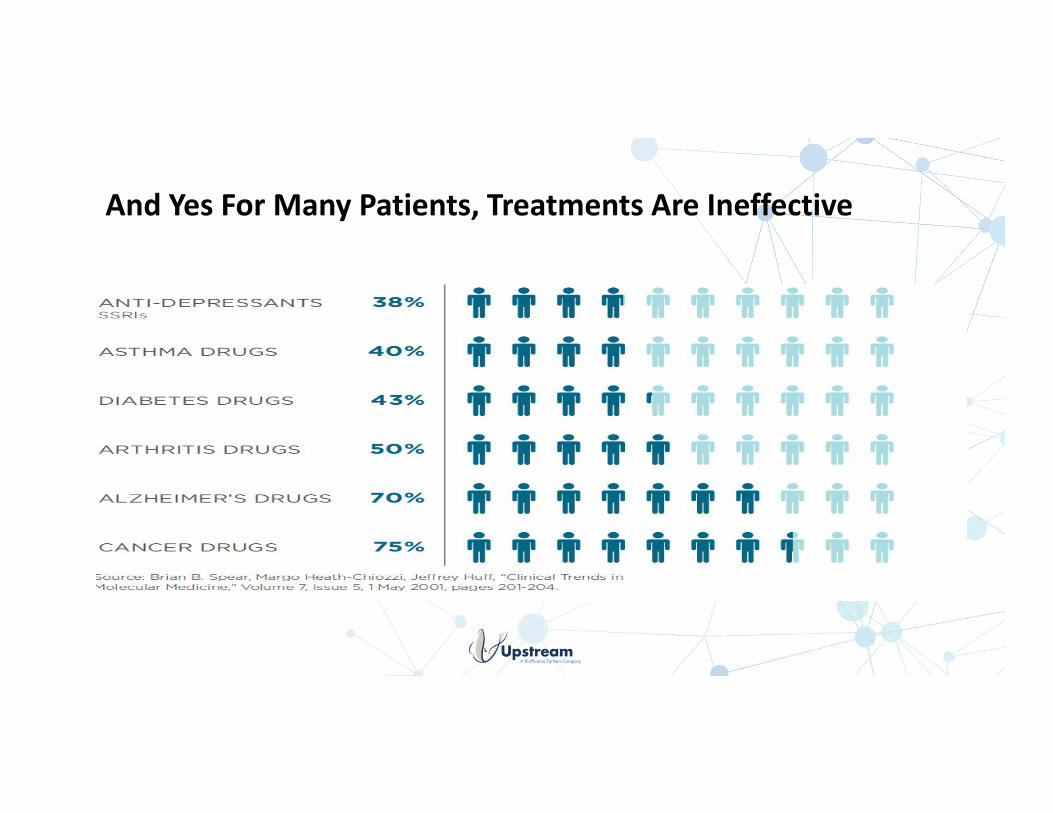
And Yes For Many Patients, Treatments Are Ineffective
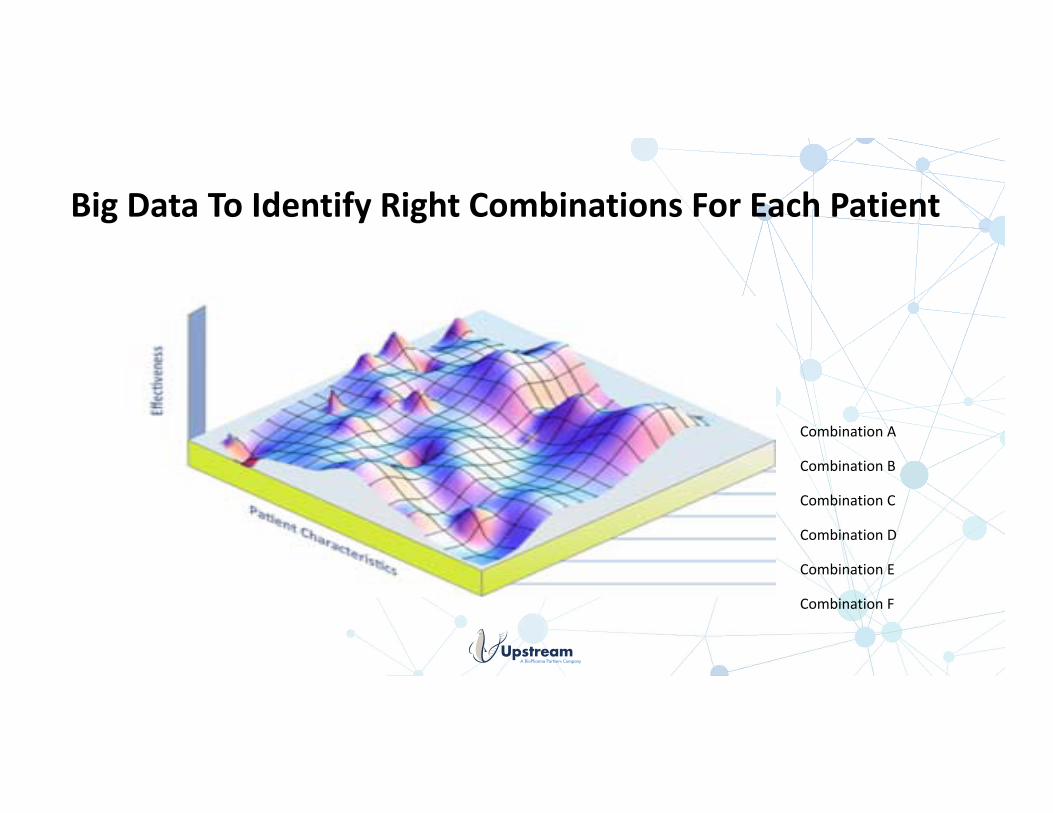
Big Data To Identify Right Combinations For Each Patient
Combination A
Combination B
Combination C
Combination D
Combination E
Combination F
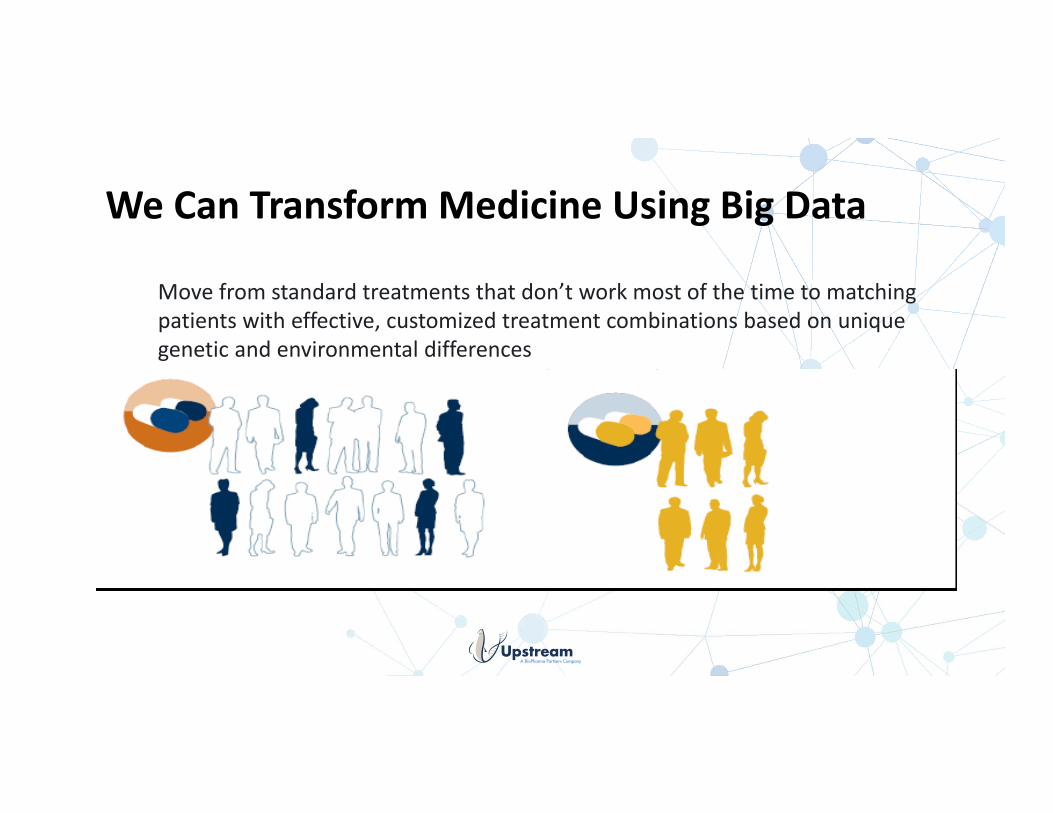
We Can Transform Medicine Using Big Data
Move from standard treatments that don’t work most of the time to matching patients with effective, customized treatment combinations based on unique genetic and environmental differences