Embed Size (px)
Citation preview

8 February 2013
Dear Shareholder, Re: Avalon Subscription Agreement Shareholder meeting to approve placement of 25 million shares for $3 million
On 28 November 2012, White Rock Minerals Ltd (‘White Rock’ or ‘the Company’) announced that a Subscription Agreement had been executed with Avalon Ventures Corporation (‘Avalon’) to raise $4.5M with the issue of 40M White Rock shares. The placement to Avalon comprises two tranches, with the first tranche of 15M shares issued in January at $0.10 per share raising $1.5M before costs. This represents a 14.6% shareholding in White Rock. Tranche two of the placement is for the issue of 25M shares at $0.12 per share, raising $3.0M. This comprises a further 16.7% of White Rock's diluted share capital (31% holding in aggregate) and provides for one Avalon-nominated Director to be appointed to the Board of White Rock following the completion of tranche two. As this aggregate holding by Avalon will be more than 20%, tranche two is conditional on White Rock shareholder approval. Accordingly, please find attached a Notice of Meeting with the supporting explanatory notes together with an Independent Expert’s Report, an Independent Geologist’s Report and valuation in order for you to make an informed decision on the placement to Avalon. The Independent Expert has determined that the placement to Avalon is not fair, but is reasonable. The Directors recommend that shareholders vote in favour of the proposed transaction, which will assist in executing the future plans of the Company. The General Meeting will be held on 15 March 2013. A Proxy Form is provided for your use if you are unable to attend the meeting.
White Rock is committed to unlocking the value that is emerging in our Mt Carrington gold-silver project in northern NSW. The recent 2012 scoping study identified the potential to develop a robust mining project with strong revenue, relatively low capital costs, a short payback period and conventional open pit mining at a low ore-waste strip ratio. Development of the project in a relatively short time frame is aided by the fact that the Mineral Resources are on granted mining leases with infrastructure including tailings storage, water and proximal power and road access.
The Company achieved a number of substantial goals on the project in 2012 which underpin our plans for 2013. The results of the scoping study were a pleasing outcome after working through 2011 to build the silver and gold Resource inventory, providing the basis to move to feasibility studies in 2013, along with an expanded exploration program designed to discover and define further shallow gold and silver resources. The goals we have set for 2013 are underpinned by the support we receive from both our long term shareholders and also our new major shareholder, Avalon. White Rock is pleased to welcome Avalon as a cornerstone investor and looks forward to a strong working relationship that will support the growth and development of the Mt Carrington gold-silver project through to a commercial operation. Yours sincerely
Geoffrey Lowe Managing Director

1
NOTICE OF MEETING Notice is given that a General Meeting of shareholders of White Rock Minerals Limited (the Company) will be held at the offices of Baker & McKenzie, Level 19, 181 William Street, Melbourne, at 10.00 am on Friday, 15 March 2013.
Resolution 1: Approval of Proposed Share Issue - Avalon (Tranche 2) To consider and, if thought fit, pass the following resolution as an ordinary resolution:
"That for the purposes of item 7 of section 611 of the Corporations Act and for all other purposes, the shareholders of the Company approve the issue of 25,000,000 fully paid ordinary shares in the capital of the Company to Avalon Ventures Corporation on the basis set out in the Explanatory Notes."
Resolution 2: Approval of Previous Share Issue - Avalon (Tranche 1) To consider and, if thought fit, pass the following resolution as an ordinary resolution:
"That for the purposes of ASX Listing Rule 7.4 and for all other purposes, the shareholders of the Company approve the previous issue of 15,000,000 fully paid ordinary shares in the capital of the Company on the basis set out in the Explanatory Notes."
Resolution 3: Approval of Proposed Share Issue - Titeline To consider and, if thought fit, pass the following resolution as an ordinary resolution:
"That for the purposes of ASX Listing Rule 7.1 and for all other purposes, the shareholders of the Company approve the proposed issue of 6,580,000 fully paid ordinary shares in the capital of the Company on the basis set out in the Explanatory Notes."
By order of the Board
Amber Rivamonte Company Secretary Dated: 8 February 2013

2
PROXY AND VOTING INSTRUCTIONS 1. A shareholder entitled to attend and vote at the meeting may appoint one or two proxies to attend and
vote on their behalf. Each proxy will have the right to vote on a poll and also to speak at the meeting.
2. A proxy need not be a member of the Company and a proxy can be either an individual or a body corporate.
3. The appointment of a proxy may specify the proportion or the number of votes that the proxy may
exercise. Where more than one proxy is appointed and the appointment does not specify the proportion or number of the shareholder’s votes each proxy may exercise, the votes will be divided equally among the proxies (i.e. where there are two proxies, each proxy may exercise half the votes).
4. If a proxy is not directed how to vote on an item of business, the proxy may vote or abstain from
voting on that resolution as they think fit. 5. If a proxy is instructed to abstain from voting on an item of business, they are directed not to vote on
the shareholder’s behalf on the poll and the shares that are the subject of the proxy appointment will not be counted in calculating the required majority.
6. Shareholders who return their proxy forms with a direction on how to vote but do not nominate the
identity of their proxy will be taken to have appointed the Chairman of the meeting as their proxy to vote on their behalf.
7. If a proxy form is returned but the nominated proxy does not attend the meeting, or does not vote on
the resolution, the Chairman of the meeting will act in place of the nominated proxy and vote in accordance with any instructions.
8. Proxy appointments in favour of the Chairman of the meeting, the secretary or any Director that do
not contain a direction on how to vote will be used where possible to support each of the resolutions proposed in this Notice of Meeting.
9. The proxy form (and the power of attorney or other authority, if any, under which the proxy form is
signed) or a copy which appears on its face to be an authentic copy of the proxy form (and the power of attorney or other authority) must be lodged at the share registry Security Transfer Registrars Pty Ltd, PO Box 535 Applecross WA 6153 or by facsimile +618 9315 2233 or by email to [email protected] not less than 48 hours before the time for holding the meeting, or adjourned meeting as the case may be, at which the individual named in the proxy form proposes to vote.
10. The proxy form must be signed by the member or his/her attorney duly authorised in writing or, if the
member is a corporation, in a manner permitted by the Corporations Act 2001 (Cth). A proxy given by a foreign corporation must be executed in accordance with the laws of that corporation’s place of incorporation.
A proxy form accompanies this Notice of Meeting.
Corporate Representatives Any corporation that is a shareholder of the Company may authorise (by a form of execution authorised by the laws of that corporation’s place of incorporation, or in any other manner satisfactory to the Chairman) a natural person to act as its representative at any general meeting. Voting Entitlement The Company has determined that for the purposes of the meeting, shares will be taken to be held by the persons who are registered as holding the shares at 7.00 pm on 13 March 2013. Accordingly, transfers registered after that time will be disregarded in determining entitlements to attend and vote at the meeting.

3
Explanatory Notes
These Explanatory Notes should be read in conjunction with the Notice of Meeting.
Resolution 1: Approval of Share Issue - Avalon (Tranche 2) The Company is seeking shareholder approval to issue 25,000,000 fully paid ordinary shares (Tranche 2 Shares) at 12 cents per share to Avalon Ventures Corporation (Avalon) to raise $3 million under Tranche 2 of the Subscription Agreement (Subscription Agreement) announced to ASX on 28 November 2012 (Tranche 2 Placement). Corporations Act Requirements Section 606 of the Corporations Act relevantly provides that, subject to limited specified exceptions, a person must not acquire a relevant interest in issued voting shares in a company, if as a result of the acquisition any person's voting power in the company would increase from less than 20% to more than 20%. In the absence of an applicable exception, the acquisition of relevant interests resulting in the increase in Avalon's voting power on account of the proposed issue of Tranche 2 shares would breach section 606(1) of the Corporations Act. Section 611 item 7 of the Corporations Act provides an exception to this prohibition, and allows a party to acquire a relevant interest if the proposed acquisition is approved in advance by a resolution passed at a general meeting. Accordingly, Resolution 1 seeks Shareholder approval for the purposes of section 611 item 7 of the Corporations Act for the Tranche 2 Shares to be issued to Avalon pursuant to the Subscription Agreement, the effect of which is that Avalon's voting power in the Company will be increased from 14.6% (15,000,000 shares) to 31.3% (40,000,000 shares).
The following information is provided in compliance with section 611 item 7 and ASIC guidance. The information below in relation to Avalon has been provided to the Company by Avalon, which takes responsibility for that information rather than the Company. (a) The identity of the person proposing to make the acquisition and their associates The Tranche 2 Shares are proposed to be acquired by Avalon. Avalon is principally an investment holding company with a focus on gold mining investments. Avalon currently holds a 30% shareholding in Mornington Offshore Inc (which itself owns mining interests through its wholly owned subsidiary Emas Mali S.A, a gold exploration company incorporated in the Republic of Mali).
The shareholders of Avalon are Tan Boon Kiat, who owns 90% of Avalon and is the sole director of the company, and Ismail Baba Cisse who owns 10% of Avalon. Mr Tan is a Malaysian citizen, who currently runs a company called Citral (M) Sdn Bhd in Kuala Lumpur. Mr Cisse is a former advisor to the President of Mali in relation to Malaysian investments and is the current director general of Emas Mali S.A, a gold exploration company incorporated in the Republic of Mali. Avalon does not have any associates in relation to the Tranche 2 Placement. (b) The maximum extent of the increase in Avalon's voting power in the Company that would result from the acquisition Avalon currently holds 15,000,000 shares in the Company which represents a 14.6% voting power in the Company. If Shareholders approve Resolution 1, following completion of the Tranche 2 placement, Avalon will have a 31.3% voting power in the Company after the issue of the Tranche 2 Shares (40,000,000 shares in total), being an increase of a 16.7% voting power from its current holding.
4
(c) The voting power that person will have as a result of the acquisition If the Tranche 2 Shares are issued to Avalon, it will have voting power of 31.3%. (d) The maximum extent of the increase in voting power of each of Avalon's associates that would result from the acquisition. 16.7% (25,000,000 shares) (e) The voting power that each of Avalon's associates would have as a result of the acquisition 31.3% (40,000,000 shares) (f) Reasons for proposed acquisition The purpose of the Tranche 2 Placement is to enable the Company to raise $3 million. This placement, together with the Tranche 1 Placement to Avalon which was completed in January 2013, is designed to assist the Company to develop the Mount Carrington gold-silver project. The funds are intended to be used by the Company to conduct pre-feasibility studies at Mount Carrington in 2013, resources and exploration drilling focused on defining new gold and silver resources at the Red Rock and Mozart prospects and for general working capital. (g) When the proposed acquisition is to occur Pursuant to the Subscription Agreement, the Tranche 2 Shares are expected be issued 5 business days after the satisfaction of all of the Tranche 2 Conditions Precedent. Each of the Conditions Precedent to Tranche 2 (other than shareholder approval as contemplated by Resolution 1) have been satisfied. (h) The material terms of the proposed acquisition The material terms of the proposed acquisition of Tranche 2 Shares are set out in the Subscription Agreement dated 28 November 2012. A summary of the key terms of the Subscription Agreement as they relate to Tranche 2 are set out below. This summary does not purport to be exhaustive or constitute a definitive statement of the rights and liabilities of each the Company and Avalon under the Subscription Agreement. The full terms of the Subscription Agreement were annexed to the ASX announcement issued by the Company on 28 November 2012 and is available from the ASX website. Conditions Precedent: Completion of Tranche 2 is conditional on Shareholder approval (as contemplated by this notice of meeting). Each of the other conditions relating to Tranche 2, being FIRB Approval and NSW Ministerial consent approval, have been satisfied. Avalon Board Nominee: The Company must take steps to appoint a proposed director nominated by Avalon to the board of the Company following Tranche 2 completion (refer below). Issue Price: The issue price of the Tranche 2 Shares is $0.12 per share. Capital Structure: Until the Tranche 2 Completion Date, the Company will not, except with the prior written consent of Avalon, issue or agree to issue any shares or other securities (with limited exceptions including to a third party under an agreement involving the provision of drilling services as contemplated by the proposed share issue in Resolution 3) or implement a share consolidation or subdivision, a capital reduction or a share buy-back or any other capital reconstruction. Warranties: The Company and Avalon have each given certain customary mutual warranties to each other including in relation to their authority and legal capacity. The Company has provided customary warranties to Avalon.

5
Termination: The Subscription Agreement may be terminated by either party by written notice to the other party, if the other party is in material breach of any clause of the Subscription Agreement and that breach is not remedied, or by agreement in writing between the parties. Cost reimbursement: If Tranche 2 completion does not occur for any reason (other than valid termination of the Subscription Agreement by Avalon), Avalon must reimburse the Company for any costs and expenses incurred by the Company in connection with obtaining an independent expert report (and any ancillary geological, technical or valuation reports) to be provided to Shareholders for the purposes of this meeting. (i) Details of the terms of any other relevant agreement between Avalon and the Company (or any of their associates) that is conditional on (or directly or indirectly depends on) Shareholders’ approval of the proposed acquisition There are such no agreements or proposed agreements. (j) Statement of Avalon's intentions regarding the future of the Company if Shareholders approve the acquisition Avalon has advised the Company that it currently intends that the Company's operations will continue unchanged in their current form and in a manner consistent with the Company's existing strategy and operation plan to progress the feasibility study on the Mount Carrington gold-silver project. Avalon has advised the Company that its current intentions are: • To be a strategic shareholder in the Company and to be a long-term shareholder of the
Company.
• Not to change the business of the Company, nor transfer assets between Avalon and the Company or their associates, nor redeploy fixed assets of the Company nor change the Company’s existing policies in relation to financial matters or dividend distribution.
• Not to change the employment of any present employee of the Company. (k) Does any Director of the Company have any interest in the acquisition or relevant agreement conditional upon the approval The Directors do not have an interest in the outcome of Resolution 1 other than in their capacity as holders of shares and options in the Company. (l) Details of the person intended to become a director if members approve the acquisition of shares Avalon propose to nominate Peter Lester, B.E (Mining), MAusIMM, MAICD. Mr Lester has over 35 years' experience in the mining industry, and has held senior executive positions with North Ltd, Newcrest Mining Limited, Oxiana Limited and Citadel Resource Group Limited. Mr Lester's experience covers operations, project and business development and general corporate activities. Mr Lester is a non-executive director of Chesser Resources Limited, Toro Energy Ltd, Castlemaine Goldfields Ltd, Accessio Resources Pty Ltd and Nord Gold NV. (m) Independent Expert's Report ASIC requires that the shareholders who are being asked to consider a proposal to pass a resolution under section 611 item 7 of the Corporations Act be provided with an analysis of whether the proposal is fair and reasonable when considered from the perspective of the shareholders of the Company other than Avalon and its associates. Directors may satisfy their obligation to provide an analysis and a valuation by those Directors not associated with the proposal commissioning an Independent Expert's Report. The Directors have commissioned RSM Bird Cameron Corporate Pty Ltd to prepare an Independent Expert's Report which assesses whether the proposed issue of the Tranche 2 Shares to Avalon is fair and reasonable

6
to Shareholders (which includes a Valuation Report and Independent Geologist Report prepared by Goldner & Associates and associated Independent Tenement Report). The Independent Expert Report is set out in Annexure A. The Independent Expert's Report has concluded that the issue of the Tranche 2 Shares is not fair but reasonable to Shareholders not associated with Avalon. Neither the Company nor the Directors are aware of any additional information not set out in these Explanatory Notes that would be relevant to Shareholders in deciding how to vote on this Resolution 1. (n) Voting Restriction The Company will disregard any votes cast on this resolution by Avalon or any of its associates. However, the Company need not disregard a vote if it is cast: • as proxy for a person who is entitled to vote, in accordance with the directions on the proxy
form; or
• by the person chairing the meeting as proxy for a person who is entitled to vote, in accordance with a direction on the form to vote as the proxy decides.
(o) Recommendation The Directors unanimously recommend that Shareholders vote in favour of this resolution. Resolution 2: Approval of Previous Share Issue - Avalon (Tranche 1) ASX Listing Rule 7.1 restricts the number of securities which a listed entity may issue in any 12 month period without the approval of shareholders of 15% of the number of securities on issue at the start of the period subject to certain adjustments and permitted exceptions. This resolution seeks shareholder approval to the previous issue of securities in the Company for the purposes of Listing Rule 7.4. The purpose of seeking shareholder approval of the issue of securities in this resolution is to "freshen up" the Company's placement capacity and ensure that the previous issue of shares as described below does not reduce the Company's placement capacity under the Listing Rules. As announced to ASX on 11 January 2013, the Company issued 15,000,000 fully paid ordinary shares in the Company to Avalon at a price of 10 cents each to raise $1.5 million. The Company proposes to use the funds for exploration activities including resource and exploration drilling, advancement of feasibility study activities and general working capital. Recommendation The Directors unanimously recommend that Shareholders vote in favour of this resolution. Voting Restriction The Company will disregard any votes cast on this resolution by Avalon or any of its associates. However, the Company need not disregard a vote if it is cast: • as proxy for a person who is entitled to vote, in accordance with the directions on the proxy
form; or
• by the person chairing the meeting as proxy for a person who is entitled to vote, in accordance with a direction on the form to vote as the proxy decides.

7
Resolution 3: Approval of Proposed Share Issue - Titeline This resolution seeks shareholder approval of the proposed issue of shares for the purposes of Listing Rule 7.1. The purpose of seeking shareholder approval of the issue of shares in this resolution is to ensure that the proposed issue of shares as described below does not reduce the Company's future placement capacity under the Listing Rules. As announced to ASX on 11 January 2013, the Company has entered into a drilling agreement with Titeline Drilling Pty Ltd (Titeline) under which Titleline has agreed to provide certain drilling services to the Company in consideration for the issue of 6,580,000 fully paid ordinary shares at 10 cents per share and total cash payments of $112,000. The purpose of the drilling agreement is to accelerate resource expansion, project development and exploration programs on the Company's 100% owned Mt Carrington gold-silver project. The shares under the drilling agreement are expected to be issued in or around late March 2013, and in any event within 3 months from the date of the meeting. Recommendation The Directors unanimously recommend that Shareholders vote in favour of this resolution. Voting Restriction The Company will disregard any votes cast on this resolution by Titeline and any person who might obtain a benefit, except a benefit solely in the capacity of a holder of ordinary securities, if this resolution is passed, or any of their associates. However, the Company need not disregard a vote if it is cast: • as proxy for a person who is entitled to vote, in accordance with the directions on the proxy
form; or
• by the person chairing the meeting as proxy for a person who is entitled to vote, in accordance with a direction on the form to vote as the proxy decides.

SECTION B: Voting Directions to your Proxy
SECTION A: Appointment of Proxy
SECTION C: Please Sign Below
REGISTERED OFFICE:24 SKIPTON STREETBALLARAT VIC 3350
SHARE REGISTRY:Security Transfer Registrars Pty Ltd
All Correspondence to:PO BOX 535,
APPLECROSS WA 6953 AUSTRALIA770 Canning Highway,
APPLECROSS WA 6153 AUSTRALIAT: +61 8 9315 2333 F: +61 8 9315 2233
E: [email protected]: www.securitytransfer.com.au
WHITE ROCK MINERALS LTDABN: 64 142 809 970
PROXY FORMTHIS DOCUMENT IS IMPORTANT. IF YOU ARE IN DOUBT AS TO HOW TO DEAL WITH IT, PLEASE CONTACT YOUR STOCK BROKER OR LICENSED PROFESSIONAL ADVISOR.
Holder Number:
I/We, the above named, being registered holders of the Company and entitled to attend and vote hereby appoint:
or failing the person named, or if no person is named, the Chairperson of the Meeting, as my/our Proxy to act generally at the meeting on my/our behalf and to vote in
accordance with the following directions (or if no directions have been given, as the Proxy sees fit) at the General Meeting of the Company to be held at 10.00am AEDSTon Friday 15 March 2013 at the offices of Baker & McKenzie, Level 19, 181 William Street, Melbourne VIC and at any adjournment of that meeting.
Code: WRM
OR
The name of the person you are appointing(if this person is someone other than the Chairperson of the meeting).
The meeting Chairperson (mark with an "X")
If no directions are given my proxy may vote as the proxy thinks fit or may abstain.* If you mark the Abstain box for a particular item, you are directing your Proxy not to vote on your behalf on a show of hands or on a poll and your votes will not be counted in computing the required majority on a poll.
WRM 1
Proxies must be received by Security Transfer Registrars Pty Ltd no later than 10.00AM AEDST on WEDNESDAY 13 MARCH 2013.
ONLINE PROXY SERVICEYou can lodge your proxy online at www.securitytransfer.com.au
1. Log into the Investor Centre using your holding details.2. Click on "Proxy Voting" and provide your Online Proxy ID to access the voting area.
Online Proxy ID:
This section must be signed in accordance with the instructions overleaf to enable your directions to be implemented.
Please mark "X" in the box to indicate your voting directions to your Proxy.
Resolution
1. Approval of Proposed Share Issue - Avalon (Tranche 2)
2. Approval of Previous Share Issue - Avalon (Tranche 1)
3. Approval of Proposed Share Issue - Titeline
For Against Abstain*
Individual or Security Holder Security Holder 2
Sole Director and Sole Company Secretary Director
Security Holder 3
Director / Company Secretary
9999666622226666111188881111999966668888

PRIVACY STATEMENTPersonal information is collected on this form by Security Transfer Registrars Pty Ltd as the registrar for securities issuers for the purpose of maintaining registers of securityholders,facilitating distribution payments and other corporate actions and communications. Your personal details may be disclosed to related bodies corporate, to external service providerssuch as mail and print providers, or as otherwise required or permitted by law. If you would like details of your personal information held by Security Transfer Registrars Pty Ltd or youwould like to correct information that is inaccurate please contact them on the address on this form.
TELEPHONE NUMBER
( )
NAME
My/Our contact details in case of enquiries are:
5. Signing InstructionsIndividual: where the holding is in one name, the Shareholder must sign.
Joint Holding: where the holding is in more than one name, all of theShareholders must sign.
Power of Attorney: to sign under Power of Attorney you must have alreadylodged this document with the Company's share registry. If you have not
previously lodged this document for notation, please attach a certifiedphotocopy of the Power of Attorney to this form when you return it.
Companies: where the Company has a Sole Director who is also the SoleCompany Secretary, this form must be signed by that person. If the Company
(pursuant to section 204A of the Corporations Act 2001) does not have aCompany Secretary, a Sole Director may sign alone. Otherwise this form mustbe signed by a Director jointly with either another Director or Company
Secretary. Please indicate the office held in the appropriate place.
If a representative of the corporation is to attend the meeting the appropriate"Certificate of Appointment of Corporate Representative" should be lodged
with the Company before the meeting or at the registration desk on the day ofthe meeting. A form of the certificate may be obtained from the Company's
share registry.
6. Lodgement of ProxyProxy forms (and any Power of Attorney under which it is signed) must bereceived by Security Transfer Registrars Pty Ltd no later than 10.00am AEDSTon Wednesday 13 March 2013, being 48 hours before the time for holding the
meeting. Any Proxy form received after that time will not be valid for thescheduled meeting.
Security Transfer Registrars Pty Ltd
PO BOX 535Applecross, Western Australia 6953
Street Address:Alexandrea House, Suite 1770 Canning HighwayApplecross, Western Australia 6153
Telephone +61 8 9315 2333
Facsimile +61 8 9315 2233
Email [email protected]
NOTES 1. Name and Address
This is the name and address on the Share Register of White Rock MineralsLtd. If this information is incorrect, please make corrections on this form.
Shareholders sponsored by a broker should advise their broker of anychanges. Please note that you cannot change ownership of your shares usingthis form.
2. Appointment of a ProxyIf you wish to appoint the Chairperson of the Meeting as your Proxy please
mark "X" in the box in Section A. Please also refer to Section B of this proxyform and ensure you mark the box in that section if you wish to appoint the
Chairperson as your Proxy.
If the person you wish to appoint as your Proxy is someone other than the
Chairperson of the Meeting please write the name of that person in Section A.If you leave this section blank, or your named Proxy does not attend the
meeting, the Chairperson of the Meeting will be your Proxy. A Proxy need notbe a Shareholder of White Rock Minerals Ltd.
3. Directing your Proxy how to voteTo direct the Proxy how to vote place an "X" in the appropriate box againsteach item in Section B. Where more than one Proxy is to be appointed and
the proxies are to vote differently, then two separate forms must be used toindicate voting intentions.
4. Appointment of a Second ProxyYou are entitled to appoint up to two (2) persons as proxies to attend the
meeting and vote on a poll. If you wish to appoint a second Proxy, an additional Proxy form may be obtained by telephoning the Company's share registry +61 8 9315 2333 or you may photocopy this form.
To appoint a second Proxy you must:
(a) On each of the Proxy forms, state the percentage of your voting rights ornumber of securities applicable to that form. If the appointments do not
specify the percentage or number of votes that each Proxy may exercise,each Proxy may exercise half of your votes; and
(b) Return both forms in the same envelope.
0000777788888888111188881111999966668888

White Rock Minerals Limited
Financial Services Guide and
Independent Expert’s Report 8 February 2013
We have concluded that the Proposed Transaction is NOT FAIR but IS REASONABLE to shareholders not associated with the Proposed Transaction

RSM Bird Cameron Corporate Pty Ltd Level 8 Rialto South Tower 525 Collins Street Melbourne VIC 3000 PO Box 248 Collins Street West VIC 8007 T +61 3 9286 1800 F +61 3 9286 1999 www.rsmi.com.au
RSM Bird Cameron Corporate Pty Ltd Level 8 Rialto South Tower 525 Collins Street Melbourne VIC 3000 PO Box 248 Collins Street West VIC 8007 T +61 3 9286 1800 F +61 3 9286 1999 www.rsmi.com.au
Financial Services Guide
RSM Bird Cameron Corporate Pty Ltd ABN 82 050 508 024 (“RSM Bird Cameron Corporate Pty Ltd” or “we” or “us” or “ours”
as appropriate) has been engaged to issue general financial product advice in the form of a report to be provided to you.
In the above circumstances we are required to issue to you, as a retail client, a Financial Services Guide (“FSG”). This FSG is
designed to help retail clients make a decision as to their use of the general financial product advice and to ensure that we
comply with our obligations as financial services licensees.
This FSG includes information about:
who we are and how we can be contacted;
the services we are authorised to provide under our Australian Financial Services Licence, Licence No 255847;
remuneration that we and/or our staff and any associates receive in connection with the general financial product advice;
any relevant associations or relationships we have; and
our complaints handling procedures and how you may access them.
Financial services we are licensed to provide
We hold an Australian Financial Services Licence, which authorises us to provide financial product advice in relation to:
deposit and payment products limited to:
(a) basic deposit products;
(b) deposit products other than basic deposit products.
interests in managed investments schemes (excluding investor directed portfolio services); and
securities (such as shares and debentures).
We provide financial product advice by virtue of an engagement to issue a report in connection with a financial product of
another person. Our report will include a description of the circumstances of our engagement and identify the person who has
engaged us. You will not have engaged us directly but will be provided with a copy of the report as a retail client because of
your connection to the matters in respect of which we have been engaged to report.
Any report we provide is provided on our own behalf as a financial services licensee authorised to provide the financial
product advice contained in the report.

General Financial Product Advice
In our report we provide general financial product advice, not personal financial product advice, because it has been prepared
without taking into account your personal objectives, financial situation or needs.
You should consider the appropriateness of this general advice having regard to your own objectives, financial situation and
needs before you act on the advice. Where the advice relates to the acquisition or possible acquisition of a financial product,
you should also obtain a product disclosure statement relating to the product and consider that statement before making any
decision about whether to acquire the product.
Benefits that we may receive
We charge fees for providing reports. These fees will be agreed with, and paid by, the person who engages us to provide the
report. Fees will be agreed on either a fixed fee or time cost basis.
Except for the fees referred to above, neither RSM Bird Cameron Corporate Pty Ltd, nor any of its directors, employees or
related entities, receive any pecuniary benefit or other benefit, directly or indirectly, for or in connection with the provision of
the report.
Remuneration or other benefits received by our employees
All our employees receive a salary.
Referrals
We do not pay commissions or provide any other benefits to any person for referring customers to us in connection with the
reports that we are licensed to provide.
Associations and relationships
RSM Bird Cameron Corporate Pty Ltd is beneficially owned by the partners of RSM Bird Cameron, a large national firm of
chartered accountants and business advisers. Our directors are partners of RSM Bird Cameron Partners.
From time to time, RSM Bird Cameron Corporate Pty Ltd, RSM Bird Cameron Partners, RSM Bird Cameron and / or RSM Bird
Cameron related entities may provide professional services, including audit, tax and financial advisory services, to financial
product issuers in the ordinary course of its business.
Complaints Resolution
Internal complaints resolution process
As the holder of an Australian Financial Services Licence, we are required to have a system for handling complaints from
persons to whom we provide financial product advice. All complaints must be in writing, addressed to The Complaints Officer,
RSM Bird Cameron Corporate Pty Ltd, P O Box R1253, Perth, WA, 6844.
When we receive a written complaint we will record the complaint, acknowledge receipt of the complaint within 15 days and
investigate the issues raised. As soon as practical, and not more than 45 days after receiving the written complaint, we will
advise the complainant in writing of our determination.
Referral to External Dispute Resolution Scheme
A complainant not satisfied with the outcome of the above process, or our determination, has the right to refer the matter to
the Financial Ombudsman Service (“FOS”). FOS is an independent company that has been established to provide free advice
and assistance to consumers to help in resolving complaints relating to the financial services industry.

Further details about FOS are available at the FOS website or by contacting them directly via the details set out below.
Financial Ombudsman Service
GPO Box 3
Melbourne VIC 3001
Toll Free: 1300 78 08 08
Facsimile: (03) 9613 6399
Email: [email protected]
Contact Details
You may contact us using the details set out at the top of our letterhead on page 1 of this FSG.

Independent Expert’s Report
TABLE OF CONTENTS Page
1. Introduction ................................................................................................................................................ 6
2. Summary and Conclusion .......................................................................................................................... 8
3. Summary of the Proposed Transaction ...................................................................................................10
4. Purpose of this Report .............................................................................................................................11
5. Profile of WRM .........................................................................................................................................13
6. Valuation Approach ..................................................................................................................................18
7. Valuation of WRM ....................................................................................................................................21
8. Is The Proposed Transaction Fair? ..........................................................................................................27
9. Is The Proposed Transaction Reasonable?.............................................................................................28
Appendix 1 – Declarations and Disclaimers .....................................................................................................31
Appendix 2 – Sources of Information ...............................................................................................................33
Appendix 3 – Glossary of Terms and Abbreviations ........................................................................................34
Appendix 4 – Profile of the Australian Silver Industry ......................................................................................37
Appendix 5 – Profile of the Australian Gold Industry ........................................................................................39
Appendix 6 – Independent Technical Review and Valuation of the Mt Carrington and Guyra Projects of White Rock Minerals Limited ......................................................................................................................................41

6
Direct Line: (03) 9286 1867 Email: [email protected]
8 February 2013
The Directors White Rock Minerals Limited 24 Skipton Street Ballarat VIC 3350 Dear Sirs
Independent Expert’s Report 1. Introduction
1.1. This Independent Expert‟s Report (the “Report” or “IER”) has been prepared to accompany the Notice of
Meeting and Explanatory Statement for Shareholders for the General Meeting of White Rock Minerals Limited (“WRM” or “the Company”) to be held in March 2013 at which Shareholder approval will be sought for Resolution 1 (“the Proposed Transaction”), as set out below:
Resolution 1: Approval of Proposed Share Issue – Avalon (Tranche 2)
To consider, and if thought fit, to pass the following resolution as an ordinary resolution:
“That for the purposes of item 7 section 611 of the Corporations Act and for all other purposes, the
shareholders of the Company approve the issue of 25,000,000 fully paid ordinary shares in the capital of
the Company to Avalon Ventures Corporation on the basis set out in the Explanatory Notes.”
1.2. On 28 November 2012, the Company entered into a share subscription agreement (“Share Subscription
Agreement”) with Avalon Ventures Corporation (“Avalon”) to issue 40 million ordinary shares to Avalon to raise $4.5 million in two tranches as follows:
Tranche 1 – $1.5 million comprising 15 million shares at 10 cents each. Tranche 1 shares were issued on 11 January 2013. The issue of Tranche 1 shares resulted in Avalon owning a 14.6% interest in WRM; and
Tranche 2 – $3 million comprising 25 million shares at 12 cents each, comprising a further 16.7% interest in the Company and will increase Avalon‟s interest in WRM to 31.4%.
1.3. Avalon is a Singapore-based special purpose company which also holds investments in mining interests in Mali. Neither Avalon nor its associates held any shares or options in WRM prior to the issue of the Tranche 1 shares.
1.4. The issue of a total of 25 million shares under Tranche 2 (the “Share Placement”) proposed in Resolution
1 will result in Avalon owning greater than 20% of the issued share capital of WRM, which under Section 611 Item 7, requires the approval of Shareholders in a general meeting.

7
1.5. The Directors of WRM have requested that RSM Bird Cameron Corporate Pty Ltd (“RSM”), being independent and qualified for the purpose, express an opinion as to whether Resolution 1 is fair and reasonable to Shareholders not associated with Avalon (“the Non-Associated Shareholders”).
1.6. The ultimate decision whether to approve the Proposed Transaction should be based on each Non- Associated Shareholder‟s assessment of their circumstances, including their risk profile, liquidity
preference, tax position and expectations as to value and future market conditions. If in doubt about the Proposed Transaction, or matters dealt with in this Report, the Non-Associated Shareholders should seek independent professional advice.

8
Low High Preferred$ $ $
Value per WRM share 0.188 0.450 0.257
Value of consideration for a WRM share 0.120 0.120 0.120
Source: RSM analysis
2. Summary and Conclusion
2.1. In our opinion, and for the reasons set out in sections 8 and 9 of this Report, the Proposed Transaction is Not Fair but Reasonable for the Non-Associated Shareholders of WRM.
Fairness
2.2. In order to assess the fairness of the Proposed Transaction, we have valued a share in WRM prior to the Proposed Transaction and compared it to the consideration of $0.12 per share offered for the Share Placement. Our assessed values are summarised in the table below.
Table 1: Valuation Summary
2.3. As the preferred value of a WRM share is greater than the consideration offered, we consider the Proposed Transaction to be not fair to the Shareholders.
Reasonableness
2.4. RG 111 establishes that an offer is reasonable if it is fair. If might also be reasonable if, despite not being fair, there are sufficient reasons for the security holders to accept the offer in the absence of any higher bid before the offer closes. In assessing the reasonableness of the Proposed Transaction, we have considered the following factors in our assessment:
the future prospects of the Company if the Proposed Transaction does not proceed;
alternative offers and sources of funds; and
any other commercial advantages and disadvantages to the Shareholders as a consequence of the Proposed Transaction proceeding.
2.5. In our opinion, in the absence of a superior offer, the position of Shareholders if Resolution 1 is approved is more advantageous than if it is not. The primary reasons for this assessment are set out below:
the $3 million in equity raised upon completion of the Proposed Transaction will increase the Company‟s current cash and liquidity position. As set out in further detail in section 5 of this Report, the Company‟s cash position has decreased from $5.3 million at 30 June 2011, to $1.1
million at 31 December 2012. The proceeds of $1.5 million raised from the issue of the Tranche 1 shares in January 2013, together with the Tranche 2 proceeds of $3 million will provide WRM with funding for the Company‟s operating expenses, as well as for the exploration and development of
the Company‟s properties and tenements, with the aim of the completion of a pre-feasibility study;

9
the consideration of $0.12 represents a 62.2% premium over the closing share price on 27 November 2012 of $0.074, 1 day before the announcement of the Proposed Transaction, and a 30.4% premium to the 30 day volume weighted average share price (“VWAP”) prior to the announcement of the Proposed Transaction of $0.092;
in the event that Resolution 1 is not approved, the Company will have to seek funding from alternative sources and may not be able to obtain funding on more favourable terms than currently offered by Avalon; and
WRM has undertaken a structured program seeking strategic investors or partnerships during the second half of 2012, meeting with local and international parties including other listed companies, capital funds, banks, broking firms, private investors and corporate advisory firms and, at the date of this Report, has not received any alternative offers that would offer a premium over the funding terms offered by Avalon.
2.6. The key disadvantages of the Proposed Transaction are as follows:
the Proposed Transaction is not fair;
the dilution of Shareholders‟ interests from 85.4% to 68.6% following the transaction set out in Resolution 1;
the likelihood of a future takeover of WRM may be reduced as Avalon would control a 31.4% interest in the Company; and
the dilution of existing shareholders‟ interests reduces the ability of existing shareholders to
influence the strategic direction of the Company, including acceptance or rejection of take-over or merger proposals.
2.7. We are not aware of any alternative proposals which may provide a greater benefit to the Non-Associated Shareholders of WRM at this time.
2.8. In our opinion, the position of the Shareholders of WRM if the Proposed Transaction is approved is more advantageous than the position if it is not approved. Therefore, in the absence of any other relevant information and/or a superior offer, we consider that the Proposed Transaction is reasonable for the Shareholders of WRM.

10
Number % of total
WRM Capital Structure Prior to the Proposed Transaction
Number of ordinary shares issued to Avalon under Tranche 1 15,000,000 14.6%Number of ordinary shares held by Non-Associated Shareholders 87,475,531 85.4%
Total number of shares prior to the Proposed Transaction 102,475,531 100.0%
WRM Capital Structure After the Proposed Transaction
Number of ordinary shares held by Non-Associated Shareholders 87,475,531 68.6%Number of ordinary shares held by Avalon after the issue of Tranche 1 and Tranche 2
40,000,000 31.4%
Total number of shares after the Proposed Transaction 127,475,531 100.0%
3. Summary of the Proposed Transaction
3.1. On 28 November 2012, the Company entered into a Share Subscription Agreement with Avalon to issue 40 million ordinary shares to Avalon in two tranches (Tranches 1 and 2) to raise $4.5 million.
3.2. Tranche 1 shares comprising 15 million shares with consideration of 10 cents per share were issued on 11 January 2013, resulting in Avalon owning a 14.6% interest in WRM.
3.3. Tranche 2 shares comprising 15 million shares with consideration of 12 cents per share, to raise a further $3 million, is subject to the approval of Resolution 1.
3.4. The Tranche 2 shares comprise a further 16.7% interest in the Company‟s share capital. In the event that
Resolution 1 is approved, completion of the issue of the Tranche 2 shares to Avalon is expected to take place in March 2013.
3.5. The effect of the Proposed Transaction on WRM‟s issued share capital is illustrated in the table below.
Table 2: WRM Capital Structure Before and After the Proposed Transaction
3.6. The Proposed Transaction would result in the dilution of Shareholders‟ interests from 85.4% to 68.6%.
3.7. As at the date of this Report, WRM had the following options on issue:
360,000 listed share options at an exercise price of $0.38, maturing 30 April 2014; and
6,050,000 listed share options at an exercise price of $0.38, maturing 1 August 2014.
3.8. As these options are all out of the money as at the date of this Report and, therefore, have no impact on our assessment of the fairness and reasonableness, we have excluded them from our analysis.

11
4. Purpose of this Report
Corporations Act
4.1. Section 606(1) of the Corporations Act provides that, subject to limited specified exemptions, a person must not acquire a “relevant interest” in issued voting shares in a public company if as a result of the acquisition any person‟s voting power in the company would increase from 20% or below to more than
20%. In broad terms, a person has a “relevant interest” in shares if that person holds shares or has the
power to control the right to vote or dispose of shares. A person‟s voting power in a company is the
number of voting shares in which the person (and its associates) has a relevant interest, compared with the total number of voting shares in a company.
4.2. Completion of the Proposed Transaction will result in Avalon having a 31.4% relevant interest in the Company.
4.3. Section 611, Item 7 of the Corporations Act provides an exemption to the rule noted in paragraph 4.1 above. Section 611, Item 7 allows a party (and its associates) to acquire a relevant interest in shares that would otherwise be prohibited under Section 606(1) of the Corporations Act if the proposed acquisition is approved in advance by a resolution passed at a general meeting of the company, and:
(i) no votes are cast in favour of the resolution by the proposed acquirer (Avalon) or respective associates; and
(ii) there was full disclosure of all information that was known to the persons proposed to make the acquisition or their associates or known to the company that was material to a decision on how to vote on the resolution.
4.4. This Report has been prepared to assist the Directors of WRM in making their recommendations to WRM Shareholders in relation to Resolution 1, and to assist the Non-Associated Shareholders of WRM to assess the merits of the Proposed Transaction. The sole purpose of this Report is to set out RSM‟s
opinion as to whether the Proposed Transaction is fair and reasonable.
4.5. Section 611 states that shareholders must be given all information that is material to the decision on how to vote at the meeting.
4.6. Regulatory Guide 111 Content of Expert Reports (“RG 111”) issued by ASIC advises the commissioning
of an Independent Expert‟s Report in such circumstances and provides guidance on the content.
Basis of Evaluation
4.7. In determining whether the Proposed Transaction is “fair and reasonable” we have given regard to the
views expressed by ASIC in RG 111.
4.8. RG 111 provides ASIC‟s views on how an expert can help security holders make informed decisions
about transactions. Specifically it gives guidance to experts on how to evaluate whether or not a proposed transaction is fair and reasonable.

12
4.9. RG 111 states that the expert report should focus on:
the issues facing the security holders for whom the report is being prepared; and
the substance of the transaction rather than the legal mechanism used to achieve it.
4.10. Where an issue of shares by a company otherwise prohibited under Section 606 is approved under Item 7 of Section 611 and the effect on the company‟s shareholding is comparable to a takeover bid, RG 111 states that the transaction should be analysed as if it were a takeover bid.
4.11. In assessing whether the Proposed Transaction is fair and reasonable to the Shareholders, the analysis undertaken is as follows:
Fairness
4.12. In assessing whether the Proposed Transaction is fair to Non-Associated Shareholders, a comparison of the following is undertaken:
the value of a WRM share (including a premium for control), prior to the Proposed Transaction; to
the consideration offered of $0.12 per share.
Reasonableness
4.13. In assessing whether the Proposed Transaction is reasonable to Non-Associated Shareholders, the following analysis has been undertaken:
a review of other significant factors which Non-Associated Shareholders might consider prior to approving the Proposed Transaction;
in particular, we have considered the advantages and disadvantages of the Proposed Transaction in the event that it proceeds or does not proceed, including the future prospects of the Company if the Proposed Transaction does not proceed; and
any other commercial advantages and disadvantages to Non-Associated Shareholders as a consequence of the Proposed Transaction proceeding.
4.14. Our assessment of the Proposed Transaction is based on economic, market and other conditions prevailing at the date of this Report.
4.15. Goldner and Associates (“GA”) has prepared a report providing an independent valuation of WRM‟s
interest in its gold and silver mineral assets. For the purpose of this Report, we have relied upon the valuation of WRM‟s mineral assets provided by GA in our assessment of the valuation of the Company.

13
Tonnes Gold SilverCategory Deposit Mt koz Au koz Ag
Silver dominant resources (25 g/t Ag cut-off grade)
Indicated Lady Hampden 1.84 37 4,056
Sub-total Indicated 1.84 37 4,056
Inferred Lady Hampden 2.47 27 4,023White Rock 4.08 - 8,194White Rock North 3.18 - 5,314Silver King 0.64 - 1,218
Sub-total Inferred 10.37 27 18,749
Gold dominant resources (0.5 g/t Au cut-off grate)
Indicated Strauss 1.24 57 153Kylo 1.59 59 133
Sub-total Indicated 2.83 116 286
Inferred Strauss 1.26 56 104Kylo 0.76 35 43Guy Bell 0.16 13 24
Sub-total Inferred 2.18 104 171
Total resources 284 23,262
Source: GA valuation (refer Appendix 6)
Contained metal
5. Profile of WRM
5.1. WRM is an Australian minerals exploration company focused on the discovery and development of shallow gold, silver and copper deposits in the New England Fold Belt of northern NSW.
5.2. WRM‟s primary asset is the 100% owned Mt Carrington Project where shallow Indicated and Inferred Mineral Resources totalling 284koz gold and 23,262koz silver (750koz AuEq), have been defined in accordance with the JORC code. The Mt Carrington Project consists of four Exploration Licences (“ELs”)
and 22 assorted mining tenements covering a total area of approximately 467km2, and is located near the township of Drake, circa 100km west of Lismore.
5.3. The Company also owns the Guyra Project, comprising two ELs, one immediately east of Guyra town and the other near the township of Glencoe, 40km north of Guyra.
5.4. The table below sets out a summary of WRM‟s resources at the Mt Carrington Project.
Table 3: Resources Summary at Mt Carrington as at 4 February 2012

14
Period ended Year ended Year ended Year ended31-Dec-12 30-Jun-12 30-Jun-11 30-Jun-10
Unaudited Audited Audited Audited
Ref $ $ $ $
Finance income 5.6 51,232 194,319 385,988 20,396
Administrative expenses 5.7 (353,404) (441,720) (394,184) (36,931)Depreciation expense (18,904) (6,718) (2,934) -Employee benefits expense 5.7 (262,941) (597,936) (1,392,178) (19,960)Marketing expense 5.7 (106,995) (150,727) (140,325) (15,000)Write-down of capitalised exploration 5.8 - (1,238,103) - -
Loss before tax (691,012) (2,240,885) (1,543,633) (51,495)
Income tax benefit 771,945 202,346 -
Total loss for the period/year after tax 5.9 (691,012) (1,468,940) (1,341,287) (51,495)
Total comprehensive loss attributable to members of WRM 5.9 (691,012) (1,468,940) (1,341,287) (51,495)
Source: WRM audited financial statements for the three years ended 30 June 2012, and unaudited
management accounts for the six months ended 31 December 2012
Financial Performance
5.5. The financial performance of WRM for the three years ended 30 June 2012, and the six months ended 31 December 2012 is set out in the table below.
Table 4: Financial Performance for the three years ended 30 June 2012 and the period ended 31 December 2012
5.6. For the three years ended 30 June 2012 and the six months ended 31 December 2012, WRM has generated revenue comprising interest income from bank deposits. The Company has yet to generate operating revenue due to the current exploratory nature of WRM‟s activities.
5.7. The Company incurred $1.2 million and $723,000 in administrative, employee and marketing costs for the year ended 30 June 2012, and the six months ended 31 December 2012, respectively.
5.8. WRM undertook a review of the carrying values of capitalised exploration expenditure during the 2012 financial year. As a result of the review, the Company incurred impairment expenses of $1.2 million as a result of a write-down to the capitalised carrying value of exploration expenditure in relation to certain exploration tenements.
5.9. The Company incurred a loss of $1.5 million in the year ended 30 June 2012, compared to a loss of $1.3 million in the year ended 30 June 2011. WRM incurred losses of $691,000 for the period ended 31 December 2012.
15
As at As at As at As at31-Dec-12 30-Jun-12 30-Jun-11 30-Jun-10
Unaudited Audited Audited Audited
Ref $ $ $ $
Current assetsCash and cash equivalents 5.14 - 5.15 1,127,968 2,617,429 5,299,693 5,919,172Trade and other receivables 969,959 1,529,143 1,031,846 830,085Prepayments 39,416 107,391 4,982 42,626
Total current assets 2,137,343 4,253,963 6,336,521 6,791,883
Non-current assetsExploration and evaluation expenditure 5.12 18,836,720 17,609,850 12,419,305 7,502,411Property, plant and equipment 5.13 953,331 1,008,862 1,079,681 994,089
Total non-current assets 19,790,051 18,618,712 13,498,986 8,496,500
Total assets 21,927,394 22,872,675 19,835,507 15,288,383
Current liabilitiesTrade and other payables 126,524 447,223 371,825 187,810Employee benefits 133,020 98,591 51,775 911
Total current liabilities 259,544 545,814 423,600 188,721
Non-current liabilitiesEmployee benefits 38,682 38,682 - -Provision for rehabilitation 951,000 919,000 919,000 795,400Deferred tax liability 1,692,620 1,692,620 2,049,979 -
Total non-current liabilities 2,682,302 2,650,302 2,968,979 795,400
Total liabilities 2,941,847 3,196,116 3,392,579 984,121
NET ASSETS 5.11 18,985,547 19,676,559 16,442,928 14,304,262
EquityIssued capital 5.14 - 5.15 24,129,475 24,129,475 19,426,904 14,355,757Reserves 870,040 870,040 870,040 -Accumulated losses (6,013,968) (5,322,956) (3,854,016) (51,495)
TOTAL EQUITY 5.11 18,985,547 19,676,559 16,442,928 14,304,262
Source: WRM audited financial statements for the three years ended 30 June 2012, and the unaudited
management accounts for the six months ended 31 December 2012
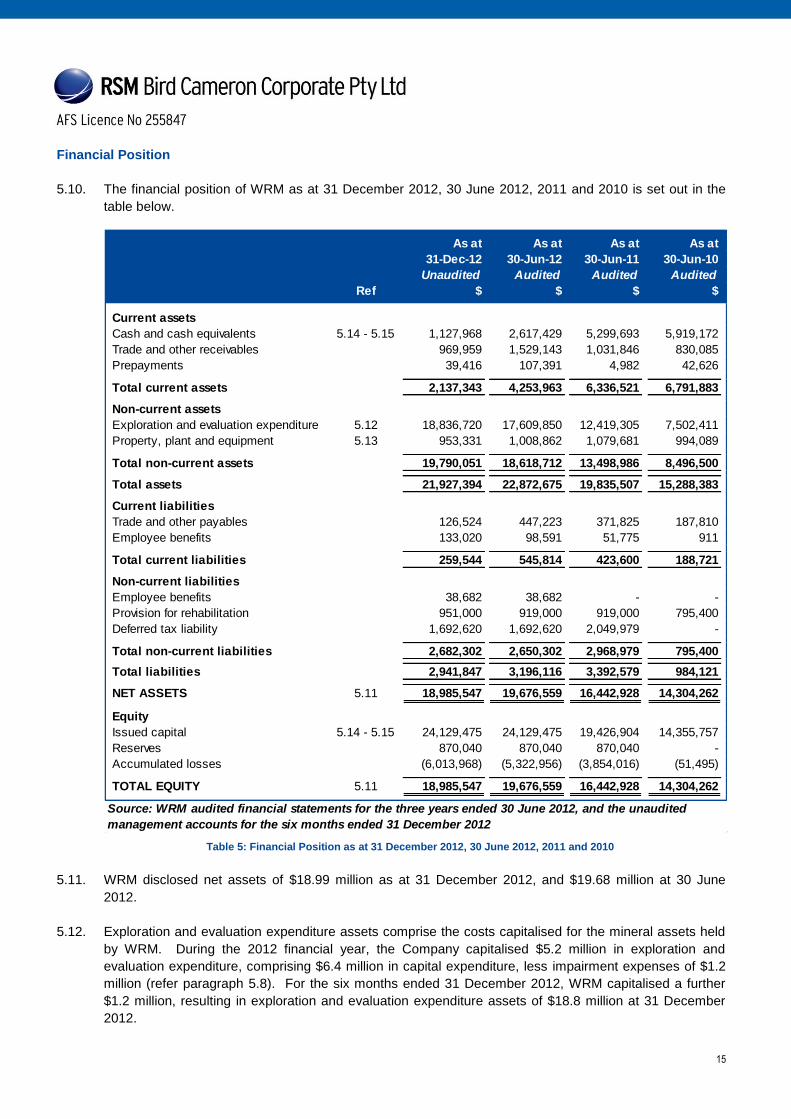
Financial Position
5.10. The financial position of WRM as at 31 December 2012, 30 June 2012, 2011 and 2010 is set out in the table below.
Table 5: Financial Position as at 31 December 2012, 30 June 2012, 2011 and 2010
5.11. WRM disclosed net assets of $18.99 million as at 31 December 2012, and $19.68 million at 30 June 2012.
5.12. Exploration and evaluation expenditure assets comprise the costs capitalised for the mineral assets held by WRM. During the 2012 financial year, the Company capitalised $5.2 million in exploration and evaluation expenditure, comprising $6.4 million in capital expenditure, less impairment expenses of $1.2 million (refer paragraph 5.8). For the six months ended 31 December 2012, WRM capitalised a further $1.2 million, resulting in exploration and evaluation expenditure assets of $18.8 million at 31 December 2012.

16
Shareholder Number of Shares %
AVALON VENTURES CORP 15,000,000 14.6%GREENSTONE PROP PL 8,441,919 8.2%SILVERSTONE INV HLDGS PL 5,203,333 5.1%GRAND SOUTH DVLMT LTD 3,033,334 3.0%S & S OLSEN PL 2,750,001 2.7%SELKIRK JAMES RONALD M 1,700,000 1.7%BANLONA PL 1,672,000 1.6%SILVERSTONE DRILLING SVCS 1,575,000 1.5%CITICORP NOM PL 1,453,820 1.4%JP MORGAN NOM AUST LTD 1,416,919 1.4%MELVILLE A G + E S 1,300,000 1.3%LAUFMANN NATALIE 1,287,501 1.3%STONE PONEYS NOM PL 984,999 1.0%LAUFMANN PHILIPPA 818,333 0.8%KATUT PL 810,000 0.8%HEWSON JOHN SUTTON + R A 800,000 0.8%STONE PONEYS NOM PL 750,000 0.7%GARDINER JAMES 750,000 0.7%OZGA S / F PL 684,999 0.7%YELLOWROCK PL 666,667 0.7%
51,098,825 49.9%Other Shareholders 51,376,706 50.1%
Total 102,475,531 100.0%
5.13. Property, plant and equipment primarily comprises machinery and motor vehicles, carried at cost less accumulated depreciation and asset impairment costs.
5.14. During the 2012 financial year and for the six months ended 31 December 2012, the Company issued a total of 30,658,332 new ordinary shares to raise $4.7 million (net of costs). Funds raised have primarily been utilised for WRM‟s exploration activities and to fund the Company‟s administrative, employment and marketing expenses. The Company‟s cash position has decreased from $5.3 million at 30 June 2011 to
$1.1 million at 31 December 2012.
5.15. The Company‟s issued share capital and cash position at 31 December 2012 does not reflect the
Tranche 1 shares issued to Avalon on 11 January 2013 to raise $1.5 million.
Capital Structure
5.16. As at 31 January 2013, WRM had 102,475,531 ordinary shares on issue, of which 49.9% were held by the top twenty shareholders. The top twenty Shareholders in WRM as at 31 January 2013 are set out in the table below.
Table 6: WRM Shareholder Summary

17
-
200,000
400,000
600,000
800,000
1,000,000
1,200,000
1,400,000
1,600,000
1,800,000
0
0.1
0.2
0.3
0.4
0.5
0.6
0.7
0.8
04
/01
/20
11
04
/02
/20
11
04
/03
/20
11
04
/04
/20
11
04
/05
/20
11
04
/06
/20
11
04
/07
/20
11
04
/08
/20
11
04
/09
/20
11
04
/10
/20
11
04
/11
/20
11
04
/12
/20
11
04
/01
/20
12
04
/02
/20
12
04
/03
/20
12
04
/04
/20
12
04
/05
/20
12
04
/06
/20
12
04
/07
/20
12
04
/08
/20
12
04
/09
/20
12
04
/10
/20
12
04
/11
/20
12
04
/12
/20
12
04
/01
/20
13
04
/02
/20
13
Volume tradedShare price ($)WRM Historical Share Price and Volume
Volume Price
28-Nov-12: WRM announces $4.5 million share placement with Avalon
8-May-12: WRM announces $0.5 million share placement with Greenstone Property Ltd and $0.56 million drilling services agreement with Silverstone Drilling Services Pty Ltd
22-May-12: The issue of shares to various substantial shareholders
3-Feb-11: WRM announces positive assay results from drilling completed at Gladstone Hill copper prospect within the Mt Carrington project
14-Nov-11: WRMannounces Entitlement Offer on a 1 share for 2 basis at an offer price of $0.15 per share
Share Price and Performance
5.17. The daily closing share price and traded volumes of WRM shares on the ASX from 1 January 2011 to 5 February 2013 is set out in the table below.
Chart 1: WRM Daily Closing Share Price and Traded Volumes from 1 January 2011 to 5 February 2013
(Source: Capital IQ)
5.18. WRM‟s share price has experienced a declining trend since the beginning of 2011. In 2011, the Company‟s share price fell from a high of $0.70 on 5 January 2011, to a low of $0.14 on 20 December 2011 and 22 December 2011.
5.19. The share price fell to $0.13 on 3 January 2012, before reaching a high $0.20 on 13 February 2012, and subsequently falling to $0.19 on 14 February 2012. Thereafter, the share price fluctuated between $0.135 and $0.175, before reaching a high of $0.180 on 4 May 2012, prior to the announcement of WRM‟s $0.5 million share placement with Greenstone Property Ltd and $0.56 million drilling services
agreement with Silverstone Drilling Services Pty Ltd.
5.20. WRM‟s share price declined from $0.18 on 4 May 2012 to reach a low of $0.074 on 27 November 2012, one day prior to the announcement of the Proposed Transaction. The share price increased to reach $0.091 on 30 November 2012, following the announcement of the Proposed Transaction.
5.21. Since the announcement of the Proposed Transaction to 5 February 2013, WRM‟s share price has
fluctuated from a low of $0.08 to a high of $0.094.
5.22. The liquidity of WRM shares is relatively low with circa 4.84% of the issued capital traded in the 60 trading days prior to the announcement of the Proposed Transaction.

18
6. Valuation Approach
Valuation Methodologies
6.1. In assessing the value of WRM prior to and immediately following the Proposed Transaction, we have considered a range of valuation methodologies. RG 111 proposes that it is generally appropriate for an expert to consider using the following methodologies:
the discounted cash flow (“DCF”) method and the estimated realisable value of any surplus assets;
the application of earnings multiples to the estimated future maintainable earnings or cashflows added to the estimated realisable value of any surplus assets;
the amount which would be available for distribution on an orderly realisation of assets;
the quoted price for listed securities; and
any recent genuine offers received.
6.2. We consider that the valuation methodologies proposed by RG 111 can be split into three valuation methodology categories, as follows:
Market Based Methods;
Discounted Cash Flow Methods; and
Asset Based Methods.
Market Based Methods
6.3. Market based methods estimate the fair market value by considering the market value of a company‟s
securities or the market value of comparable companies. Market based methods include;
capitalisation of maintainable earnings;
the quoted price for listed securities; and
industry specific methods.
6.4. The capitalisation of earnings methodology is generally considered a short form DCF, where an estimation of the Future Maintainable Earnings (“FME”) of the business, rather than a stream of cash
flows is capitalised based on an appropriate capitalisation multiple. Multiples are derived from the analysis of transactions involving comparable companies and the trading multiples of comparable companies.
6.5. The recent quoted price for listed securities method provides evidence of the fair market value of a company‟s securities where they are publicly traded in an informed and liquid market.
6.6. Industry specific methods usually involve the use of industry rules of thumb to estimate the fair market value of a company and its securities. Generally rules of thumb provide less persuasive evidence of the fair market value of a company than other market based valuation methods because they may not account for company specific risks and factors.

19
Discounted Cash Flow Methods
6.7. The DCF technique has a strong theoretical basis, valuing a business on the net present value of its future cash flows. It requires an analysis of future cash flows, the capital structure and costs of capital and an assessment of the residual value or the terminal value of the company‟s cash flows at the end of the forecast period. This method of valuation is appropriate when valuing companies where future cash flow projections can be made with a reasonable degree of confidence.
Asset Based Methods
6.8. Asset based methodologies estimate the fair market value of a company‟s securities based on the
realisable value of its identifiable net assets. Asset based methods include:
orderly realisation of assets method;
liquidation of assets method; and
net assets on a going concern basis.
6.9. The value achievable in an orderly realisation of assets is estimated by determining the net realisable value of the assets of a company which would be distributed to security holders after payment of all liabilities, including realisation costs and taxation charges that arise, assuming the company is wound up in an orderly manner. This technique is particularly appropriate for businesses with relatively high asset values compared to earnings and cash flows.
6.10. The liquidation of assets method is similar to the orderly realisation of assets method except the liquidation method assumes that the assets are sold in a shorter time frame, reflecting a distressed liquidation value. The liquidation of assets method will result in a value that is lower than the orderly realisation of assets method, and is appropriate for companies in financial distress or when a company is not valued on a going concern basis.
6.11. The net assets on a going concern method estimates the market values of the net assets of a company but unlike the orderly realisation of assets method, it does not take into account realisation costs. Asset based methods are appropriate when companies are not profitable, a significant proportion of the company‟s assets are liquid, or for asset holding companies.
Valuation methodology of mineral assets utilised by GA
6.12. GA has utilised the Comparable Transactions and the Multiple of Past Expenditure methodologies to value the Mt Carrington and Guyra Projects.
6.13. Recent comparable transactions can be relevant to the valuation of projects and tenements. GA notes that while it can be difficult to determine the extent transactions are comparable, the comparable transactions method can provide a useful benchmark for valuation purposes, further noting that the timing of comparable transactions must be considered as there can be substantial change in value over time.
6.14. Past expenditure, or the amount spent on exploration of a tenement is commonly used as a guide in determining the value of exploration tenements, and „deemed expenditure‟ is frequently the basis of joint venture agreements. GA notes that it is assumed that well directed exploration has added value to the property. This is not always the case and exploration can also downgrade a property and therefore, a prospectivity enhancement multiplier (“PEM”), which commonly ranges from 0.5 – 3.0, is applied to the

20
effective expenditure. The selection of the appropriate multiplier is a matter of experience and judgement. GA has applied a scale of PEM ranges to the exploration expenditure as follows:
PEM 0.5 – 0.9 Previous exploration indicates the area has limited potential
PEM 1.00 – 1.4 The existing (historical and/or current) data consists of pre-drilling exploration and the results are sufficiently encouraging to warrant further exploration
PEM 1.5 – 1.9 The prospect contains one or more defined significant targets warranting additional exploration.
PEM 2.0 – 2.4 The prospect has one or more targets with significant drill hole intersections
PEM 2.5 – 2.9 Exploration is well advanced and infill drilling is required to define a resource
PEM 3.0 A resource has been defined but a (recent) pre-feasibility study has not yet been completed
Selection of Valuation Methodologies
Valuation of a WRM Share prior to the Proposed Transaction
6.15. In valuing a share in WRM prior to the Proposed Transaction we have utilised the net assets on a going concern methodology and relied upon the net book value of assets and liabilities as set out in WRM‟s
unaudited financial statements as at 31 December 2012, and the valuation of WRM‟s mineral assets as set out in GA‟s report (refer Appendix 6).
Quoted Price of Listed Securities
6.16. As a secondary method of valuing a WRM share prior to the Proposed Transaction we have also considered the quoted price for listed securities methodology. In accordance with RG 111, we have assessed the value of WRM‟s shares on the basis of a 100% controlling interest.
6.17. Prices at which a company‟s shares have been traded on the ASX can, in the absence of low liquidity or unusual circumstances, provide an objective measure of the value of the company, excluding a premium for control.
6.18. As a cross-check, we have considered the quoted market price by considering the historical VWAP of WRM share and the volatility of the share price prior to and post the announcement of the Proposed Transaction.
21
As at31-Dec-12
Unaudited Low High Preferred$ Ref $ $ $
Current assetsCash and cash equivalents 1,127,968 1,127,968 1,127,968 1,127,968Issue of Tranche 1 shares to Avalon - 7.5 1,500,000 1,500,000 1,500,000Trade and other receivables 969,959 969,959 969,959 969,959Prepayments 39,416 39,416 39,416 39,416
Total current assets 2,137,343 3,637,343 3,637,343 3,637,343
Non-current assetsExploration and evaluation expenditure / Value of the Mt Carrington and Guyra Projects assessed by GA
18,836,720 7.6 to 7.9
17,570,000 44,480,000 24,660,000
Property, plant and equipment 953,331 953,331 953,331 953,331
Total non-current assets 19,790,051 18,523,331 45,433,331 25,613,331
Total assets 21,927,394 22,160,674 49,070,674 29,250,674
Current liabilitiesTrade and other payables 126,524 126,524 126,524 126,524Employee benefits 133,020 133,020 133,020 133,020
Total current liabilities 259,544 259,544 259,544 259,544
Non-current liabilitiesEmployee benefits 38,682 38,682 38,682 38,682Provision for rehabilitation 951,000 951,000 951,000 951,000Deferred tax liability 1,692,620 1,692,620 1,692,620 1,692,620
Total non-current liabilities 2,682,302 2,682,302 2,682,302 2,682,302
Total liabilities 2,941,847 2,941,847 2,941,847 2,941,847
NET ASSETS 18,985,547 19,218,827 46,128,827 26,308,827
Number of shares on issue 87,475,531 7.5 102,475,531 102,475,531 102,475,531
Assessed value per share ($) 0.188 0.450 0.257
Source: RSM analysis and GA
Prior to the Proposed TransactionAssessed value
7. Valuation of WRM
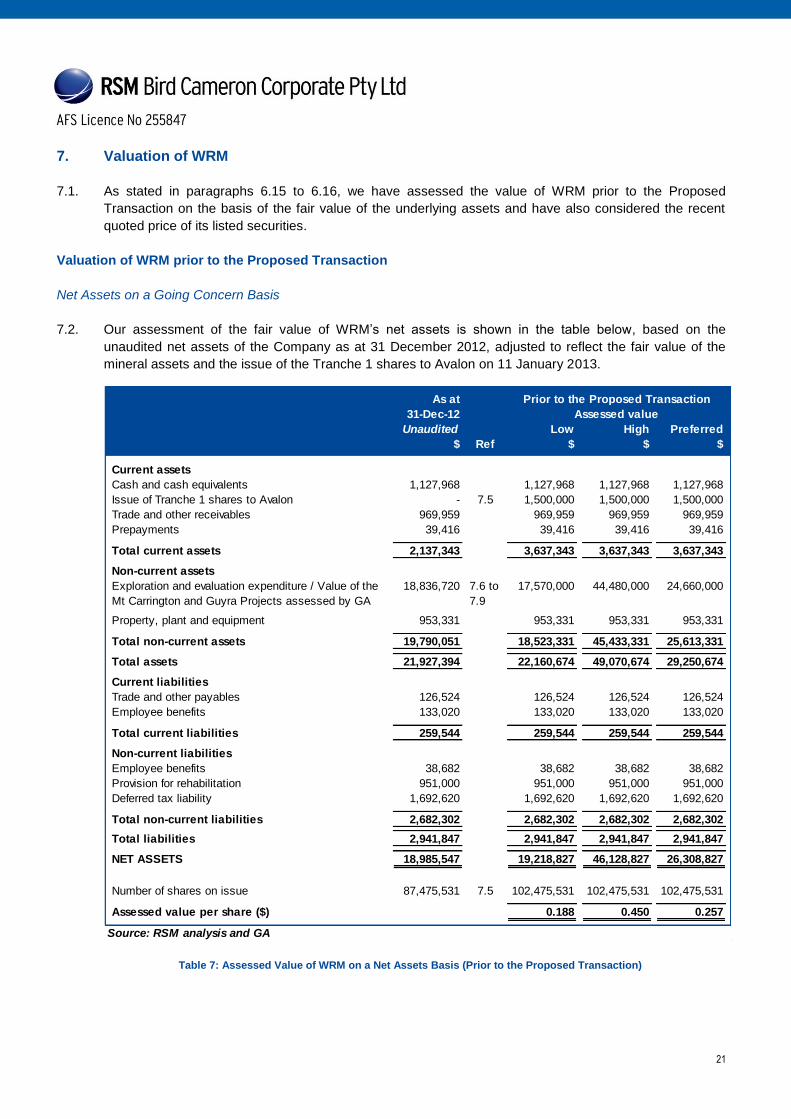
7.1. As stated in paragraphs 6.15 to 6.16, we have assessed the value of WRM prior to the Proposed Transaction on the basis of the fair value of the underlying assets and have also considered the recent quoted price of its listed securities.
Valuation of WRM prior to the Proposed Transaction
Net Assets on a Going Concern Basis
7.2. Our assessment of the fair value of WRM‟s net assets is shown in the table below, based on the unaudited net assets of the Company as at 31 December 2012, adjusted to reflect the fair value of the mineral assets and the issue of the Tranche 1 shares to Avalon on 11 January 2013.
Table 7: Assessed Value of WRM on a Net Assets Basis (Prior to the Proposed Transaction)

22
ComparableTransaction Low High Low High GA preferred
Project $'m $'m $'m $'m $'m $'m
Mt Carrington 17.11 40.29 43.62 17.11 43.62 24.00
Guyra 0.46 0.74 0.86 0.46 0.86 0.66
Total 17.57 41.03 44.48 17.57 44.48 24.66
Source: GA valuation (refer Appendix 6)
Multiple of Past Expenditure Valuation
7.3. As at the date of this Report, WRM had the following options on issue:
360,000 listed share options at an exercise price of $0.38, maturing 30 April 2014; and
6,050,000 listed share options at an exercise price of $0.38, maturing 1 August 2014.
7.4. As these options are all out of the money as at the date of this Report and, therefore, have no impact on our assessment of the fairness and reasonableness, we have excluded them from our analysis.
7.5. We have adjusted the Company‟s nets assets at 31 December 2012 to reflect the issue of the 15,000,000
Tranche 1 shares at an issue price of 10 cents per share to Avalon, to raise $1.5 million.
7.6. Exploration and evaluation expenditure are all related to expenditure on the mineral assets valued by GA. We have therefore excluded all capitalised exploration and evaluation expenditure as at 31 December 2012, and included GA‟s valuation of the Mt Carrington and Guyra Projects.
7.7. The table below sets out the range of values attributed to the Mt Carrington and Guyra Projects by GA using the Comparable Transactions and Multiple of Expenditure methodologies.
Table 8: Valuation of Mt Carrington and Guyra Projects
7.8. The range of values attributed to WRM‟s mineral assets comprising the Mt Carrington and Guyra Projects, by GA is $17.57 million to $44.48 million with a preferred value of $24.66 million.
7.9. GA considers that the Comparable Transactions method is a better guide to the value of the Mt Carrington Project than the valuation based on the Multiple of Past Expenditure. Consequently, GA‟s
preferred value for Mt Carrington is towards the lower end of the valuation range for the Mt Carrington Project as set out in Table 8 above.
7.10. We are not aware of any other indicators that the book value of assets and liabilities of WRM differ materially from their fair market value.
23
Low High Preferred$ $ $
Value per WRM's mineral assets 17,570,000 44,480,000 24,660,000
Other assets and liabilities 1,648,827 1,648,827 1,648,827
Net assets 19,218,827 46,128,827 26,308,827
Number of shares on issue 102,475,531 102,475,531 102,475,531
Assessed value per share ($) 0.188 0.450 0.257
Source: RSM analysis
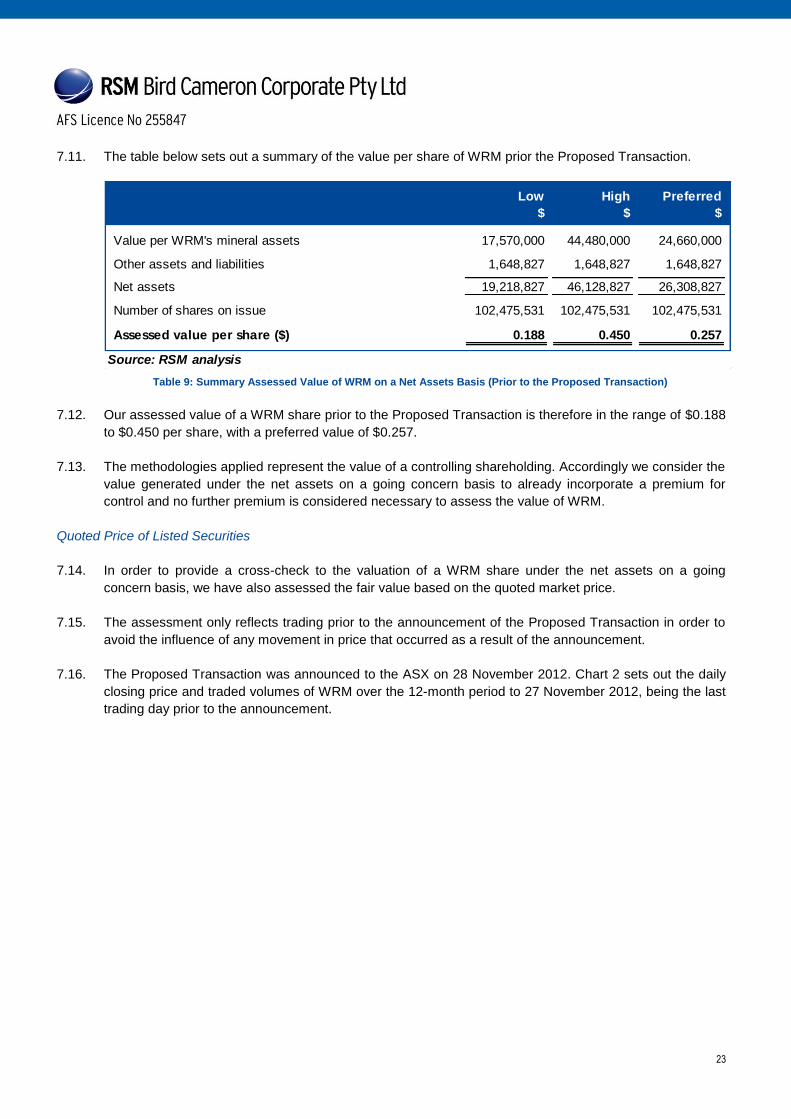
7.11. The table below sets out a summary of the value per share of WRM prior the Proposed Transaction.
Table 9: Summary Assessed Value of WRM on a Net Assets Basis (Prior to the Proposed Transaction)
7.12. Our assessed value of a WRM share prior to the Proposed Transaction is therefore in the range of $0.188 to $0.450 per share, with a preferred value of $0.257.
7.13. The methodologies applied represent the value of a controlling shareholding. Accordingly we consider the value generated under the net assets on a going concern basis to already incorporate a premium for control and no further premium is considered necessary to assess the value of WRM.
Quoted Price of Listed Securities
7.14. In order to provide a cross-check to the valuation of a WRM share under the net assets on a going concern basis, we have also assessed the fair value based on the quoted market price.
7.15. The assessment only reflects trading prior to the announcement of the Proposed Transaction in order to avoid the influence of any movement in price that occurred as a result of the announcement.
7.16. The Proposed Transaction was announced to the ASX on 28 November 2012. Chart 2 sets out the daily closing price and traded volumes of WRM over the 12-month period to 27 November 2012, being the last trading day prior to the announcement.

24
-
200,000
400,000
600,000
800,000
1,000,000
1,200,000
1,400,000
1,600,000
1,800,000
0
0.05
0.1
0.15
0.2
0.25
Volume tradedShare price ($) WRM Share Price and Volume before Announcement
Volume Price
8-May-12: WRM announces $0.5 million share placement with Greenstone Property Ltd and $0.56 million drilling services agreement with Silverstone Drilling Services Pty Ltd
22-May-12: The issue of shares to various substantial shareholders
Trading days to 27 November 2012 High Low Value ($) Volume VWAP
Volume traded as % of issued shares
1 day 0.074 0.074 990 13,380 0.074 0.02%
5 days 0.081 0.074 17,630 230,080 0.077 0.27%
10 days 0.081 0.074 37,710 490,080 0.077 0.57%
30 days 0.100 0.074 244,572 2,667,010 0.092 3.08%
60 days 0.120 0.074 401,903 4,234,710 0.095 4.84%
Source: Capital IQ and RSM analysis
7.17. Over this period, the closing price of WRM shares has shown a decreasing trend, decreasing from a high of $0.20 in February 2012 to $0.074 in November 2012.
Chart 2: WRM Daily Closing Share Price and Traded Volumes Prior to the Announcement (Source: Capital IQ)
7.18. In order to provide further analysis of the market prices for WRM shares, we have considered the VWAP for the 1 day, 5 days, 10 days, 30 days and 60 days trading day periods to 27 November 2012:
Table 10: Volume Weighted Average Price of WRM prior to the Announcement
7.19. We note the following:
the table shows that 4.84% of WRM‟s shares have been traded in the 60 trading day period prior to
the announcement of the Proposed Transaction which indicates a relatively low level of liquidity;
the VWAP has ranged from a low of $0.074 to $0.095 in the 60 day trading period before the announcement of the Proposed Transaction;

25
Number ofTransactions 20 Days Pre 5 Days Pre 2 Days Pre
Average control premium - All Industries 292 34.5% 28.9% 25.6%
Average control premium - Metals & Mining 78 38.46% 34.49% 31.01%
Low High$ $
Quoted market price value 0.074 0.095
Control premium 35% 35%
Quoted market price valuation including a premium for control 0.100 0.128
Source: RSM analysis
notwithstanding the level of liquidity, WRM complies with the full disclosure regime required by the ASX. As a result, the market is fully informed about the performance of WRM; and
in the absence of other share offers, the trading share price represents the value minority shareholders could realise if they wanted to exit their investment.
7.20. Our assessment of a fair market value of a WRM share is based on the 1 day to 60 days VWAP prior to the announcement of the Proposed Transaction, and therefore on the basis of a minority interest, is between $0.074 to $0.095.
7.21. The value above is indicative of the value of a marketable parcel of shares assuming a shareholder does not have control of WRM. In the case of a Section 611 acquisition, RG 111 states that the independent expert should calculate the value of a target‟s shares as if 100% control were being obtained. Therefore, in our assessment of the fair value of a WRM share, we should include a premium for control.
7.22. RSM Bird Cameron has undertaken a survey of control premiums paid over a 5-year period to 30 June 2011 in 292 successful takeovers and schemes of arrangements of companies listed on the ASX (“RSM
Bird Cameron Control Premium Study 2012”). The findings are summarised in the table below, showing the average control premium 20 days, 5 days and 2 days prior to announcement.
Table 11: Average Control Premium over five years to 30 June 2011
(Source: RSM Bird Cameron Control Premium Study 2012)
7.23. We have selected a control premium of 35% (having regard to control premiums paid for companies operating in the metals and mining industry as set out in Table 11), and applied it to our assessed value of a WRM share on a minority interest basis as follows:
Table 12: Assessed Value of a WRM Share
7.24. Our valuation of a WRM share on the basis of the quoted market price including a premium for control is therefore between $0.10 and $0.128.

26
Low High$ $
Net assets on a going concern - primary methodology 0.188 0.450
Quoted market price value - secondary methodology 0.100 0.128
Source: RSM analysis
Valuation Summary
7.25. A summary of our assessed values of a WRM share prior to the Proposed Transaction is shown below.
Table 13: WRM Valuation Summary
7.26. We have relied upon the net assets on a going concern valuation methodology as we consider that the trading market for WRM‟s shares is not deep enough to provide a fair market value. WRM shares have not historically traded in significant volumes or on a regular basis.
7.27. We consider that the variance between the historic traded share price and our assessed value most likely reflects, amongst other factors, that the market for WRM shares is not deep and therefore its share price may not be a reliable indicator of value as the market for those shares may not be fully efficient. In addition, it is possible that the market is not reflecting the future exploration potential of the Mt Carrington and Guyra Projects as it has not had full access to detailed information and independent analysis undertaken by GA. We have therefore only relied on the quoted listed securities valuation methodology as guidance and a cross-check to our primary valuation methodology.
7.28. We have therefore assessed the fair market value of a WRM share on a controlling basis prior to the Proposed Transaction to be in the range of $0.188 and $0.450 with a preferred value of $0.257.

27
Low High Preferred$ $ $
Value per WRM share 0.188 0.450 0.257
Value of consideration for a WRM share 0.120 0.120 0.120
Source: RSM analysis
8. Is The Proposed Transaction Fair?
8.1. Our assessed values of a WRM share prior to the Proposed Transaction compared to the consideration of $0.12 per share offered for the Share Placement is set out in the table below.
Table 14 Valuation Summary
8.2. As the value of a WRM share is greater than the consideration offered, and in the absence of any other relevant information, in our opinion, the Proposed Transaction is Not Fair to the Shareholders.

28
9. Is The Proposed Transaction Reasonable?
9.1. To assess whether the Proposed Transaction is “reasonable”, we have considered the following:
the future prospects of WRM if the Proposed Transaction does not proceed;
alternative offers and sources of funds;
other commercial advantages and disadvantages to the Non-Associated Shareholders as a consequence of the Proposed Transaction proceeding; and
the response of the market to the announcement of the Proposed Transaction.
Future Prospects of WRM if the Proposed Transaction Does Not Proceed
9.2. If Resolution 1 is not approved, the Company may experience delays in its plan to conduct pre-feasibility studies at Mt Carrington, with the aim to complete a full feasibility study by 2014.
9.3. WRM will be required to seek funding from alternative sources and may not be able to obtain funding on more favourable terms than currently offered by Avalon.
Alternative Offers
9.4. WRM has undertaken a structured program seeking strategic investors or partnerships during the second half of 2012, meeting with local and international parties including other listed companies, capital funds, banks, broking firms, private investors and corporate advisory firms, and at the date of this Report, has not received any alternative offers that would offer a premium over the funding terms offered by Avalon.
9.5. We are unaware of any alternative proposal at this time which would offer the Non-Associated Shareholders a premium over the funding terms offered by Avalon from the Proposed Transaction.
Advantages
9.6. The key advantages to WRM Non-Associated Shareholders accepting Resolution 1 are:
the $3 million in equity raised upon completion of the Proposed Transaction will increase the Company‟s current cash and liquidity position. As set out in further detail in section 5 of this Report, the Company‟s cash position has decreased from $5.3 million at 30 June 2011, to $1.1 million at 31 December 2012. The proceeds of $1.5 million raised from the issue of the Tranche 1 shares in January 2013, together with the Tranche 2 proceeds of $3 million will provide WRM with funding for the Company‟s operating expenses, as well as for the exploration and development of the Company‟s properties and tenements, with the aim of the completion of a pre-feasibility study; and
the consideration of $0.12 represents a 62.2% premium over the closing share price on 27 November 2012 of $0.074, 1 day before the announcement of the Proposed Transaction, and a 30.4% premium to the 30 day VWAP prior to the announcement of the Proposed Transaction of $0.092.

29
High Low Value ($) Volume VWAPVolume traded as % of issued shares
Trading days to 27 November 2012
1 day 0.074 0.074 990 13,380 0.074 0.02%
5 days 0.081 0.074 17,630 230,080 0.077 0.27%
Period from 28 November 2012
28-Nov-12 0.091 0.091 9,021 99,130 0.091 0.11%
29-Nov-12to 5-Feb-13 0.094 0.080 108,522 1,239,590 0.088 1.33%
Source: Capital IQ and RSM analysis
Disadvantages
9.7. The key disadvantages of the Proposed Transaction are as follows:
the Proposed Transaction is not fair;
the dilution of Shareholders‟ interests from 85.4% to 68.6% following the transaction set out in Resolution 1;
the likelihood of a future takeover of WRM may be reduced as WRM would control 31.4% interest in the Company; and
the dilution of existing shareholders‟ interests reduces the ability of existing shareholders to influence the strategic direction of the Company, including acceptance or rejection of take-over or merger proposals.
Response of the Market to the Announcement of the Proposed Transaction
9.8. The table below sets out the VWAP of the WRM share price and the volumes traded 1 day and 5 days before, and the period after the announcement of the Proposed Transaction on 28 November 2012.
Table 15: Volume Weighted Average Price of WRM after the Announcement
9.9. Volume of shares traded was very low at 1.33% in the period measured after the announcement of the Proposed Transaction. The VWAP of $0.088 to 5 February 2013 is 18.9% higher than the VWAP of $0.074 measured 1 day, and 14.3% higher than the VWAP of $0.077 measured 5 days before the announcement of the Proposed Transaction.
Conclusion on Reasonableness
9.10. In our opinion, the position of the Shareholders if the Proposed Transaction is approved is more advantageous than the position if it is not approved. Therefore, in the absence of any other relevant information and/or a superior offer, we consider that the Proposed Transaction is Reasonable for the Shareholders of WRM.

30
9.11. An individual shareholder‟s decision in relation to the Proposed Transaction may be influenced by his or
her individual circumstances. If in doubt, shareholders should consult an independent advisor. Yours faithfully RSM BIRD CAMERON CORPORATE PTY LTD G YATES A GILMOUR Director Director

31
Appendix 1 – Declarations and Disclaimers
Declarations and Disclosures
RSM Bird Cameron Corporate Pty Ltd holds Australian Financial Services Licence 255847 issued by ASIC pursuant to which they are licensed to prepare reports for the purpose of advising clients in relation to proposed or actual mergers, acquisitions, takeovers, corporate reconstructions or share issues. Qualifications
Our report has been prepared in accordance with professional standard APES 225 “Valuation Services” issued by
the Accounting Professional & Ethical Standards Board.
RSM Bird Cameron Corporate Pty Ltd is beneficially owned by the partners of RSM Bird Cameron (RSMBC) a large national firm of chartered accountants and business advisors.
Mr Glyn Yates and Mr Andrew Gilmour are directors of RSM Bird Cameron Corporate Pty Ltd. Both Mr Yates and Mr Gilmour are Chartered Accountants with extensive experience in the field of corporate valuations and the provision of independent expert‟s reports for transactions involving publicly listed and unlisted companies in Australia. Reliance on this Report
This report has been prepared solely for the purpose of assisting the Non-Associated Shareholders of White Rock Minerals Limited in considering the Proposed Transaction. We do not assume any responsibility or liability to any party as a result of reliance on this report for any other purpose. Reliance on Information
Statements and opinions contained in this report are given in good faith. In the preparation of this report, we have relied upon information provided by the directors and management of White Rock Minerals Limited and we have no reason to believe that this information was inaccurate, misleading or incomplete. However, we have not endeavoured to seek any independent confirmation in relation to its accuracy, reliability or completeness. RSM Bird Cameron Corporate Pty Ltd does not imply, nor should it be construed that it has carried out any form of audit or verification on the information and records supplied to us.
The opinion of RSM Bird Cameron Corporate Pty Ltd is based on economic, market and other conditions prevailing at the date of this report. Such conditions can change significantly over relatively short periods of time.
In addition, we have considered publicly available information which we believe to be reliable. We have not, however, sought to independently verify any of the publicly available information which we have utilised for the purposes of this report.
We assume no responsibility or liability for any loss suffered by any party as a result of our reliance on information supplied to us.

32
Disclosure of Interest
At the date of this report, none of RSM Bird Cameron Corporate Pty Ltd, RSMBC, Glyn Yates, Andrew Gilmour nor any other member, director, partner or employee of RSM Bird Cameron Corporate Pty Ltd and RSMBC has any interest in the outcome of the Proposed Transaction, except that RSM Bird Cameron Corporate Pty Ltd are expected to receive a fee of approximately $25,000 based on time occupied at normal professional rates for the preparation of this report. The fees are payable regardless of whether White Rock Minerals Limited receives Non-Associated Shareholder approval for the Proposed Transaction, or otherwise. Consents
RSM Bird Cameron Corporate Pty Ltd consents to the inclusion of this report in the form and context in which it is included with the Explanatory Memorandum to be issued to Shareholders. Other than this report, none of RSM Bird Cameron Corporate Pty Ltd, RSM Bird Cameron Partners or RSMBC has been involved in the preparation of the Notice of General Meeting and Explanatory Statement. Accordingly, we take no responsibility for the content of the Notice of General Meeting and Explanatory Statement as a whole.

33
Appendix 2 – Sources of Information
In preparing this report we have relied upon the following principal sources of information:
WRM Annual Report for the years ended 30 June 2012, 30 June 2011 and 30 June 2010;
WRM share registry provided by WRM Management as at 31 January 2013;
WRM draft and final copies of the Notice of Meeting and Explanatory Memorandum;
Share Subscription Agreement between WRM and Avalon Ventures Corporation;
Independent Technical Review and Valuation of the Mt Carrington and Guyra Projects of White Rock Minerals Limited, dated 9 January 2013;
Announcements and other information from the ASX and WRM website;
Capital IQ Database;
IBISWorld; and
Discussions with Management of WRM.
34
Appendix 3 – Glossary of Terms and Abbreviations
Term Definition Ag Silver ASIC Australian Securities & Investments Commission ASX Australian Securities Exchange Au Gold AuEq Gold equivalent Avalon Avalon Ventures Corporation Directors The directors of WRM EL Exploration Licence ELA Exploration Licence Application Equity The owner‟s interest in property after deduction of all
liabilities GA Goldner and Associates Going Concern An ongoing operating business enterprise g/t Grams per tonne IER Independent Expert‟s Report Indicated Resources Economic mineral occurrences that have been sampled
(from locations such as outcrops, trenches, pits and drill holes) to a point where an estimate has been made, at a reasonable level of confidence, of their contained metal, grade, tonnage, shape, densities and physical characteristics

35
Term Definition Inferred Resources That part of a mineral resource for which tonnage, grade
and material content can be estimated with a low level of confidence. It is inferred from geological evidence and assumed but not verified geological and/or grade continuity. It is based on information gathered through appropriate techniques from locations such as outcrops, trenches, pits, workings and drill holes which may be limited or of uncertain quality and reliability
JORC Australasian Joint Ore Reserves Committee Koz Thousand ounces Management The management of WRM Measured Resource A mineralised zone intersected and tested by drill holes,
underground openings, or other sampling procedures at locations which are spaced closely enough to confirm continuity and where geo-scientific data are reliably known. Measured Resource is that portion of a mineral resource for which tonnage, densities, shape, physical characteristics, grade and mineral content can be estimated with a high level of confidence
Mt Million tonnes Non-Associated Shareholders Shareholders of WRM not associated with Avalon or its
associates RSM RSM Bird Cameron Corporate Pty Limited $ or A$ Australian dollars
Share Subscription Agreement The agreement between WRM and Avalon dated 28 November 2012
t Tonne Troy oz Troy ounce, unit measurement for gold and silver Valmin Code Code for the Technical Assessment and Valuation of
Mineral and Petroleum Assets and Securities for Independent Expert Reports

36
Term Definition US$ or USD US Dollars VWAP Volume Weighted Average Share Price WRM or the Company White Rock Minerals Limited

37
Appendix 4 – Profile of the Australian Silver Industry
Background
Silver is mined and produced mainly as a co-product of lead, zinc, copper and, to a lesser extent, gold. Australia‟s
silver resources occur in all states but predominantly in Queensland1.
Silver resources
Australia‟s Economic Demonstrated Resources2 (“EDR”) of silver was approximately 77,000 tonnes as at 31 December 2010 which is 15% of world economic resources3. On the basis of calendar year exploration expenditure reported by the Australian Bureau of Statistics (ABS), in 2010, exploration spending on zinc, lead and silver was $67 million, 39% higher than in 2009. The 2010 expenditure was 12% of total base metal expenditure of $563 million. Expenditure on exploration for the three commodities made up only 2.7% of all mineral exploration of $2.49 billion (excluding petroleum)4.
Silver Production
Australia‟s mine output of silver is expected to be circa 58.5 million troy ounces in 2011-12, compared with 53.8 million troy ounces in 2006-07. Silver production is expected to increase alongside zinc and lead, over the five years to 2016-17 as a result of higher output and expected weakening of the Australian dollar5.
Most of the silver mined in Australia is exported in the form of concentrates. The combined revenue of the silver, lead and zinc industry is expected to total $5.25 billion in 2011-12, compared with $7.87 billion in 2006-07 (an annualised decrease of 7.8%). The decline reflects the decline in high zinc prices, partially offset by the rise in silver prices. Industry revenue is expected to improve over the five years to 2016-17 at an annualised rate of 5.4% per annum, reaching $6.83 billion in 2016-17, as a result of strengthening zinc prices and expected weakening of the Australian dollar against the US dollar6.
Silver Price
Silver prices are quoted by Commodity Exchange, Inc. (“COMEX”), a division of the New York Mercantile
Exchange. Silver prices (as well as other commodities) are priced in US dollars. Therefore, the revenues of industry participants in Australia are exposed to the volatility in exchange rates, in addition to silver prices.
1 Australian Government, GeoScience Australia, Australia‟s Identified Mineral Resource 2011. 2 the sum of measured and/or indicated resources, which at the time of determination, profitable extraction or production under defined
investment assumptions has been established, analytically demonstrated, or assumed with reasonable certainty. 3 Australian Government, GeoScience Australia, Australia‟s Identified Mineral Resource 2011. 4 Australian Government, GeoScience Australia, Australia‟s Identified Mineral Resource 2011. 5 IBISWorld Industry Report B1317 – Silver, Lead and Zinc Ore Mining in Australia, May 2012. 6 IBISWorld Industry Report B1314 – Silver, Lead and Zinc Ore Mining in Australia, May 2012.

38
0
10
20
30
40
50
60
2009 2010 2011 2012 2013
US$/troy ozSilver (COMEX) Historical Pricing
Silver price US$ per troy oz
The historical silver prices as quoted on the COMEX are set out below.
Source: Capital IQ
Chart 3: Historical COMEX Silver Prices
Silver prices have experienced a rising trend especially in 2010 and the first half of 2011 due to increased investment in silver as a store of value, as well as an industrial metal7. Silver prices were volatile in the second half of 2011 and in 2012, fluctuating between a high of $48.6 in May 2011 to a low of $26.3 in June 2012. As at 4 February 2013, silver prices were US$31.7 per troy oz8.
7 IBISWorld Industry Report B1314 – Silver, Lead and Zinc Ore Mining in Australia, May 2012 8 Capital IQ

39
Appendix 5 – Profile of the Australian Gold Industry
Background
Australia‟s gold resources occur and are mined in all States and the Northern Territory9. 80% of Australia‟s gold
production comes from open-cut mines, with the remaining 20% from underground mines10.
Gold resources
Australia‟s EDR of gold was approximately 8,410 tonnes as at 31 December 2010 compared to 7,399 tonnes as at 31 December 200911 representing an increase of 13.7%. Australia‟s EDR of gold makes Australia the largest demonstrated resource holder of gold followed by South Africa (holding about 6,000 tonnes) and Russia (holding about 5,000 tonnes)12. On the basis of calendar year exploration expenditure reported by the Australian Bureau of Statistics (ABS), gold received the second largest share of exploration expenditure, with iron ore remaining as the dominant target in 2010. Gold exploration spending amounted to $624 million and 25% of total exploration spending. Western Australia continued to dominate gold exploration by attracting $412 million and its share of total gold exploration rose from 60% in 2009 to 66% in 201013.
Gold Production
Australia‟s gold ore production is expected to be circa 278 tonnes in 2011-12, compared with just under 250 tonnes in 2006-07. Gold production is expected to increase over the five years to 2016-17 as new mines commence operation14.
Most gold ore mined in Australia is refined locally and then exported. The value of gold exports is expected to be circa $13.2 billion in 2011-12. Imports of gold bullion to Australia are substantial, amounting to circa $1.9 billion15.
Gold Price
Gold prices are quoted by Commodity Exchange, Inc. (“COMEX”), a division of the New York Mercantile Exchange. The global balance between gold ore output and demand plays a key role in setting gold prices. Continued concerns about conditions in global financial markets and ongoing tension in the Middle East have contributed to rises in the world gold price16.
9 Australian Government, GeoScience Australia, Australia‟s Identified Mineral Resource 2011. 10 IBISWorld Industry Report B1314 – Gold Ore Mining in Australia, September 2012. 11 Australian Government, GeoScience Australia, Australia‟s Identified Mineral Resource 2011. 12 Australian Government, GeoScience Australia, Australia‟s Identified Mineral Resource 2011. 13 Australian Government, GeoScience Australia, Australia‟s Identified Mineral Resource 2011. 14 IBISWorld Industry Report B1314 – Gold Ore Mining in Australia, September 2012. 15 IBISWorld Industry Report B1314 – Gold Ore Mining in Australia, September 2012. 16 IBISWorld Industry Report B1314 – Gold Ore Mining in Australia, September 2012.

40
-
200
400
600
800
1,000
1,200
1,400
1,600
1,800
2,000
2009 2010 2011 2012 2013
US$/troy oz Gold (COMEX) Historical Pricing
Gold price US$ per troy oz
Gold prices (as well as other commodities) are priced in US dollars. Therefore, the revenues of industry participants in Australia are exposed to the volatility in exchange rates, in addition to gold prices
The historical gold prices as quoted on the COMEX are set out below.
Source: Capital IQ
Chart 4: Historical COMEX Gold Prices
Gold prices have steadily increased since 2009, reflecting continued global uncertainty and increased reliance on gold‟s traditional use as a store of value17. As at 4 February 2013 gold prices were US$1,676.4 per troy oz18.
17 IBISWorld Industry Report B1314 – Gold Ore Mining in Australia, September 2012. 18 Capital IQ

41
Appendix 6 – Independent Technical Review and Valuation of the Mt Carrington and Guyra Projects of White Rock Minerals Limited

Independent Technical Review and Valuation of the Mineral Assets of White Rock Minerals Limited January 2013 Goldner and Associates P a g e | 1
GOLDNER & ASSOCIATES ABN 56 667 865 953
Office: Level 9, 80 Mount Street
North Sydney SYDNEY 2060
Ph: .+61 (0)2 8920 0946 Mobil. +61 (0)403 198 415
Fax +61 (0)2 9929 2549
Email: [email protected]
31 January 2013
Attention: Mr Glyn Yates RSM Bird Cameron Level 8, Rialto South Tower 525 Collins Street MELBOURNE, VICTORIA 3000
Dear Sirs,
INDEPENDENT TECHNICAL REVIEW AND VALUATION OF THE MT CARRINGTON AND GUYRA PROJECTS
OF WHITE ROCK MINERALS LIMITED 1.0 INTRODUCTION
The directors of White Rock Minerals (“WRM” or “the Company”) have engaged RSM Bird Cameron Corporate Pty Ltd (“RSM Bird Cameron”) to prepare an Independent Expert’s Report (“IER”) in relation to a proposed transaction with Avalon Ventures Corporation (“Avalon”). A subscription agreement with Avalon was announced on 28 November 2012 whereby Avalon will provide A$4.5 million (“M”) via a placement, in two tranches, of WRM shares.
Tranche 1 comprising 15M WRM shares at A$0.10/share (14.6% of WRM’s diluted share capital) was completed in January 2013 while Tranche 2 comprising 25 million WRM shares at A$0.12/share (a further 16.7% of WRM’s diluted capital) is due for completion in early 2013. As the aggregate of the two tranches exceed 20% of WRM’s share capital shareholder approval is required for Tranche 2 of the transaction. An Independent Expert’s Report (“IER”) with a supporting Independent Geologist’s Report (“IGR”) and valuation is required for distribution to WRM’s shareholders.
By letter dated 27 November 2012 Mr Glyn Yates, Director of RSM Bird Cameron Corporate Pty Ltd (“RSM Bird Cameron”), requested Goldner and Associates (“GA”) to undertake an independent technical review and valuation of WRMs mining and exploration assets and prepare an Independent Specialist’s Report. GA has reviewed the resources and reserves in the context of the JORC Code1 and the valuation and assessment of the WRM mining properties has been conducted in accordance with VALMIN code2.
In the context of the Australian VALMIN code RSM Bird Cameron is the Independent Expert while GA is the Independent Specialist.
RSM Bird Cameron has advised that the relevant mining and exploration assets to be covered in GA’s report (Figure 1) comprise:
The Mt Carrington pre-development and associated precious metal exploration project near Drake in New South Wales (“NSW”)
The Guyra and Glencoe copper-gold exploration projects near Guyra in northeastern NSW
1 Australasian Code for Reporting Exploration Results, Mineral Resources and Ore Reserves prepared by the Joint Committee of the Australasian Institute of Mining and Metallurgy, Australian Institute of Geoscientists and Minerals Council of Australia - The JORC Code - 2004 Edition 2 Code for the Technical Assessment and valuation of Mineral and Petroleum Assets and Securities for Independent Expert Reports – The VALMIN Code - 2005 edition

Independent Technical Review and Valuation of the Mineral Assets of White Rock Minerals Limited January 2013 Goldner and Associates P a g e | 2
GA is a Sydney based mineral industry consultancy whose principal, Peter Goldner, is a geologist experienced in the assessment and valuation of exploration projects. Mr Goldner visited the Mt Carrington project in 2010 as part of a previous independent review in relation to the preparation of the Independent Geologist’s Report for inclusion in WRM’s prospectus. Dr John Chen visited the Mt Carrington project in December 2012 in relation to the current technical review and valuation. The Guyra and Glencoe tenements have not been site visited by GA in the course of the current technical review and valuation.
GA confirms that it is independent of all parties in the proposed transaction and has no material interest in the assets or parties involved. GA understands that RSM Bird Cameron will rely on the GA Valuation Report and that GA’s report, or a summary thereof, will be appended to RSM Bird Cameron Independent Expert Report.
GA has undertaken previous evaluations of the WRM projects on behalf of Rex Minerals Limited (“Rex”) and for WRM as follows:
17 June 2010 – Independent Technical Review and Valuation of Rex Minerals Limited’s Mt Carrington Precious Metals Project, Drake NSW
6 August 2010 – Independent Geologist’s Report, White Rock Minerals Limited – New England Fold Belt Projects, Northeast New South Wales.
GA has not undertaken an audit of the data or re-estimated the resources or reserves. GA has not independently verified the current ownership status and legal standing of the material tenements of WRM that are the subject of this report. GA has been supplied with a tenement report by Australian Mining and Exploration Title Services (“AMETS”) dated 14 January 2013 which indicates that all the material tenements are in good standing.
This report contains forecasts and projections based on data provided by WRM. GA’s assessment of the most likely production schedule, the projected capital and operating costs and the estimate of mine life are based on technical reviews of project data and discussions with technical personnel. However, these forecasts and projections cannot be assured and factors both within and beyond the control of WRM could cause the actual results to be materially different from GA’s assessments and estimates contained in this report.
All references to dollars in this report are stated in terms of Australian dollars (“A$”) unless otherwise specified.
The sole purpose of this GA report is for use by RSM Bird Cameron and the independent directors of WRM and their advisors in connection with the proposed transaction and should not be used or relied upon for any other purpose. A draft copy of the report has been provided to WRM for correction of any material errors or omissions. Neither the whole nor any part of this report nor any reference thereto may be included in or with or attached to any document or used for any other purpose, without our written consent to the form and context in which it appears.

400 Km
Brisbane
Mt IsaMt Isa
Cairns
Townsville
Rockhampton
Armidale
Casino
Broken Hill
Orange
Sydney
Melbourne
QUEENSLANDQUEENSLAND
NEW SOUTH WALESNEW SOUTH WALES
VICTORIAVICTORIA
142°E
142°E
29°S
29°S
Texas
Silver
Project
New England Fold Belt
Lachlan Fold Belt
Other Fold Belts
Basins
Precambrian Basement
White Rock Minerals
Limited Project
Mt CarringtonMt Carrington
Mt Carrington
Guyra Project
ProjectProject
Project
GuyraGuyra
Guyra ELGuyra EL
Glencoe ELGlencoe EL
ProjectProject
L E G E N D
The geological and mineral occurrence map has been reproduced, with Departmental consent,
from the NSW Department of Industry and Investment - Mineral Resources Mapinfo magazine.
Figure 1
WHITE ROCK MINERALS LIMITED
GA-002/001-Jan. 2013
NORTH
PROJECT LOCATIONS ANDTECTONIC/METALLOGENIC SETTING
GOLDNER & ASSOCIATES

Independent Technical Review and Valuation of the Mineral Assets of White Rock Minerals Limited January 2013 Goldner and Associates P a g e | 4
2.0 SUMMARY AND CONCLUSIONS
2.1 Overview
The assets valued in this report consist of:
The Mt Carrington Project consisting of
o Silver-dominant and gold-dominant resources largely within granted mining tenements and on which a scoping study has been completed
o Surrounding Exploration Licence (“EL”) 6273
o Three additional contiguous ELs 6452, 6453 and 7673
The Guyra Project consisting of ELs 7255 and 7395
The project locations are shown on Figure 1 and all tenements are held 100% by WRM subsidiaries.
GA has reviewed technical and financial data supplied by WRM for both projects and where necessary has held discussions with WRM technical personnel and its consultants. A site visit was undertaken to the Mt Carrington Project in December 2012. Site visits to both Mt Carrington and Guyra were previously undertaken in 2010 in the course of preparing the Independent Geologist’s Report for inclusion in WRM’s IPO prospectus.
GA has reviewed the Mt Carrington Project scoping study and has summarised salient information in respect of the proposed development and included relevant comments on various aspects of the scoping study in this report. The Mt Carrington project has however not been valued by GA using the discounted cash flow methodology given that a significant proportion of the potential mining inventory consists of Inferred Mineral Resources.
GA has considered alternative means of valuation to value both the Mt Carrington and Guyra projects and in both cases utilised the Comparable Transaction and Multiple of Past Expenditure methodologies to derive valuation ranges for each project.
2.2 WRM Mineral Assets
2.2.1 Mt Carrington Project
The Mt Carrington Project, consisting of four ELs and 22 assorted mining tenements covering a total area of approximately 467km2, is located near the township of Drake some 100km west of Lismore in northeastern NSW.
The Mt Carrington project area is located within the southern portion of the New England Fold Belt and is predominantly underlain by the Drake Volcanics a 60km long by 20km wide north to northwest-trending sequence of Lower Permian acid to intermediate volcanics dominated by volcaniclastic andesitic units (tuffs, pumaceous tuffs and agglomerates). Within the project area, the host sequence to the known gold and silver mineralisation (the Drake Volcanics) is intruded by contemporaneous sub-volcanic andesite, rhyolite and fine grained to porphyries.
The known precious metal mineralisation consists of a number of predominantly silver-dominant and a few gold-dominant deposits with varying amounts of associated base metals. The deposits, which are considered to represent an intrusion-related low sulphidation epithermal system, occur within a 40km long (northwest-southeast) by 9km wide area, with a concentration of major mineralisation within a 20km diameter circular airborne magnetic feature, the Drake Quiet Zone, considered to represent a volcanic caldera.
Previous mining within the Mt Carrington area has been undertaken in two phases:
1887 to 1908 when gold and silver were mined and recovered from oxide mineralisation with recorded production from the region to totalling about 2,800oz gold and 4,400oz silver.
Mount Carrington Mines Limited (“MCM”) mined the Red Rock and Lady Hampden deposits between 1970 and 1971 and commissioned a carbon-in-pulp processing plant in mid-1988 with ore supplied from open pits developed on a series of deposits within the Mt Carrington group of MLs. Operations ceased in May 1990 when the plant was placed on care and maintenance. In total MCM produced 22,591oz Au and 434,870oz Ag from 485,516 tonnes of ore processed with recoveries averaging 81% for Au and 51% for Ag.
Modern mineral exploration within the Drake district, for a variety of different commodities, has been undertaken by at least 14 companies since the mid-1960s with most exploration concentrated on the Mt Carrington group of leases which contain the majority of the known deposits.

Independent Technical Review and Valuation of the Mineral Assets of White Rock Minerals Limited January 2013 Goldner and Associates P a g e | 5
The Mt Carrington Project was acquired by Rex Minerals Limited (“Rex”) in 2008/2009 and in 2010 the project was demerged from Rex to WRM that has continued to actively explore and evaluate the Mt Carrington Project area and progress the project towards production.
Mineral Resources
The current resource position (as at 4 February 2012), estimated in accordance with the JORC code, is summarised on Table 2.1 and forms the basis for the scoping study completed by mining consultants RMDSTEM in November 2012.
TABLE 2.1
MT CARRINGTON RESOURCE ESTIMATE AS AT 4 FEBRURAY 2012
Tonnes Grade Contained Metal
Category Deposit Gold Silver Gold Silver
Silver Dominant Resources (25g/t Ag cut-off grade)
Mt g/t Au g/t Ag koz Au koz Ag
Indicated Lady Hampden 1.84 0.6 69 37 4,056
Sub-total Indicated 1.84 0.6 69 37 4,056
Inferred
Lady Hampden 2.47 0.3 51 27 4,023
White Rock 4.08 0 62 0 8,194
White Rock North 3.18 0 52 0 5,314
Silver King 0.64 0 59 0 1,218
Sub-total Inferred 10.37 0.1 56 27 18,749
Gold Dominant Resources (0.5g/t Au cut-off grade)
Indicated Strauss 1.24 1.4 3.8 57 153
Kylo 1.59 1.2 2.6 59 133
Sub-total Indicated 2.83 1.3 3.1 116 286
Inferred Strauss 1.26 1.4 2.6 56 104
Kylo 0.76 1.5 1.8 35 43
Guy Bell 0.16 2.5 4.9 13 24
Sub-total Inferred 2.18 1.5 2.4 104 171 Note:
1. There may be rounding errors in the totals and particularly in the contained gold and silver ounces. 2. The resource table above has been developed from the Ravensgate resource report dated 4 February 2012 prepared on
behalf of WRM and authored Mr Don Maclean who is a professional geologist with more than 18 years’ experience. The Guy Bell and White Rock deposit estimates were completed by Gee (2008). Mr MacLean and Mr Gee hold the relevant qualifications and professional associations required by the ASX, JORC and VALMIN codes in Australia.
Scoping Study
The scoping study has not been directly utilised in the valuation methodologies adopted by GA to determine a value for WRM’s projects, a review of the scoping study is provided in Section 5.7 of this report and limited summary data is provided below.
Although there are no current reserve estimates, the RMDSTEM scoping study defined an open pit mineable inventory, based on optimised pit shells as shown on Table 2.2 below.

Independent Technical Review and Valuation of the Mineral Assets of White Rock Minerals Limited January 2013 Goldner and Associates P a g e | 6
TABLE 2.2
SUMMARY OF THE OPEN PIT MINEABLE INVENTORIES FOR THE MT CARRINGTON PROJECT
Deposit Cut-off Grade
(g/t eAg)
Tonnes
(kt)
Silver Grade
(g/t Ag)
Gold Grade
(g/t Au)
MI (Indicated)
Guy Bell (not scheduled) 31.5 125 5.1 2.60
Kylo 31.5 454 2.9 1.34
Lady Hampden 36.7 & 39.6 1,089 69.2 0.84
Silver King 44.3 - 0.0 0.00
Strauss 30.8 800 4.3 1.70
White Rock 40.5 - 0.0 0.00
White Rock North (not scheduled) 35.5 & 40.5 - 0.0 0.00
Sub-total 2,468 32.7 1.30
MI (Inferred)
Guy Bell (not scheduled) 31.5 41 5.2 5.21
Kylo 31.5 209 1.7 2.01
Lady Hampden 36.7 & 39.6 2 73.8 0.47
Silver King 44.3 158 86.3 0.00
Strauss 30.8 282 3.1 1.80
White Rock 40.5 1,619 97.2 0.06
White Rock North (not scheduled) 35.5 & 40.5 4 121.4 0.01
Sub-total 2,315 74.8 1.42
Total 4,783 53.1 0.93
GA has not systematically or comprehensively reviewed the resource block models, the underlying data on which the mineral resource estimate is based, or the optimised pit shell on which the mining inventory estimate is based. It should be noted however that almost 50% of the mining inventory is made up of Inferred Mineral Resources and consequently the full component may not be converted to reserves.
GA considers that the scoping study mine planning, estimates and schedules and equipment selection have been prepared in a professional and reasonable manner for this level of study and the mining recovery and dilution estimates are considered realistic providing best practice mining is adopted at the project.
Estimates of gold and silver recovery from the various Mt Carrington ores are based on the results of preliminary testwork on drill core intercepts representing silver and gold dominant material, the two main ore types defined for this scoping study.
WRM plans to use two similar flowsheets to process the two ore types. Silver dominant material will be processed by producing a flotation concentrate for sale, with the flotation tailing being leached for bullion production. Gold dominant material will be processed to produce flotation concentrate and tailings products, both of which will be leached to produce bullion. Gold and silver recoveries are consistent with preliminary testwork results ranging from 81-86% for silver and 84-88% for gold.
The scoping study was based on a base case scenario of 800,000 tonnes per annum mined and processed over a six-year mine life. The scoping study forecast variable annual silver and gold metal production (from bullion and concentrates) over the mine life (annual silver production varying between 405,000ozs/annum and 2,157,000ozs/annum and annual gold production varying from 1,400ozs/annum and 26,200ozs/annum) depending on ore sources in any given year. This variability has implications with respect to annual revenue.
Exploration Potential
GA considers that exploration potential of the Mt Carrington project is good. A number of the current deposits remain open at depth and along strike and additional step-out drilling is likely to extend these deposits. In addition a number of the mining tenements cover areas of known mineralisation and further exploration, including drilling, may define additional resources.
EL 6273 surrounds the mining tenements and exploration has identified numerous precious metal prospects with potential to yield resources with further exploration. The small White Rock North deposit lies within EL 6273 beyond the boundary of White Rock group of mining tenements. Historical and recent WRM exploration has identified a number of areas and prospects which have potential for copper-dominant deposits. Some of these areas occur in the vicinity of the silver-dominant and gold-dominant resources

Independent Technical Review and Valuation of the Mineral Assets of White Rock Minerals Limited January 2013 Goldner and Associates P a g e | 7
within the Central Mount Carrington mining tenements while some occur beyond the mining tenement boundaries within EL 6273.
ELs 6452 and 6453 have also been subjected to considerable exploration that has identified a number of targets, some with old workings, warranting follow-up investigation. EL 7673 was only granted in 2010 and to date has been subjected to limited regional exploration, including stream sediment sampling. Renewal of this tenement is currently in hand and further exploration is planned.
2.2.2 Guyra Project
The Guyra Project, consisting of EL 7255 (Guyra) located immediately east of Guyra township and EL 7395 (Glencoe) centred on the township of Glencoe some 40km north of Guyra.
Both tenements are considered prospective for porphyry copper-style mineralisation however outcrop of the prospective host units, consisting of granitic intrusives, volcanics and sediments, are limited to small windows within younger basalts which largely obscure basement units in both tenements.
The two main basement inliers (Willow Glen and Washpool) occur adjacent to each other within EL 7255 and the outcropping within the windows consist of altered silty sediments and minor rhyolite volcanics intruded by granite porphyry exhibiting hydrothermal alteration and brecciation. Mapped alteration of the basement units indicates the possible presence of a porphyry-style mineralisation and drilling at both Washpool and Willow Glen, prior to WRM acquiring the project, indicated the presence of alteration and associated low-grade sub-economic mineralisation. WRM has completed a geophysical survey designed to delineate the extent of the porphyry system below the basalt cover. Subsequent drill testing (three core holes) to evaluate a number of the geophysical anomalies, intersected porphyry-style alteration but only narrow zones containing minor sulphide mineralisation.
EL 7395 has had very limited work consisting of compilation of historical exploration data and reconnaissance exploration.
In GA’s opinion the results from work to date are not encouraging and although further work can be justified WRM is attempting to attract another party to fund on-going work.
2.3 Valuation of WRM’s Projects
GA has utilised the Comparable Transaction and Multiple of Past Expenditure valuation methods to establish valuation ranges for both the Mt Carrington and Guyra Projects.
Comparable Transaction Method
In the case of Mt Carrington Comparable Transaction valuation, the 2011 purchase by Kingsgate Consolidated Limited of the Bowdens Silver project has been used. GA has adjusted the value of this transaction to 9 January 2013 (the effective date of the current valuation) to reflect the change in the silver price and derived an acquisition cost in terms of the in-ground silver equivalent ounces. This figure has then been applied to the current in-ground silver equivalent ounces in the current Mt Carrington Resource to derive a Comparable Transaction valuation.
For the Guyra Project a similar procedure was followed, but in this case using the change in the copper price to establish an adjusted value in terms of dollars/km2. This figure was then applied to the current tenure size of the Guyra Project to establish a value.
Multiple of Past Expenditure Method
In applying this methodology GA has established a value of the exploration to date at both projects that has provided WRM with confidential data (i.e. data not freely available in the public domain) that is available for use in its on-going evaluation of the projects. At Mt Carrington this has included historical exploration by Rex and others as well as the exploration to date by WRM. At Guyra only the WRM expenditure has been utilised. A multiple has then been applied to this prior expenditure, on a project component basis, with the multiples selected based on GA’s assessment of the exploration status of each of the project components as described more fully in Section 3.4 of this report.
A summary of GA’s valuation ranges and Preferred Value is shown in Table 2.3 below.
GA considers that the Comparable Transaction valuation using the Bowdens acquisition is a better guide to the value of Mt Carrington Project than the valuation based on the Multiple of Past Expenditure. Consequently GA’s preferred value for Mt Carrington is towards the lower end of the range rather than the midway point between the Low and High value range in Table 2.3.

Independent Technical Review and Valuation of the Mineral Assets of White Rock Minerals Limited January 2013 Goldner and Associates P a g e | 8
TABLE 2.3
VALUATION SUMMARY OF THE WRM MINERAL ASSETS
Project Comparable Transaction Multiple of Past Expenditure Low High GA Preferred
Value Value Range
A$M A$M A$M A$M A$M A$M
Mt Carrington 17.11 40.29 43.62 17.11 43.62 24.00
Guyra 0.46 0.74 0.86 0.46 0.86 0.66
Totals 17.57 41.03 44.48 17.57 44.48 24.66
GA’s assessed value of the WRM projects totals A$24.66M within a range of A$17.57M and A$44.48M

Independent Technical Review and Valuation of the Mineral Assets of White Rock Minerals Limited January 2013 Goldner and Associates P a g e | 9
3.0 VALUATION PRINCIPLES AND METHODOLOGIES
3.1 Effective Date of Valuation, Metal Prices and Foreign Exchange Rate
The effective date for the valuation is 9 January 2013. Where appropriate, GA has used metal prices and the exchange rate at the effective date for the valuation of the exploration potential of WRM’s projects. Where the Comparable Transaction methodology has been used the relevant dates and metal prices are provided in Section 7 of this report.
TABLE 3.1
METAL PRICES AND EXCHANGE RATES USED IN THE VALUATION OF WRM’S PROJECTS
Unit US$ A$ Effective Date – 9 January 2013
Silver oz. 30.20 28.70 Gold oz. 1,658 1,578 FX AUD/USD 1.051 Notes:
1. oz. = troy ounce 2. FX = Exchange rate
In GA’s opinion the Mt Carrington Project is appropriately considered as a silver-dominant project given the overall contained silver and gold in the current resources. Consequently in applying the Comparable Transaction method to establish a value for the Mt Carrington project it has been necessary to convert the gold to a silver equivalent (“eAg”) value using the metal prices in Table 3.1 above as follows:
1oz Au = the US$ price of gold divided by the US$ price of silver which at the effective date equates to (1,658/30.20)oz. eAg = 55oz eAg
3.2 Standards and Procedures
This report has been prepared in keeping with the VALMIN Code for the Technical Assessment and Valuation of Mineral Assets and Securities for Independent Expert Reports as adopted by the Australasian Institute of Mining and Metallurgy in 1995 and as amended and updated in 2005. Resource and reserve estimation procedures and categorisations have been reviewed in terms of the JORC Code, December 2004.
3.3 Valuation - General Principles
The fair market value of a property as stated in the VALMIN Code (Definition 43) is the amount of money (or cash equivalent of some other consideration) that an asset should change hands on the valuation date in an open and unrestricted market between a willing buyer and a willing seller in an arms-length transaction, with each party acting knowledgeably, prudently and without compulsion.
3.4 Valuation Methodologies
There is no single method of valuation which is appropriate for all situations. Rather, there are a variety of valuation methods, all of which have some merit and are more or less applicable depending on the circumstances. The Australian Securities and Investment Commission in its Practice Note 43 on Valuation Methodology list the following as appropriate items to be considered:
Discounted cash flow.
Amount an alternative acquirer might be willing to offer.
The most recent quoted price of listed securities.
The current market price of the asset, securities or company.
The discounted cash flow or net present value method is generally regarded as the most appropriate primary valuation tool for operating mines or mining projects close to development. Valuing properties at an earlier stage of exploration where ore reserves, mining and processing methods, and capital and operating costs, are yet to be fully defined, involves the application of alternative methods. The methods generally applied to exploration properties are the related transaction or real estate method, the value indicated by alternative offers or by joint venture terms, and the past expenditure method. Rules of thumb or yardstick values based on certain industry ratios can be used for both mining and exploration properties. Under appropriate circumstances values indicated by stock market valuation should be taken into account as should any previous independent valuations of the property.
The valuation methods considered are briefly described below.

Independent Technical Review and Valuation of the Mineral Assets of White Rock Minerals Limited January 2013 Goldner and Associates P a g e | 10
Net Present Value (NPV)
If a project is in operation, under development, or at a final feasibility study stage and reserves, mining and processing recoveries, and capital and operating costs are well defined, it is generally accepted that the net present value of the project cash flows is a primary component of any valuation study. This does not imply that the fair market value of the project necessarily is the NPV, but rather that the value should bear some defined relationship to the NPV.
If a project is at the feasibility study stage, additional weight has to be given to the risks related to uncertainties in costs and operational performance, risks related to the ability to achieve the necessary finance for the project and sometimes a lower degree of confidence in the reserves and recoveries. In an on-going operation many of these items are relatively well defined.
The NPV provides a technical value as defined by the VALMIN Code (Definition 36). The fair market value could be determined to be at a discount or a premium to the NPV due to other market or risk factors. In the case of the Mt Carrington project, the scoping study was based on a mining inventory that was based on a substantial proportion of Inferred Mineral Resources. Under the JORC Code Inferred Mineral Resources must be elevated to higher resource categories (i.e. Indicated or Measured Mineral Resources) before they can be converted to reserves. Consequently it was considered by RSM Bird Cameron and GA inappropriate to apply the discounted cash flow methodology to the valuation of the Mt Carrington Project.
Alternative Valuation Methods
Related Transactions
Recent comparable transactions can be relevant to the valuation of projects and tenements. While it is acknowledged that it can be difficult to determine to what extent the properties and transactions are indeed comparable, unless the transactions involve the specific parties, projects or tenements under review, this method can provide a useful benchmark for valuation purposes. The timing of such transactions must be considered as there can be substantial change in value with time.
GA has considered whether any comparable relevant transactions have taken place in recent years which can be used as a basis for estimation of value of the exploration project assets assessed herein. GA has used the comparable transaction method for both WRM projects.
Alternative Offers and Joint Venture Terms
If discussions have been held with other parties, and offers have been made on the project or tenements under review, then these values are relevant and worthy of consideration in any valuation exercise. Similarly, joint venture terms where one party pays to acquire an interest in a project, or spends exploration funds in order to earn an interest, provide an indication of value.
Rules of Thumb or Yardsticks
Certain industry ratios are commonly applied to mining projects to derive an approximate indication of value. The most commonly used ratios relate to gold projects and comprise dollars per ounce of gold in resources, dollars per ounce of gold in reserves, and dollars per ounce of annual production. The ratios used commonly cover a substantial range which is generally attributed to the ‘quality’ of the ounces in question. Low cost ounces are clearly worth more than high cost ounces.
Multiple of Past Expenditure
Past expenditure, or the amount spent on exploration of a tenement is commonly used as a guide in determining the value of exploration tenements, and ‘deemed expenditure’ is frequently the basis of joint venture agreements. The assumption is that well directed exploration has added value to the property. This is not always the case and exploration can also downgrade a property and therefore a ‘prospectivity enhancement multiplier’ (“PEM”), which commonly ranges from 0.5-3.0, is applied to the effective expenditure. The selection of the appropriate multiplier is a matter of experience and judgement. To eliminate some of the subjectivity with respect to this method, GA has applied a scale of PEM ranges as follows to the exploration expenditure:
PEM 0.5 - 0.9 Previous exploration indicates the area has limited potential.
PEM 1.0 - 1.4 The existing (historical and/or current) data consists of pre-drilling exploration and the results are sufficiently encouraging to warrant further exploration.
PEM 1.5 - 1.9 The prospect contains one or more defined significant targets warranting additional exploration.
PEM 2.0 - 2.4 The prospect has one or more targets with significant drill hole intersections.

Independent Technical Review and Valuation of the Mineral Assets of White Rock Minerals Limited January 2013 Goldner and Associates P a g e | 11
PEM 2.5 - 2.9 Exploration is well advanced and infill drilling is required to define a resource.
PEM 3.0 A resource has been defined but a (recent) pre-feasibility study has not yet been completed.
GA has used this method in establishing a valuation range for both the WRM projects.
Prospectivity
Over-riding any mechanical or technical valuation method for exploration ground must be recognition of prospectivity and potential, which is the fundamental value in relation to exploration properties.
Market Valuation
On the fundamental definition of value, as being the amount a knowledgeable and willing buyer would pay a knowledgeable and willing seller in an arm’s length transaction, it is clear that due consideration has to be given to market capitalisation. In the case of a one project company or a company with one major asset, the market capitalisation gives some guide to the value that the market places on that asset at that point in time, although certain sectors may trade at premiums or discounts to net assets, reflecting a view of future risk or earnings potential. Commonly however a company has several projects at various stages of development, together with a range of assets and liabilities, and in such cases it is difficult to define the value of individual projects in terms of the share price and market capitalisation.
Other Expert Valuations
Where other independent experts or analysts have made recent valuations of the same or comparable properties these opinions clearly need to be reviewed and to be taken into consideration. Apart from a valuation undertaken by GA in June 2010 in respect to the demerger of Mt Carrington from Rex to enable to project to be transferred to WRM, the Company has advised GA that no other recent valuations of the company or its assets have been undertaken.
Special Circumstances
Special circumstances of relevance to mining projects or properties can have a significant impact on value and modify valuations which might otherwise apply. Examples could be:
environmental risks - which can result in a project being subject to extensive opposition, delays and possibly refusal of development approvals
indigenous peoples/land rights issues - projects in areas subject to claims from indigenous peoples can experience prolonged delays, extended negotiations or veto
country issues - the location of a project can significantly impact on the cost of development and operating costs and has a major impact on perceived risk and sovereign risk
technical - issues peculiar to an area or orebody such as geotechnical or hydrological conditions, or metallurgical difficulties could affect a project’s economics.
GA has considered, and has inquired of WRM, whether any such factors apply to the projects and prospects under review.

Independent Technical Review and Valuation of the Mineral Assets of White Rock Minerals Limited January 2013 Goldner and Associates P a g e | 12
4.0 INFORMATION SOURCES
GA has undertaken site visits to the WRM’s Mt Carrington project in 2010 and most recently in December 2012. GA prepared the Independent Geologist’s Report included in WRM’s 2010 prospectus.
Geological, mining, processing and engineering data have been reviewed with WRM’s technical and management staff as required.
The principal reports and documents reviewed are listed below:
WRM - Public Information
Annual and Quarterly Reports - 2011, 2012
Stock Exchange and Press Announcements - 2011, 2012
Company Web Page www.whiterockminerals.com.au
Technical Data
Clarke, Mwaba
D C
Nov, 2012 Scoping Study for the Mt Carrington Project RMDSTEM Limited
Corbett G Sept. 2011 Comments on Recent Exploration in the Mt Carrington Region, Eastern Australia
Corbett Geological Services Pty Ltd
Cumming G Nov. 2011 New Geological Constraints for the Drake Volcanics, Drake Area, Northern NSW
Goldner P Aug 2010 Independent Geologist’s Report, White Rock Minerals Limited – New England Fold Belt Projects, Northeast New South Wales
Goldner and Associates
Goldner P Jun 2010 Independent Technical Review and Valuation of Rex Minerals Limited’s Mt Carrington Precious Metals Project, Drake NSW
Goldner and Associates
Horwood D.J. 27 Sept 2011
Annual Report 2011, Exploration Licence EL 7395 for Period 1st September 2010 to 31st August 2011, Glencoe District NSW
WRM
Horwood D.J. 27 Sept 2011
Annual Report 2012, Glencoe Exploration Licence EL 7395 for Period 1st September 2011 to 31st August 2012, Glencoe District NSW
WRM
Lee A 14 Jan 2013
Independent Tenement Report, Mt Carrington and Guyra Projects, White Rock Minerals
AMETS
Lowe G.M. 25 Oct 2010
Annual Report 2009, Exploration Licence EL 7395 for Period Ending 1 September 2010 Glencoe District NSW
Maclean D Jan 2012 White Rock North January 2012 JORC (2004) Resource Estimate
Ravensgate
Maclean Hyland
D S
Feb 2012 Independent Resource Estimate on the Mt Carrington Ag-Au Project in New South Wales for White Rock Minerals Ltd
Ravensgate
Mine Comp Jun 2012 Mt Carrington Project Preliminary Optimisation Study Ravensgate May 2011 Resource Review on the Mount Carrington Au-Ag-Cu
Project in New South Wales for White Rock Minerals Ltd
RSM Bird Cameron
Jun 2010 Rex Minerals Limited. Valuation of White Rock Minerals Limited as at 15 June 2010
Sexton M.A. Nov/Dec 2010
IP/Resistivity Survey at Guyra NSW WRM
White Rock Minerals Limited
30 Nov 2012
Information Memorandum: Guyra Copper – Gold Project, Guyra District, Northeastern NSW, Australia
Worland R.J. 11 Aug 2011
Guyra Annual Report 2010, Exploration Licence 7255 for Period 2nd December 2009 to 1st December 2010
WRM
Worland R.J. 21 Dec 2011
Guyra Annual Report 2011, Exploration Licence 7255 for Period 2nd December 2010 to 1st December 2011
WRM
Zokowski W Apr 2011 Geology, Mineralisation and Alteration Features at Guyra Copper-Gold Porphyry Prospect, NSW Australia

Independent Technical Review and Valuation of the Mineral Assets of White Rock Minerals Limited January 2013 Goldner and Associates P a g e | 13
5.0 MT CARRINGTON PRECIOUS METALS PROJECT
5.1 Location, Tenure, Native Title and Environment
Location and Access
The Mt Carrington Project, consisting of four ELs and 22 assorted mining tenements, is located near the township of Drake some 100km west of Lismore in northeastern NSW.
Access from Lismore to Drake is via the sealed Bruxner Highway and the current WRM site office, located approximately 5km north of Drake within the central Mt Carrington group of MLs, is accessed from Drake by unsealed public road.
Tenure
GA has been provided with an independent tenement report prepared by AMETS dated 14 January 2013 detailing the tenement status of WRM’s project areas and a letter dated 31 January 2013 from AMETS to this effect is included in Appendix 1 of this report. GA has relied on the information included in the AMETS report in the preparation of this valuation.
The details of the current Mt Carrington Project tenements are summarised in Table 5.1 below and the tenements are shown on Figure 1. Apart from EL 6453, from which Rex had relinquished 2 sub-blocks, and the grant of EL 7673, which was an EL application at the date of the demerger from Rex, some of the tenements in Table 5.1 have been reduced in size since the Rex demerger.
All tenements are held in the name of White Rock (MTC) Pty Ltd, a wholly owned subsidiary of WRM.
TABLE 5.1
MT CARRINGTON PROJECT TENEMENTS
Tenementa Name Approximate Area
Expiry Date Bond# (A$)
Annual Expenditure Commitment (A$)b
Exploration Tenements km2 EL 6452 North Carrington 136 21/07/2013 10,000 75,000 EL 6273 Central Carrington 184 14/07/2014 45,000 91,000 EL 6453 South Carrington 57 21/07/2013 10,000 49,000 EL 7673c Boorook 90 21/12/2014 10,000 na Total ELs 467 75,000 Mining Tenements Central Mt Carrington Group ha ML 1147 Drake 356.4 08/12/2020 20 men or 140,000 MPL 256 Tailings 54.73 08/12/2020 Nil, 30m depth restriction MPL 259 Lake Humphries 151.4 08/12/2020 Nil, 30m depth restriction SL 409 Lady Hampton 47.45 08/12/2020 Nil ML 1149 Lady Hampton East 51.19 08/12/2020 4 men or 70,000 MPL 24 Lady Hampton East 51.19 08/12/2020 Nil, 15m depth restriction ML 1150 Lady Hampden South 30.0 08/12/2020 4 men or 70,000 ML 1148 Cheviot Hills Rd 3.15 08/12/2020 2 men or 35,000 ML 5883b Silver King 11.33 08/12/2020 6 men or 365,000 ML 5444b Mt Carrington Pit South 2.68 08/12/2020 6 men or 365,000 GL 5477b Guy Bell 2.47 08/12/2020 6 men or 365,000 GL 5478b Guy Bell 0.40 08/12/2020 6 men or 365,000 Red Rock Group ML 6335b Red Rock 19.51 08/12/2020 6 men or 365,000 ML 6242b Red Rock North 16.19 08/12/2020 6 men or 365,000 ML 6295b Red Rock South 23.88 08/12/2020 6 men or 365,000 MPL 1345 Red Rock Far South 0.81 08/12/2020 Nil, 15m depth restriction White Rock Group ML 6004b White Rock 16.16 08/12/2020 6 men or 365,000 ML 6006b White Rock Ext 1 8.09 08/12/2020 6 men or 365,000 SL 471 White Rock Ext 2 56.66 08/12/2020 Nil Adeline SL 492 Adeline 2.14 08/12/2020 Nil Mascotte ML 6291b Mascotte 25.9 08/12/2020 6 men or 365,000 Lady Jersey ML 1200 Lady Jersey 8.75 08/12/2020 2 men or 35,000 Total MLs 940.48 682,500d Notes:
a. EL – Exploration Licence; ML – Mining Lease; GL – Gold Lease; MPL – Mining Purpose Lease; SL – Special Lease. b. The manning and expenditure obligations are aggregated. c. A renewal of EL 7673 has been submitted; the area of the tenement is as included in the renewal application; the
expenditure commitment will not be known until the renewal is obtained. d. The bond of $682,500 is an aggregated amount for all the lease areas.

Independent Technical Review and Valuation of the Mineral Assets of White Rock Minerals Limited January 2013 Goldner and Associates P a g e | 14
Native Title
GA has not reviewed the status of any Native Title claims but notes that the AMETS report indicates that a Native Title Claim Application by the Western Bundjalung People has been lodged over the Mt Carrington Project tenements.
Project Components
For descriptive and valuation purposes in parts of this report it has been necessary to subdivide the Mt Carrington project into a number of individual components as detailed in Table 5.1 and shown on Figure 2:
Mining tenements within EL 6273
o The Central Mt Carrington Group consisting of a contiguous block of 12 tenements (the Lady Hampden, Strauss, Kylo, Silver King and Guy Bell resources lie within these tenements)
o The Red Rock Group consisting of four contiguous mining tenements
o The White Rock Group consisting of three contiguous mining tenements (the White Rock resources lies within these tenements however the White Rock North resource lies outside these tenements but within EL 6273)
o Adeline SL 492
o Mascotte ML 6291
o Lady Jersey ML 1200
The remaining area of EL 6273 (i.e. excluding the internal mining tenements)
EL 6452
EL 6453
EL7673
5.2 Production and Exploration History
Production History
Gold was initially discovered at Adeline and then Mt Carrington both in 1886. From 1887 to 1908 gold and silver were mined and recovered from oxide mineralisation with recorded production from the region to 1988 totalling about 2,800oz gold (“Au”) and 4,400oz silver (“Ag”).
In recent times Mount Carrington Mines Limited (“MCM”) mined the Red Rock and Lady Hampden deposits between 1970 and 1971 and commissioned a carbon-in-pulp processing plant in mid-1988 with ore supplied from open pits developed on a series of deposits within the Mt Carrington group of MLs (Table 5.1 above and Figure 1). The Guy Bell and North Kylo pits were closed in September 1988 due to high stripping ratios and lower than predicted grades followed by the Strauss pit in February 1989 due to poor metallurgical recovery caused by secondary copper. The operation then treated ore from Lady Hampden and Mt Carrington with all operations ceasing in May 1990 when the plant was placed on care and maintenance. In total MCM produced 22,591oz Au and 434,870oz Ag from 485,516 tonnes of ore processed with recoveries averaging 81% for Au and 51% for Ag.
Exploration History
Mineral exploration within the Drake district, for a variety of different commodities, has been undertaken by at least 14 companies since the mid-1960s with most exploration concentrated on the Mt Carrington group of leases which contain the majority of the known deposits. The main exploration activities were as follows:
CRA Exploration (“CRAE”), in joint venture with MCM, explored the area for large polymetallic deposits for a period of about 4 years following the cessation of mining by MCM.
Following the withdrawal of CRAE, MCM went into receivership and was acquired by Norminco Pty Ltd, subsequently renamed Virotec International Limited (“VIL”) who used the Mt Carrington site as a case study for research into tailings rehabilitation.
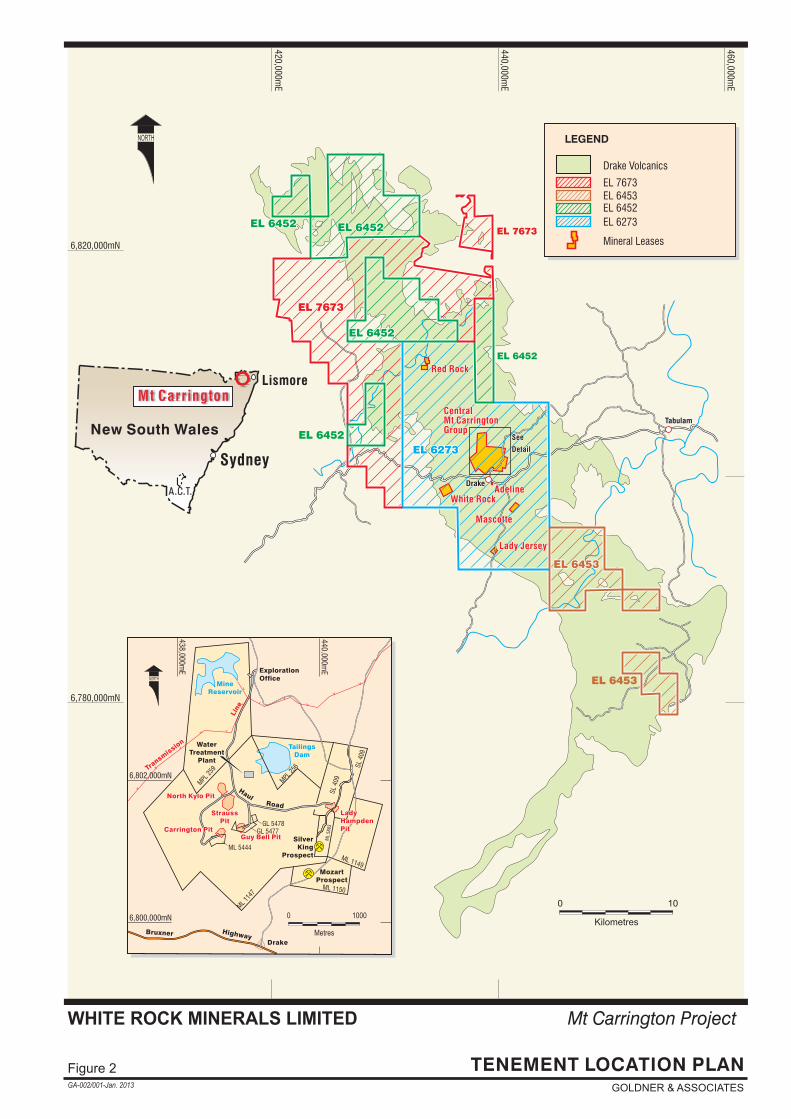
EL 6452EL 6452 EL 6452EL 6452
EL 6452
EL 6452
EL 6452EL 6452
EL 6453EL 6453
EL 6453
EL 6273EL 6273
EL 7673EL 7673
EL 7673
6,820,000mN
420,0
00m
E
440,0
00m
E
460,0
00m
E
6,780,000mN
New South Wales
Mt Carrington
A.C.T.A.C.T.
Sydney
Lismore
ML
1147
MPL
259
MPL
256
ML 1150
ML
5883
SL
409
SL
409
ML 1149
ML 5444
GL 5477GL 5478
North Kylo PitNorth Kylo Pit
Strauss
Pit
Strauss
Pit
Carrington PitCarrington PitGuy Bell PitGuy Bell Pit Silver
King
Prospect
Mozart
Prospect
Drake
Water
Treatment
Plant
Tailings
Dam
Mine
Reservoir
Exploration
Office
Transm
issio
n
Bruxner
Haul
Highway
Road
Lin
e
Lady
Hampden
Pit
Lady
Hampden
Pit
43
8,0
00
mE
44
0,0
00
mE
6,802,000mN
6,800,000mN
NORTH
10000
Metres
See
Detail
See
Detail
Red RockRed Rock
CentralMt CarringtonGroup
CentralMt CarringtonGroup
Lady JerseyLady Jersey
DrakeDrake
TabulamTabulam
White RockWhite RockAdelineAdeline
MascotteMascotte
Drake Volcanics
Mineral Leases
LEGEND
EL 6452
EL 7673
EL 6273
EL 6453
Figure 2
WHITE ROCK MINERALS LIMITED
NORTH
TENEMENT LOCATION PLAN
GOLDNER & ASSOCIATES
Mt Carrington Project
GA-002/001-Jan. 2013
100
Kilometres

Independent Technical Review and Valuation of the Mineral Assets of White Rock Minerals Limited January 2013 Goldner and Associates P a g e | 16
In 2004 Drake Resources Limited (“DRL”) entered into an option to acquire a 90% interest in the MLs with Cazaly Resources Limited (“CRL”) having the remaining 10% interest. DRL acquired three ELs (ELs 6273, 6452 and 6453) over an area of approximately 450km2 and completed a compilation and revision of the numerous databases of the results of previous exploration and compiled the information into a spatial database. This included:
o A total of 2,213 drill holes and over 77,500 samples entered into an Access database.
o Compilation of the available stream sediment and regional soil sampling results.
o Compilation of airborne magnetic and radiometric surveys flown in 1998 for MCM at 250m line spacing; airborne EM flown by Amoco Minerals over portion of the area in the 1980s; airborne DIGEM flown by CRAE in 1990.
In 2008 Rex Minerals Limited (“Rex”) entered into an option arrangement to purchase 100% of the Mt Carrington Project and subsequently exercised the option in 2009.
In 2010, the Mt Carrington Project was demerged from Rex into WRM who now own 100% of the project. WRM has continued to actively explore the Mt Carrington Project area and progress the project towards production.
5.3 Geology
Regional Geology and Mineralisation
The White Rock projects are located within the New England Fold Belt (“NEFB”), which extends from Newcastle in New South Wales to Townsville in Queensland as shown on Figure 1. The NEFB, the easternmost portion of the much larger Tasman Fold Belt, is a geologically complex terrain having been formed over a long, tectonically active, period (Devonian to Permian) of crustal development by the accretion of oceanic sediments and volcanics during subduction. The volcanic and sedimentary sequences of the NEFB have been intruded by numerous granitoid plutons and associated igneous bodies. Several phases of major tectonic disruption have resulted in considerable folding and faulting. Younger sedimentary basins cover parts of the NEFB.
The NEFB is characterised by a diverse variety of metallic mineral deposits and prospects, which in Queensland, include the Mt Morgan copper-gold deposit west of Rockhampton and the high grade Gympie gold mine. In New South Wales almost 6,000 metalliferous occurrences have been documented and include a wide variety of mineralisation styles with a diversity of metal associations (Figure 1). This includes, but is not limited to: granite-hosted gold (e.g. Timbarra); quartz vein hosted gold + antimony (e.g. Hillgrove); vein-hosted silver deposits often with associated zinc, lead and tin, granite and vein-hosted tin and skarn-hosted tungsten.
Mt Carrington Precious Metal Deposit Geology and Mineralisation
The Mt Carrington project area is located within the southern portion of the NEFB and is predominantly underlain by the Drake Volcanics a 60km long by 20km wide north to northwest-trending sequence of Lower Permian acid to intermediate volcanics dominated by volcaniclastic andesitic units (tuffs, pumaceous tuffs and agglomerates). Within the project area, the host sequence to the known gold and silver mineralisation (the Drake Volcanics) is intruded by contemporaneous sub-volcanic andesite, rhyolite and fine grained porphyries. The unit has an estimated thickness of 600m in the Red Rock area while within the Mt Carrington group of MLs; it is at least 500m thick.
To the east the Drake Volcanics unconformably overlie the Upper Carboniferous Emu Creek Beds (sediments and volcanics) while to the west the Drake Volcanics are conformably overlain by the Late Permian Gilgurry Mudstone and are also intruded by younger (probably Late Permian to Early Triassic) granitoids. The known precious metal mineralisation, consists of a number of predominantly silver (“Ag”)-dominant and a few of gold (“Au”)-dominant deposits with varying amounts of associated base metals; mainly copper (“Cu”) and zinc (“Zn”).
The deposits, which are considered to represent an intrusion-related low sulphidation epithermal system, occur within a 40km long (northwest-southeast) by 9km wide area, with a concentration of major mineralisation within a 20km diameter circular airborne magnetic feature (Figure 3). This feature, which is distinguished by its flat magnetic relief, is known as the Drake Quiet Zone (“DQZ”) and is considered to represent a volcanic caldera.

EL 7673
EL 7673EL 6452EL 6452
EL 6452
EL 6452
EL 6452
EL 6452EL 6452
EL 6453EL 6453
EL 6453
EL 6273EL 6273
6,820,000mN
420,0
00m
E
440,0
00m
E
6,800,000mN
6,780,000mN
Red Rock
CentralMt CarringtonGroup
Lady Jersey
Drake
Tabulam
White RockAdeline
Mascotte
Girard WestGirard West
MarinersMariners
MurrayMurray
Red RockRed Rock
Rocky CreekRocky Creek
North WhiteRock
North WhiteRock
Junction NorthJunction North
PlumbagoPlumbago
MandrakeMandrake
Area BArea B
Nobles Creek NorthNobles Creek North
Drake Volcanics
EL 6452
EL 7673
EL 6273
EL 6453
Interpreted DQZ Extent
Priority A Target
Priority B Target
Priority C Target
Mineral Leases
LEGEND
Figure 3
WHITE ROCK MINERALS LIMITED
NORTH
REGIONAL EXPLORATION TARGETS
GOLDNER & ASSOCIATES
Mt Carrington Project
GA-002/001-Jan. 2013
50
Kilometres

Independent Technical Review and Valuation of the Mineral Assets of White Rock Minerals Limited January 2013 Goldner and Associates P a g e | 18
Within the project area, and particularly within the main central Mt Carrington group of leases, the known deposits, all hosted by the Drake Volcanics, display a variety of mineralisation styles ranging from sheeted, stockwork and breccia-hosted quartz-sulphide veins, to disseminated mineralisation. Current interpretations of the known deposits suggests the presence of a broad metal zonation ranging from deeper and hotter gold-copper mineralisation, represented by the Kylo and Strauss deposits, through to cooler and shallower gold-dominant mineralisation, such as at Guy Bell, to a halo of silver-zinc mineralisation at Lady Hampden and White Rock.
The gold-dominant mineralisation is associated with quartz veining occurring as vein stockworks and/or as sheeted and fissure-filled veins, hosted in andesitic volcanics and volcaniclastic sediments usually located proximal to fine grained andesitic or rhyolitic intrusive bodies. The sulphides present variously include pyrite, chalcopyrite, sphalerite and galena; chalcocite is present in the supergene zone in a number of areas. In the primary zone, the gold predominantly occurs as electrum.
In the silver-dominant deposits the mineralisation tends to occur as stratabound, pervasive, disseminated and matrix replacement mineralisation and in stockwork sulphide-bearing veins in altered tuffaceous lithologies and in rhyolite. Mineralisation consists of pyrite with minor associated sphalerite, galena, chalcopyrite, tennantite-tetrahedrite, a variety of silver sulphosalts and electrum.
The salient features of each deposit for which a resource has been estimated are summarised on Table 5.2 below.
TABLE 5.2
GENERAL FEATURES OF THE MT CARRINGTON DEPOSITS
Deposit Controls to Mineralisation Other
Lady Hampden
Mineralisation is partially stratabound within gently east-dipping stratigraphy and controlled by the intersection of bedding plane shears and their intersection with the regional Cheviot Hills Fault.
Defined Indicated Resource extends from the pit floor to 75m below surface with Inferred Resource extending to 250m depth.
White Rock and White Rock North
Mineralisation hosted in a zone of chalcedonic quartz stockwork and coarse brecciation in a rhyolite sill intruded into flat lying dacite and andesite flows.
Silver-bearing sulphide (sphalerite) mineralisation is best developed around the southern margin of the sill and has a strong east northeasterly orientation in plan. Higher silver grades concentrated on the margins and in the roof of the intrusive.
Silver King Similar to and south of Lady Hampden with mineralisation partially within gently east-dipping stratabound zone and bedding-parallel shears at the intersection with the Cheviot Hills Fault.
Resource extends from surface to 40m depth with mineralisation open to the north, south and down dip to the east with good potential to increase the resource.
Strauss Mineralisation occurring in four distinct but related zones:
as steeply dipping north northeast trending quartz sulphide fissure veins within flat-lying andesites
a stockwork zone in the margin of the andesite
lithologically controlled, contact related stockwork and through-going veins in tuffs and tuffaceous sandstones
high frequency stockwork veining in the lower andesite intrusions.
The resource extends to 120m below surface with the upper parts of the deposit previously mined in a small open pit.
Kylo/Kylo North
Mineralisation occurs within vein stockwork zones on the margins of a quartz andesite intrusion.
The resource extends from surface to 220m depth and occurs as two zones, Kylo North and Kylo West. The upper part of the deposit was previously mined by a small open pit. Considered to have potential to increase the resource in the footwall of Kylo West and Kylo North remains open at depth.
Guy Bell Mineralisation occurs in a number of fissure quartz lodes and quartz veins which are interpreted to be hosted within the Mt Carrington Andesite.
Two northeast trending and steeply northwest dipping lodes mapped in the Guy Bell pit separated by about 10m.

Independent Technical Review and Valuation of the Mineral Assets of White Rock Minerals Limited January 2013 Goldner and Associates P a g e | 19
5.4 Exploration Undertaken by Rex and WRM
5.4.1 Exploration by Rex
Prior to the demerger from Rex, and during the period that Rex held an option to purchase the Mt Carrington project, work had largely consisted of:
a comprehensive review of the available technical reports
integration of the historical drilling and assay data
re-estimation of the resources and some confirmatory drill testing.
Subsequent to exercising the option to purchase the project but prior to the demerger from Rex, work included:
regional stream sediment sampling over ELs 6273, 6452 and 6453
reprocessing of airborne magnetic and radiometric survey data flown by MCM and earlier electromagnetic surveys flown by CRAE
completion of a high-resolution airborne magnetic survey and some limited drill testing of the White Rock North Prospect
a gradient array Induced Polarisation (“IP”) survey over the Mt Carrington Group MLs and a dipole IP survey over the White Rock and Mt Carrington Group MLs
two further drilling programs in the Kylo, All Nations, Strauss and White Rock areas as well as some drill testing of IP targets.
5.4.2 Exploration by WRM
Following the public listing of WRM in 2010, as a consequence of the demerger of the Mt Carrington project from Rex, WRM has continued to actively explore and evaluate the Mt Carrington project tenements as summarised on Table 5.3.

Independent Technical Review and Valuation of the Mineral Assets of White Rock Minerals Limited January 2013 Goldner and Associates P a g e | 20
TABLE 5.3
SUMMARY OF WORK UNDERTAKEN BY WRM SUBSEQUENT TO THE DEMERGER FROM REX SUBDIVIDED INTO THE PROJECT COMPONENTS
Mining Tenements Exploration Licences Central Carrington Leases
White Rock Red Rock Lady Jersey
6273, 6452, 6453 7673
DDH drilling for resource definition and deposit extensions
Review of geological controls, alteration, mineralisation characteristics
Detailed review of advanced prospects to recommend work to upgrade to resources
On-going deposit modelling
Review of historical grade control information
Reprocessing of historical IP data and trial IP and resistivity surveys at Lady Hampden
Soil and rock chip sampling
Petrographic studies Resource estimations Metallurgical
testwork
Prospect scale mapping
Rock chip and soil sampling
Resource estimations Metallurgical
testwork
Prospect scale mapping
Rock chip and soil sampling
Four DDH
Rock chip and soil sampling
Review of historical open file reports
Infill stream sediment sampling
Eight DDH on the White Rock North prospect (outside the MLs)
Two DDH on Mandrake; 1 DDH on both Junction North and Red Rock
Detailed mapping of the DQZ
Pole-dipole IP and resistivity surveys over regional prospects within ELs 6273 and 6452
Soil sampling over White Rock North, Junction north, Gerard West, Kimberley, mandrake Tea Tree and Area B prospects
Rock chip sampling
Detailed mapping of the DQZ
Infill stream sediment sampling
Detailed mapping of the DQZ
Effectively all the expenditure by DRL, subsequently by Rex and then WRM has generated valuable exploration data that remains confidential to Rex.
5.5 Acquisition Cost and Exploration Expenditures
5.5.1 Rex
Rex initially acquired the Mt Carrington Project from DRL and CRL in April 2009 for A$985,000 and the issue of 2,000,000 Rex shares, which for the purposes of the acquisition were valued at A$0.7575. Consequently the total nominal acquisition cost was A$2.5M.
In GA’s opinion this represents an appropriate basis of establishing the value of the exploration at the date of the acquisition by Rex.
Between April 2009 and June 2010 when the project was demerged to WRM, Rex’s expenditure totalled A$3.99M consisting of:
A$2.72M on the mining lease areas (including expenditure to address some environmental issues inherited from the previous project owners)
A$1.27M on ELs 6273, 6452 and 6453 comprised of
o $0.84M on EL 6273
o $0.23M on EL 6452
o $0.20M on EL 6453
EL 7673 was applied for but not granted during this period and consequently no expenditure on this area had been incurred.

Independent Technical Review and Valuation of the Mineral Assets of White Rock Minerals Limited January 2013 Goldner and Associates P a g e | 21
5.5.2 WRM
The project was demerged from Rex prior to WRM’s initial public offering (“IPO”) in August 2010 with Rex shareholders being issued with a total of 38,130,533 shares in WRM based on the demerger date of 15 June 2010.
An Expert’s report prepared by RSM Bird Cameron, dated June 2010, issued as part of this transaction (GA prepared a Specialist’s report as part of the same process) attributed a preferred fair market value of A$16,974,986 to the WRM shares (as at 15 June 2010) issued to the Rex shareholders and this is the figure that GA has utilised as part of the Comparable Transaction valuation in Section 7 of this report.
WRM’s exploration expenditure on the project between July 2010 and November 2012 totals approximately A$11.15M consisting of:
A$7.69M on the mining leases (including some continuing environmental expenditure)
A$3.29M on ELs 6273, 6452 and 6453
A$0.17M on EL 7673
At the date of the demerger on 15 June 2010 and WRM’s subsequent IPO in August 2010 Inferred Mineral Resources as shown in Table 5.4 (modified from WRM’s prospectus) below had been estimated.
TABLE 5.4
INFERRED MINERAL RESOURCE ESTIMATE AT 0.5g/t Au CUT-OFF FOR THE GOLD-DOMINANT RESOURCES AND 25g/t Ag CUT-OFF FOR THE SILVER-DOMINANT
RESOURCES AS AT 15 JUNE 2010
Deposit Tonnes1 Grade Contained Metal
(kt)2 (g/t Au) (g/t Ag) (koz3 Au) koz Ag
Gold Dominant Deposits Strauss 1,150 2.1 5.0 78 185 Kylo4 1,370 1.6 3.2 71 141 Guy Bell 160 2.5 4.9 13 25 Silver Dominant Deposits Lady Hampden 1,070 0.8 59.0 28 2,030 White Rock 4,080 - 62.0 - 8,134 Total4 7,830 190 10,515 Notes: 1. Mining One Pty Ltd rounded tonnes to nearest 10,000 tonnes and gold and silver grades to one decimal point 2. kt = thousand tonnes; rounded to nearest 1,000 tonnes 3. koz = thousand ounces to 1 decimal point, rounding errors are present in the total 4. Kylo includes Kylo West, Kylo Central and Kylo North zones 5. The estimate of silver grade for Strauss and Kylo is of low confidence due to the low number of samples assayed for these
elements. The estimated silver grade for Strauss and Kylo are based on gold blocks with a gold grade of greater than 2.5g/t Au and for White Rock and Lady Hampden for silver grades of greater than 150g/t Ag
6. The resource table above has been developed from the Mining One Pty Ltd resource report dated 1 October 2008 prepared on behalf of Rex and authored by Dr Chris Gee who is a professional geologist with more than 10 years’ experience in resource estimation and is a Competent Person as defined by the JORC Code. Mining One Pty Ltd and Dr Gee have consented to the inclusion of the above resources in this report.
5.6 Resources and Reserves
A number of resource estimates had been prepared prior to Rex entering into the option to purchase arrangement in April 2008. Rex commissioned Mining One Pty Limited (“Mining One”) to prepare a new estimate in accordance to the JORC code based on both the verifiable historical drilling and subsequent additional drilling undertaken during the option period. The Mining One resource estimate was previously reviewed in detail by GA in conjunction with the preparation of the IGR for inclusion in WRM’s 2010 IPO prospectus.
Following considerable additional exploration by WRM, including a significant amount of in-fill drilling, a new resource estimate, undertaken by resource consultants Ravensgate, was published in February 2012 and forms the basis of the current Scoping Study into developing a mining and processing operation at Mt Carrington. Resource revisions and updates were completed for the Lady Hampden, Kylo, and Strauss deposits and maiden JORC estimates were completed for the White Rock North and Silver King deposits. No additional drilling had been undertaken on the White Rock and Guy Bell deposits so the resources previously estimated by Mining One have been retained in the current resource portfolio.
Resource Database
The current Mt Carrington project resource estimate is as at February 2012 and includes separate estimates for seven separate deposits. The estimates are based on both verifiable historical drilling and additional

Independent Technical Review and Valuation of the Mineral Assets of White Rock Minerals Limited January 2013 Goldner and Associates P a g e | 22
drilling undertaken by Rex and WRM. The drill hole database used for the resource estimation includes 2,340 reverse circulation percussion (“RCP”), percussion (“PH”) and diamond core (“DDH”) holes totalling over 135,000m of drilling.
WRM has undertaken considerable efforts to validate the historical drill hole data and any holes that could not be adequately validated were discarded from the database and not used in the resource estimation. In the case of the Strauss deposit, it has also been possible to incorporate into the database previously completed close-spaced RCP grade control drilling into areas which remain un-mined. A summary of the drill hole database available for each deposit is provided in Table 5.5.
TABLE 5.5
DRILL HOLES USED IN THE RAVENSGATE RESOURCE ESTMATED OF 4 FEBRUARY 2012
Deposit DDH PH RCP Total Holes Ave. Depth Total Drilled metres
Guy Bell 16 1 115 132 66 8,792
Kylo 22 97 165 284 67 18,848
Lady Hampden 77 272 52 401 57 22,769
Strauss 39 126 995 1,160 28 32,865
Silver King 13 89 45 147 47 6,884
White Rock 9 263 0 272 42 11,521
White Rock North 14 8 0 22 208 4,576
TOTAL 190 856 1,372 2,418 81 106,255
The drill spacing varies with depth and for each deposit as follows:
Lady Hampden - 15m by 15m in shallow parts of the deposit; 80m centres in deeper portions, the deposit extends to 25m below surface, approximately half the RCP and DDH have down hole surveys, all deeper holes have down hole surveys
Silver King – a total of 147 holes drilled, 65% are PH and 35% RCP; 15m by 15m hole spacing in shallow parts and 25m by 25m spacing in deeper portions of the deposit; most drilling is vertical; no down hole surveys.
White Rock North – resource based on 22 holes (8 PH and 14 DDH), drill hole spacing varies from 50m to 80m centres; almost all holes down hole surveyed
Strauss – over 300 holes (45% RCP, 40% PH and 15% DDH); 15m by 15m hole spacing (mainly vertical holes) in shallow parts and 80m spacing (angled DDH) in deeper portions of the deposit; grade control drilling on 10m to 15m lines with holes 4m apart; limited down hole surveying in vertical holes, all angled DDH have been down hole surveyed.
Kylo – in excess of 300 holes (60% RCP, 32% PH and 8% DDH); 15m by 15m spacing in shallow parts and up to 80m in deeper portions of the deposit, limited down hole surveying data but all deeper DDH have been down hole surveyed.
White Rock – 272 holes (263 PH, 9 DDH) with average depth of 42m; the Mining One resource estimate retained for this deposit
Guy Bell – 132 holes (1 PH, 115 RCP and 16 DDH) with average depth of 66m; the Mining One resource estimate retained for this deposit
Quality Assurance and Quality Control (“QA/QC”)
GA reviewed the QA/QC procedures adopted by Rex and WRM in the course of the preparation of the IGR in 2010 and was satisfied that the procedures met industry standards and were suitable for the development of a database to be used in the estimation of resources in accordance with the JORC code. These procedures have been maintained in WRMs exploration subsequent to the IPO in 2010 and the additional information has been utilised by Ravensgate in its February 2012 resource estimate. Ravensgate noted that the assay repeatability of field duplicates was often poor but concluded that this was probably due to inherent nugget variability of gold and silver rather than any significant assaying issue.
Bulk Density
Bulk densities for each deposits for which Ravensgate estimated resources were based on the following:
Lady Hampden – 500 specific gravity (“SG”) measurements; SG of 2.63 for the oxide and transitional material and 2.76 for the primary material.

Independent Technical Review and Valuation of the Mineral Assets of White Rock Minerals Limited January 2013 Goldner and Associates P a g e | 23
Silver King – no measurements available – SG of 2.7 used based on the average SG for the nearby Lady Hampden deposit.
White Rock North – over 70 SG measurements; SG of 2.63 used for primary material.
Strauss – 340 SG measurements; SG of 2.54 for oxide/transitional material and 2.73 for primary material.
Kylo – 482 SG measurements – SG of 2.53 for oxide and transitional material and 2.65 for primary material.
Resource Estimation Methodology
Deposit interpretations were developed by the WRM geologists using the geological logs and assay data available from the drill holes as detailed in Table 5.6. Nominal 0.3g/t Au and 15g/t Ag cut-off boundaries were used to define the outer edges of the deposits with domains extrapolated halfway to the next drill hole along strike and/or down dip with the distances typically ranging from 20m to 50m. The WRM interpreted polygons were imported into Minesight by Ravensgate to refine and develop 3D wireframe block models of the mineralised zones. A total of 10 different mineralisation domains were modelled and additional surfaces created for base of complete oxidation and top of fresh rock which were used to model oxide, transitional and fresh/sulphide material.
The statistics for each domain were reviewed using both raw and composite data; 1m composites were used for White Rock North, Strauss and Kylo and 1.5m for Lady Hampden and Silver King.
TABLE 5.6
METHODOLOGY AND PARAMETERS FOR THE RAVENSGATE FEBRUARY 2012 RESOURCE ESTIMATE
Component Lady Hampden Silver King White Rock North Strauss Kylo
No of Domains 2 1 2 3 2
Compositing 1.5m 1.5m 1m 1m 1m
No of Composites 467 34 406 319 126
Cut-off grade
Top cuts – gold and silver
Essentially based on the 98.5 percentile of a log probability plot for each domain.
Variography MineSight software used for all variography. Down hole variograms calculated and modelled for each domain. Due to low sample densities in smaller domains robust ‘between-hole’ variograms along strike and down dip could generally not be developed; for the larger domains with higher sample densities reasonable variograms were obtained and indicated along strike continuity of 15-75m and down dip continuity of 15-65m.
Interpolation Ordinary Kriging used to interpolate grades into the blocks.
Block sizes 5m by 5m by 2.5m 5m by 10m by 5m 10m by 10m by 5m 5m by 5m by 2.5m
(combined into a single model)
Min/Max Number of Composites
Minimum of 1 and maximum of 24 composites used to estimate grades for each block. A maximum of three samples from each hole allowed to mitigate against uni-directional bias.
Search Ellipsoid major/minor/vertical
Ranged from 60m by 60m by 10m to 15m by 15m by 3m and were aligned parallel to the dominant strike and dip of each domain
Validation Based on a combination of visual checking of interpolation on plan and section, generating grade shells at varying cut-offs to visually check against drilling data, review of the quality of the estimate, comparison with previous resource estimates and reconciliation with historic mining production where available.
GA considers that Ravensgate’s resource methodology is appropriate and considers Ordinary Kriging a suitable estimation methodology for the deposit.
The resource categories assigned to each block by Ravensgate was based on an assessment of the distance of a block from the informing sample composite, the number of composites used to estimate the block grade and the kriging variance.
Resource Estimate
The February 2012 resource estimate by Ravensgate for the Lady Hampden, Silver King, White Rock North deposits were estimated at silver cut-off grades ranging (in 25g/t Ag increments) from 0g/t Ag to 200g/t Ag increments. For the Strauss and Kylo deposits the gold cut-off grades varied from 0g/t Ag to 2g/t Au. The resources are classified as Indicated and Inferred Mineral Resources under the JORC code.
The resources estimate presented in Table 5.7 below are for a silver cut-off grade 25g/t Ag and a gold cut-off grade of 0.5g/t Au. Table 5.7 also includes the White Rock and Guy Bell deposit resources previously estimated by Mining One as no further work has been undertaken on these deposits.

Independent Technical Review and Valuation of the Mineral Assets of White Rock Minerals Limited January 2013 Goldner and Associates P a g e | 24
TABLE 5.7
MT CARRINGTON RESOURCE ESTIMATE AS AT 4 FEBRURAY 2012
Tonnes Grade Contained Metal
Category Deposit Gold Silver Gold Silver
Mt g/t Au g/t Ag koz Au koz Ag
Silver Dominant Resources (25g/t Ag cut-off grade)
Indicated Lady Hampden 1.84 0.6 69 37 4,056
Sub-total Indicated 1.84 0.6 69 37 4,056
Inferred
Lady Hampden 2.47 0.3 51 27 4,023
White Rock 4.08 0 62 0 8,194
White Rock North 3.18 0 52 0 5,314
Silver King 0.64 0 59 0 1,218
Sub-total Inferred 10.37 0.1 56 27 18,749
Gold Dominant Resources (0.5g/t Au cut-off grade)
Indicated Strauss 1.24 1.4 3.8 57 153
Kylo 1.59 1.2 2.6 59 133
Sub-total Indicated 2.83 1.3 3.1 116 286
Inferred Strauss 1.26 1.4 2.6 56 104
Kylo 0.76 1.5 1.8 35 43
Guy Bell 0.16 2.5 4.9 13 24
Sub-total Inferred 2.18 1.5 2.4 104 171 Note: 1. There may be rounding errors in the totals and particularly in the contained gold and silver ounces. 2. The resource table above has been developed from the Ravensgate resource report dated 4 February 2012 prepared on behalf of
WRM and authored Don Maclean who is a professional geologist with more than 18 years’ experience. The Guy Bell and White Rock deposit estimates were completed by Gee (2008). Mr Maclean and Mr Gee hold the relevant qualifications and professional associations required by the ASX, JORC and VALMIN codes in Australia.
Reserve Estimates
There is no JORC ore reserve estimate reported for both the Mt Carrington and Guyra projects.
However, Mineable Inventories (“MI”) were estimated for the Mt Carrington project in the scoping study, including all the Indicated and Inferred Resources within an optimised pit shell, using a resource to MI conversion factor of 100% for both the Indicated and Inferred Resources. The MIs are not JORC Ore Reserves, and they are summarised in the Table 5.8 below. Break-even cut-off grades were estimated and based on the operating cost estimates and the metallurgical recoveries assigned for each individual ore type and deposit. A silver/gold equivalent ratio of 50 to 1 was assumed in the break-even cut-off grade estimation. The MI estimates were also based on a mining dilution factor of 5% and an ore loss factor of 5%. These mining factors are all within the expected ranges.
Some limited underground MI was also defined for the Kylo deposit, but it was not considered in the scoping study mine schedule.

Independent Technical Review and Valuation of the Mineral Assets of White Rock Minerals Limited January 2013 Goldner and Associates P a g e | 25
TABLE 5.8
SUMMARY OF THE OPEN PIT MINEABLE INVENTORIES FOR THE MT CARRINGTON PROJECT
Deposit Cut-off Grade (g/t eAg)
Tonnes (,000t)
Silver Grade (g/t Ag)
Gold Grade (g/t Au)
MI (Indicated) Guy Bell (not scheduled) 31.5 125 5.1 2.60 Kylo 31.5 454 2.9 1.34 Lady Hampden 36.7 & 39.6 1,089 69.2 0.84 Silver King 44.3 - 0.0 0.00 Strauss 30.8 800 4.3 1.70 White Rock 40.5 - 0.0 0.00 White Rock North (not scheduled) 35.5 & 40.5 - 0.0 0.00 Sub-total 2,468 32.7 1.30 MI (Inferred) Guy Bell (not scheduled) 31.5 41 5.2 5.21 Kylo 31.5 209 1.7 2.01 Lady Hampden 36.7 & 39.6 2 73.8 0.47 Silver King 44.3 158 86.3 0.00 Strauss 30.8 282 3.1 1.80 White Rock 40.5 1,619 97.2 0.06 White Rock North (not scheduled) 35.5 & 40.5 4 121.4 0.01 Sub-total 2,315 74.8 1.42 Total 4,783 53.1 0.93
GA has not systematically or comprehensively reviewed the block model or the underlying data on which the Mineral Resource estimate is based, or the optimised pit shell on which the MI estimate was based.
In GA’s opinion there is a risk that a significant portion of the Inferred Resource may not be converted into a JORC Ore Reserve. Consequently, the MI estimates above may be optimistic.
5.7 Scoping Study
5.7.1 General
A scoping study was carried out for the Mt Carrington project by RMDSTEM Limited (“RMDSTEM”) between April and July 2012 (and reported in a report dated November 2012), using a gold price of A$1500/oz, a silver price of A$30/oz and the metallurgical test results to date. RMDSTEM assessed a number of process scenarios in the scoping study, and recommended a combination of ‘flotation and concentrate sale’ for the silver dominant deposits with ‘flotation and concentrate leach’ for the gold dominant deposits as a base-case scenario.
A plant throughput of 0.8 Mtpa was used throughout the scoping study.
5.7.2 Mining
Historically mines have operated periodically on the Mt Carrington field since the late 19th century. These were generally small open cuts and underground mines predominantly operating on oxide ore with mineral processing occurring through stamp batteries and amalgam plates. Several mining companies explored the mineral field for a variety of base metals, gold and silver. In 1988, Mount Carrington Mines (“MCM”) commenced the largest mining to date with the opening of five moderately sized open pits, i.e. the Strauss, Guy Bell, North Kylo, Lady Hampden and Carrington pits. Mining operation ceased in January 1990, and a total of 485,782 tonnes of ore at a grade of 61.8g/t Ag and 1.96g/t Au were mined and milled over an approximately two-year period.
A scoping study was carried out for the Mt Carrington project by RMDSTEM between April and July 2012. MIs were estimated for seven pits, based on a single pit shell optimised with Whittle Four-X® software. The Whittle optimisation work was a part of a preliminary optimisation study conducted for the project in June 2012 by Minecomp Proprietary Limited (“Minecomp”). A mine schedule by bench by pit was developed by Minecomp, but it was further optimised by RMDSTEM during the scoping study and based on five pits, i.e. Lady Hampden, Strauss, White Rock, Kylo and Silver King pits. The MIs within the five pits total 4.6Mt at 54.7g/t Ag and 0.86g/t Au, with a waste to ore stripping ratio of 2.35:1. An initial mine and mill production rate of 0.8Mtpa is proposed, and mine life is six years. Pits with the high economic values will be mined first, and the White Rock North pit and Guy Bell pit were omitted from the scoping study mine schedule due to their low tonnages and low economic values.

Independent Technical Review and Valuation of the Mineral Assets of White Rock Minerals Limited January 2013 Goldner and Associates P a g e | 26
5.7.3 Geotechnical, Hydrogeology and Hydrology Considerations
There are no systematic geotechnical, hydrogeology and hydrology assessments for the project to date and detailed and systematic geotechnical, hydrogeology and hydrology assessments are to be planned.
Assumptions on the pit slope angles were made for each individual deposit by RMDSTEM
Further work will be required to appropriately address the geotechnical, hydrogeology and hydrology issues. In GA’s opinion there is always some geotechnical, hydrogeology and hydrology risk especially in high rainfall areas.
5.7.4 Mine Planning
Mine planning in the scoping study has been based on the following parameters and assumptions:
Geotechnical - Overall pit slopes of around 34-50°.
Mining Losses and Dilution – A dilution factor of 5% and an ore loss factor of 5% were adopted in the economic modelling process during the final stage of the scoping study.
Mining Equipment - mine plans involve the use of contract mining, drilling and blasting, using 95t off-highway trucks, loaded by a hydraulic excavator in a backhoe configuration, and supported by the normal ancillary equipment (drills, dozers, graders etc.).
Productivity - industry benchmark productivity rates applied to mining equipment.
Roster – Mining will be essentially conducted on a dayshift only basis.
Capex – No allowance in the capital cost in the pit shell optimisation with Whittle Four-X® software.
The mine plan for each of the five pits, developed by RMDSTEM as part of the scoping study, involves a single-stage low stripping ratio open pit mining operation. There are no actual open pit designs, and the MIs were based on the optimised pit shell with an individual pit depth range from 40m to 120m below the present ridge. The mineable blocks in the Mineral Resource block model were defined by the break-even cut-off grades, which are based on the operating costs and metallurgical recoveries. The MIs within the five pits total 4.6Mt at 54.7g/t Ag and 0.86g/t Au, with a waste to ore stripping ratio of 2.35:1. Final strip ratio could be slightly increased when actual pits with haul roads are designed. The pit shell has been optimised at a gold price of $1500/oz and a silver price of $30/oz with Whittle Four-X® software, and the Whittle optimisation included all the Mineral Resources including all the Inferred Resource.
The scoping study mine plan is a pit by pit mining sequence and strategy. Based on the mining scale and economic value of individual pit, the Lady Hampden pit will be mined first, followed by the Strauss pit and then the White Rock pit and the Kylo pit and Silver King pit will be mined last in the sequence. The mine plan is for ore mining to match the milling rate at 0.8Mtpa, and an ore blending strategy among the pits is not considered in the scoping study. The Lady Hampden pit is a gold and silver pit, the Strauss and Kylo pits are essentially gold pits, while the White Rock and Silver King pits are basically silver pits. They are small to moderate pits in size, with a pit depth of 95m, 90m, 120m, 105m, and 40m for the Lady Hampden, Strauss, White Rock, Kylo and Silver King pits respectively.
There is nothing unusual or novel about the mine plan in the scoping study. GA envisages that the mine plan will be further detailed and refined in the subsequent pre-feasibility and feasibility studies, where a detailed hydrogeology, hydrology and geotechnical studies will improve the accuracy of the input parameters for the mine plan, where actual pit design will be carried out, and where the locations for the waste dump and ROM pad will be selected.
5.7.5 Mine Scheduling and Operation
The base-case LOM production schedule shown in Table 5.9, is based on the scoping study financial model titled “WHIT0001 - Financial Analysis v23.04_Unlocked – static”. The base-case LOM schedule (Table 5.9) is based on the MIs in the five pits, i.e. Lady Hampden, Strauss, White Rock, Kylo and Silver King pits. The mining strategy follows a pit by pit sequence, and the mine production schedule is a high-level schedule, based on average gold and silver grades and stripping ratio for each individual pit. The base-case schedule includes all the MIs within the optimised pit shell.
Annual ore production rate is 800kt per annum, and mine life is six years.

Independent Technical Review and Valuation of the Mineral Assets of White Rock Minerals Limited January 2013 Goldner and Associates P a g e | 27
TABLE 5.9
MT CARRINGTON PROJECT- PROJECTED BASE-CASE MINING PRODUCTION SCHEDULE BY PIT
Item Unit Production Year Total
1 2 3 4 5 6
Waste Mined
Lady Hampden Waste kt 2,732 940 3,671
White Rock Waste kt 538 1,705 1,222 3,465
Silver King Waste kt 373 373
Strauss Waste kt 1079 1127 2,206
Kylo Waste kt 376 753 1,128
Total Waste kt 2,732 2,019 1,664 1,705 1,598 1,126 10,845
Strip Ratio (Waste:Ore) W:O 3.41 2.52 2.08 2.13 2.00 1.82 2.35
Mining Inventory (“MI”) Mined
Lady Hampden MI kt 800 275 1,075
Lady Hampden MI Grade g/t Au 0.85 0.85 0.85
g/t Ag 69.4 69.4 69.4
White Rock MI kt 252 800 573 1,626
White Rock MI Grade g/t Au 0.06 0.06 0.06 0.1
g/t Ag 97.1 97.1 97.1 97.1
Silver King MI kt 164 164
Silver King MI Grade g/t Au
g/t Ag 86.5 86.5
Strauss MI kt 525 548 1,073
Strauss MI Grade g/t Au 1.75 1.75 1.75
g/t Ag 4.0 4.0 4.0
Kylo MI kt 227 454 681
Kylo MI Grade g/t Au 1.57 1.57 1.57
g/t Ag 2.5 2.5 2.5
Total MI ,000t 800 800 800 800 800 618 4,618
g/t Au 0.85 1.44 1.22 0.06 0.49 1.15 0.86
g/t Ag 69.4 26.5 33.3 97.1 70.3 24.8 54.7
Total Material Mined
Lady Hampden kt 3,532 1,215 4,746
White Rock kt 790 2,505 1,796 5,091
Silver King kt 537 537
Strauss kt 1,604 1,675 3,279
Kylo kt 602 1,207 1,809
Total Material kt 3,532 2,819 2,464 2,505 2,398 1,744 15,463
The base-case mine schedule above has been based on an optimistic assumption, i.e. an Inferred Resource to MI conversion factor of 100%. In GA’s opinion there is also a high risk in reaching the full production capacity in the first year, and consequently, the mine production ramp-up plan and the overall mine schedule is considered optimistic.
Mining operation will be carried out by an experienced contractor with local experience, using a backhoe-configured 110t hydraulic excavator and 95t off-highway mine trucks. GA considers that the fleet selection is generally appropriate for both pioneering and production activities, as the high rainfall and soft ground conditions preclude the use of the more conventional rigid frame rear-drive dump trucks. The stripping ratio over the LOM is 2.35:1. The proposed fleet is considered capable of handling the required material movements.
The mine production schedule above will be met by mining on a dayshift basis, other than several short term periods through the LOM.
Local operators will be hired at the nearby townships of Casino (approximately 80km from the site) and Tenterfield (approximately 50km from the site). A drive-in-drive-out (“DIDO”) arrangement is proposed.
The historical Lady Hampden pit is currently full with water, and it will be dewatered prior to the re-commencement of the open pit mining. The historical Strauss and Kylo pits are essentially dry pits, and the White Rock and Silver King pits are green-field pits. All the pits will be mined as a single-stage pit.

Independent Technical Review and Valuation of the Mineral Assets of White Rock Minerals Limited January 2013 Goldner and Associates P a g e | 28
Further work planned in the feasibility study phase includes characterisation of acid mine rocks, development of an acid mine drainage (“AMD”) management plan, grade control design, drill and blast design, haul road design, selection of waste dump location, and selection of plant and ROM pad site.
Conclusions
GA considers that the mine planning, estimates and schedules have been prepared in a professional and reasonable manner. However, the levels of details are generally limited to a scoping study level. The mining recovery and dilution estimates are considered realistic providing best practice mining is adopted at the project. The mining equipment is considered generally appropriate to the conditions and the proposed scale of operations. The mine schedule may be optimistic as it is based on all the Mineral Resources within an optimised pit shell, including all the Inferred Resource. GA considers that there is a high risk that only a portion of the Inferred Resource may be converted into a JORC Ore Reserve, which could have negative impacts on both the stripping ratio and the total MI available for the mine schedule.
Geotechnical, hydrogeology and hydrology issues appear to have not been appropriately addressed. There is always some geotechnical, hydrogeology and hydrology risk especially in the high rainfall areas. The proposed mining schedule is considered achievable, although the ore stockpile strategy prior to the wet season and the ore blending strategy may warrant further investigation and optimisation.
5.7.6 Processing
General
Processing of ore has taken place at Mt Carrington for over 100 years. The most recent operation, from July 1988 to April 1990, processed ore through a carbon-in-pulp plant and achieved the results summarised in Table 5.10.
TABLE 5.10
SUMMARY PLANT PRODUCTION DATA- MT CARRINGTON OPERATIONS- 1988-1990
Item Unit Data
Ore Milled kt 441.9 Ore Grade g/t Au 1.97
g/t Ag 61.3 Au Recovery % 81.4 Ag Recovery % 51.3 Au Production kt 22.59 Ag Production kt 434.9
Milling operations were initially affected by high levels of clay in oxidised ore which caused problems with materials handling. Metal recoveries then fell as higher proportions of primary ore began to be treated; the sulphide content of the ore increased and higher levels of supergene copper minerals caused cyanide consumption to increase. The ore processed in this period was sourced from several pits, including Strauss, North Kylo, Carrington, and Lady Hampden.
In 2009, the Hatlar Group, a Melbourne-based firm, carried out a review of the metallurgy of the Mt Carrington ore bodies.
Ore Mineralogy
Hatlar noted that supergene copper has been identified in the Gladstone and North Kylo areas. This material appears to contain chalcocite, pyrite rimmed with chalcocite and some chalcopyrite. GA notes that chalcocite is significantly soluble in cyanide solution while chalcopyrite is relatively insoluble. Hatlar also noted the presence of chalcocite in Kylo ore.
Gold having grain sizes ranging from 3 to 65µm, appeared to be argentiferous and to be associated with pyrite and other sulphides.
Metallurgical Samples
Data on samples used for recent testwork designed to provide confirmatory data on the options for combining flotation and cyanide leaching in the process flowsheet shows that samples representing Kylo, Lady Hampden, Strauss and White Rock were comprised of single intervals of drill core between 5-12m in length.
Flotation and Leaching Testwork
Previous testwork has generally indicated that reasonable extraction of gold from can be achieved by direct cyanidation but at relatively high cyanide consumption. Silver extraction is generally lower than gold

Independent Technical Review and Valuation of the Mineral Assets of White Rock Minerals Limited January 2013 Goldner and Associates P a g e | 29
extraction. Recent testwork on direct cyanidation was carried out at ALS Ammtec in Adelaide. From gold dominant samples, gold and silver extraction ranged from 72-85% and 38-63% respectively. On silver dominant samples, extractions of both gold and silver were lower, ranging from 38-51% and 28-44% respectively. Cyanide consumption was between 2-3kg/t on the gold dominant samples and 3-5kg/t on the silver dominant material.
Flotation was investigated as an alternative to cyanidation or as a preliminary processing stage to attempt to improve metal extraction and to isolate the cyanide-consuming base metals. A grind size (“p80) of 75-106µm was found to be adequate for reasonable flotation results. Rougher and cleaner concentrates were prepared for leaching and cleaner and rougher tailings were combined for leaching tests on the flotation tailings. Total gold and silver recovery to concentrate and in the leaching stage ranged from 88-98% for gold and 85-89% for silver.
The favoured options for processing the two ore types are:
Gold dominant ores: Production of a rougher flotation concentrate; regrind of the rougher concentrate and intensive cyanidation to produce bullion; cyanidation of the rougher tailing to produce bullion;
Silver dominant ores: production of a cleaner concentrate for sale; leaching of combined cleaner and rougher tailings to produce bullion.
Metallurgical Process Plant Design
The scoping study involved very little conventional plant design, being largely conceptual in that block flowsheets were produced and the cost of the components of these flowsheets estimated by scaling from known costs for similar processes which have been included in plants constructed at other operations. This methodology was adequate for a scoping study but further refining of costs is likely to require more detailed design of the process.
Gold and Silver Recovery Estimates
Recoveries of gold and silver to concentrate and to bullion products have been based on the recent testwork results. A summary of the projected production profile is shown in Table 5.11 below. GA considers that the recovery estimates used in the model are consistent with the testwork data.
The process routes contemplated for the gold and silver dominant ore types will not recover any of the base metals contained in the ores.
Conclusions
Estimates of gold and silver recovery from the various Mt Carrington project ores are based on the results of preliminary testwork on drill core intercepts representing silver and gold dominant material, the two main ore types defined for the scoping study undertaken by RMDSTEM.
WRM plans to use two similar flowsheets to process the two ore types. Silver dominant material will be processed by producing a flotation concentrate for sale, with the flotation tailing being leached for bullion production. Gold dominant material will be processed to produce flotation concentrate and tailings products, both of which will be leached to produce bullion.
A process design has been carried out at a block flowsheet level to enable indicative capital costs to be estimated.
5.7.7 Infrastructure
Site Access
The project area lies approximately 5km north of the township of Drake some 80km west of Casino in northeastern NSW and is within the Girard State Forest. Access from Casino to Drake is via the sealed Bruxner Highway and the current site office is accessed from Drake by unsealed public road. Lismore, located approximately 30km east of Casino is serviced by regular regional commercial flights from Sydney.
The rail link between Casino and Brisbane port is approximately 200km long. An alternative port via the same railway line is the Newcastle port, which is approximately 600km south of Casino. Either of these ports could be utilised for the transport of concentrate products to overseas markets.
Existing Infrastructure
Much of the infrastructure associated with previous operations was dismantled and the site was largely rehabilitated when the mining and milling operation ceased in 1990. However, some of the site facilities remain in good condition, and they could be utilised if mining and milling activities recommence. This includes:
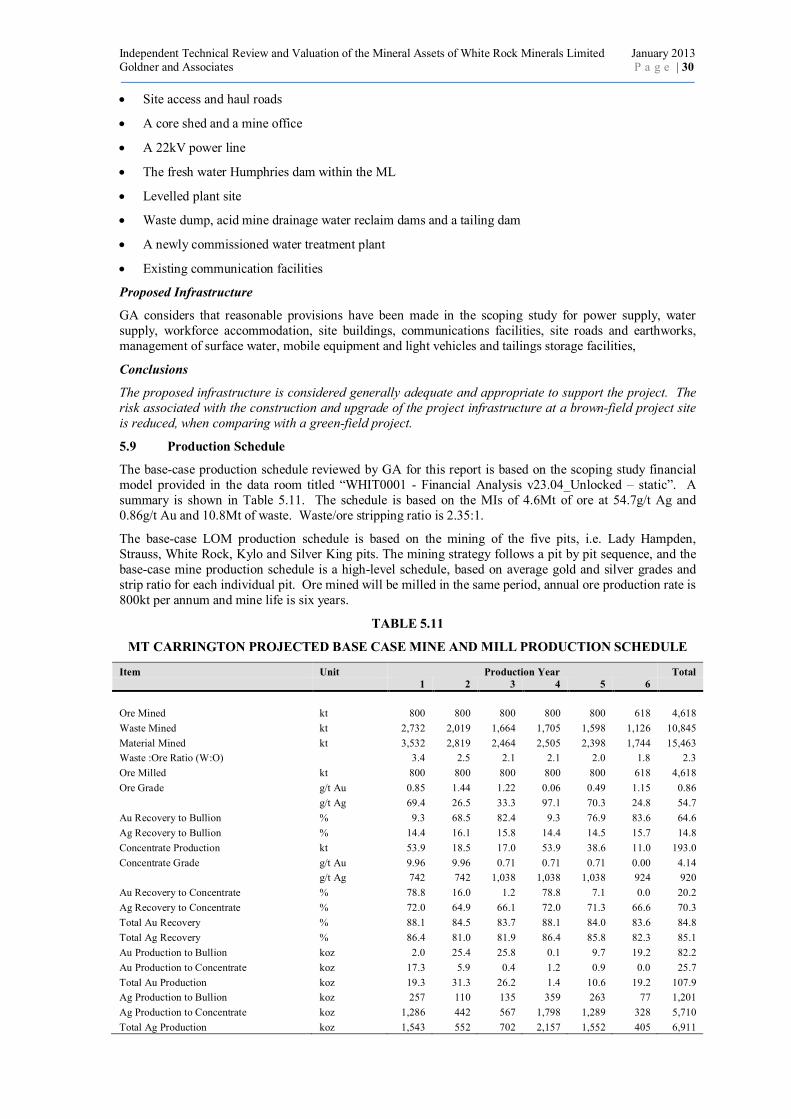
Independent Technical Review and Valuation of the Mineral Assets of White Rock Minerals Limited January 2013 Goldner and Associates P a g e | 30
Site access and haul roads
A core shed and a mine office
A 22kV power line
The fresh water Humphries dam within the ML
Levelled plant site
Waste dump, acid mine drainage water reclaim dams and a tailing dam
A newly commissioned water treatment plant
Existing communication facilities
Proposed Infrastructure
GA considers that reasonable provisions have been made in the scoping study for power supply, water supply, workforce accommodation, site buildings, communications facilities, site roads and earthworks, management of surface water, mobile equipment and light vehicles and tailings storage facilities,
Conclusions
The proposed infrastructure is considered generally adequate and appropriate to support the project. The risk associated with the construction and upgrade of the project infrastructure at a brown-field project site is reduced, when comparing with a green-field project.
5.9 Production Schedule
The base-case production schedule reviewed by GA for this report is based on the scoping study financial model provided in the data room titled “WHIT0001 - Financial Analysis v23.04_Unlocked – static”. A summary is shown in Table 5.11. The schedule is based on the MIs of 4.6Mt of ore at 54.7g/t Ag and 0.86g/t Au and 10.8Mt of waste. Waste/ore stripping ratio is 2.35:1.
The base-case LOM production schedule is based on the mining of the five pits, i.e. Lady Hampden, Strauss, White Rock, Kylo and Silver King pits. The mining strategy follows a pit by pit sequence, and the base-case mine production schedule is a high-level schedule, based on average gold and silver grades and strip ratio for each individual pit. Ore mined will be milled in the same period, annual ore production rate is 800kt per annum and mine life is six years.
TABLE 5.11
MT CARRINGTON PROJECTED BASE CASE MINE AND MILL PRODUCTION SCHEDULE
Item Unit Production Year Total 1 2 3 4 5 6
Ore Mined kt 800 800 800 800 800 618 4,618
Waste Mined kt 2,732 2,019 1,664 1,705 1,598 1,126 10,845
Material Mined kt 3,532 2,819 2,464 2,505 2,398 1,744 15,463
Waste :Ore Ratio (W:O) 3.4 2.5 2.1 2.1 2.0 1.8 2.3
Ore Milled kt 800 800 800 800 800 618 4,618
Ore Grade g/t Au 0.85 1.44 1.22 0.06 0.49 1.15 0.86
g/t Ag 69.4 26.5 33.3 97.1 70.3 24.8 54.7
Au Recovery to Bullion % 9.3 68.5 82.4 9.3 76.9 83.6 64.6
Ag Recovery to Bullion % 14.4 16.1 15.8 14.4 14.5 15.7 14.8
Concentrate Production kt 53.9 18.5 17.0 53.9 38.6 11.0 193.0
Concentrate Grade g/t Au 9.96 9.96 0.71 0.71 0.71 0.00 4.14
g/t Ag 742 742 1,038 1,038 1,038 924 920
Au Recovery to Concentrate % 78.8 16.0 1.2 78.8 7.1 0.0 20.2
Ag Recovery to Concentrate % 72.0 64.9 66.1 72.0 71.3 66.6 70.3
Total Au Recovery % 88.1 84.5 83.7 88.1 84.0 83.6 84.8
Total Ag Recovery % 86.4 81.0 81.9 86.4 85.8 82.3 85.1
Au Production to Bullion koz 2.0 25.4 25.8 0.1 9.7 19.2 82.2
Au Production to Concentrate koz 17.3 5.9 0.4 1.2 0.9 0.0 25.7
Total Au Production koz 19.3 31.3 26.2 1.4 10.6 19.2 107.9
Ag Production to Bullion koz 257 110 135 359 263 77 1,201
Ag Production to Concentrate koz 1,286 442 567 1,798 1,289 328 5,710
Total Ag Production koz 1,543 552 702 2,157 1,552 405 6,911

Independent Technical Review and Valuation of the Mineral Assets of White Rock Minerals Limited January 2013 Goldner and Associates P a g e | 31
Gold and silver recoveries are consistent with preliminary testwork results. The concentrate and bullion production schedule is relatively complex. Table 5.11 shows, on an annual basis, that the projected ranges for metal recoveries to the two products are: gold to bullion- 9-84%; silver to bullion- 14-16%; gold to concentrate- 0-79%, and silver to concentrate- 65-72%. Total silver recovery ranges between 81-86% and total gold recovery ranges between 84-88%.
Over the LOM, approximately 193kt of Ag/Au concentrate will be produced, containing 25.7kozs Au and 5,710kozs Ag. Gold/silver billion will also be produced over the same period, containing 82.2kozs Au and 1,201kozs Ag. Total gold and silver metals recovered will be 107.9kozs Au and 6,911kozs Ag.
Conclusions
Overall, GA considers the six year LOM plan represents a reasonable projection of likely performance. GA envisages that a slightly decelerated production and recovery ramp-up schedule will be considered during the next phase of the feasibility study to allow a more practical production ramp-up, plant commissioning, and operator training to take place.
GA notes that a resource to MI conversion factor of 100% for both the Indicated and Inferred Resources were assumed in the MI estimate and the LOM schedule and considers this optimistic.
The Mt Carrington project has not been valued by GA using the discounted cash flow methodology given that a significant proportion of the potential mining inventory consists of Inferred Mineral Resources which cannot be converted to reserves under the JORC code.
5.10 Capital Cost and Operating Cost
The base-case capital costs and operating costs reviewed by GA for this report is based on the scoping study financial model provided in the data room titled “WHIT0001 - Financial Analysis v23.04_Unlocked – static”. A summary of capital costs is shown in Table 5.12.
TABLE 5.12
MT CARRINGTON PROJECT- CAPITAL COST ESTIMATE
Item Unit Cost Basis
Ore Storage A$,000 1,074 Scaled from other operation
Crushing A$,000 3,340 Scaled from other operation
Grinding A$,000 2,695 Scaled from other operation
Flotation A$,000 2,730 Scaled from other operation
Concentrate Dewatering A$,000 775 Scaled from other operation
Carbon-in-Leach A$,000 4,300 Scaled from other operation
Elution/Carbon Regen A$,000 1,306 Scaled from other operation
Electrowinning A$,000 1,690 Scaled from other operation
Carbon Detoxification A$,000 741 Scaled from other operation
Tailings Storage Facility A$,000 520 Scaled from other operation
Process Total A$,000 19,171
Water Pipeline A$,000 50 Client Estimate
Site Roads A$,000 100 Client Estimate
Communications A$,000 30 Client Estimate
Power Distribution A$,000 350 Client Estimate
Laboratory A$,000 350 Client Estimate
First Fill Reagents A$,000 200 Client Estimate
Store/Workshops A$,000 150 Client Estimate
Site Vehicles A$,000 600 Client Estimate
Offices A$,000 0 Existing Building Used
Fuel Storage & Distribution A$,000 200 Scaled from other operation
Vehicle Washbay A$,000 80 RMD Estimate
Magazine A$,000 80 RMD Estimate
Property Purchase A$,000 1,000 Client Estimate
Shipping Containers A$,000 1,500 Client Estimate
Infrastructure Total A$,000 4,690
Total Capital Cost A$’000 23,861
The capital cost estimate for the processing plant has been based on factorised estimates for the cost of components of the design, based on known costs for components of other projects. The estimate includes costs for construction of crushing, grinding, flotation, flotation concentrate dewatering, carbon-in-leach, elution, carbon regeneration, and electrowinning. No allowances appear to have been made for regrinding

Independent Technical Review and Valuation of the Mineral Assets of White Rock Minerals Limited January 2013 Goldner and Associates P a g e | 32
of flotation concentrate or for intensive leaching of the small tonnage of flotation concentrate produced from low silver ore.
The scoping study infrastructure capital cost estimate of A$4.69M does not appear to include allowances for engineering design and procurement, earthworks, civil works, commissioning costs and capital spares. There also appears to be no capital allowances for sustaining capital, new haul road construction cost, initial pit dewatering cost and cost for raising the tailing dam wall. Other items missing from the scoping study capital costs include; allowances for on-going feasibility studies, further exploration, owner’s cost, project contingency, and escalation allowances. Mobile equipment for the mining operation will be supplied by the mining contractor.
Total capital cost for the project is approximately A$23.9M.
Total LOM site operating costs, shown in Table 5.13, are projected to be A$196.5M, excluding the concentrate transport cost of A$17.4M; process plant and mine operating costs comprise 40% and 40% of the total site operating cost respectively.
General and Administration charges cover environmental management, community relations, human resources, finance, government relations, supply, camp operation, and IT. GA notes that there is no allowance for the head office costs.
Mine operating cost and labour requirement were based on a first principle estimate methodology, and GA envisages that formal quotations for the contractor mining will be obtained in the feasibility study phase. GA notes that labour cost has been included in the model as a separate line item. GA also notes that the mine operating cost has been based on a diesel price of A$1.00 per litre, which will be subjected to rise and fall.
The process operating cost estimate shown in Table 5.13 excludes plant labour costs, which have been included in the labour cost. Therefore the processing costs include power, reagents, consumables, maintenance supplies, and miscellaneous costs such as water supply, safety consumables and laboratory costs. Process labour is estimated to cost A$2.2Mpa, equivalent to A$2.75/t milled. Overall processing costs would therefore be around A$14.1-16.3/tonne milled, inclusive of process labour.
Total royalty over the LOM is A$13.2M, based on a NSW state government royalty rate at 4% of the revenue. Cash cost of the equivalent silver produced, assuming a silver/gold equivalent ratio of 50 to 1, is projected to range between A$19.1 and A$20.8/oz eAg over the LOM.
GA has calculated unit costs on both a gold and silver equivalent basis on Table 5.13.
The accuracy of the capital and operating costs is limited by the assumptions which have had to be made due to the preliminary nature of much of the project data.
TABLE 5.13
BASE-CASE OPERATING COSTS FOR THE MT CARRINGTON PROJECT
Item Unit Production Year Total 1 2 3 4 5 6
Physicals Ore Mined kt 800 800 800 800 800 618 4,618 Material Mined kt 3,532 2,819 2,464 2,505 2,398 1,744 15,463 Ore Milled kt 800 800 800 800 800 618 4,618 Metal Production- payable Auequiv koz Auequiv 45.8 40.8 39.0 40.8 38.9 26.6 232.0 Metal Production- payable Agequiv koz Agequiv 2,291 2,042 1,952 2,038 1,944 1,329 11,598 Costs Mining A$M 18.1 14.5 12.7 12.9 12.3 9.0 79.5 Milling A$M 12.9 14.1 14.2 12.9 13.4 11.0 78.6 G&A A$M 2.0 2.0 2.0 2.0 2.0 1.6 11.7 Labour A$M 4.6 4.6 4.6 4.6 4.6 3.6 26.7 Site Costs A$M 37.7 35.3 33.5 32.4 32.4 25.1 196.5 Concentrate Transport A$M 4.9 1.7 1.5 4.9 3.5 1.0 17.4 Royalties A$M 2.6 2.4 2.3 2.3 2.2 1.6 13.2 Total Cash Costs A$M 45.1 39.3 37.3 39.5 38.1 27.7 227.0 Unit Costs Site Costs A$/oz Auequiv 823 863 858 796 833 945 847 Total Cash Costs A$/oz Auequiv 985 962 956 970 979 1,041 979 Site Costs A$/oz Agequiv 16.5 17.3 17.2 15.9 16.7 18.9 16.9 Total Cash Costs A$/oz Agequiv 19.7 19.2 19.1 19.4 19.6 20.8 19.6 Note: Metal prices of A$1500/oz Au and A$30/oz Ag have been assumed to estimate unit production costs on Au and Ag equivalent bases.

Independent Technical Review and Valuation of the Mineral Assets of White Rock Minerals Limited January 2013 Goldner and Associates P a g e | 33
Conclusions
The current project capital cost forecast included in the scoping study project financial model totals A$23.9M, which is to be expended in a single construction year. There appear no allowances for the feasibility study cost, further exploration cost, EPCM cost, some of the mine development cost, project contingency, cost escalation allowances, and sustaining capital expenditure including the cost for raising the tailing dam over the mine life.
Mining operating costs and labour requirement has been estimated, using a first principle estimate methodology, and GA envisages that formal quotations for the contractor mining will be obtained in the feasibility study phase.
Processing costs have been estimated at around A$14-16/t milled, inclusive of processing labour costs. The estimation methodology for reagents and consumables is based on usage rates and prices and the allowance for maintenance supplies appears reasonable.
5.11 Exploration Potential
The exploration potential of WRM’s Mt Carrington project can be considered as consisting of a number of separate tenure-based components as follows.
The Mining Tenements
These contain most of the known deposits and current silver-dominant and gold-dominant resources as well as a number of advanced prospects.
In GA’s opinion the MLs have considerable additional exploration potential represented by:
Additional in-fill drilling converting the Inferred Mineral Resources to higher resource categories that would then be available for conversion to reserves in accordance with the JORC code.
o It should be noted that Inferred Mineral Resources are partly within the current optimised pits as well as below the pit bases. The optimisation was based on metal prices of A$30/oz for silver and A$1,500/oz for gold.
A number of the deposits remain open and further step-out drilling should extend these deposits.
A number of the mining tenements contain identified prospects and targets (e.g. Red Rock, Lady Jersey, Mascotte) which, with further exploration (including drilling), have good potential to add to the overall project resources.
Exploration Licence EL 6273
This EL surrounds the mining tenements and has been subjected to considerable historical exploration, contains numerous identified prospects (see Figure 3) with potential to yield additional resources with further exploration. In addition the small White Rock North deposit lies within EL 6273 beyond the boundary of White Rock group of mining tenements. Although only a very small proportion (0.1%) of the currently defined resource (3.18Mt at 52g/t Ag) was included in the optimisation undertaken by RMDSTEM and the White Rock North deposit was not included in the base case financial model, there is clearly potential that an increase in the silver price could increase the potential economic component of this resource.
Historical and recent WRM exploration has identified a number of areas and prospects which have potential for copper-dominant deposits. Some of these areas lie in the vicinity of the silver-dominant and gold-dominant resources within the Central Mount Carrington mining tenements while some, such as the Gladstone prospect lies beyond the mining tenement boundaries within EL 6273.
Exploration Licences ELs 6452 and 6453
These ELs are long standing tenements that have been subjected to considerable historical and more recent WRM regional exploration, although have not as much detailed exploration as EL 6273.
Exploration to date (mapping, geochemical sampling, geophysical surveying, etc.) has identified a number targets (see Figure 3) including several mineralised prospects (some with old workings) such as Girard East and West, Kimberley, Murray, Mariners, Mandrake, etc., which have yielded encouraging rock chip sampling and soil sampling gold and silver values. Additional exploration is planned.
Exploration Licence EL 7673
This EL was granted to WRM after its listing on the ASX in 2010 and to date has been subjected to preliminary regional reconnaissance-scale exploration including regional and in-fill stream sediment

Independent Technical Review and Valuation of the Mineral Assets of White Rock Minerals Limited January 2013 Goldner and Associates P a g e | 34
sampling, mapping and selected rock chip sampling. An application has been submitted to renew a reduced portion of this tenement.

Independent Technical Review and Valuation of the Mineral Assets of White Rock Minerals Limited January 2013 Goldner and Associates P a g e | 35
6.0 GUYRA PROJECT
6.1 Location and Tenure
The Guyra Project consists of EL 7255 (Guyra) and EL 7395 (Glencoe) as shown on Table 6.1. Both ELs are considered prospective for porphyry copper-style mineralisation. Both tenements were originally granted to Banlona Pty Ltd a subsidiary of Global Geoscience Limited and were acquired by WRM in August 2010 by the issue of WRM shares to Banlona Pty Ltd. Both tenements are held in the name of White Rock Minerals (New England) Pty Ltd, a wholly owned subsidiary of WRM.
EL 7255 is located immediately east of the town of Guyra approximately 400km north of Sydney and 35km north of the regional city of Armidale and covers mostly cleared gently undulating farm land. Access is via a regional road from Guyra to Ebor, secondary roads and farm tracks provide access within the EL.
EL 7395 is centred on the village of Glencoe about 40km north of Guyra. The project straddles the New England Highway and is approximately 75km north of Armidale and consists of steeply undulating terrain which has been largely cleared for farming. The New England Highway passes through the centre of the project and secondary roads and farm tracks provide additional access.
TABLE 6.1
THE GUYRA PROJECT TENEMENTS
Tenement Name Approximate Area
Expiry Date Bond (A$)
Annual Expenditure Commitment (A$)
EL 7255 Guyra 67.0 2/12/20121 10,000 Na EL 73952 Glencoe 63.0 1/09/2013 10,000 Na Total 130 20,000
Notes: 1. Renewal for the full area has been lodged. 2. It should be noted that the AMETS tenement report mentions that the NSW Department of Trade and Investments
has advised that the efficacy of the exploration undertaken by Banlona Pty Ltd and WRM on EL 7395 in the first tenure term was unsatisfactory as the prescribed expenditure level of A$55,000 were not met.
6.2 Geological Setting and Mineralisation
The Guyra project tenements are located within the NEFB and the general geological setting of this terrane is briefly described in Section 5.3 of this report.
Both ELs are characterised by an extensive veneer of Tertiary basalt flows covering Carboniferous and Permian basement rocks of the NEFB and it is these, largely obscured basement sequences, that potentially could host a variety of metalliferous mineral deposits, including porphyry copper (± gold ± molybdenum) deposits.
6.2.1 EL 7255 - Guyra
Geological Setting and Mineralisation
In EL 7255 the Tertiary basalt is generally less than 70m thick with mapped inliers of outcropping basement occurring in two large and a number of small erosional windows through the basalt (Figure 4). The basement rocks consist of Carboniferous Sandon Beds and Upper Permian granodiorites and adamellites of the New England Batholith. Lower Permian Annalee Pyroclastics may also be present.
The two main basement inliers (Willow Glen and Washpool) occur adjacent to each other about two kilometres east of the town of Guyra. The Willow Glen Inlier is up to 3km long (north–south) and up to 2km wide while Washpool inlier has a diameter of about 0.5km. Outcrops within the windows consist of altered silty sediments and minor rhyolite of the Sandon Beds intruded by biotite monzogranite porphyry and a hydrothermal polymictic micro breccia (possibly of intrusive origin) probably related to either the New England Batholith or possibly related to the Annalee Pyroclastics.
Previous Exploration
The mapped alteration of the basement units indicates the possible presence of a porphyry-style mineralisation and drilling at both Washpool and Willow Glen prior to WRM acquiring the project indicated the presence of alteration and associated low-grade sub-economic mineralisation.
The anomalous copper and molybdenum values from the drilling form an approximate circular zone in the western half of the Willow Glen Inlier while lead and silver values show a north-northwest trend highlighting a possible northwest-southeast fault through the Willow Glen and Washpool windows (Figure 4).

Armidale
GuyraGuyra
Llangothlin
GlencoeGlencoe
New
Hig
hw
ay
England
Gara
Rive
r
EL 7255EL 7255
Washpool
InlierWillow Glen
Inlier
Zone of Elevated Cu- MoAg - Pb
Anomaly Trend
Llangothlin
Lagoon Little
Llangothlin
Lagoon
Malpas Dam
EL 7395EL 7395 Basalt
Alluvium
Llangothlin Adamellite
Shannonvale Granodiorite
Sandon Beds (altered)
Prospect pit
River
Reported pyritic altered
basement
Annalee Pyroclastics
Drake Volcanics
Porphyry
Tertiary
Quaternary
Permian
Carboniferous
Legend151°45’E151°45’E
30°15’S30°15’S
30°00’S30°00’S
50
Kilometres
Figure 4
WHITE ROCK MINERALS LIMITED
GA-002/001-Jan. 2013
NORTH
GOLDNER & ASSOCIATES
Glencoe Projects
GEOLOGY AND
WILLOW GLEN PROSPECT GEOCHEMICAL TREND
Independent Technical Review and Valuation of the Mineral Assets of White Rock Minerals Limited January 2013 Goldner and Associates P a g e | 37
The extent of mineralisation is masked by the Tertiary basalt cover rocks which may also totally obscure other mineralised centres within the tenement; petrological studies have indicated that multiple intrusive events occurred which could result in better grade mineralisation occurring in areas below the basalt cover.
WRM Exploration
Work to date includes an extensive IP-resistivity survey designed to delineate the extent of the porphyry system below the basalt cover. Numerous anomalies were delineated and the responses were interpreted to match the known geology from areas of outcropping altered porphyry system with high chargeability anomalies considered to reflect possible areas of disseminated sulphides within and marginal to the intrusive.
WRM subsequently completed three diamond drill holes (GYDD001 to 003 totalling 1,087.7m) to evaluate some of the anomalies. While all holes intersected porphyry-style alteration, only minor sulphide mineralisation, usually in narrow zones, were present in holes GYDD001 and 002. Hole GYDD001 returned no significant results while the best result from GYDD002 was 1m at 0.11% Cu, 5.9g/t Ag from a depth of 154m.
Hole GDDY003 however returned better results with several metre scale altered zones containing up to about 7% sulphides consisting predominantly of pyrite with some bismuthinite and traces of galena. Isolated narrow widths of greater than 20% sulphides were also present. Assay results suggested the presence of narrow vein-style mineralisation with a best results of up to 0.5m at 1.38% Pb, 128g/t Ag from 165.5m depth and 4m at 0.29% Cu, 20.1g/t Ag from 41m, returned from hole GYDD003
6.2.2 EL 7395 – Glencoe
Geological Setting and Mineralisation
In EL 7395, the basalt overlies a basement consisting largely of Permian Drake Volcanics and granitoid intrusions belonging to the New England Batholith. Carboniferous basement sediments outcrop in a number of small inliers in the southern part of the EL (Figure 4). The thickness of the basalt is likely to be highly variable with drilling close to the southern project boundary indicating it is at least 100m thick.
At two locations south of Glencoe village, pyrite-rich basement rocks reportedly show evidence of phyllic alteration, common in porphyry systems.
Previous Exploration
Previous exploration has been limited to reconnaissance-style geological mapping and regional stream sediment sampling with streams draining the tenement returning anomalous copper and molybdenum values of up to 106ppm Cu and 2ppm Mo respectively.
WRM Exploration
Work on this tenement has been limited to a review and compilation of the prior exploration data and a general reconnaissance of the area partly due to prolonged delays in the renewal of this tenement.
Future exploration is proposed to include detailed stream sediment sampling and follow-up soil sampling.
6.3 Resources and Reserves
There are no resources or reserves estimated for the Guyra and Glencoe tenements.
6.4 Acquisition Cost and Exploration Expenditures
WRM purchased the two Guyra project tenements, which at the time of purchase covered a total area of about 189km2, in July 2010. The purchase consideration was the issue of 2 million ordinary WRM shares.
Consequently at the WRM issue price of A$0.30/share this nominally valued the Guyra project at A$600,000.
Since acquiring the Guyra project tenements WRM’s exploration expenditure between July 2010 and November 2012 has been as follows:
EL 7255 – Guyra A$600,000 EL 7395 – Glencoe A$ 19,460 Total Project A$619,460

Independent Technical Review and Valuation of the Mineral Assets of White Rock Minerals Limited January 2013 Goldner and Associates P a g e | 38
6.5 Exploration Potential
In GA’s opinion results to date have been generally disappointing and WRM has prepared an information memorandum with a view to attracting another party to fund future exploration and to take a controlling interest in the project either through purchase, joint venture or an option agreement.
Although there is evidence that porphyry-style alteration is present in the basement sequence and further work can be justified, exploration is difficult and expensive as much of the prospective basement sequence is obscured by younger, barren basalt. The three holes drilled within EL 7255 have yielded limited encouragement that a substantial mineralised system is present and at this stage it remains an early phase exploration project.

Independent Technical Review and Valuation of the Mineral Assets of White Rock Minerals Limited January 2013 Goldner and Associates P a g e | 39
7.0 VALUATION
Overview
GA has utilised a number of differing valuation methodologies to value WRM’s projects with the methodologies chosen based on the nature of the project, the status of the various project components and the assessed prospectivity of the various project tenements.
The valuation principles outlined in Section 3 have been applied to the WRM assets described in Sections 5 and 6. For the purposes of this report the effective date for the valuation is 9 January 2013.
The various WRM project components have been valued using various combinations of the Comparable Transaction and the Multiple of Past Expenditure methods.
Overall the value range assigned is based on the principles defined in the VALMIN Code whereby the fair market value of a property is the amount a willing buyer would pay a willing seller in an arm’s length transaction, wherein each party acted knowledgeably, prudently and without compulsion.
General Assumptions
GA’s valuations assume that:
All licences, permits, certificates and consents issued by Federal, State or local government or other authorised entities or organizations that will affect the continuity of the operations have been obtained or will be obtained as required in the future. GA has received appropriate advice from WRM and from an independent tenement specialist in respect to WRM’s tenure and has relied on this advice in the preparation of this report.
The financial and operational information provided by WRM in the form of the Mt Carrington scoping study has been prepared on a reasonable basis, reflecting estimates that have been arrived at after due and careful consideration.
There will be no material change in the existing political, legal, fiscal, technological, market and economic conditions which will affect the revenues and incomes being generated.
There will be no material change in the taxation laws and regulations and the rates of tax payable will remain unchanged and all applicable laws and regulations will be complied with.
The market return, market risk, interest rates and exchange rates will not differ materially from those presently prevailing and market and economic conditions will not differ materially from those forecast.
Relevant metal supply and demand will not differ materially from that forecast.
Management will implement financial and operational strategies that will maximize the efficiency of the operation of the business.
Management has sufficient knowledge and experience in respect of the operation of the business, and turnover of any manager or key person will not significantly affect the operation of the business.
Adequate financial capital for the projected capital expenditure and working capital will be available and any scheduled interest or repayments of loans will be paid on time.
Management has adopted reasonable and appropriate contingency measures against any human disruption such as fraud, corruption and strike, and the occurrence of any such disruption will not significantly affect the operation of the business.
Management has adopted reasonable and appropriate contingency measures against any natural disaster such as fire, flood or cyclone and the occurrence of any natural disaster will not significantly affect the operation of the business.
Comparable Transaction Valuations
In the application of the Comparable Transaction methodology GA has used the metal prices and exchange rates at the date of the transaction used as the comparable transaction (see Table 7.1 below) and then adjusted the terms of the comparable transaction to reflect any material change in commodity prices between the date of the comparable transaction and the effective date of 9 January 2013. The adjustment is based on the application (multiplying) of a ‘normalising factor’ to the terms of the comparable transaction and this is calculated as follows:
Normalising factor = metal price at the effective date (9 January 2013) divided by the metal price at the date of the transaction used as the comparable transaction.

Independent Technical Review and Valuation of the Mineral Assets of White Rock Minerals Limited January 2013 Goldner and Associates P a g e | 40
In the case of the Mt Carrington project the silver prices are used while for the Guyra project the copper prices are used to calculate the ‘normalising factor’.
TABLE 7.1
METAL PRICES AND EXCHANGE RATES UTILISED IN THE COMPARABLE TRANSACTION VALUATION
Date Event FX Silver Price Gold Price Copper Price AUD/USD US$/oz A$/oz US$/oz A$/oz (US$/t) (A$/t)
1 August 2011
Kingsgate Consolidated Limited (“Kingsgate”) acquisition of the Bowdens Silver project.
1.0997 39.50 35.92 1,620 1,473 Na Na
20 August 2010
WRM’s acquisition of the Guyra Project tenements
0.8917 Na Na Na Na 7,302 8,188
Na – Not applicable
7.1 Mt Carrington Project
GA has valued the Mt Carrington project using a combination of the Comparable Transaction and Multiple of Past Expenditure methodologies as follows:
The 1 August 2011 acquisition of the Bowdens silver project near Mudgee NSW by Kingsgate Consolidated Limited.
As a an alternative valuation, the entire Mt Carrington project has also been valued using the Multiple of Past Expenditure method utilising both prior company exploration expenditure and WRM’s expenditure on the various tenement components (mining tenements, the three original ELs (6273, 6452 and 6453) and EL 7673 by applying differing PEM factors (see Section 3) to the various expenditure based on an assessment of status of the targets within each of the components.
In utilising the Comparable Transaction method GA has taken the view that the Bowdens purchase terms were directly related to the in-ground silver resources at the date of the transaction. In utilising this methodology GA has assumed that the transaction terms were directly related to the estimated in-ground metal content (i.e. silver equivalent ounces) rather than the size of the surrounding exploration tenure; consequently no adjustment has been made for the differing tenure sizes between the current Mt Carrington Project tenure and the Bowdens Project tenure size.
For the Comparable Transaction valuations GA has used the metal prices and exchange rates in Table 7.1 above in conjunction with the effective date (9 January 2013) metal prices (silver – US$30.20/oz.; gold – US$ 1,658/oz.; copper – US$8,046/t and A$/US$ FX – 1.051) which provides a conversion factor of 1oz Au = 55oz eAg for the Mt Carrington Project.
On this basis the contained equivalent silver ounces in the Mt Carrington Indicated and Inferred Mineral Resources at the effective date (see Table 5.7) total 38.88Mozs eAg.
7.1.1 Bowdens Project Transaction
Project Parameters at the Acquisition Date of 1 August 2011
At the date that Kingsgate acquired the project from Silver Standard Resources Inc. the Bowdens project consisted of:
Two granted ELs totalling 122km2
Contained in-ground metal resources totalling 130.6Moz eAg (based on a 30g/t Ag cut-off)
o Indicated and Inferred Mineral Resource categories; lead and zinc converted to silver equivalent using metal price and metallurgical recoveries of Ag – US$27.50/oz, 81%; Pb – US$1.00/lb, 73%; Zn – US$1.00/lb, 83% (note that these metal prices were not the prices as at the acquisition date).
The acquisition date silver price and exchange rate was US$39.50/oz Ag and A$/US$ - 1.10. This translates to an Australian dollar silver price of A$35.92/oz Ag.
Comparable Transaction Valuation based on the Bowdens Project Acquisition
The consideration for the acquisition was:
A$35M cash
Two further payments of A$5M payable on 31/12/11 and 30/06/12

Independent Technical Review and Valuation of the Mineral Assets of White Rock Minerals Limited January 2013 Goldner and Associates P a g e | 41
$30M in Kingsgate shares
Consequently the total acquisition cost of the Bowdens project was A$75M or A$0.57/oz eAg at the transaction date.
The change in silver price between to Bowdens acquisition date of 1 August 2011 (US$39.50/oz Ag) and the effective date of 9 January 2013 (US$30.20/oz Ag) provides a normalising factor of 0.76 (30.20/39.50) which would provide an adjusted price for the Bowdens transaction of A$57.34M or A$0.44/oz eAg.
When this is applied to the current Mt Carrington project in-ground resource of 38.88Moz eAg it provides a Comparable Transaction valuation of A$17.11M. No adjustment has been made for the difference in size between the exploration tenure at Bowdens and Mt Carrington.
7.1.3 Multiple of Past Expenditure Valuation of the Mt Carrington Project
In selecting the PEM multiples (see Section 3.4) to apply to the Mt Carrington project past exploration expenditures GA has taken the following factors into account (see Section 5.11):
The current resources are predominantly located within the mining tenements and although a scoping study has been carried out, no reserves have been estimated and additional work (drilling, metallurgical testwork etc.) is required to convert the resources to reserves in accordance with the JORC code.
EL 6273 contains numerous defined prospects (and the small White Rock North resource) which justify considerable additional exploration including drill testing.
ELs 6452 and 6453 have a number of defined exploration targets with high grade precious metal results obtained from rock chip sampling.
EL 7673 has been subjected to limited regional exploration to date which has confirmed the area contains the prospective host sequences and defined stream sediment anomalies warranting follow-up investigation.
In determining the applicable expenditure GA has utilised only that expenditure that has generated exploration information that has remained confidential to WRM; this includes:
the exploration completed by DRL and CRAE and was acquired by Rex on its acquisition of the Mt Carrington project in 2009, in this regard GA has used the Rex acquisition cost as representing the DRL/CRAE expenditure.
o GA has subjectively allocated the Rex acquisition cost to the tenement components on the following basis:
Mining tenements 60%, EL 6273- 20%, EL 6452 and 6453 – 10% each
exploration undertaken by Rex prior to the demerger of Mt Carrington in 2010
the subsequent exploration undertaken by WRM up to November 2012.
The Multiple of Past Expenditure valuation of the Mt Carrington Project is provided on Table 7.2 below.
TABLE 7.2
MULTIPLE OF PAST EXPENDITURE VALUATION OF THE MT CARRINGTON PROJECT
Attributable Expenditure (A$M) Valuation Range
Project Component DRL/CRAE Rex pre
demerger WRM to
Nov. 2012 Total PEM Range A$M A$M
Mining Tenements 1.50 2.73 7.69 11.92 2.5 2.7 29.80 32.18
EL 6273 0.50 0.82 2.62 3.94 2.0 2.2 7.88 8.67
EL 6452 0.25 0.23 0.41 0.89 1.5 1.6 1.34 1.42
EL 6453 0.25 0.20 0.27 0.72 1.5 1.6 1.08 1.15
EL 7673 0.00 0.00 0.17 0.17 1.1 1.2 0.19 0.20
Totals 2.50 3.99 11.15 17.63 40.29 43.62
7.2 Guyra Project
GA has valued this project, principally using the Comparable Transaction method using the parameters of WRM’s initial acquisition of the project tenements from Banlona Pty Ltd and by the Multiple of Past Expenditure method in both cases using the details provided in Section 6.4.

Independent Technical Review and Valuation of the Mineral Assets of White Rock Minerals Limited January 2013 Goldner and Associates P a g e | 42
Project Parameters at the Acquisition Date of 20 August 2010
WRM’s acquisition of the Guyra project is considered by GA to have taken place essentially occurred on 20 August 2012, the date of WRM’s IPO prospectus.
The two ELs acquired at the acquisition date totalled 189km2
Banlona had undertaken no significant exploration on the tenements and all historical data was freely available on the Government website.
The project was considered to have potential for porphyry copper-style deposits
7.2.1 Comparable Transaction Valuation
The acquisition consideration was 2 million WRM shares which at the IPO were issued at A$0.30, valuing the Guyra project at a nominal A$600,000 or A$3,175/km2.
In GA’s opinion it is appropriate to use the copper price to calculate the normalising factor. The copper price at the 20 August 2010 was US$7,302/t while at 9 January 2013 it was US$8,046/t (LME cash rate). This provides a normalising factor of 1.10 (8,046/7,302). This provides an adjusted acquisition cost of A$660,000 or A$3,492/km2
Applying this per km value to the current project tenement size of 130.8km2 yields a valuation of A$456,820 for the current Guyra project.
7.2.2 Multiple of past Expenditure Valuation
To the end of November 2012 WRM had spent A$600,000 on EL 7255, mainly on drilling three core holes, and A$19,460 on EL 7395 largely on data compilation and regional reconnaissance (Sections 6.4 and 6.5).
The results from drilling within EL 7255 were generally disappointing with only narrow zone of mineralisation encountered. In GA’s opinion the overall results from exploration to date have not been encouraging and this view is substantiated by WRM’s current attempt attract other parties to fund further exploration and the PEM factors applied by GA to the past expenditure in Table 7.3 below are based on this opinion.
TABLE 7.3
MULTIPLE OF PAST EXPENDITURE VALUATION OF THE GUYRA PROJECT
Project Component WRM attributable expenditure to
Nov. 2012 (A$M) PEM Range A$M A$M
EL 7255 0.60 1.2 1.4 0.72 0.84
EL 7395 0.02 1.0 1.1 0.02 0.02
Totals 0.62 0.74 0.86
7.3 Overall Valuation of WRM’s Mineral Exploration and Development Assets
Table 7.4 below summarises the valuations obtained for WRM’s mineral asset and also includes GA’s preferred value which is based on GA’s subjective judgement of the prospectivity of each asset.
GA considers that the Comparable Transaction valuation using the Bowdens acquisition is a better guide to the value of Mt Carrington Project than the valuation based on the Multiple of Past Expenditure. Consequently GA’s preferred value for Mt Carrington is towards the lower end of the range rather than the midway point between the Low and High value range in Table 7.4.
TABLE 7.4
VALUATION SUMMARY OF THE WRM MINERAL ASSETS
Project Comparable Transaction Multiple of Past Expenditure Low High GA Preferred
Value Range Value Range
A$M A$M A$M A$M A$M A$M
Mt Carrington 17.11 40.29 43.62 17.11 43.62 24.00
Guyra 0.46 0.74 0.86 0.46 0.86 0.66
Totals 17.57 41.03 44.48 17.57 44.48 24.66

Independent Technical Review and Valuation of the Mineral Assets of White Rock Minerals Limited January 2013 Goldner and Associates P a g e | 43
8.0 STATEMENT OF CAPABILITY
This report has been prepared by Mr Peter Goldner, Managing Director of GA, and Senior Associates of Mr Ian White and Dr John Chen. A summary of their professional qualifications and experience is included below.
Mr Peter Goldner (BSc. (Hon) Geology, FAusIMM, FAIG, CPGeo) is the Principal of Goldner and Associates with more than 40 years’ experience in exploration and mine management, project evaluation, mine development, mine operations and the provision of geological services. He has worked in both surface and underground operations in a range of commodities, including gold and precious metals, copper, lead/zinc, base metals, nickel and uranium. He has extensive experience in resource/reserve estimation, reconciliation procedures and the audit and review of estimates. Mr Goldner has worked in Australia, PNG, Southeast Asia and the USA.
Mr Ian White (BSc. (Hon) Metall., M.Sc, DIC, FAusIMM) is a Senior Associate of GA with more than 25 years’ experience in the Australian mining industry. He is a metallurgist and has held senior management positions in several operating mines and has been involved in plant design and optimisation, process design testwork, feasibility studies and plant commissioning and project valuation. He is experienced in CIP/CIL technology, flotation, gravity separation, heap leaching, SX/EW, comminution, magnetic separation and pelletising and has worked with a range of commodities including gold, copper, iron ore, base metals, tin and industrial minerals. Mr White has conducted technical reviews of process design and infrastructure on many major projects in Australia, New Zealand, Laos, Vietnam, the Philippines, China, PNG and Indonesia.
Dr. John Chen (PhD. Mining, B.Eng, Dip.Finance, MAusIMM) is a Senior Associate of GA and has over 25 years of underground and open pit mining experiences in both the Australian and Chinese mining industries. He has worked for a number of major Australian mining companies including Mount Isa Mines Limited and Sino Gold Mining Limited where he held both operational and mine technical services roles. His experience includes ore reserve estimation, mine planning, feasibility studies, mine optimization studies, project evaluation, mine construction and greenfields project development.
9.0 STATEMENT OF INDEPENDENCE
Neither the Principals nor Associates of GA have any material interest or entitlement in the securities or assets of WRM, or any associated companies. GA will be paid a fee for this report comprising its normal professional rates and reimbursable expenses. The fee is not contingent on the conclusions of this report.
10.0 LIMITATIONS AND CONSENT
This assessment has been based on data, reports and other information made available to GA by WRM, and RSM Bird Cameron. GA has been advised that the information is complete as to material details and is not misleading. A draft copy of this report has been provided to WRM and RSM Bird Cameron for comment as to any errors of fact, omissions or incorrect assumptions. The opinions stated herein are given in good faith. We believe that the basic assumptions are factual and correct and the interpretations reasonable.
With respect to the GA report and use thereof by WRM and RSM Bird Cameron, WRM agrees to indemnify and hold harmless GA and its shareholders, directors, officers, and associates against any and all losses, claims, damages, liabilities or actions to which they or any of them may become subject under any securities act, statute or common law and will reimburse them on a current basis for any legal or other expenses incurred by them in connection with investigating any claims or defending any actions. GA does not accept any liability other than its statutory liability to any individual, organisation or company and takes no responsibility for any loss or damage arising from the use of this report, or information, data, or assumptions contained therein.
This report is provided to RSM Bird Cameron in connection with the valuation and proposed transaction and should not be used or relied upon for any other purpose. This report does not constitute an audit. Neither the whole nor any part of this report nor any reference thereto may be included in or with or attached to any document or used for any purpose without our written consent to the form and context in which it appears.
Yours faithfully,
PETER T GOLDNER Managing Director

Independent Technical Review and Valuation of the Mineral Assets of White Rock Minerals Limited January 2013 Goldner and Associates P a g e | 44
APPENDIX 1
AMETS LETTER DATED 31 JANUARY 2013 REGARDING THE WRM TENEMENTS

Independent Technical Review and Valuation of the Mineral Assets of White Rock Minerals Limited January 2013 Goldner and Associates P a g e | 46
GLOSSARY OF TECHNICAL TERMS, ABBREVIATIONS AND UNITS OF MEASURE
Term/Abbreviation Description
3D Three dimensional
acid A descriptive term applied to igneous rocks that contain more than 60% silica (SiO2)
adamellite A variety of granite containing a calcium feldspar and a potassium feldspar in approximate equal amounts
Ag Chemical symbol for silver
agglomerate A volcanic breccia, largely or entirely composed of rounded to sub-angular volcanic fragments.
alteration Change in the mineralogical and chemical composition of a rock, generally produced by hydrothermal fluids or by weathering
andesite A dark coloured, fine-grained, usually extrusive rock of intermediate composition. The fine grained equivalent to the gabbro.
anomaly(ies) Value higher or lower than the expected norm.
Argentiferous Silver bearing.
Au Chemical symbol for gold
basalt/basaltic A fine grained dark coloured extrusive volcanic rock with a low silica content.
base metal Generally a non-ferrous metal inferior in value to the precious metals; usually and especially copper, lead, zinc, nickel.
biotite Common dark coloured mica rich in iron, magnesium and potassium
breccia/brecciated A coarse-grained rock consisting of angular broken rock fragments held together by a fine-grained matrix, distinct from conglomerate.
bullion Refined gold or silver in the form of bars
caldera A large basin-shaped volcanic depression, more or less circular, the diameter of which is many times greater than that of the included vent or vents
Carboniferous Geological time period between 298 and 354 million years ago
Chalcedonic quartz A cryptocrystalline variety of quartz
chalcocite A sulphide mineral of copper (Cu2S)
chalcopyrite A sulphide mineral of iron and copper (CuFeS2)
chargeability A geophysical characteristic of rocks measured by the IP geophysical method
conformable/conformably Said of strata characterised of an unbroken sequence in which the layers are formed one above the other in parallel order by uninterrupted deposition.
Cu Chemical symbol for copper
cut-off grade The lowest grade of mineralisation that qualifies as ore in a given deposit.
dacites/dacitic Volcanic rock (or lava) that characteristically is light in colour and contains 62% to 69% silica and moderate a mounts of sodium and potassium.
DDH Diamond drill hole usually produces solid rock core as sample
Devonian A geological time period from approximately 410 to 354 million years ago
dip Angle made with the horizontal (for a plane this is perpendicular to strike)
disseminated A scattered distribution of generally fine-grained metal-bearing minerals throughout a rock
electromagnetic (EM) A geophysical method employing the generation of electromagnetic waves at the earth’s surface. When the waves impinge on a conducting formation or sulphide rich body at depth they induce an electrical response that can be detected by instruments.
electrum A natural alloy of gold and silver, ranging from pale to deep yellow depending on the proportion of gold to silver.
epithermal deposit A deposit formed shallow depths and low temperatures and pressures, within fissures or other openings in rocks, by deposition from ascending magmatic solutions.
fault A fracture of fracture zone along which there has been displacement of the sides relative to one another parallel to the fracture.
feldspar A group of silicate minerals containing varying amounts of aluminium, sodium, potassium and other elements.
fissure An extensive crack, break or fracture in the rocks; often used to describe a fault.
fold belt A somewhat linear or curvilinear group of rocks, of sub-continental scale, that have suffered a common history of deformation (folding) and other geological events, such as mineralisation
g/t gram/tonne
galena A lead sulphide mineral
geochemical sampling Systematic collection of rock or soil samples in order to study their chemistry.
geochemical survey A systematic study of the variation of chemical elements in rocks or soils.

Independent Technical Review and Valuation of the Mineral Assets of White Rock Minerals Limited January 2013 Goldner and Associates P a g e | 47
geochemically anomalous An area having elevated levels of specified elements in rocks or soils.
grade Average quantity of ore or metal in a specified quantity of rock.
granite Coarse-grained acid igneous rock containing quartz and feldspar.
granitoid Denotes an intrusive rock of granite-like appearance and granitic composition.
granodiorite A coarse grained plutonic granitoid containing quartz, plagioclase feldspar and usually some mafic minerals.
hydrothermal Of or pertaining to hot water, to the actions of hot water or the products of this action, such as mineral deposit precipitation.
induced polarisation (“IP”) A surface electrical geophysical surveying method. New advances enables a surveying to be done in three dimensions 3D
inlier Group of rocks surrounded by rocks of a younger age
intermediate An igneous rock that is transitional between basic (or mafic) and acid (or felsic)
intrusive Of or pertaining to intrusion, both the process and the rock so formed.
JORC Australasian Code for Reporting Exploration Results, Mineral Resources and Ore Reserves 2004 Edition
km kilometre – 1kilometre = 1000 metres
km2 square kilometre – 1 square kilometre = an area of 1000 metres by 1000 metres
koz 1,000 troy ounces
kt 1,000 tonnes
lithology (-ies) Rock type.
low sulphidation A variety of epithermal or porphyry mineral deposit where the sulphur is present at an oxidation state of -2.
m Metre – 1 metre = 100 centimetres
M Million
matrix Fine grained material in rocks between coarser fragments
monzogranite A variety of granite
Mtpa Million tonnes per annum
ounce troy ounce – 12 troy ounces = 1 Avoirdupois pound (lb), 1oz = 31.103477g
outcrop Rock exposed to view at the surface and physically connected to solid rock at depth.
Pb Chemical symbol for lead
Permian Geological time period between 251 and 298 million years ago
phyllic (alteration) Hydrothermal alteration resulting from the removal of sodium calcium and magnesium from rocks
pluton An igneous intrusion usually used in connection with deep-seated granitoid bodies
polymetallic Mineral deposits or prospects containing more than one potentially valuable metal
polymictic Rock containing a variety of fragments
porphyry copper deposits A class of mineral deposits- usually large disseminated low-grade bodies of copper ± gold ± molybdenum mineralisation associated with intrusions
porphyry/porphyries An igneous rock in which larger crystals (“phenocrysts”) are scattered through a matrix of smaller crystals (“groundmass”); descriptive of rocks displaying such textures.
ppm parts per million, 1ppm = 1g/t
precious metals Includes gold, silver and the platinum group metals.
pyrite Common iron sulphide mineral (FeS2).
pyroclastic rock Any rock consisting of un-reworked solid material of whatever size explosively ejected from a volcanic vent.
quartz A mineral composed of silicon and oxygen (SiO2).
RCP Reverse Circulation Percussion - A percussion drilling technique in which the cuttings are recovered up the inside of the drill rods to minimize contamination from the wall of the hole.
resistivity A geophysical characteristic of rocks measured by the IP geophysical method
rhyolite/rhyolitic Fine grained intrusive rocks, often porphyritic, with a glassy matrix and the composition of granite
sandstone A clastic sedimentary rock composed of sand sized grains
secondary Minerals formed from the breakdown of earlier minerals
SG Specific gravity
silica Mineral containing silica and oxygen
sill A tabular igneous intrusion that parallels the planar structure of the surrounding rock.
skarn A metamorphosed calcareous sediment into which silica and other elements, often including metals, have been introduced from an adjoining intrusive body.
soil geochemistry A systematic sampling and chemical analysis of soils.

Independent Technical Review and Valuation of the Mineral Assets of White Rock Minerals Limited January 2013 Goldner and Associates P a g e | 48
sphalerite A sulphide mineral of zinc and iron [(Zn, Fe)S], the main ore mineral of zinc.
stockwork A network of usually quartz veinlets diffused in the original rock
stockwork veining A vein system consisting of a three dimensional network of planar to irregular veinlets
stratabound Confined to a particular strata
stratigraphy The arrangement of strata as to its geographic position and chronological order of sequence.
strike Trend or direction of rock strata in a horizontal plane; to extend in that direction.
subduction zone A region where oceanic crust descends into the Earth’s mantle.
sulphide A mineral compound characterised by the linkage of sulphur with metal.
sulphosalts A type of sulphide in which both the metal and a semimetal are present, forming a double sulphide.
supergene (secondary enrichment)
Said of a mineral deposit or enrichment formed near the surface of the earth, commonly by descending solutions.
t tonne - a metric tonne, 1 tonne = 1000 kilograms
tailings Those portions of washed or milled ore that are regarded as too poor to be treated further, as distinguished from concentrates.
tectonic Major structural events/features
tenement A land use instrument issued by state governments for regulation of mineral exploration and mining.
tennantite A blackish, lead-grey copper, iron, arsenic sulphide [(Cu,Fe)12As4S13]. It is the isomorphous form of tetrahedrite.
Tertiary A geological time period between 65 and 2 million years ago.
tetrahedrite A copper sulphide mineral containing iron and antimony (Cu, Fe)12Sb4S13)
tuff/tuffaceous Volcanic ash strata (derived from weathering of, or containing, tuff strata).
unconformable(-y) Descriptive of rocks on either side of an unconformity.
vein Generally tabular mineral deposit, usually relatively narrow and occurring between well-defined walls.
volcaniclastic A clastic rock containing material derived from volcanic source rocks.
volcanics A rock formed in, or derived from volcanoes.
Zn Chemical symbol for zinc.