Embed Size (px)
DESCRIPTION
RAymond Finance
Citation preview

Adil ShaikhRoll no-40

Eight decades old group, in operation since 1925
One of India's largest branded fabric and fashion retailer
Market leader in the worsted fabrics business with over 60% market share
Second largest branded apparel business in India
Owns prestigious award winning brands like Raymond, Park Avenue, Colorplus , Parx

One Page Profile
Key indicators (BSE) 26-Dec-14Closing price (Rs.) 501.2EPS (Rs.) 8.75P/E (times) 57.31BV per share (Rs.) 181.41PB (times) 2.76Mkt. cap (Rs. Crore) 3,076.41Beta 1.58Returns 1 mth (%) 1.26Returns 12 mth (%) 70.78Excess returns over Nifty (12 mths)(%) 40.18Yield (%) 0.4Avg. daily vol. (30 days) (Rs. Crore)
6.11
Shares outstanding (nos) 6,13,80,854
Shareholding (%) Sep-14Promoters 40.2Public 27.77FIIs 8.91Others 23.12

Ownership of Equity Shares & Number of Owners
30-Sep-14 Shares Held
(Nos.) (% of Total)
Total 6,13,80,854 100
Promoters 2,46,75,453 40.2 Indian 2,46,75,453 40.2 Individuals & HUF 2,78,710 0.45 Central & State Govt. Corporate Bodies 2,43,96,743 39.75 FIs & Banks Others Foreign Individuals(NRIs) Corporate Bodies Institutions Others Persons acting in concert
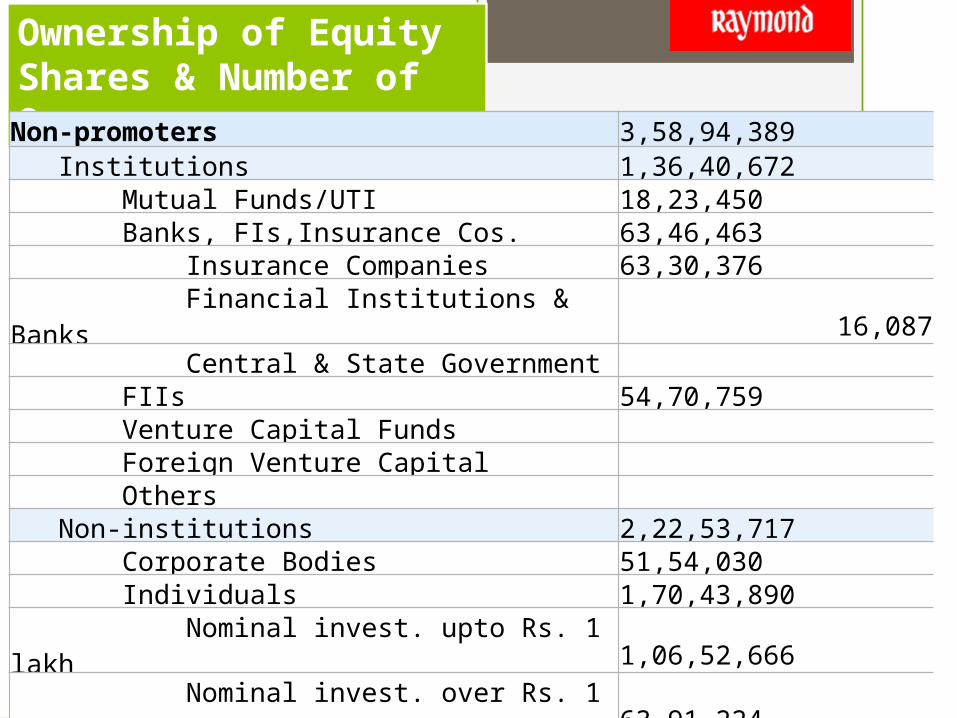
Ownership of Equity Shares & Number of Owners
Non-promoters 3,58,94,389 Institutions 1,36,40,672 Mutual Funds/UTI 18,23,450 Banks, FIs,Insurance Cos. 63,46,463 Insurance Companies 63,30,376 Financial Institutions & Banks 16,087 Central & State Government FIIs 54,70,759 Venture Capital Funds Foreign Venture Capital Others Non-institutions 2,22,53,717 Corporate Bodies 51,54,030 Individuals 1,70,43,890 Nominal invest. upto Rs. 1 lakh 1,06,52,666 Nominal invest. over Rs. 1 lakh 63,91,224 Others 55,797Shares held by Custodians 8,11,012
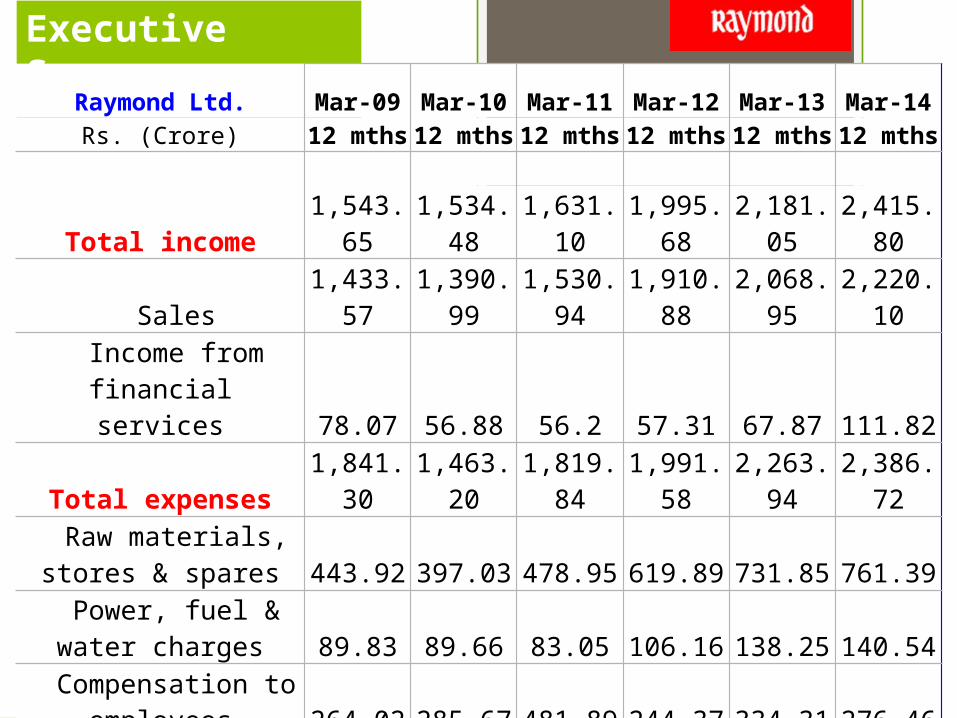
Executive Summary
Raymond Ltd. Mar-09 Mar-10 Mar-11 Mar-12 Mar-13 Mar-14Rs. (Crore) 12 mths 12 mths 12 mths 12 mths 12 mths 12 mths
- Total income 1,543.65 1,534.48 1,631.10 1,995.68 2,181.05 2,415.80
Sales 1,433.57 1,390.99 1,530.94 1,910.88 2,068.95 2,220.10 Income from financial
services 78.07 56.88 56.2 57.31 67.87 111.82Total expenses 1,841.30 1,463.20 1,819.84 1,991.58 2,263.94 2,386.72
Raw materials, stores & spares 443.92 397.03 478.95 619.89 731.85 761.39
Power, fuel & water charges 89.83 89.66 83.05 106.16 138.25 140.54
Compensation to employees 264.02 285.67 481.89 244.37 334.31 276.46
Indirect taxes 14.88 5.65 8.22 7.26 5.01 3.12 Selling & distribution
expenses 146.14 134.59 159.48 185.22 186.6 163.95 Interest paid 99.24 119.63 125.48 151.54 172.93 161.95 Depreciation 88.79 111.3 103.72 109.86 116.02 114.5

Profits Mar-09 Mar-10 Mar-11 Mar-12 Mar-13 Mar-14
PBDITA 231 269.66 113.93 349.85 257.07 449.5
PBDITA net of P&E&OI&FI 123.02 129.18 14.43 265.33 145.45 274.85
Profit after tax (PAT) -271.55 25.06 -100.19 56.35 -47.84 88.12
PAT net of P&E -277.48 -41.34 -131.09 45.97 -73.08 44.68
Growth (%)
Total income 0.92 -0.59 6.3 22.35 9.29 10.76
Total expenses 22.1 -20.53 24.37 9.44 13.68 5.42 PBDITA net of
P&E&OI&FI 32.12 5.01 -88.83 1,738.74 -45.18 88.97
PAT net of P&E
Net worth -19.12 2.18 -9.15 3.63 -6.64 6.77
Total assets 9.76 -3.99 0.73 13.22 1.99 -0.17
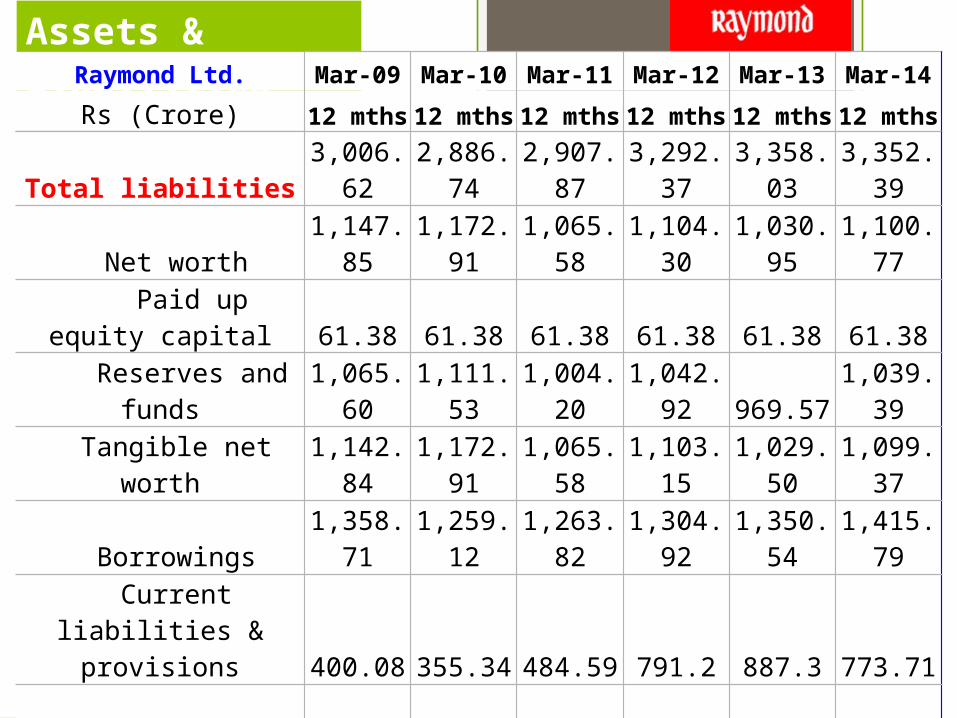
Assets & LiabilitiesRaymond Ltd. Mar-09 Mar-10 Mar-11 Mar-12 Mar-13 Mar-14
Rs (Crore) 12 mths 12 mths 12 mths 12 mths 12 mths 12 mths
Total liabilities 3,006.62 2,886.74 2,907.87 3,292.37 3,358.03 3,352.39
Net worth 1,147.85 1,172.91 1,065.58 1,104.30 1,030.95 1,100.77
Paid up equity capital 61.38 61.38 61.38 61.38 61.38 61.38
Reserves and funds 1,065.60 1,111.53 1,004.20 1,042.92 969.57 1,039.39
Tangible net worth 1,142.84 1,172.91 1,065.58 1,103.15 1,029.50 1,099.37
Borrowings 1,358.71 1,259.12 1,263.82 1,304.92 1,350.54 1,415.79
Current liabilities & provisions 400.08 355.34 484.59 791.2 887.3 773.71
Total assets 3,006.62 2,886.74 2,907.87 3,292.37 3,358.03 3,352.39
Net fixed assets 999.04 940.42 857.74 867.21 834.26 673.78
Investments 888.61 891.78 740.13 777.3 744.85 770.2
Current assets 739.53 646.88 798.32 898.99 984.96 1,110.97
Loans & advances 245.72 287.7 312.57 533.19 559.84 577.61
Gross fixed assets 1,700.64 1,713.40 1,726.61 1,825.30 1,866.62 1,806.16

Profitability & Liquidity Ratio
Raymond Ltd. Mar-09 Mar-10 Mar-11 Mar-12 Mar-13 Mar-14
Rs (Crore) 12 mths 12 mths 12 mths 12 mths 12 mths 12 mthsProfitability ratios
PBDITA net of P&E&OI&FI as % of sales 8.58 9.29 0.94 13.89 7.03 12.38 PAT net of P&E as % of total income net of P&E -18.07 -2.82 -8.2 2.32 -3.39 1.9
PAT net of P&E as % of net worth -21.62 -3.56 -11.71 4.24 -6.85 4.19
PAT net of P&E as % of total assets excl reval -9.66 -1.4 -4.52 1.48 -2.2 1.33
Liquidity ratios (times)
Quick ratio 0.823 0.918 0.698 0.508 0.462 0.598 Current ratio 1.374 1.461 1.369 0.976 0.924 1.161
Debt to equity ratio 1.184 1.074 1.186 1.182 1.31 1.286 Interest cover -1.883 0.602 -0.434 1.435 0.619 1.272 Debtors (days) 77.58 81.03 75.7 69.71 72.26 74.06
Creditors (days) 80.64 92.85 81.55 95.99 97.6 94.7

Distribution of Expenses
Raymond Ltd. Mar-10 Mar-11 Mar-12 Mar-13 Mar-14 Mar-15Currency: Rs. Crore (Non-
Annualised) 12 mths 12 mths 12 mths 12 mths 12 mths 12 mths-
Distribution of total expenses 100 100 100 100 100 100
Operating expenses 83.08 88.21 85.26 86.51 83.98 89.95 Financial charges 8.2 7.03 7.84 7.84 7.42 6.24
Provisions 0.83 0.82 0.34 0.01 0.19 0.03 Non-cash charges 8.12 6.59 5.51 5.3 7.53 3.43
Prior period and extra-ordinary expenses 0.21 0.04 0.01 0.02 0.88 0
Provision for direct tax -0.43 -2.69 1.04 0.32 0 0.35
Distribution of operating expenses 100 100 100 100 100 100
Raw materials, stores & spares 32.66 29.84 36.51 37.37 37.99 29.74
Raw material expenses 25.83 24.54 30.6 31.41 31.39 24.39 Stores, spares, tools
consumed 6.83 5.3 5.9 5.95 6.6 5.35 Purchase of finished goods 6.14 5.96 8.58 7.54 11.38 23.31
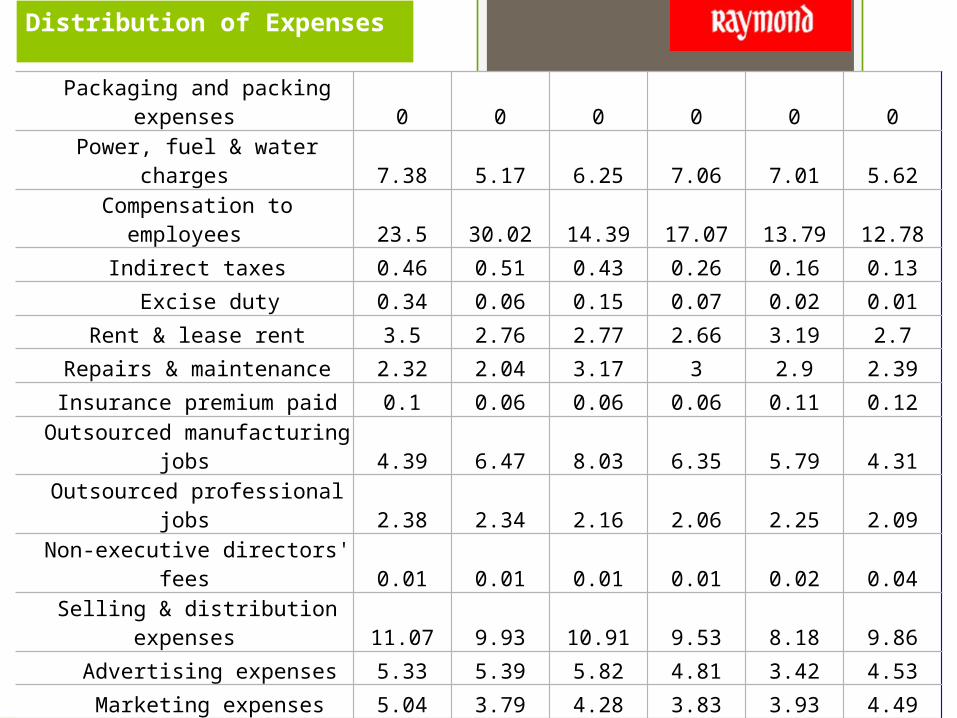
Distribution of Expenses
Packaging and packing expenses 0 0 0 0 0 0
Power, fuel & water charges 7.38 5.17 6.25 7.06 7.01 5.62
Compensation to employees 23.5 30.02 14.39 17.07 13.79 12.78
Indirect taxes 0.46 0.51 0.43 0.26 0.16 0.13
Excise duty 0.34 0.06 0.15 0.07 0.02 0.01
Rent & lease rent 3.5 2.76 2.77 2.66 3.19 2.7
Repairs & maintenance 2.32 2.04 3.17 3 2.9 2.39
Insurance premium paid 0.1 0.06 0.06 0.06 0.11 0.12
Outsourced manufacturing jobs 4.39 6.47 8.03 6.35 5.79 4.31
Outsourced professional jobs 2.38 2.34 2.16 2.06 2.25 2.09
Non-executive directors' fees 0.01 0.01 0.01 0.01 0.02 0.04
Selling & distribution expenses 11.07 9.93 10.91 9.53 8.18 9.86
Advertising expenses 5.33 5.39 5.82 4.81 3.42 4.53
Marketing expenses 5.04 3.79 4.28 3.83 3.93 4.49
Distribution expenses 0.71 0.75 0.81 0.88 0.83 0.83
Travel expenses 0 0.9 2.06 1.46 1.49 1.41
Miscellaneous expenditure 5.68 3.11 3.63 4.57 4.66 4.52
Other operational exp of industrial ent 0.4 0.88 1.03 1.02 1.08 0.99
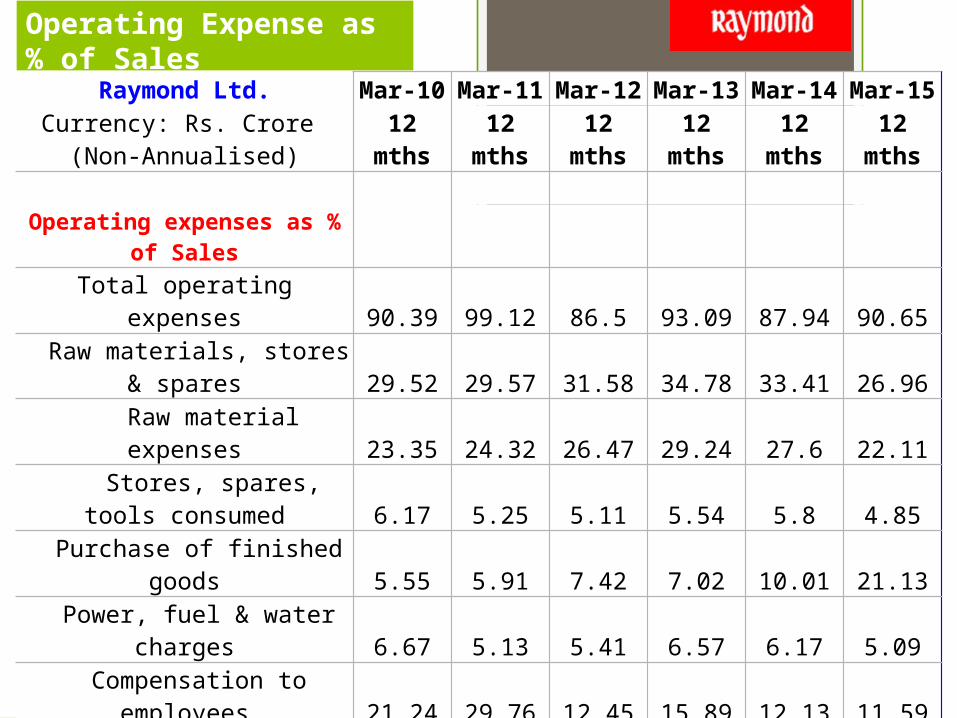
Operating Expense as % of Sales
Raymond Ltd. Mar-10 Mar-11 Mar-12 Mar-13 Mar-14 Mar-15Currency: Rs. Crore (Non-
Annualised) 12 mths 12 mths 12 mths 12 mths 12 mths 12 mths-
Operating expenses as % of Sales
Total operating expenses 90.39 99.12 86.5 93.09 87.94 90.65 Raw materials, stores &
spares 29.52 29.57 31.58 34.78 33.41 26.96 Raw material expenses 23.35 24.32 26.47 29.24 27.6 22.11
Stores, spares, tools consumed 6.17 5.25 5.11 5.54 5.8 4.85
Purchase of finished goods 5.55 5.91 7.42 7.02 10.01 21.13 Power, fuel & water charges 6.67 5.13 5.41 6.57 6.17 5.09 Compensation to employees 21.24 29.76 12.45 15.89 12.13 11.59
Indirect taxes 0.42 0.51 0.37 0.24 0.14 0.11 Excise duty 0.31 0.06 0.13 0.07 0.01 0.01
Rent & lease rent 3.17 2.74 2.4 2.47 2.81 2.45 Repairs & maintenance 2.1 2.03 2.74 2.79 2.55 2.16 Insurance premium paid 0.09 0.06 0.05 0.06 0.09 0.11
Outsourced manufacturing jobs 3.97 6.42 6.95 5.91 5.09 3.91

Operating Expense as % of Sales
Outsourced professional jobs 2.15 2.32 1.87 1.92 1.98 1.89
Non-executive directors' fees 0.01 0.01 0.01 0.01 0.01 0.03 Selling & distribution
expenses 10.01 9.85 9.43 8.87 7.19 8.93
Advertising expenses 4.82 5.34 5.04 4.48 3.01 4.1
Marketing expenses 4.55 3.76 3.7 3.57 3.46 4.07
Distribution expenses 0.64 0.74 0.7 0.82 0.73 0.76
Travel expenses 0 0.89 1.78 1.36 1.31 1.28
Communications expenses 0 0 0 0 0 0
Printing & stationery expenses 0 0 0 0 0 0
Miscellaneous expenditure 5.13 3.09 3.14 4.25 4.1 4.1 Other operational exp of
industrial ent 0.36 0.87 0.89 0.95 0.95 0.9 Other operational exp of non-
fin services ent 0 0 0 0 0 0

Peer Group Comparison
Currency: Rs. Million (Non-Annualised) YearRank
by Size
PAT as % of total income
PAT net of P&E as % of net sales & other income
Operating expenses
Aditya Birla Nuvo Ltd. Jun-15 1 4.247099162 4.247099162 92.40777756
Welspun India Ltd. Jun-15 2 15.0616746 15.0616746 81.61849124
S R F Ltd. Jun-15 3 10.82650308 10.82650308 84.68332013
Trident Ltd. Jun-15 4 6.92203767 6.92203767 83.83118339
Raymond Ltd. Jun-15 5 -1.428745666 -1.708744649 91.46664117
S E L Manufacturing Co. Ltd. Jun-15 6 -7.438934786 -11.01605466 75.28855721
Banswara Syntex Ltd. Jun-15 7 0.580369264 0.580369264 87.60494843
Flexituff International Ltd. Jun-15 8 0.508941825 0.0639023 86.16160182
Himatsingka Seide Ltd. Jun-15 9 16.80304687 16.80304687 89.02803997
Garware-Wall Ropes Ltd. Jun-15 10 6.090651558 6.090651558 94.63832063

SWOT Analysis

Latest News