Embed Size (px)
DESCRIPTION
Investigating Tropical Tropospheric O 3 and CO during the 2006 El Niño using TES observations and GEOS-Chem. Ray Nassar, Jennifer Logan, Lee Murray, Lin Zhang, Inna Megretskaia Harvard University COSPAR, Montreal, 2008 July 13-19. El Niño Southern Oscillation (ENSO). - PowerPoint PPT Presentation
Citation preview
Ray Nassar, Jennifer Logan, Lee Murray, Lin Zhang, Inna Megretskaia
Harvard University
COSPAR, Montreal, 2008 July 13-19
Investigating Tropical Tropospheric O3 and CO during the 2006 El Niño using TES observations and GEOS-Chem
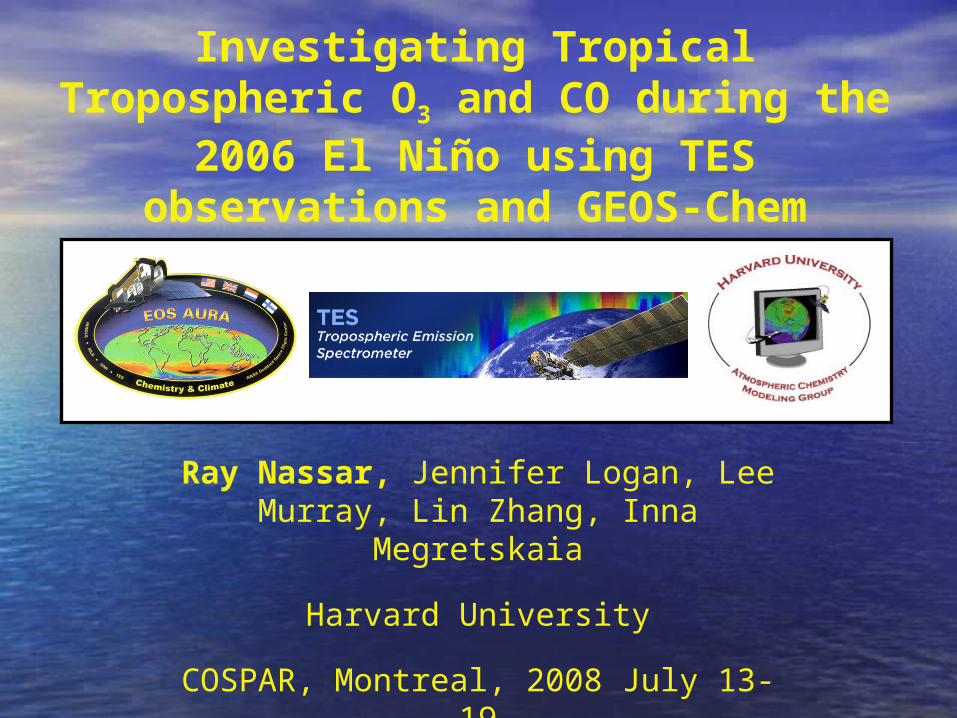
El Niño Southern Oscillation (ENSO)
Oceanic-Atmospheric phenomenon
warm phase – El Niño
cold phase – La Niña
SST anomalies and changes in ocean circulation induce changes in atmospheric convection, precipitation and chemical composition
… also Indian Ocean Dipole (IOD)
both ENSO & IOD influence Indonesian region, but warm phases rarely coincide: 1963, 1972, 1997 and 2006
http://www.cgd.ucar.edu/cas/
Saji et al. (1999) Nature
5°N-5°S, 170-120°W
Niño 3.4
ENSO
IOD
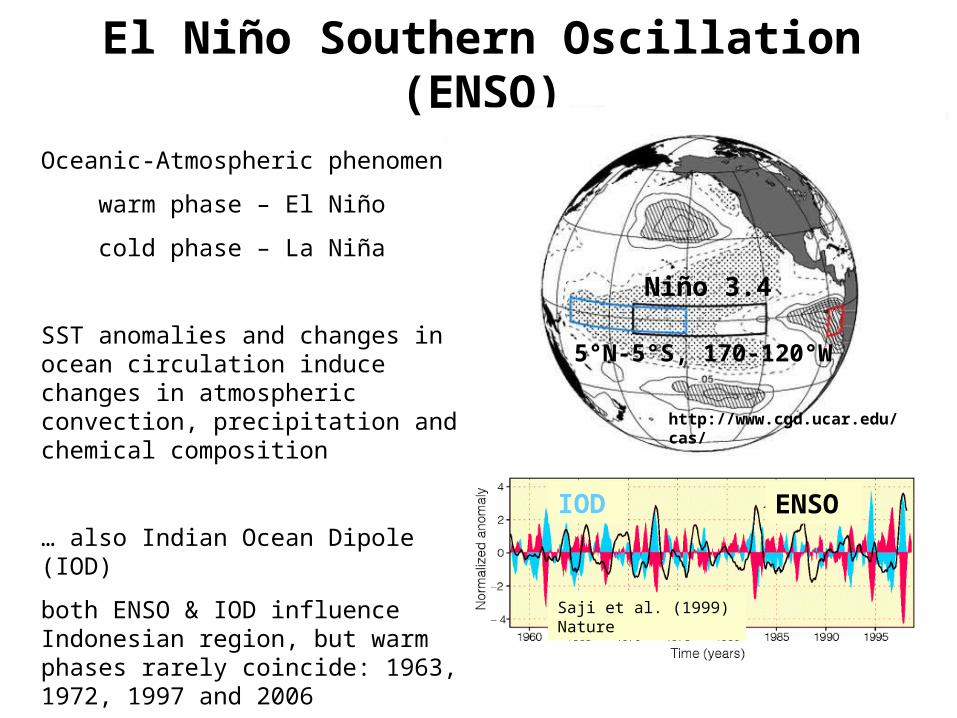
Ozone during the 1997 El Niño
“Asymmetric Dipole Anomalies”
TOMS Tropospheric Column Ozone (TCO) residual
MLS H2O at 215 hPa
NOAA Outgoing Longwave Radiation (OLR)
http://ggweather.com/enso/nino_regions.gif
Chandra et al. (1998) GRL
O3
H2O
OLR
1997 – 1996 Anomalies
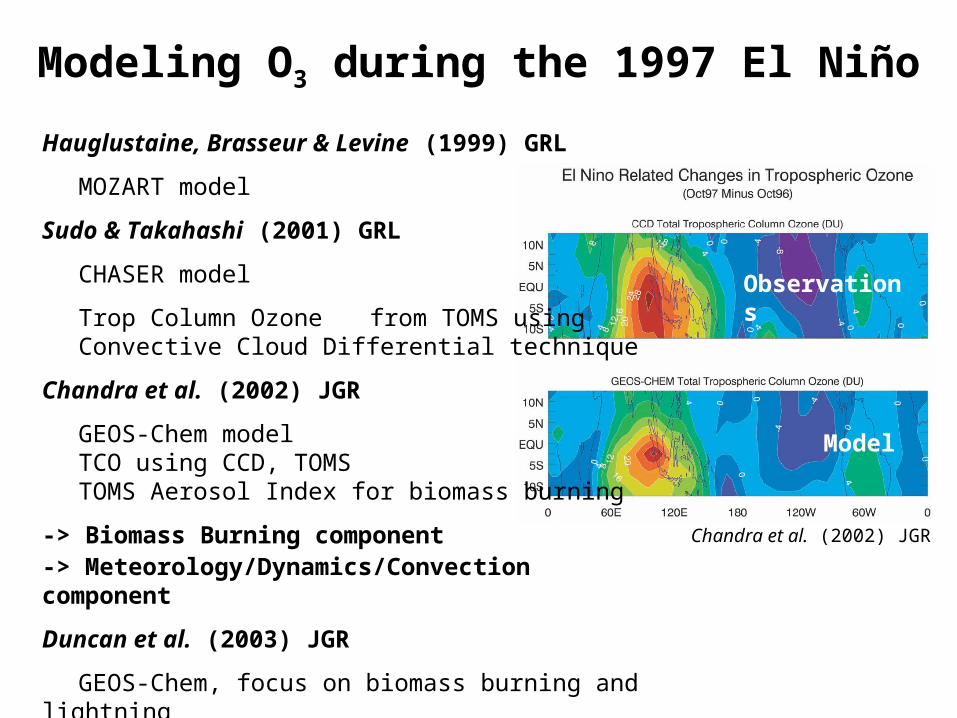
Modeling O3 during the 1997 El Niño
Hauglustaine, Brasseur & Levine (1999) GRL
MOZART model
Sudo & Takahashi (2001) GRL
CHASER model
Trop Column Ozone from TOMS using Convective Cloud Differential technique
Chandra et al. (2002) JGR
GEOS-Chem modelTCO using CCD, TOMSTOMS Aerosol Index for biomass burning
-> Biomass Burning component-> Meteorology/Dynamics/Convection component
Duncan et al. (2003) JGR
GEOS-Chem, focus on biomass burning and lightning
Chandra et al. (2002) JGR
Observations
Model
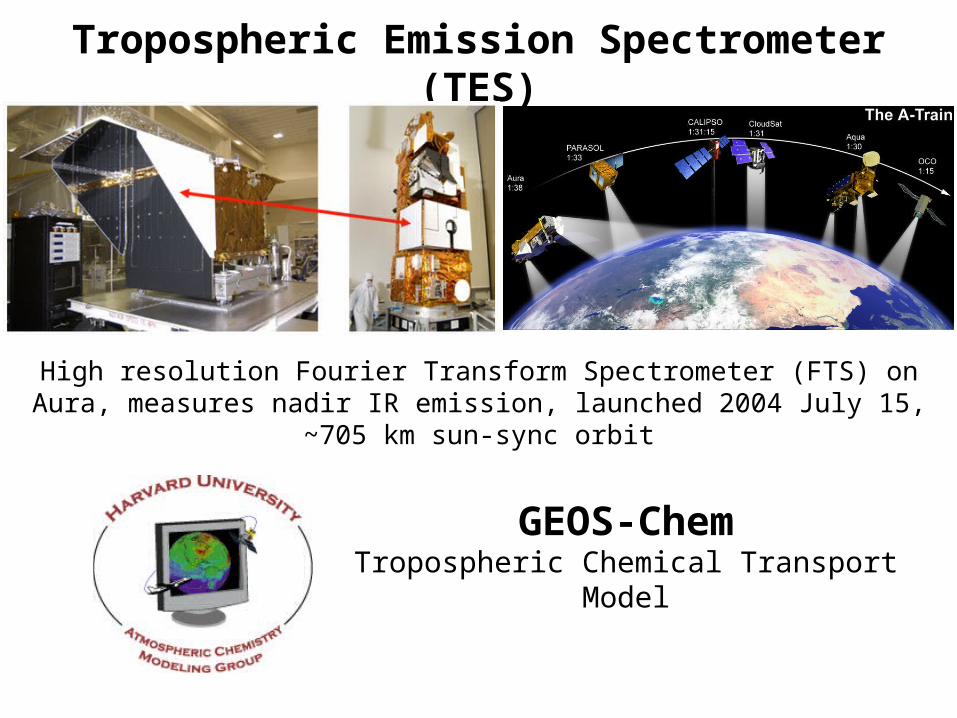
Tropospheric Emission Spectrometer (TES)
High resolution Fourier Transform Spectrometer (FTS) on Aura, measures nadir IR emission, launched 2004 July 15, ~705 km sun-
sync orbit
GEOS-ChemTropospheric Chemical Transport
Model
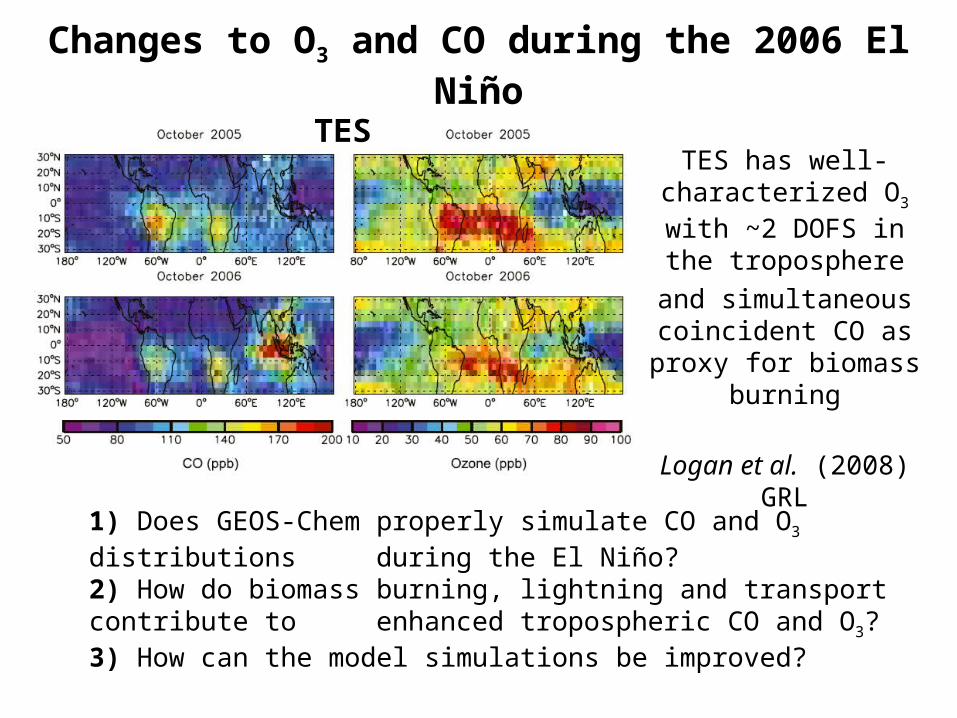
Changes to O3 and CO during the 2006 El Niño
TES has well-characterized O3
with ~2 DOFS in the troposphere
and simultaneous coincident CO as proxy for biomass
burning
Logan et al. (2008) GRL
1) Does GEOS-Chem properly simulate CO and O3 distributions during the El Niño?2) How do biomass burning, lightning and transport contribute to enhanced tropospheric CO and O3?3) How can the model simulations be improved?
TES
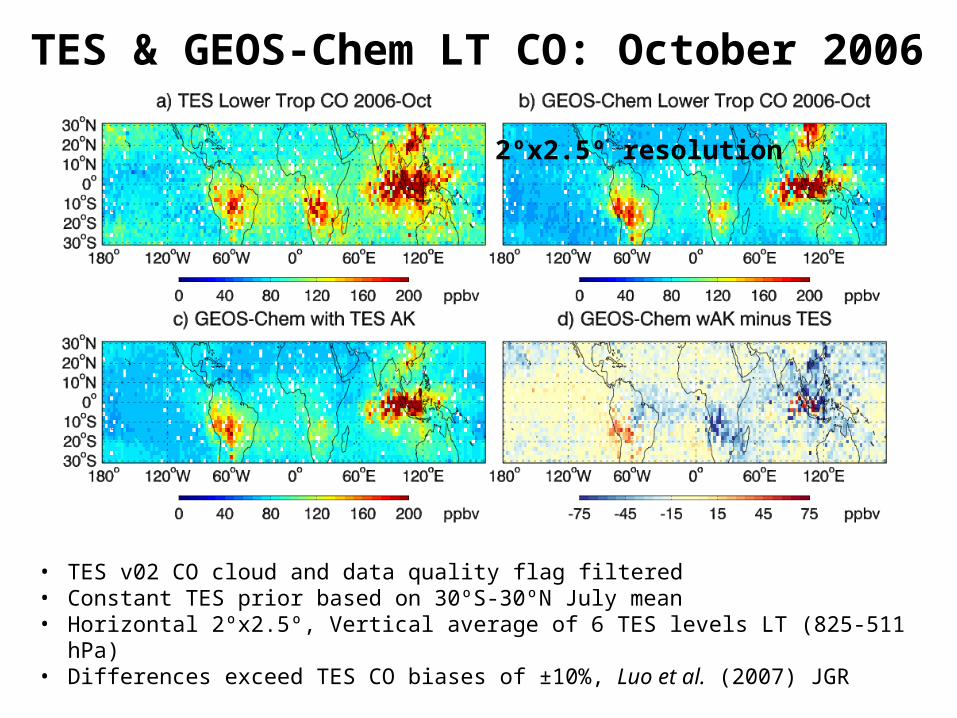
TES & GEOS-Chem LT CO: October 2006
• TES v02 CO cloud and data quality flag filtered• Constant TES prior based on 30ºS-30ºN July mean• Horizontal 2ºx2.5º, Vertical average of 6 TES levels LT (825-511 hPa)• Differences exceed TES CO biases of ±10%, Luo et al. (2007) JGR
2ºx2.5º resolution
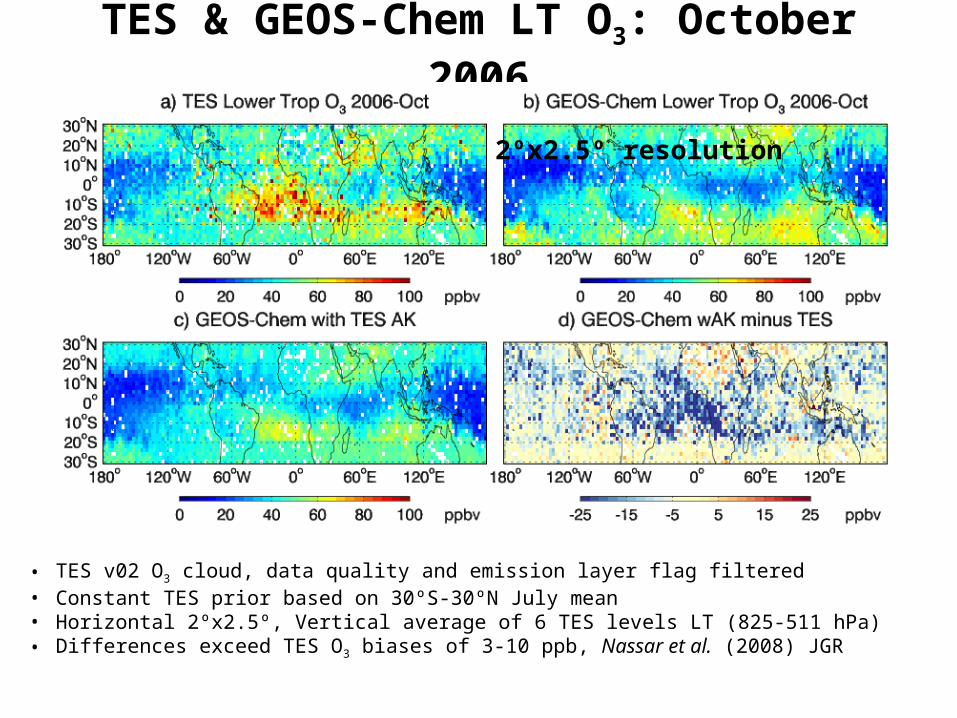
TES & GEOS-Chem LT O3: October 2006
• TES v02 O3 cloud, data quality and emission layer flag filtered• Constant TES prior based on 30ºS-30ºN July mean• Horizontal 2ºx2.5º, Vertical average of 6 TES levels LT (825-511 hPa)• Differences exceed TES O3 biases of 3-10 ppb, Nassar et al. (2008) JGR
2ºx2.5º resolution
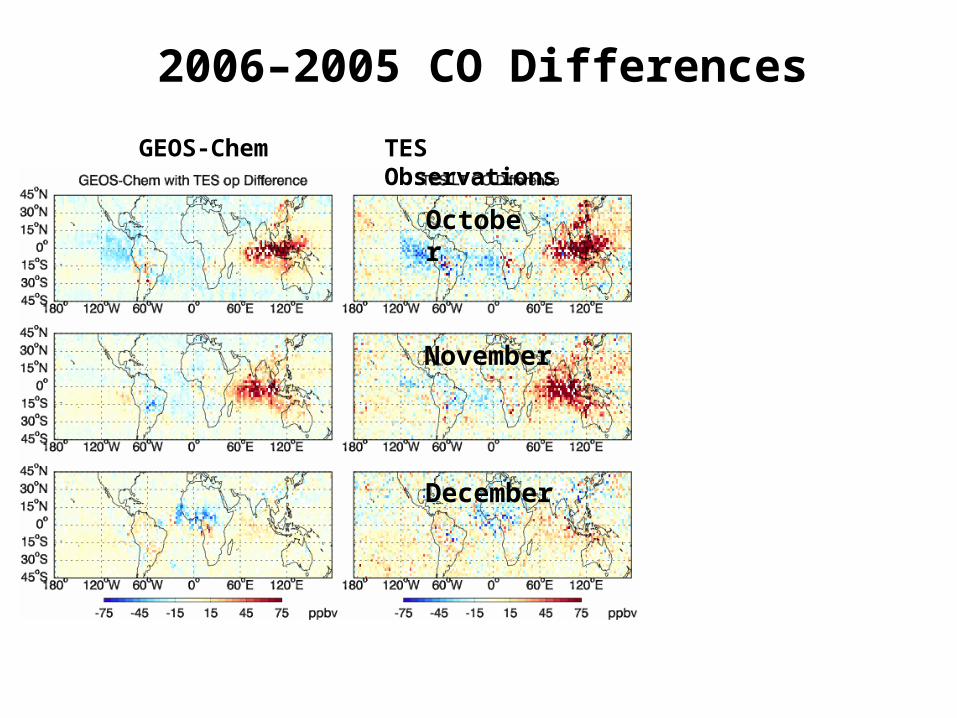
2006–2005 CO Differences
October
November
December
GEOS-Chem TES Observations
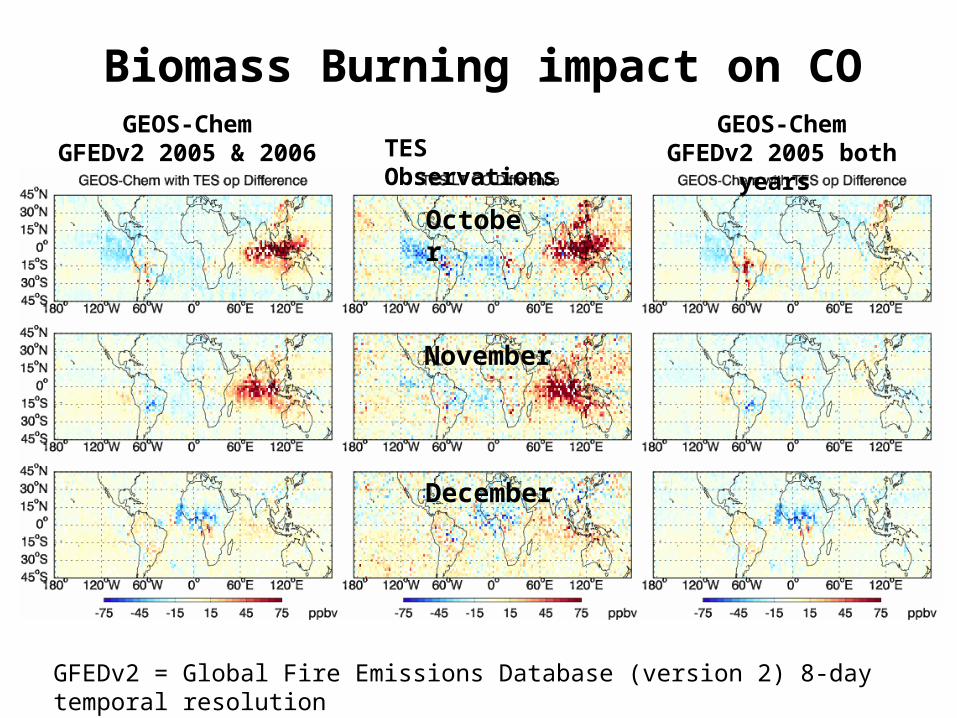
Biomass Burning impact on CO
TES Observations
GEOS-ChemGFEDv2 2005 &
2006
GEOS-ChemGFEDv2 2005 both
years
October
November
December
GFEDv2 = Global Fire Emissions Database (version 2) 8-day temporal resolution
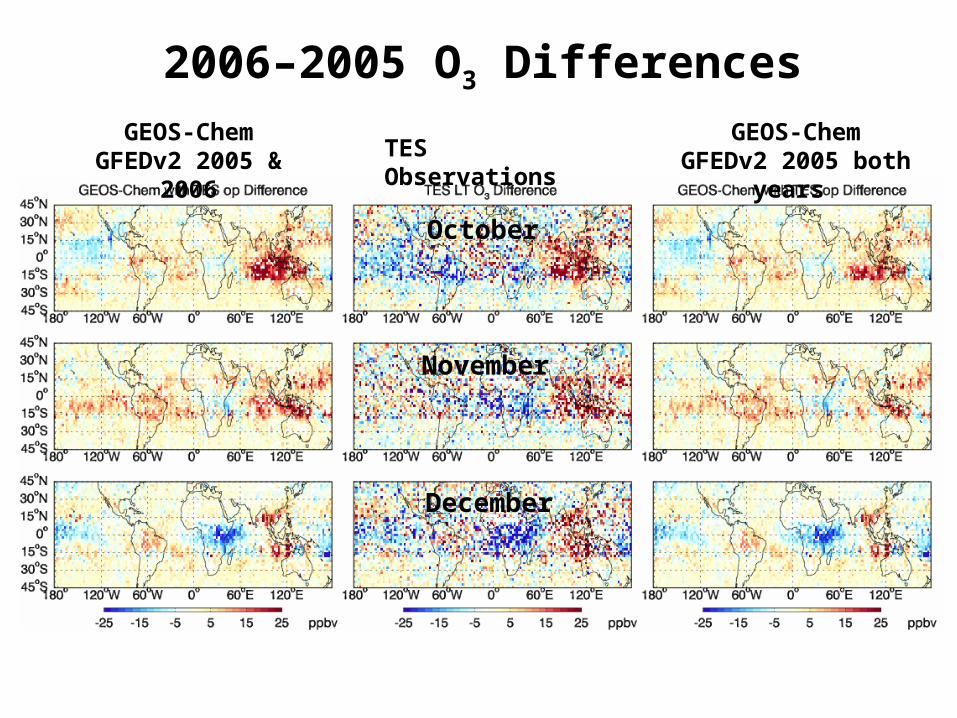
2006–2005 O3 Differences
October
November
December
GEOS-ChemGFEDv2 2005 &
2006
GEOS-ChemGFEDv2 2005 both
years
TES Observations
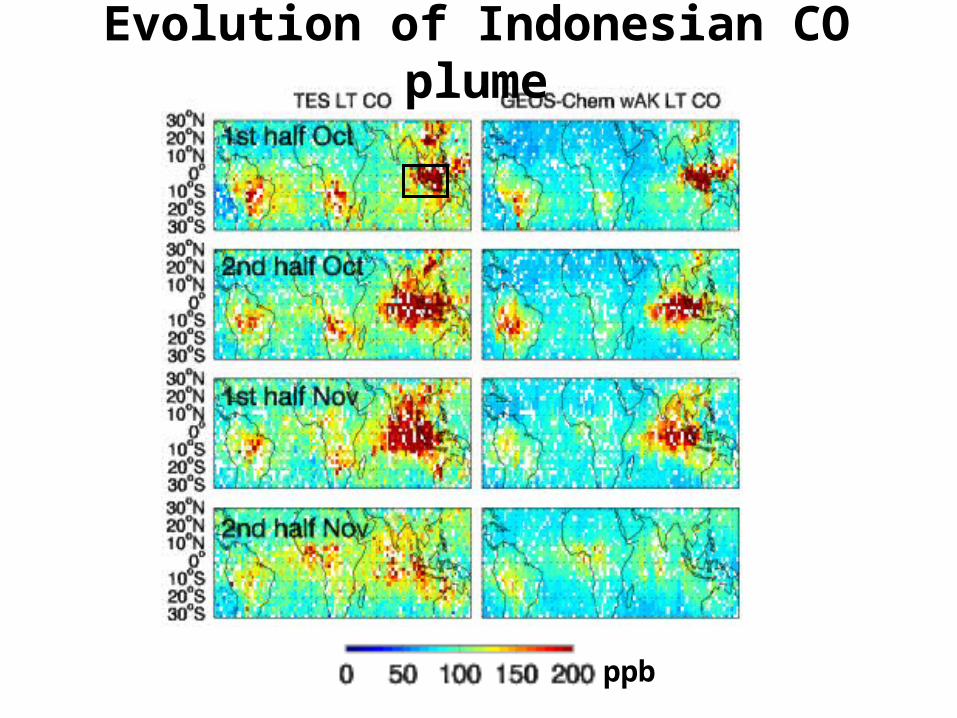
Evolution of Indonesian CO plume
ppb
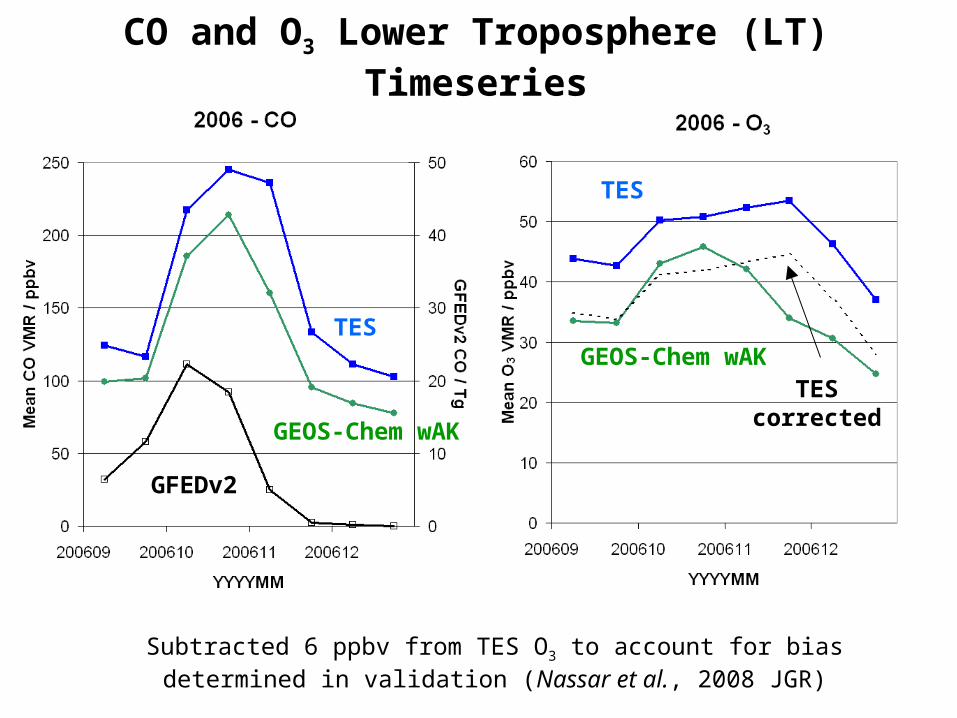
CO and O3 Lower Troposphere (LT) Timeseries
Subtracted 6 ppbv from TES O3 to account for bias determined in validation (Nassar et al., 2008 JGR)
GFEDv2
TES
GEOS-Chem wAKTES
corrected
TES
GEOS-Chem wAK
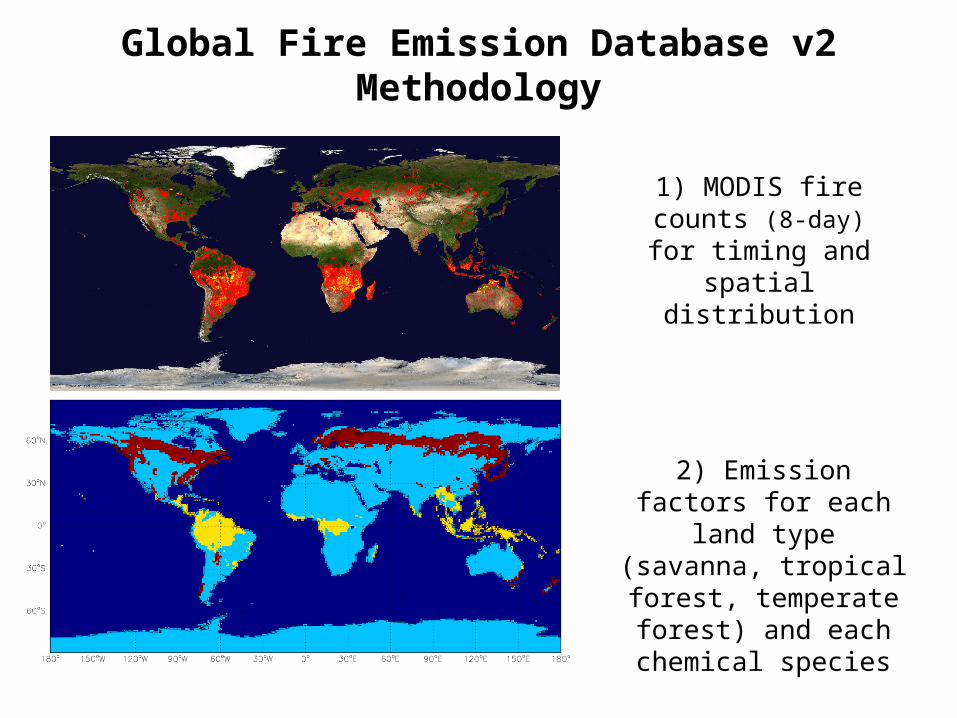
Global Fire Emission Database v2 Methodology
1) MODIS fire counts (8-day) for timing and spatial
distribution
2) Emission factors for each land type (savanna, tropical forest, temperate forest) and each chemical species
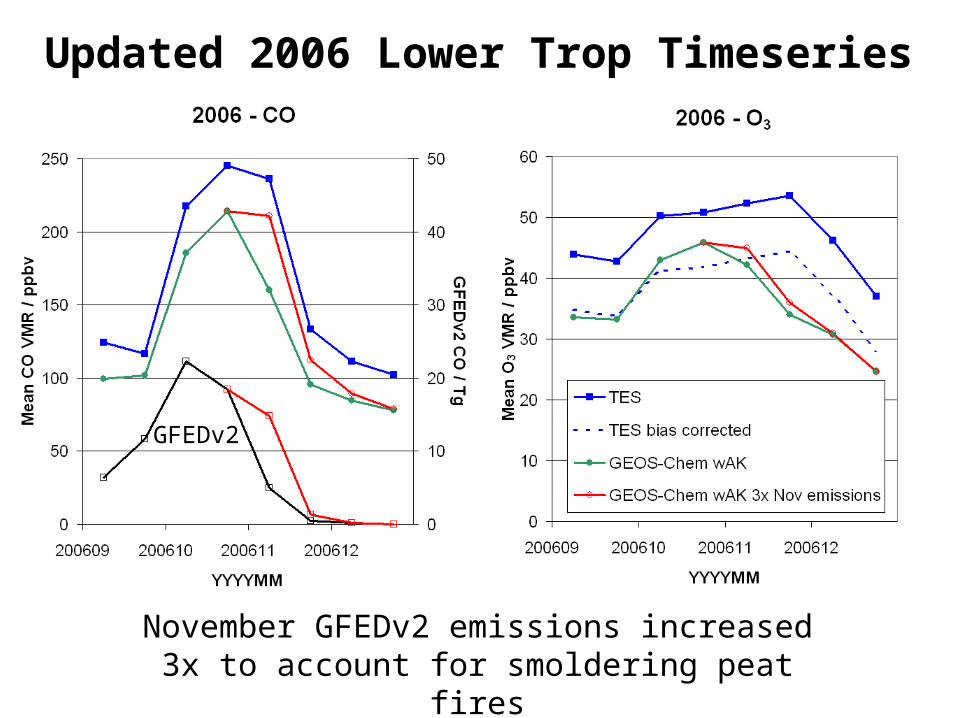
Updated 2006 Lower Trop Timeseries
November GFEDv2 emissions increased 3x to account for smoldering peat fires
GFEDv2
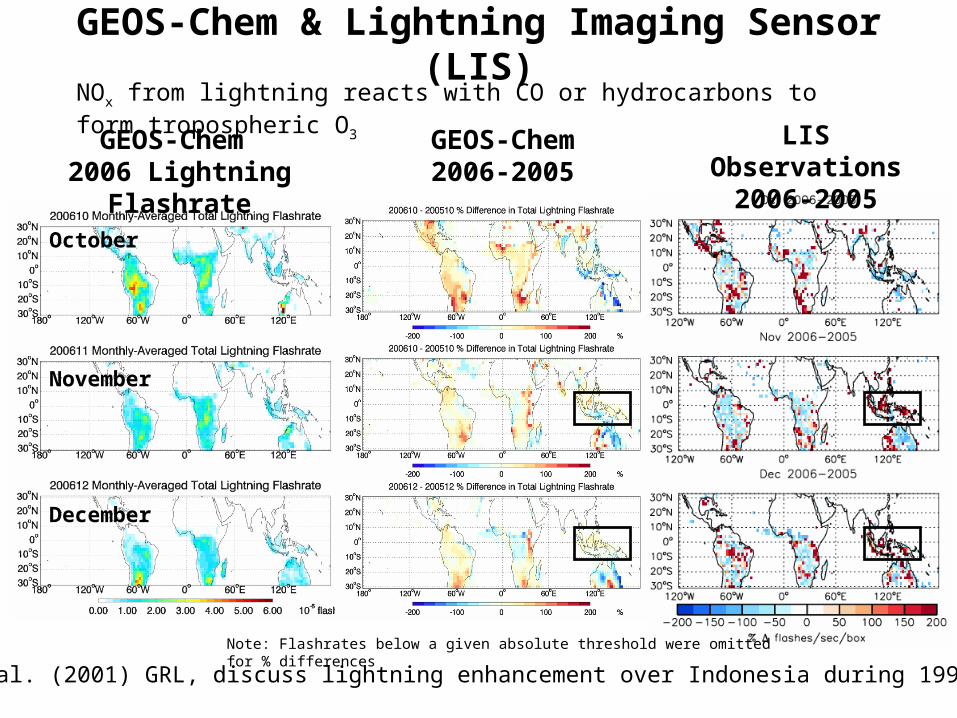
GEOS-Chem & Lightning Imaging Sensor (LIS)
October
November
December
GEOS-Chem 2006 Lightning
Flashrate
GEOS-Chem2006-2005
LIS Observations
2006-2005
Note: Flashrates below a given absolute threshold were omitted for % differences
NOx from lightning reacts with CO or hydrocarbons to form tropospheric O3
Hamid et al. (2001) GRL, discuss lightning enhancement over Indonesia during 1997 El Nino
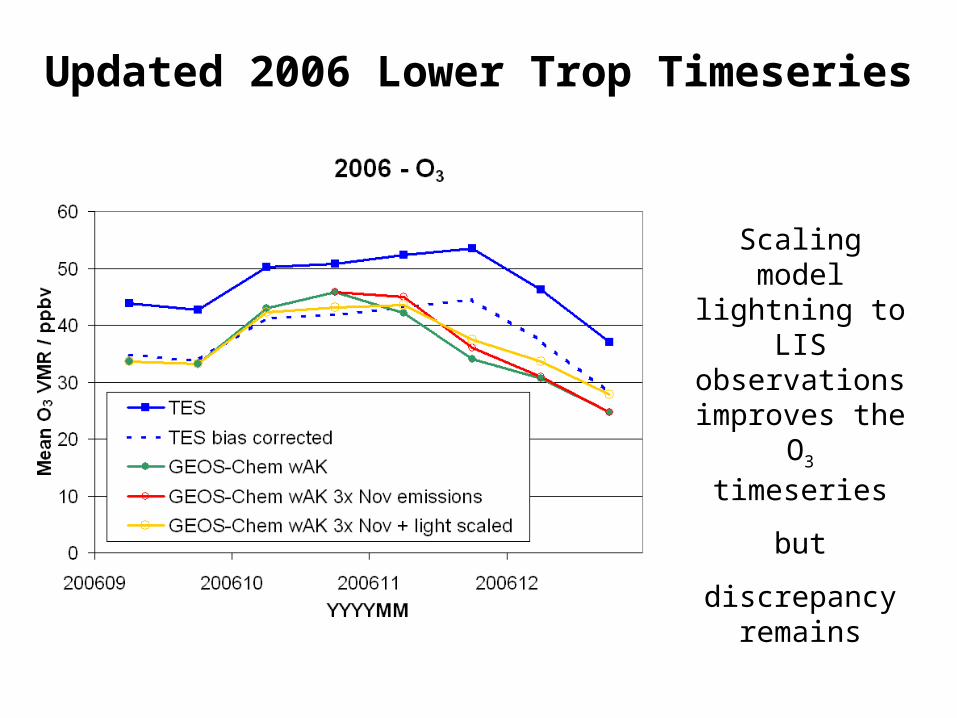
Updated 2006 Lower Trop Timeseries
Scaling model lightning to
LIS observations improves the O3 timeseries
but
discrepancy remains
TES & GEOS-4 UT H2O comparison with O3 anomalies
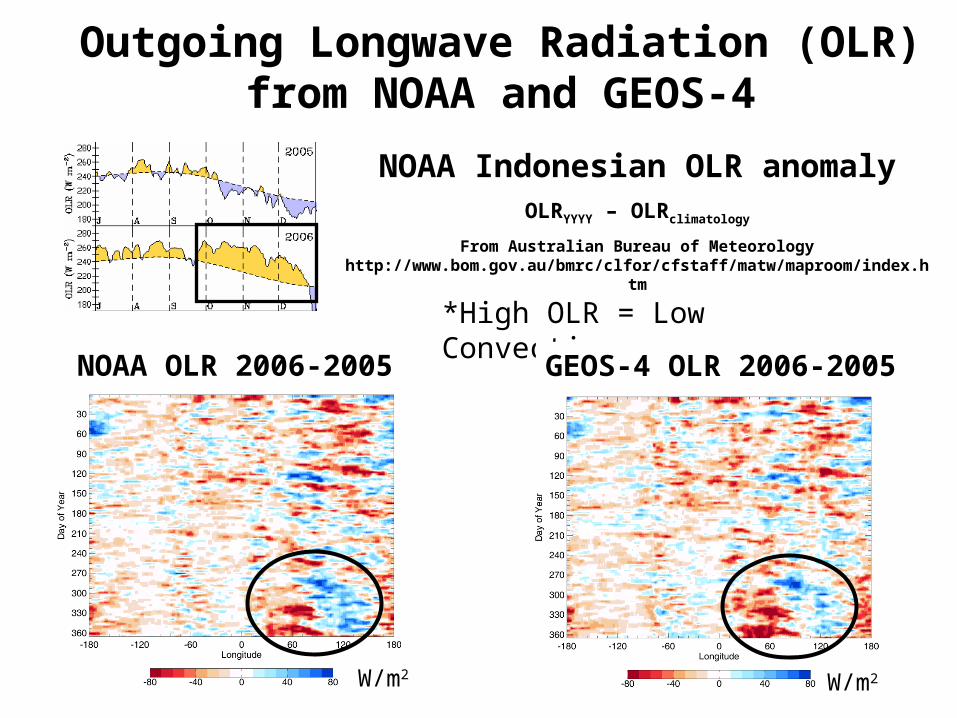
Outgoing Longwave Radiation (OLR) from NOAA and GEOS-4
*High OLR = Low Convection
NOAA Indonesian OLR anomalyOLRYYYY – OLRclimatology
From Australian Bureau of Meteorology http://www.bom.gov.au/bmrc/clfor/cfstaff/matw/maproom/index.
htm
NOAA OLR 2006-2005
GEOS-4 OLR 2006-2005
W/m2
W/m2
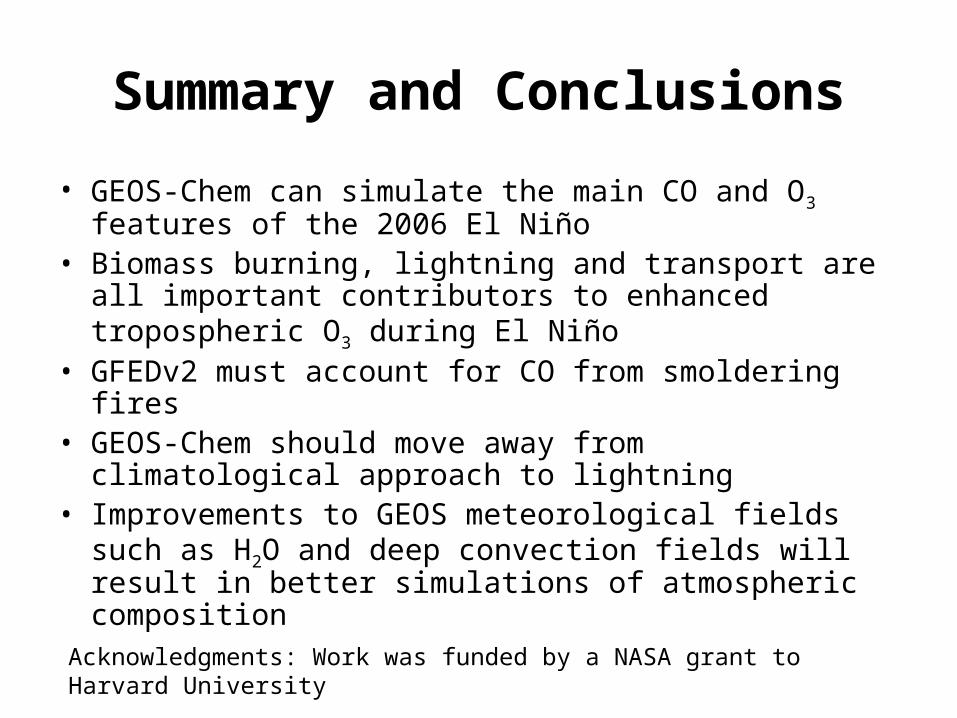
Summary and Conclusions
• GEOS-Chem can simulate the main CO and O3 features of the 2006 El Niño
• Biomass burning, lightning and transport are all important contributors to enhanced tropospheric O3 during El Niño
• GFEDv2 must account for CO from smoldering fires• GEOS-Chem should move away from climatological
approach to lightning• Improvements to GEOS meteorological fields such as
H2O and deep convection fields will result in better simulations of atmospheric composition
Acknowledgments: Work was funded by a NASA grant to Harvard University