Embed Size (px)
Citation preview

RATIONAL ERROR CORRECTION
P. A. Tinsley�
Division of Research and Statistics
Federal Reserve Board
Washington DC 20551
version: July 1998
Abstract: Under general conditions, linear decision rules of agents with rational expectations are
equivalent to restricted error corrections. However, empirical rejections of rational expectation
restrictions are the rule, rather than the exception, in macroeconomics. Rejections often are
conditioned on the assumption that agents aim to smooth only the levels of actions or are subject to
geometric random delays. Generalizations of dynamic frictions on agent activities are suggested
that yield closed-form, higher-order decision rules with improved statistical fits and infrequent
rejections of rational expectations restrictions. Properties of these generalized “rational” error
corrections are illustrated for producer pricing in maufacturing industries.
Keywords: Companion systems, error correction, producer pricing, rational expectations
JEL classifications:C5, E3
�I am indebted for comments on an earlier version of this paper by colleagues and others, especially F. Diebold,S. Johansen, and S. Kozicki. Views presented are those of the author and do not necessarily represent those of theFederal Reserve Board.

1
Intertemporal decision rules are indispensable in rational agent interpretations of
macroeconomic behavior where a distinction is drawn between agent perceptions, summarized
by agent forecasts of market events, and agent responses, subjected to dynamic constraints or
“frictions.” In theoretical macroeconomic models since Lucas (1976), rational expectations have
become the benchmark standard for representing the unobserved forecasts of agents.
Unfortunately, the record for empirical implementation of rational expectations models remains
dismal. A survey of existent journal publications by Ericsson and Irons (1995) summarizes an
extensive accumulation of empirical evidence against rational expectations, including frequent
rejections of rational expectations overidentifying restrictions. A review of policy simulation
models used by central banks and international agencies, such as documented in Bryant et al.
(1993), indicates that many key rational expectations specifications are either imposed or fit by
rough empirical calibrations.
Macroeconomists have adopted a variety of responses to the absence of strong empirical
support for rational expectations. One is to maintain the rational expectations hypothesis, while
aiming to interpret a more limited subset of empirical regularities as discussed by Kydland and
Prescott (1991). Another approach is to view rational expectations as a limiting case of complete
information in a more general treatment of the information processing abilities of agents, such as
the “bounded rationality” models of learning reviewed in Sargent (1993). Closely related is the
position that rational expectations are more likely to prevail at low frequencies, a view compatible
with tests of long-run theoretical restrictions in cointegrating relationships, as discussed by Watson
(1994). Others reject the hypothesis of model-based rational expectations, such as the use in
Ericsson and Hendry (1991) of rule-of-thumb extrapolations.
This paper examines an alternative explanation for the poor empirical properties of rational
expectations models. Because most rational expectations restrictions are inherently dynamic
due to the forecasting requirements of constraints on dynamic adjustment, a plausible source
of difficulty could be the sharp friction priors typically imposed on agent responses. The
standard dynamic specification in rational expectations models utilizes geometric lead response
schedules to anticipated future events and geometric lag responses to recent “news.” Because
this two-sided geometric response schedule is not a clear implication of economic theory, a
generalizedpolynomial frictionsspecification is explored in this paper. Suggested interpretations
of generalized frictions range from costs of adjusting weighted averages of current and lagged
actions to convolutions of geometric random delay distributions of agent responses.
For difference-stationary variables, the decision rules based on generalized frictions are shown
to be isomorphic to a class of “rational” error correction models.1 The parameters of the
1Discussion in this paper is aimed primarily at decision rules for difference-stationary variables, a specificationthat is not rejected by standard tests of the integration order of most macroeconomic aggregates in postwar samples.

2
decision rules are subject to tight cross-coefficient restrictions due to polynomial frictions and
cross-equation restrictions due to the assumption of rational expectations. A closed-form solution
that incorporates these restrictions is derived using two companion matrix systems, one a lead
system for the forward planning required by polynomial frictions and the other a lag system
associated with the agents' forecast model.2
Rational error corrections under polynomial frictions inherit many desirable properties of
atheoretic reduced-form time-series models, including serially independent equation residuals and
small standard errors relative to many theory-based alternatives. However, whereas conventional
error corrections and VARs have been criticized for in-sample overfitting attributable to large
numbers of estimated parameters, rational error corrections are subject to many overidentifying
restrictions which substantially reduce the number of free parameters.
To provide concrete illustrations of the consequences of restrictive priors on adjustment
costs, linear decision rules associated with alternative specifications of frictions are estimated
for producer pricing in several manufacturing industries. The basic specification is based on the
assumptions of difference-stationary producer prices and stationary price markups over costs of
production, assumptions that are not rejected for postwar U.S. producer prices.3
A difficulty with interpreting many reported rejections of rational expectations overidentifying
restrictions is that the rejections could be due also to misspecified models. An advantage of
the side-by-side comparisons reported in this paper is that several empirical problems, including
rejections of rational expectations restrictions, are unambiguously linked to the use of second-order
Euler equations rather than higher-order Euler equations.
The paper is organized as follows. Section I summarizes dynamic properties of the restricted
error correction that is implied by the standard decision rule with geometric response schedules.
Section II derives the error correction format of rational decision rules implied by a generalized
polynomial description of frictions. Several interpretations of polynomial frictions are suggested.
Section III presents empirical estimates of decision rules for industry pricing, comparing the
geometric responses of the standard decision rule with the responses of higher-order decision
rules. A tractable method of two-stage maximum likelihood estimation of rational error corrections
2Although this paper develops a general framework for formulating higher-order error correction decision rules,there are several precedents for recasting decision rules as restricted error corrections or applying higher-order lineardecision rules to macroeconomic aggregates. Nickell (1985) appears to be the first paper to explore similaritiesbetween second-order decision rules and error correction models. Generally, fourth-order decision rules have beenconfined to empirical inventory models, such as Blanchard (1983), Hall, Henry, and Wren-Lewis (1986), Callen, Hall,and Henry (1990), and Cuthbertson and Gasparro (1993). Exceptions are the applications of fourth-order decisionrules to employment in the coal industry by Pesaran (1991) and to the price of manufactured goods in Price (1992).
3State-independent frictions in pricing would not be expected to hold over all possible states, such as episodes ofextreme hyperinflation. Nevertheless, linear time series models appear to be a useful way to analyze sticky pricing inperiods of moderate inflation, vid. Sims (1992) and Christiano, Eichenbaum, and Evans (1994).

3
is derived in the Appendix, including corrections required for the sampling errors of the second
stage. Section IV concludes.
I. Rational Error Correction under Geometric Frictions
Just as one-sided polynomials in the lag operator are characteristic of atheoretic, linear time
series models, two-sided polynomials in the lead and lag operators are a defining characteristic
of linear models of rational behavior. The principal vehicle of analysis in this paper is the dynamic
first-order condition linking a decision variable,yt, to its equilibrium objective,y�t ,
EtfA(L)A(BF )yt � A(1)A(B)y�t g = 0; (1)
whereEtf : g denotes expectations based on information at the end oft � 1; A(L) is a backwards
scalar polynomial in the lag operator,Ljxt = xt�j , ; A(BF ) is a forward scalar polynomial in the
lead operator,F jxt = xt+k,; andB is a discount factor,0 < B < 1.
In contrast to conventional backwards-looking time series models of the relationship between
yt andy�t , a notable feature of equation (1) is that the expectation of the current decision variable,
Etfytg = EtfA(1)A(B)A(L)�1A(BF )�1y�t g;
= Etf1X
i=�1
wiy�t+ig; (2)
is a two-sided moving average of past and expected future values of the desired equilibrium,y�.
The agent response schedule,wi, determines the relative importance of past and future, where1P
i=�1wi = 1. Many models used in macroeconomics assume these relative importance weights are
adequately represented by two-sided geometric response schedules.
In the case of linear decision rules, there are two prominent rationalizations of geometric
response schedules. One is that changes in thelevelof the decision variable are subject to quadratic
adjustment costs, and this strictly convex friction induces geometric adjustments of the decision
variable toward its equilibrium. The second interpretation is that each agent is subjected to a
geometric distribution of random delays in adjustment, so that the level selected for a decision
variable in a given period is a weighted average of desired target settings over the expected interval
between allowable resets. As noted by Rotemberg (1996), the assumption of a geometric random
delay distribution leads to aggregate behavior that is observationally equivalent to that generated
by the assumption of quadratic costs on adjusting the level of the aggregate decision variable.
Under either interpretation, the required Euler equation is second-order, implying that the

4
polynomial components of equation (1) are first-order polynomials,A(L) = (1 � �L) and
A(BF ) = (1 � �BF ), where0 < � < 1. As in Tinsley (1970), the optimal decision rule that
satisfies the Euler equation and the relevant endpoint (initial and transversality) conditions implies
partial adjustment of the decision variable to a discounted weighted average of expected forward
positions of the desired equilibrium.4 This decision rule solution is obtained by multiplying the
Euler equation (1) by the inverse of the lead polynomial,A(BF )�1,
Etf�ytg = �A(1)(yt�1 � y�t�1) + EtfA(1)1Xi=0
(�B)i�y�t+ig; (3)
where�B is the geometric discount factor over the infinite planning horizon.
To complete the derivation of the conventional decision rule, the data generating process of the
forcing term,y�t , must be provided. In linear decision rules, the decision variable,y, is cointegrated
with the conditional equilibrium target,y�, which is defined by a linear function ofq variables.5
y�t =qX
j=1
bjxj;t: (4)
Agent forecasts of the target,y�t+i, are assumed in this paper to be generated byp-order VARs in
theq arguments,x0t = [x1;t; : : : ; xq;t]. Thus, the effective information set of agents is obtained by
stackingp lags of the regressors, into a single vector,z0t�1 = [x0t�1; : : : ; x0t�p]. The companion form
of the agent VAR forecast model is denoted byEtfztg = Hzt�1.6 Consequently, agent forecasts
of the forcing term of the Euler equation are generated by
Etfy�t+ig = �0�Hi+1zt�1; (5)
where thepq � 1 selector vector,��, contains the coefficients of the cointegrating relationship, (4),
that defines the equilibrium objective.
Substituting forecasts of the forcing term from (5) into the decision rule (3) yields
Etf�ytg = �A(1)(yt�1 � y�t�1) + A(1)�0�
1Xi=0
(�BH)i[H � In]zt�1;
= �A(1)(yt�1 � y�t�1) + h0�zt�1: (6)
4Historical references and discussion of issues in formulating linear decision rules with dynamic forcing terms arefound in Tinsley (1970, 1971).
5As needed, theq variables include deterministic trend, intercept, and seasonal dummy series. The concept of adynamic, frictionless equilibrium is discussed by Frisch (1936).
6Companion forms for a variety of linear forecasting models are illustrated in Swamy and Tinsley (1980).

5
As shown in the first line of (6), given the matrix of the forecast model coefficients,H, and the
discount factor,B, a single friction parameter determines a geometric pattern of rational dynamic
responses,� = 1 � A(1). The second line of (6) indicates that the weighted sum of expected
forward changes in the forcing term,Etf�y�t+ig, can be reduced to the inner product of a restricted
coefficient vector times the industry information set
h� = (1� �)[H 0 � In][In � �BH 0]�1��; (7)
where equation (7) provides a transparent summary of rational expectations overidentifying
restrictions on the coefficient vector of the agent information vector,zt�1.
Thus, there are two principal differences between the dynamic format of the “rational” error
correction in equation (6) and the format of a conventional error correction withp lags of each
regressor. First, only one lag of the decision variable is specified by the second-order decision
rule in equation (6), whereas up top � 1 additional lags of the first-difference of the decision
variable may appear in a conventional error correction. Second, as indicated in equation (7), the
coefficient vector,h�, is completely determined by cross-coefficient restrictions due to the friction
parameter in the error correction coefficient,�, and cross-equation restrictions due to the forecast
model coefficients,H. By contrast, the coefficients of the information vector in a conventional
error correction are unrestricted.7
Residual independence and rational expectations overidentifying restrictions are frequently
rejected in macroeconomic studies of rational behavior.8 One interpretation of the often
disappointing empirical performances of conventional two-root decision rules, including rejections
of rational expectation restrictions, is simply that expectations of actual agents may not be formed
under conditions required for rational expectations, such as symmetric access to full system
information by all agents. However, the limited dynamic specifications illustrated in equation
(6) suggest another contributing factor—the arbitrary prior that agents responses are adequately
captured by two-sided geometric response schedules. The next section explores the dynamic
formats of higher-order Euler equations and rational error corrections associated with a polynomial
generalization of agent response schedules.
7In conventional error corrections, an unrestricted coefficient vector is applied to the first-difference of theinformation vector.
8Examples of studies that report rejections of restrictions imposed by rational expectations include Sargent(1978), Meese (1980), Rotemberg (1982), Pindyck and Rotemberg (1983), and Shapiro (1986). Significant residualautocorrelations are indicated for rational expectations decision rules in Epstein and Denny (1983), Abel and Blanchard(1986), and Muscatelli (1989). See also the extensive rational expectations literature review in Ericsson and Irons(1995).

6
II. Rational Error Corrections under Polynomial Frictions
The standard second-order Euler equation provides a two-sided geometric description of agent
responses to anticipated and past events. The geometric schedules are determined by the roots
of the first-order component polynomials, A(L) and A(BF). This section discusses decision rules
associated with higher-order Euler equations, where the degree of the component polynomials is
increased tom > 1. Thesem-order polynomials are obtained by relaxing the modeling prior that
agents aim to smooth only the levels of decision variables or, equivalently, that stochastic delays
of decision variable adjustment are generated only by geometric distributions. The first subsection
derives the closed form of rational error correction decision rules associated with higher-order
Euler equations. The second subsection briefly reviews some categories of polynomial frictions on
agent actions that are consistent with2m-order Euler equations.
II.1 Solving for Rational Error Correction Decision Rules with Higher-Order Euler Equations
As demonstrated later in this section, the Euler equation under polynomial frictions is the same as
that initially shown in equation (1), except the factor polynomials are nowm-order polynomials,
A(L) = 1 + a1L + : : :+ amLm, instead of first-order polynomials.
To obtain the decision rule in the case of2m-order Euler equations, multiply by the inverse of
the lead polynomial,A(BF )�1, to give
EtfA(L)ytg = EtfA(BF )�1A(B)A(1)y�t g;� Etfftg: (8)
The analytical solution for the forcing term of this equation,ft, is obtained by introducing a
second companion system that describes the forward motion of the(m � 1) � 1 lead vector,
gt � Etf[ft+m�1; : : : ; ft]0g, over the planning horizon,
gt = EtfGgt+1 + A(B)A(1)�my�t g;
= EtfA(B)A(1)1Xi=0
Gi�my�t+ig; (9)
where them� 1 selector vector,�m, has a one in themth element and zeroes elsewhere;Etfftg ��0mgt; andG is them�m bottom row companion matrix of the lead polynomial,A(BF ),
G =
24 0 Im�1
�amBm �am�1Bm�1 : : : �a1B
35 :

7
Substituting the solution of the forcing term,ft, from equation (9) into (8) yields the
generalized2m-order decision rule,
Etf�ytg = �A(1)yt�1+A�(L)�yt�1+EtfA(B)A(1)�0m
1Xi=0
Gi�my�t+ig;
= �A(1)(yt�1 � y�t�1)+A�(L)�yt�1+EtfA(B)A(1)�0m
1Xi=0
[Im �G]�1Gi�m�y�t+ig: (10)
In the first line of (10), the lag polynomial is partitioned into a level and difference format,A(L) �A(1)L + (1 � A�(L)L)(1 � L), whereA�(:) is an (m-1)-order polynomial whose coefficients
are moving sums of the coefficients of A(.), as shown in the Appendix. The second line of (10)
partitions the forward path of the target into an initial level and forward differences, and uses the
identity,�0m[Im �G]�1�m � A(B)�1, to isolate the error correction “gap,”yt�1 � y�t�1.
The final step in deriving the decision rule under polynomial frictions is to eliminate forecasts
of the equilibrium path,Etfy�t+ig, using the companion form of the forecast model. Substituting
forecasts of forward changesEtf�y�t+ig, from (5) into (10) provides the closed form solution of
the generalized rational error correction decision rule9
Etf�ytg = �A(1)(yt�1 � y�t�1)+A�(L)�yt�1+A(B)A(1)�0m
1Xi=0
[Im �G]�1Gi�m�0�H
i[H � Ipq]zt�1;
= �A(1)(yt�1 � y�t�1)+A�(L)�yt�1+h
0�zt�1: (11)
There are two major differences in the dynamic formats of the polynomial frictions version of
rational error correction in equation (11) and the conventional geometric frictions variant shown
earlier in (6). First, use of them-order component polynomial,A(L), introducesm� 1 lags of the
dependent variable,A�(L)�yt�1 to accompany the single lag of the decision variable in the error
correction term.10 Second, in contrast to the single forward discount factor,�B, employed by the
decision rule under geometric frictions in (3), forecasts of anticipated changes in the equilibrium
path are now discounted by them eigenvalues embedded in the lead companion matrix,G.
Just as the rational expectations restrictions were summarized by a coefficient vector under the
geometric frictions prior, coefficient restrictions of the generalized rational error correction also
can be compactly stated. As indicated in the last line of (11), the sum of the forward-looking terms
is again equivalent to the inner product of a weighting vector,h�, and the information vector,zt�1,
9The direct solution format using companion forms may be compared with alternative solution methods for lineardecision rules ranging from partial fractions expansions of the characteristic roots in Hansen and Sargent (1980) toSchur decompositions in Anderson and Moore (1985) and Anderson, Hansen, McGrattan, and Sargent (1996).
10Note thatm will often be much smaller that the number of lags of the dependent variable in a conventional errorcorrection,m < q.

8
Two types of restrictions are imposed on the coefficient vector,h�, under polynomial frictions:
the cross-coefficient restrictions imposed by the component polynomials of the Euler equation, as
summarized by the forward companion coefficient matrixG; and the cross-equation restrictions
imposed by the agents' forecast model, summarized by the lag companion coefficient matrixH.
To reveal these restrictions, successive column stacks are applied to simplify the solution for the
coefficient vector,h�.11
h� = A(1)A(B)vec([H 0 � Ipq]1Xi=0
(H 0)i���0m(G
0)i([Im �G]�1)0�m);
= A(1)A(B)(�0m[Im �G]�1 [H 0 � Ipq])1Xi=0
[GH 0]ivec(���0m);
= A(1)A(B)(�0m[Im �G]�1 [H 0 � Ipq])[Impq �GH 0]�1(�m ��): (12)
This definition of the restricted coefficient vector in (12) provides a closed form solution for
the linear decision rule under polynomial frictions, and a summary of differences between the
unrestricted regression coefficients in a conventional error correction and the tightly restricted
coefficients of the information vector,zt�1, in a generalized error correction.
Finally, equation (11) indicates the friction parameters of the generalized rational error
correction are collected inA(1) andA�(:). This separable format is convenient for maximum
likelihood estimation by an iterative sequence of linear regressions, as discussed in the Appendix.
II.2 Higher-Order Euler Equations due to Polynomial Frictions
As noted earlier, standard rationalizations of the linear, second-order Euler equation are based on
the assumption of: (1) quadratic costs of adjusting the level of the decision variable, or (2) a discrete
geometric distribution of random delays in adjustments of the decision variable. Polynomial
extensions of these two prior specifications are discussed.
Adjustment costs on weighted averages of decision variables
One class of generalized frictions is associated with agent efforts to smooth weighted averages
of current and lagged values of decision variables. This smoothing is represented by quadratic
penalties onC(L)yt, whereC(L) is am-order polynomial in the lag operator,C(L) =mPj=0
cjLj,
andC(1) = 0.
Agents choose a sequence of decision variables that minimize the criterion,�t, defined by a
11The column stack of the product of three matrices is denoted by vec(ABC) = (C 0 A)vecB, where denotesthe Kronecker product.

9
second-order expansion of profits or utility around the path of equilibrium settings,
�t = Etf1Xi=0
Bi[c00(yt+i � y�t+i)2 + (C(L)yt+i)
2]g: (13)
The associated Euler equation is a2m-order equation in the lead and lag operators,
0 = Etf[c00 + s0 +mXk=1
sk(Lk + (BF )k)]yt � c00y
�t g;
= EtfA(BF )A(L)yt � A(B)A(1)y�t g; (14)
where thesk coefficients in the first line of(14) are defined by coefficients of the friction
polynomial,C(L).
sk =m�kXj=0
cjcj+kBj; k = 0; 1; : : : ; m;
Because the extended Euler equation in the first line of(14) is symmetric inL andBF , the equation
is unaffected if these two operator expressions are interchanged. This, in turn, implies that a
solution of the characteristic equation of the Euler equation, say��1, is also accompanied by the
reciprocal solution,B�. Consequently, the characteristic equation can be factored as shown in in
the second line of equation (14). The format of this Euler equation is the same as that shown earlier
in equation (1), except the factor polynomials are now explicitly identified asm-order polynomials.
The criterion and second-order Euler equation associated with the standard specification that
quadratic costs apply only to changes in thelevelof the decision instrument are nested in equations
(13) and(14), respectively, for the standard prior assumption thatm = 1.
Smoothing levels and differences
In a frequent interpretation of higher-order Euler equations, the decision variable,yt, is an asset
stock, and adjustment costs may be applicable not only to changes in the level of the asset but also
changes in the first-difference. An example is optimal inventory planning, whereyt indicates the
inventory stock at the end of periodt. The change in inventories,(1 � L)yt, equals production
less sales. Given exogenous sales, the assumption of quadratic costs on the level of production
implies a quadratic penalty on changes in the planned level of inventory,c1((1�L)yt)2. Similarly,
quadratic costs associated with changes in the rate of production can be represented by a quadratic
smoothing penalty on changes in the planned first-difference of the inventory stock,c1((1�L)2yt)2.Thus, in the example of inventory modeling, it is not uncommon to assume polynomial frictions of

10
the general form,P2
j=1 cj((1� L)jyt+i)2.12
A generalized criterion for smoothing levels and higher-order differences,(1 � L)kyt, in
decision variables is
�t = Etf1Xi=0
Bi[c00(yt+i � y�t+i)2 +
mXk=1
ck((1� L)kyt+i)2]g; (15)
with the associated2m-order Euler equation,Etfc00(yt � y�t ) +mPk=1
ck[(1� L)(1�BF )]kytg = 0.
Smoothing weighted averages
A second generalization is the case where quadratic penalties are associated with weighted moving
averages of the decision instrument. For example, letyt denote new labor hires by a firm in
periodt. Suppose various job families within the firm require different durations of training by
supervisors, and the number of employees occupied by training in a given period is represented
by a fixed distribution of recent vintages of new hires,c0yt + : : :+ cm�1yt�m+1. Costs associated
with variations in the rate of training may be approximated by the quadratic penalty,((c0 + (c1 �c0)L+ : : :+(cm�1� cm�2)L
m�1� cm�1Lm)yt)
2, which is a restatement of the polynomial friction
specification in equation (13).13
Another variation is the extension of quadratic penalties from smoothed one-period changes
in the level of the decision variable,(1 � L)yt+i, to smoothed changes in moving averages,(1 �L)
k�1Pj=0
yt+i�j = (1 � Lk)yt+i. Examples include seasonal or term contracts where some costs are
associated with one-period averages, others with two-period averages, and so on. The criterion in
this instance takes the form,
�t = Etf1Xi=0
Bi[c00(yt+i � y�t+i)2 +
mXk=1
ck((1� Lk)yt+i)2]g; (16)
with the associated2m-order Euler equation,Etfc00(yt�y�t )+mPk=1
ck[(1�Lk)(1�BkF k)]ytg = 0.
Stochastic response delays
Given the tractability of linear first-order conditions, the quadratic adjustment cost specification is
widely used to characterize optimal adjustment. Applications include decision variables such as
nominal prices, extending from the seminal paper by Rotemberg (1982) to the recent example of
Hairault and Portier (1993), although the assumption of strictly increasing costs in the size of price
12See Hall, Henry, and Wren-Lewis (1986), Callen, Hall, and Henry (1990), and Cuthbertson and Gasparro (1993).
13In all examples, note that linear cost components can be accommodated by redefining the equilibrium target,y�t,
of the relevant decision variable.

11
adjustments is often disputed. However, as noted by Rotemberg (1996), the aggregate response
arising from the quadratic adjustment cost model is equivalent to the aggregate adjustment of
agents subject to random decision delays drawn from an exponential distribution, as proposed
by Calvo (1983). Although it appears to have received little attention outside the field of
dynamic pricing, the stochastic delay model would appear to be a useful framework for modeling
adjustments in other market contexts when agent responses are dependent on unpredictable
transmissions of decisions, such as distributed production or communication networks.14
In a discrete-time implementation of the stochastic delay approach, each agentj controls a
decision variable,yj;t, with the associated equilibrium trajectory,y�j;t. When adjustment of a
decision variable occurs, the movement to equilibrium is complete but the timing of adjustment is
stochastic. The probability of an agent adjustment in theith period of the planning horizon, having
not adjusted in thei� 1 preceding periods, isri. The schedule of future adjustment probabilities is
represented by the lead polynomial,r(F ) = r0 + r1F + r2F2 + : : :, where theri are nonnegative
andr(1) = 1. Using a discrete geometric distribution as the analogue of the exponential response
distribution in Calvo (1983), the generating function isr(F ) = A(1)A(F )�1, whereA( : ) is the
first-order polynomial,A(F ) = (1� �F ).
Given the constraint that the decision variable must remain at the level selected, say~yj;t, until
the next allowable adjustment period, the optimal setting that minimizes the expected sum of
squared deviations from the discounted path of equilibrium settings isEtf~yj;tg = Etfr(BF )y�j;tg.Using simple sum aggregation, the aggregate of decision variables adjusted int is Etf~ytg =
Etfr(BF )y�t g. The aggregate decision variable is a normalized average of current and past vintage
decisions that survive int. In the example of a geometric delay distribution, the survival probability
in t of a past decision variable setting fromt�i is proportional tori.15 Thus, the generating function
for the normalized survival probabilities over an infinite horizon isr(L), and the aggregate decision
variable in periodt may be represented by
Etfytg = r(L)Etf~ytg;= r(L)Etfr(BF )y�t g: (17)
The lag polynomial,r(L), remains to the left of the expectations operator on the right-hand-side
of (17) to ensure that the lagged expectations embedded in past decisions are represented in
14Effects of costly and stochastic communications in distributed production are discussed in Board and Tinsley(1996). See also Bertsekas and Tsitsiklis (1989) for representative configurations of communication networks.
15The hazard function, the ratio of the adjustment probability,ri, to the survival probability at lagi, is constant forthe univariate geometric distribution, Johnson, Kotz, and Kemp (1993).

12
the current aggregate,yt.16 Replacing the generating functions by the polynomial components
yields the analogue to the familiar second-order decision rule for the aggregate decision variable,
EtfA(L)ytg = EtfA(1)A(B)A(BF )�1y�t g.
Aggregated delay schedules
In principle, the choice of the appropriate stochastic delay distribution should be an empirical issue.
Remaining within the polynomial frictions framework of this paper, the approach suggested below
considers higher-order polynomial approximations of more general stochastic delay distributions.
As indicated, these generalizations can be interpreted as convolutions of component geometric
distributions.
It is unlikely that agents have perfect information about the distribution of delays or stochastic
congestion in future decisions. Suppose, for example, agents may be confronted by a “low-cost”
response distribution,r1(F ), or a “high-cost” response distribution,r1(F ), where the expected
response lag from the first distribution is smaller than that of the second. However, draws from
either delay distribution are random. In this example, the generating function of the effective
response probabilities is the product of the generating functions of the component response
probabilities,r(F ) = r1(F )r2(F ).17
More generally, in the case of random aggregation overm geometric response schedules, the
aggregate reset of decision variables adjusted int is Etf~ytg = EtfmQj=1
rj(BF )y�t g. As in the
case of a univariate geometric distribution, a constant-hazard approximation permits the survival
distribution of past vintage decisions to be represented by the polynomial generating function of
the stochastic delays,mQj=1
rj(L).18 Thus, under anm-order polynomial stochastic delay distribution,
16As discussed in Taylor (1993), some model specifications and instrumental methods of estimating decision rulesmove the equivalent of the lag polynomial,r(L), inside the expectation operator.
17If v andw are non-negative independent random variables, the generating function of the convolution,v + w, isthe product of the generating functions ofv andw, Feller (1968).
18The mean absolute error of constant-hazard approximations of quarterly survival probabilities is about:02percentage points for the first sixteen lags in the empirical decision rules using polynomial frictions discussed inthe next section. The reason for the relatively modest approximation errors can be shown using a partial fractionsrepresentation of the approximation error. Denote the partial fractions expansion of anm-order polynomial generating
function by: A(1)A(L)�1 �mPj=1
�j(1 � �j)(1 � �jL)�1, where the�j denote the characteristic roots ofA(L).
The error of the constant-hazard approximation of the survival probability at lagi ismPj=1
�j���1(�j � ��)�i�1
j, where
�� � Ss(1 + Ss)�1, andSs denotes the sum of the survival probabilities. In the case of the univariate geometric
distribution,�� is equal to the single root, and the approximation error is zero. In the case of convoluted geometricdistributions with a single dominant root, as with empirical examples in this paper,�� is generally very close to themodulus of the dominant root. In addition, error components associated with smaller roots decay rapidly with lagi
because the spread for a smaller root,�j � ��, is scaled by powers of that root,�i�1j
.

13
the aggregate decision variable in periodt is represented by
Etfytg =mYj=1
rj(L)EtfmYj=1
rj(BF )y�t g: (18)
Substituting in the component polynomials of the generating functions for the stochastic delay
and survival probabilities yields a solution for the aggregate decision variable that is identical to
that derived earlier for the decision rule under polynomial frictions
EtfA(L)ytg = EtfA(1)A(B)A(BF )�1y�t g; (19)
where the component polynomials,A(L) andA(BF ), arem-order.
III. Empirical Examples of Rational Error Corrections for Industry Pricing
Empirical contrasts of second-order and higher-order rational error corrections are discussed in
this section. The examples used are pricing decision rules of six SIC two-digit manufacturing
industries: textiles, lumber, rubber & plastics, primary metals, motor vehicles, and scientific
instruments.19 In addition to an expected difference in statistical fits, the rational expectation
overidentifying restrictions are rejected by all but one of the second-order decision rules and by
none of the higher-order rules.
III.1 The Equilibrium Price
The equilibrium log price of the output of industryj with sj identical producers is represented by
p�j = �j +mcj; (20)
where�j is the log markup by producers andmcj is the log of marginal cost. Ignoring strategic
considerations, the markup is�j = �log�1� 1
sj�j
�, where�j is the price elasticity of demand,
and the monopoly and competitive solutions are obtained assj ! 1 or sj !1. Gross production
is Cobb-Douglas in both purchased materials and rented services of primary factors. Also, returns
to scale are constant so that the log of marginal cost is proportional to the weighted average of log
input prices,
mcj / �cjpcj + �ijp
ij + �vj p
vj ; (21)
19Motor vehicles is a large subset of the SIC two-digit industry, transportation equipment.

14
where pcj is the log price of primary commodity production inputs,pij is the log price of
intermediate materials purchased from other industries,pvj is the log unit cost of value added in
thej industry, and�cj + �ij + �vj = 1.
As indicated in (21), input price regressors are specific to industryj and constructed from
input-output weightings of industry producer prices. Industry producer prices at the SIC two-digit
level of aggregation are generally available only from the mid-1980s, and industry prices in earlier
periods were assembled from specific commodity prices, often at lower levels of aggregation. The
industry log unit cost of primary factors,pvj;t, was estimated by the log of hourly earnings,wj;t,
less the log of trend productivity,�j;t. The latter was constructed from smoothed estimates of the
log of industry industrial production less the log of industry employment hours.
Industry producer prices in the U.S. do not reject the hypothesis of difference-stationarity
over postwar samples. A common format was used to explore cointegration constructions of the
equilibrium price of each industry
p�j;t = c0 + �cjpcj;t + �ijp
ij;t + �vj p
vj;t + c1�t + c2t: (22)
Given data limitations of the trend productivity estimates, both industry log productivity trends,
�j;t and time trends,t, were added as additional regressors, and the intercept,c0 contains both
the log margin,�j, as well as proportional mean errors in measurements of unit cost inputs. The
relevant industry input share weights,(�cj ; �ij; �
vj ), are displayed in the initial columns of Table 1.
These share weights are not estimated but defined by benchmark input-output estimates, obtained
by manipulating the Bureau of Economic Analysis (1991) industry use and make tables.
As shown in the columns headed byf(t) in Table 1, additional trend productivity regressors
were required for cointegration in three industries. As noted above, the log price of primary factors
already incorporates trend productivity,pvj � wj � �j. Because this assigns a weight of��v to
�j, the additional positive coefficients lower the effective contribution of the trend productivity
constructions. Finally, as shown in the last column of Table 1, the hypothesis that the cointegrating
discrepancy,pj;t � p�j;t is I(1) is rejected at the90% confidence level or higher for all industries.
III.2 Empirical Estimates of Pricing Decision Rules under Geometric Frictions
Table 2 presents summary statistics for second-order pricing rules of the six manufacturing
industries, estimated under the prior of geometric frictions. Estimated parameters of the industry
decision rules and VAR forecast model parameters were obtained by the maximum likelihood
estimator described in the Appendix.20
20Industry prices are quarterly averages of monthly, seasonally unadjusted series from the US Bureau of Labordatabase on commodity and industry producer prices for the 1954-1995 sample. As noted earlier, the equilibrium

15
The estimated error correction coefficients,A(1) in Table 2, indicate the average quarterly
reduction rates planned for the price “gap,”pt�1 � p�t�1, of each industry. The proportion of
explained variation in quarterly price changes can be substantial, withR2 in three industries
ranging from .3 to .6. The row in Table 2 labeled�R2(%) indicates that for four industries,
the modal source of explained variation is the sample variability of industry forecasts of future
equilibrium prices, as captured by the rational forecast term,h0�zt�1. Table 2 also contains the
estimated mean lag of producer responses to unexpected shocks and the estimated mean lead of
responses to anticipated events. The mean lead of the industry planning horizon is typically smaller
than the mean lag response due to discounting of forward events.
Three characteristics of these estimated equations suggest significant dynamic specification
problems. First, the mean lag responses appear to be unusually large relative to previous estimates
of response lags for manufacturing prices.21 Second, serial independence of the residuals is
rejected for all but one industry at 95% confidence levels. Although it is possible that producers
may have serially correlated information that has not been included in the industry forecast models,
it is plausible also that residual correlations could be due to misspecifications of the frictions in
producer responses.
A final indication of potential misspecifications is indicated in the bottom row of Table 2. This
row, labeledLR(h�jzt�1), lists the rejection probabilities of a likelihood ratio test to determine
if the data prefers an unrestricted forecast model of forward equilibrium price changes to the
rational forecasts embedded in the geometric frictions version of rational error correction. With
one exception (motor vehicles), the rational expectations overidentifying restrictions are rejected
at 99% confidence levels.
III.3 Empirical Estimates of Pricing Decision Rules under Polynomial Frictions
Estimates of the industry pricing rules under the polynomial generalization of frictions are listed
in Table 3. Because the conventional two-root decision rule,m = 1, is nested in the generalized
frictions model, it is interesting to note that additional lags of the dependent variable are always
price forecast model for each industry is a VAR containing the equilibrium price and the prices of production inputs.Although seasonality is not pronounced in most industry prices (one exception is motor vehicles, as noted later), allindustry VARs contained at least four lags in regressors, and seasonal dummies were added to all VAR and errorcorrection equations. To reduce space, estimates of equation intercepts and seasonal dummy coefficients are notreported in the tables. In all equations presented here, the quarterly discount factor,B, was set to:98, approximatingthe postwar annual real return to equity of about8%; empirical results are not noticeably altered by moderate variationsin B.
21In analysis of the Stigler-Kindahl data of producers' prices, Carlton (1986) reports an average adjustmentfrequency of about once a year. Reduced form regressions by Blanchard (1987, Table 8) for the U.S. manufacturingprice aggregate indicate a mean lag of about two quarters. By contrast, the levels friction model in Rotemberg (1982)suggests a mean lag of about 12 quarters for the U.S. GDP deflator.

16
significant in the industry pricing models, generally consistent with polynomial components of
orderm = 2 or m = 3.22 In the case of motor vehicles, the preferred specification ism =
5, requiring four lags of the dependent variable. This is due to a significant seasonal pattern in
the producer price of motor vehicles which could not be adequately captured by fixed seasonal
dummies.
Without exception, all of the problems noted for the estimated decision rules under geometric
frictions in Table 2 are eliminated under polynomial frictions. The percentage of explained
variation,R2, is considerably higher for most industries in Table 3; mean lags are more plausible;
the assumption of serially independent residuals is retained in all industries; and the rejection
probabilities in the bottom row in Table 3 indicate that the rational expectations overidentifying
restrictions are not rejected at confidence levels of 95% or higher. The latter is noteworthy because
rejections of rational expectations overidentifying restrictions are often interpreted as evidence
of non-rational forecasting by agents or of inadequate specifications of agent forecast models of
forcing terms. Because theonly difference between industry model specifications used in the
side-by-side comparisons of Table 2 and Table 3 is the degree of the Euler equation polynomials,
m, the culprit, at least in these examples and for the statistical properties considered, is rigid priors
on the specification of dynamic frictions.
More intuitive insights into the dynamic effects of the higher-order lag and lead polynomials
are obtained by rearranging the Euler equation to define the current period response weights to lags
and expected leads of the forcing term,Etfp�t+ig, implied by the industry decision rules,
Etfptg = EtfA(1)A(L)�1A(B)A(BF )�1p�tg;
= Etf1X
i=�1
wip�t+ig; (23)
where negative subscripts,i < 0, denote responses to lagged events and positive subscripts,i > 0,
responses to anticipated events. The lag and lead weights of the six estimated industry decision
rules are displayed in the panels of Figure 1. The dotted lines are the friction weights generated by
the two-root decision rules (m = 1) reported in Table 2 and the solid lines are the friction weights
associated with the2m-root decision rules (m > 1) shown in Table 3.
Several effects of the generalization of frictions are apparent from the plots of the industry
friction weights in Figure 1. In each panel, the vertical line is positioned in the current period
22This is not an isolated finding. Every macroeconomic aggregate to which the generalized frictions model was fit inthe FRB/US macroeconomic model also rejected the conventional prior thatm = 1, vid. Brayton and Tinsley (1996).As discussed in a recent literature survey by Taylor (1997), many studies of empirical staggered contract models forwages do not support geometric response schedules, including an estimated bimodal distribution of contract lengthsin Levin (1991).
17
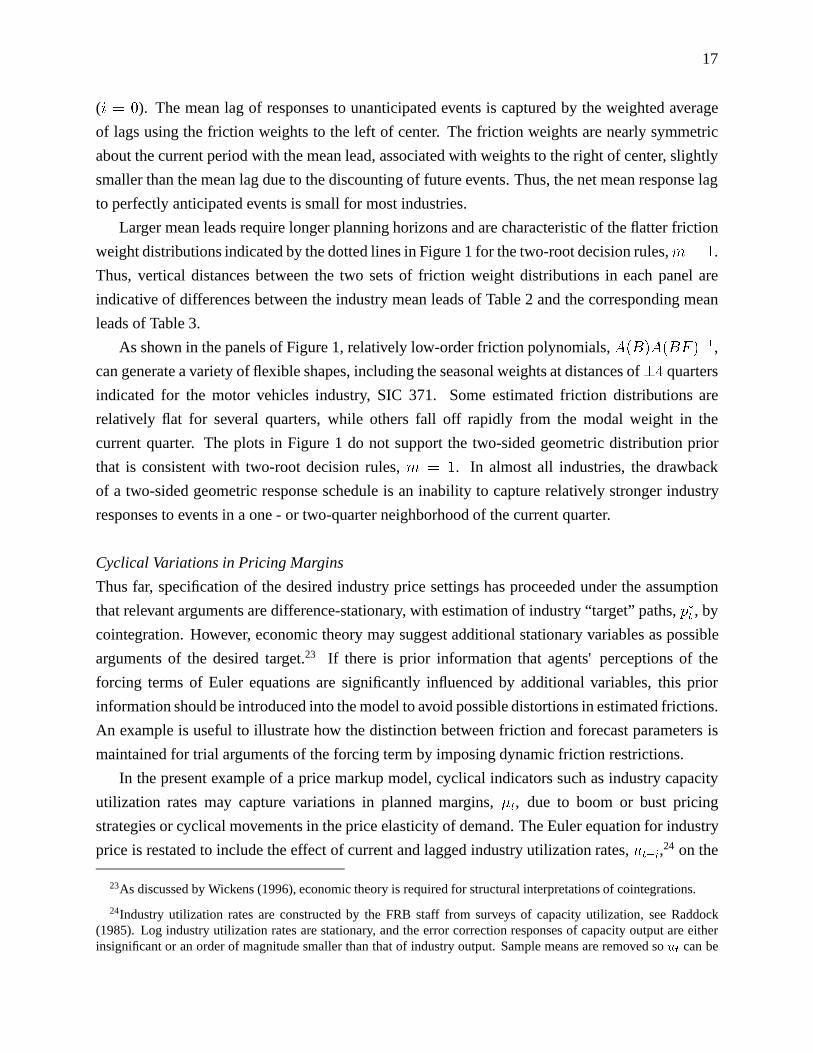
(i = 0). The mean lag of responses to unanticipated events is captured by the weighted average
of lags using the friction weights to the left of center. The friction weights are nearly symmetric
about the current period with the mean lead, associated with weights to the right of center, slightly
smaller than the mean lag due to the discounting of future events. Thus, the net mean response lag
to perfectly anticipated events is small for most industries.
Larger mean leads require longer planning horizons and are characteristic of the flatter friction
weight distributions indicated by the dotted lines in Figure 1 for the two-root decision rules,m = 1.
Thus, vertical distances between the two sets of friction weight distributions in each panel are
indicative of differences between the industry mean leads of Table 2 and the corresponding mean
leads of Table 3.
As shown in the panels of Figure 1, relatively low-order friction polynomials,A(B)A(BF )�1,
can generate a variety of flexible shapes, including the seasonal weights at distances of�4 quarters
indicated for the motor vehicles industry, SIC 371. Some estimated friction distributions are
relatively flat for several quarters, while others fall off rapidly from the modal weight in the
current quarter. The plots in Figure 1 do not support the two-sided geometric distribution prior
that is consistent with two-root decision rules,m = 1. In almost all industries, the drawback
of a two-sided geometric response schedule is an inability to capture relatively stronger industry
responses to events in a one - or two-quarter neighborhood of the current quarter.
Cyclical Variations in Pricing Margins
Thus far, specification of the desired industry price settings has proceeded under the assumption
that relevant arguments are difference-stationary, with estimation of industry “target” paths,p�t , by
cointegration. However, economic theory may suggest additional stationary variables as possible
arguments of the desired target.23 If there is prior information that agents' perceptions of the
forcing terms of Euler equations are significantly influenced by additional variables, this prior
information should be introduced into the model to avoid possible distortions in estimated frictions.
An example is useful to illustrate how the distinction between friction and forecast parameters is
maintained for trial arguments of the forcing term by imposing dynamic friction restrictions.
In the present example of a price markup model, cyclical indicators such as industry capacity
utilization rates may capture variations in planned margins,�t, due to boom or bust pricing
strategies or cyclical movements in the price elasticity of demand. The Euler equation for industry
price is restated to include the effect of current and lagged industry utilization rates,ut�i,24 on the
23As discussed by Wickens (1996), economic theory is required for structural interpretations of cointegrations.
24Industry utilization rates are constructed by the FRB staff from surveys of capacity utilization, see Raddock(1985). Log industry utilization rates are stationary, and the error correction responses of capacity output are eitherinsignificant or an order of magnitude smaller than that of industry output. Sample means are removed sout can be

18
current price target,
EtfA(BF )A(L)pt � A(B)A(1)[p�t +D(L)ut]g = 0; (24)
wherep�t continues to denote I(1) arguments of the equilibrium target, andD(L) is anm0-order
polynomial inL. It is convenient to assumem0 = 1, which is the minimal order necessary to
distinguish between pricing effects of changing utilization rates and effects of higher or lower
levels of capacity utilization,D(L) = d0 + d1L.
Multiplying through by the inverse of the lead polynomial,A(BF )�1, and substituting in
forecasts from the agents' information set,zt�1, defines the augmented rational error correction
where the industry price decision rule now contains an infinite-horizon forecast of forward industry
utilization rates, discounted by them eigenvalues contained in the frictions companion matrix,G.
Using the simplifying operations discussed earlier, the closed-form of the extended rational error
correction solution is
Etf�ptg = �A(1)(pt�1 � p�t�1) + A�(L)�pt�1 + h0�zt�1 +1X
k=0
dkh0
ukzt�1; (25)
The additional coefficient vectors,huk (k = 0; 1), define discounted sums of the expected forward
path of the industry utilization rate,
hu0 = A(1)A(B)[�0m H 0][Imn �GH 0]�1(�m �u0);
hu1 = A(1)A(B)[�0m In][Imn �GH 0]�1(�m �u1); (26)
where then � 1 selector vectors,�uk , locateut�k in the information vector,zt, now extended to
include current and lagged values of the industry utilization rate. Because industry log utilization
rates are stationary, the restricted coefficient vectors in (26) differ somewhat from that derived for
forecasts of difference-stationary trend prices,h�, in (12).
Effects of adding industry utilization rates to the rational error correction are reported in
Table 4. The rejection probabilities in the row labeledLR(D(L)) indicate that expected forward
utilization rates are a significant determinant of pricing at a 90% level of confidence in three of the
six industries. Cyclical markup effects associated with the level of the industry utilization rate are
indicated in the next row of Table 4, labeledD(1). Procyclical margins are indicated for primary
metals (SIC 33) and countercyclical margins for motor vehicles (SIC371).
All significant features of the rational error corrections in Table 3 are retained in Table 4,
including serially independent residuals and nonrejection of the RE overidentifying restrictions
interpreted as industry output deviations from trend or preferred utilization.

19
which are now extended to include forecasts of forward utilization rates. Thus, the polynomial
frictions description of industry pricing appears to be robust to the addition of a conventional
determinant of cyclical pricing.
IV. Concluding Comments
After two decades of research in macroeconomics, the rational expectations conjecture is a fixture
in theoretical macroeconomic models but is routinely rejected in empirical macroeconomic models
that test the associated overidentifying restrictions. Rather than indicting the rational expectations
assumption, it appears that the main culprit may be the arbitrary tight prior used to characterize
dynamic frictions in macroeconomic models.
The workhorse of macroeconomic descriptions of rational dynamic behavior is the
conventional linear decision rule with two characteristic roots, where one determines the geometric
discount factor of anticipated events and the other provides a geometric description of lagged
responses to unanticipated shocks. The two-sided geometric lead and lag response schedules are
generally motivated by ageometric frictionsprior where agents aim to smooth levels of activity
or are subject to geometric random delays. Although it leads to tractable models of economic
behavior, the geometric frictions prior is not based on compelling economic theory and is usually
rejected by macroeconomic data.
An alternative specification ofpolynomial frictionsis suggested in this paper which appears
to eliminate many of the empirical drawbacks of the conventional frictions specification. The
generalized frictions specification can be interpreted as the result of agents that smooth linear
combinations of current and lagged actions or a consequence of convoluted geometric distributions
of stochastic delays in decisions.
Polynomial frictions lead to higher-order Euler equations whose decision rules are solved
generally by numerical techniques. A method of obtaining closed-form solutions is presented that
uses two simple, first-order companion systems: a lead system for the forward planning required
when agent actions are restricted by frictions; and a lag system for the agents' forecast model of the
Euler equation forcing term. A tractable method of maximum likelihood estimation by a sequence
of regressions is outlined in the Appendix.
Empirical models of producer pricing are estimated for six manufacturing industries. The
second-order decision rule implied by the geometric frictions prior is nested within the polynomial
frictions specification and rejected by the data for all industries. The decision rules based on
geometric frictions had poor empirical properties, including overstatement of mean lags, strong
residual correlations, and rejections of rational expectation restrictions. Rational error corrections

20
using the generalized friction specification eliminated these empirical shortcomings, including
the rejection of rational expectations restrictions. The estimated generalized friction models of
industry pricing generally required fourth-order or sixth-order decision rules.
Polynomial descriptions of frictions define a rich class of rational error correction
specifications. The empirical applications indicate that higher-order decision rules provide
empirical fits comparable to reduced-form error corrections and, unlike the latter, provide useful
distinctions between lags due to forecasts of market events and lags due to constrained agent
responses to these forecasts.

21
ReferencesAnderson, G. and G. Moore. (1985). “A Linear Algebraic Procedure for Solving Linear Perfect
Foresight Models.”Economic Letters, 17, 247-52.
Abel, A. and O. Blanchard. (1986). ”The Present Value of Profits and Cyclical Movements inInvestment.”Econometrica, 54, 249-73.
Anderson, E., L. Hansen, E. McGrattan, and T. Sargent. (1996). “Mechanics of Forming andEstimating Dynamic Linear Economies.” in H. Amman, D. Kendrick and J. Rust (eds.),Handbook of Computational Economics I, Amsterdam: Elsevier Science, 171-252.
Bertsekas, D. and J. Tsitsiklis. (1989).Parallel and Distributed Computation, EnglewoodCliffs: Prentice Hall.
Blanchard, O. (1983). ”The Production and Inventory Behavior of the American AutomobileIndustry.”Journal of Political Economy, 91, 365-400.
Blanchard, O. (1987). “Aggregate and Individual Price Adjustment.”Brookings Papers onEconomic Activity, 57-109.
Board, R. and P. Tinsley. (1996). “Smart Systems and Simple Agents.” inComputationalEconomic Systems, Gilli, M. (ed.) Dordrecht: Kluwer Academic Publishers, 51-79.
Brayton, F. and P. Tinsley (1996). “A Guide to FRB/US: A Macroeconomic Model of theUnited States.” Federal Reserve Board, Finance and Economics Discussion Series 1996-42.
Bryant, R., P. Hooper, and C. Mann (eds.) (1993).Empirical Evaluation of Alternative PolicyRegimes.Washington: The Brookings Institution.
Bureau of Economic Analysis. (1991).The 1982 Benchmark Input-Output Accounts of theUnited States.Washington: U.S. Government Printing Office.
Callen, T., S. Hall, and S. Henry. (1990). “Manufacturing Stocks: Expectations, Risk andCo-Integration.”Economic Journal, 100, September, 756-72.
Calvo, G. (1983). “Staggered Prices in a Utility-Maximizing Framework.”Journal of MonetaryEconomics, 12, 383-98.
Carlton, D. (1986). “The Rigidity of Prices.”American Economic Review, September, 637-58.
Christiano, L., M. Eichenbaum, and C. Evans. (1994). “Identification and the Effects ofMonetary Policy Shocks.” Federal Reserve Bank of Chicago Working Paper 94-7, May.
Cuthbertson, K. and D. Gasparro. (1983). “The Determinants of Manufacturing Inventories inthe UK.” Economic Journal, 103, November, 1479-92.
Epstein, L. and M. Denny. (1983). ”The Multivariate Flexible Accelerator Model: Its EmpiricalRestrictions and An Application to U.S. Manufacturing.”Econometrica, 51, May, 647-674.
Ericsson, N. and D. Hendry. (1991). ”Modeling the Demand for Narrow Money in the UnitedKingdom and the United States.”European Economic Review, 35, May, 833-86.
Ericsson, N. and J. Irons. (1995). “The Lucas Critique in Practice: Theory WithoutMeasurement.” inMacroeconometrics: Developments, Tensions, and Prospects,K. Hoover(ed.) Boston: Kluwer Academic Publishers.
Feller, W. (1968).An Introduction to Probability Theory and Its Applications, 3rd edition.NewYork: John Wiley & Sons.

22
Frisch, R. (1936). “On the Notion of Equilibrium and Disequilibrium.”Review of EconomicStudies, III, February, 100-5.
Hairault, J. and F. Portier. (1993). “Money, New-Keynesian Macroeconomics and the BusinessCycle.” European Economic Review, 37, December, 1533-68.
Hall, S, S. Henry, and S. Wren-Lewis. (1986). “Manufacturing Stocks and Forward-LookingExpectations in the UK.”Economica, 53, November, 447-65.
Hansen, L. and T. Sargent. (1980). “Formulating and Estimating Dynamic Linear RationalExpectations Models.”Journal of Economic Dynamics and Control, February, 7-46.
Johnson, N., S. Kotz, and A. Kemp. (1993).Univariate Discrete Distributions, New York:John Wiley & Sons.
Kydland, F. and E. Prescott. (1991). “The Econometrics of the General Equilibrium Approachto Business Cycles.”Scandinavian Journal of Economics, 93(2), 161-78.
Levin, A. (1991). “The Macroeconomic Significance of Nominal Wage Contract Duration.”University of California at San Diego Discussion Paper 91-08, February.
Lucas, R. (1976). ”Econometric Policy Evaluation: A Critique.” in ”The Phillips Curve andLabor Markets,” K. Brunner and A. Meltzer (eds.),Carnegie-Rochester Conference Serieson Public Policy, 1, 19-46.
MacKinnon, J. (1991). “Critical Values for Cointegration Tests,” in R. Engle and C. Granger(eds.),Long-Run Economic Relationships, New York: Oxford University Press, 267-76.
Meese, R. (1980). ”Dynamic Factor Demand Schedules for Labor and Capital under RationalExpectations.”Journal of Econometrics. 14, 141-58.
Murphy, K. and R. Topel. (1985). ”Estimation and Inference in Two-Step EconometricModels.”Journal of Business Economics and Statistics, 3, October, 370-9.
Muscatelli, A. (1989). “A Comparison of the ' Rational Expectations' and ' General-to-Specific'Approaches to Modelling the Demand for M1.”Oxford Bulletin of Economics and Statistics,51(4), November, 353-75.
Nickell, S. (1985). ”Error Correction, Partial Adjustment and All That: An Expository Note.”Oxford Bulletin of Economics and Statistics, 47, 119-29.
Pesaran, H. (1991). “Cost Adjustment under Rational Expectations: A Generalization.”Reviewof Economic Studies, May, 353-8.
Pindyck, R. and J. Rotemberg. (1983). ”Dynamic Factor Demands under RationalExpectations.”Scandinavian Journal of Economics.85, 223-38.
Price, S. (1992). “Forward Looking Price Setting in UK Manufacturing.”Economic Journal,102, May, 497-505.
Raddock, R. (1985). “Revised Federal Reserve Rates of Capacity Utilization.”Federal ReserveBulletin. 71, October, 754-66.
Rotemberg, J. (1982). ”Sticky Prices in the United States.”Journal of Political Economy, 90(6),December, 1187-1211.
Rotemberg, J. (1996). ”Prices, Output, and Hours: An Empirical Analysis Based on a StickyPrice Model.”Journal of Monetary Economics, 37(3), June, 505-33.

23
Sargent, T. (1978). ”Estimation of Dynamic Labor Demand Schedules under RationalExpectations.”Journal of Political Economy, 86, December, 1009-44.
Sargent, T. (1993).Bounded Rationality in Macroeconomics.Oxford: Clarendon Press.
Shapiro, M. (1986). ”The Dynamic Demand for Capital and Labor.”Quarterly Journal ofEconomics, 101, August, 513-42.
Sims, C. (1992). “Interpreting the Macroeconomic Time Series Facts.”European EconomicReview36(5), June, 975-1011.
Swamy, P. and P. Tinsley. (1980). ”Linear Prediction and Estimation Methods for RegressionModels with Stationary Stochastic Coefficients.”Journal of Econometrics, 12, 103-42.
Taylor, J. (1993).Macroeconomic Policy in a World Economy, New York: Norton.
Taylor, J. (1997). “Temporary Price and Wage Rigidities in Macroeconomics: A Twenty-fiveYear Review.” processed.
Tinsley, P. (1970). ”On Ramps, Turnpikes, and Distributed Lag Approximations of OptimalIntertemporal Adjustment.”Western Economic Journal, December, 397-411.
Tinsley, P. (1971). “A Variable Adjustment Model of Labor Demand.”International EconomicReview, 12, October, 482-510.
Watson, M. (1994). “Vector Autoregressions and Cointegration.” in R. Engle and D. McFadden(eds.)Handbook of Econometrics, IV, Amsterdam: Elsevier Science, 2843-2915.
White, H. (1994).Estimation, Inference and Specification Analysis, Cambridge: CambridgeUniversity Press.
Wickens, M. (1996). “Interpreting Cointegrating Vectors and Common Stochastic Trends.”Journal of Econometrics, 74, October, 255-71.

24
Appendix: Estimation of Rational Error Corrections
This appendix outlines the two-stage maximum likelihood estimator for rational error
corrections used for the empirical examples in this paper. The estimator requires only a sequence
of regressions. Because linear rational error corrections have closed-form solutions, analytical
solutions are available for all required gradients.
Estimating the Rational Error Correction Decision Rule
The assumption of rational behavior leads to overidentified decision rules whose parameters
are nonlinear functions of parameters in the companion matrix of the forecast model,H, and
parameters in the companion matrix,G, of the frictions polynomial,A(:). However, the forecast
model of forcing terms often can be reasonably approximated by a system that is linear in the
unknown parameters. There are significant computational advantages to adopting a two-stage
maximum likelihood procedure when the forecast model can be estimated by standard linear
estimators. Assuming the forecast model is linear in the unknown parameters and has normally
distributed forecast errors, maximum likelihood estimates of the column stack of forecast model
parameters,hx, are obtained by a GLS estimator, or even OLS regressions if the forecast model
equations have identical regressors.
Turning to the second stage of estimation, discussion will ignore estimation of unconstrained
linear parameters such as intercepts and fixed seasonals. The vector of unknown friction parameters
is � = [�A(1); a�1; : : : ; a�m�1]0
. Usingyt to denote the dependent variable (�pt for the industry
price decision rules) and assuming normally distributed description errors, the log of the marginal
likelihood of� is
Ly(�) = �(T=2)log�2�y � (T=2)log(2�)� 1
2�2�y
TXt=1
(yt � �0zy;t�1 � h0�zt�1)2; (A:1)
wherezy;t�1 includes both the lagged error correction,pt�1�p�t�1, andm�1 lags of the dependent
variable, and�2�y � E[(yt � �0zy;t�1 � h0�zt�1)2]. Maximum likelihood estimates of the friction
parameters,�, are defined by the zeroes of the gradients of (A.1) with respect to the friction
parameters,gy(�), given the first-stage estimates of the forecast model coefficients,hx. The format
of these nonlinear equations is well-suited for Gauss-Newton estimation using iterative regressions
of the form,
(yt � �(i)0
zy;t�1 � h0�(�(i); hx)zt�1) =
�zy;t�1 + [@h0�(:jhx))=@�]zt�1
�0(�(i+1) � �(i)): (A:2)
25
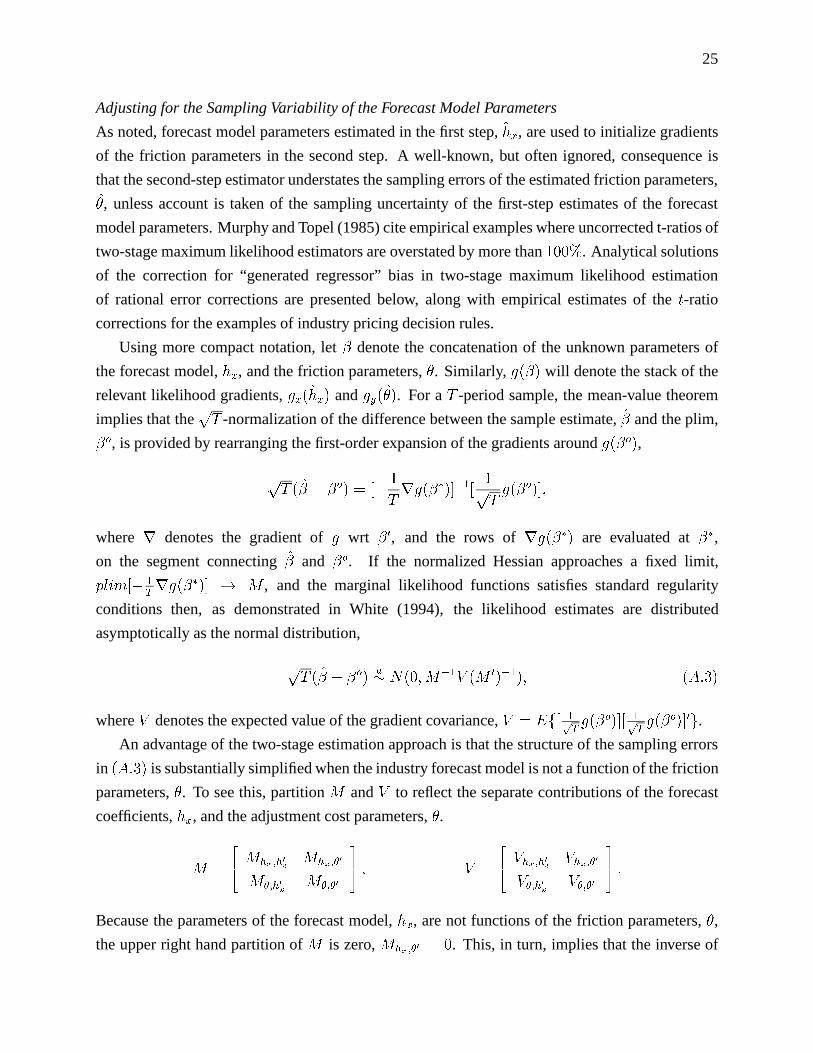
Adjusting for the Sampling Variability of the Forecast Model Parameters
As noted, forecast model parameters estimated in the first step,hx, are used to initialize gradients
of the friction parameters in the second step. A well-known, but often ignored, consequence is
that the second-step estimator understates the sampling errors of the estimated friction parameters,
�, unless account is taken of the sampling uncertainty of the first-step estimates of the forecast
model parameters. Murphy and Topel (1985) cite empirical examples where uncorrected t-ratios of
two-stage maximum likelihood estimators are overstated by more than100%. Analytical solutions
of the correction for “generated regressor” bias in two-stage maximum likelihood estimation
of rational error corrections are presented below, along with empirical estimates of thet-ratio
corrections for the examples of industry pricing decision rules.
Using more compact notation, let� denote the concatenation of the unknown parameters of
the forecast model,hx, and the friction parameters,�. Similarly, g(�) will denote the stack of the
relevant likelihood gradients,gx(hx) andgy(�). For aT -period sample, the mean-value theorem
implies that thepT -normalization of the difference between the sample estimate,� and the plim,
�o, is provided by rearranging the first-order expansion of the gradients aroundg(�o),
pT (� � �o) = [� 1
Trg(��)]�1[ 1p
Tg(�o)];
wherer denotes the gradient ofg wrt � 0, and the rows ofrg(��) are evaluated at��,
on the segment connecting� and �o. If the normalized Hessian approaches a fixed limit,
plim[� 1Trg(��)] ! M , and the marginal likelihood functions satisfies standard regularity
conditions then, as demonstrated in White (1994), the likelihood estimates are distributed
asymptotically as the normal distribution,
pT (� � �o)
a� N(0;M�1V (M 0)�1); (A:3)
whereV denotes the expected value of the gradient covariance,V = Ef[ 1pTg(�o)][ 1
pTg(�o)]0g.
An advantage of the two-stage estimation approach is that the structure of the sampling errors
in (A:3) is substantially simplified when the industry forecast model is not a function of the friction
parameters,�. To see this, partitionM andV to reflect the separate contributions of the forecast
coefficients,hx, and the adjustment cost parameters,�.
M =
24 Mhx;h0
xMhx;�0
M�;h0
xM�;�0
35 ; V =
24 Vhx;h0
xVhx;�0
V�;h0
xV�;�0
35 :
Because the parameters of the forecast model,hx, are not functions of the friction parameters,�,
the upper right hand partition ofM is zero,Mhx;�0 = 0. This, in turn, implies that the inverse of

26
M required for equation(A:3) simplifies to
M�1 =
24 M�1
hx;h0
x0
�M�1�;�0M�;h0
xM�1
�;�0 M�1�;�0
35 :
Substituting this partitioned inverse into(A:3) yields the following expression for the asymptotic
covariance of the adjustment cost parameters,
var(� � �o) = M�1�;�0 +M�1
�;�0[M�;h0
xM�1
hx;h0
xM 0
�;h0
x
� V 0hx;�0M
�1hx;h0
xM 0
�;h0
x�M�;h0
xM�1
hx;h0
xVhx;�0]M�1
�;�0: (A:4)
The last two terms in(A:4) are zero if the residual of the rational error correction is uncorrelated
with residuals of the VAR forecast model,Vhx;�0 = 0.
The nonzero partitions ofM are replaced with the following sample estimates:
Mhx;h0
x= E[� @2Lx
@hx@h0
x] = E[gx(hx)gx(hx)
0]:
M�;�0 = E[� @2Ly
@�@�0] = E[gy(�)gy(�)
0]:
M�;h0
x= E[� @2Ly
@�@h0
x] = E[gy(�)gy(hx)
0]: (A:5)
Components required by(A:5) can be assembled from gradients and covariances produced in the
first and second stages of the estimation. Analytical solutions of required gradients are indicated
below.
Empirical Estimates of Sampling Error Bias
The magnitude of “generated bias” adjustments in thet-ratios of the estimated industry pricing
rules can be gauged from Table 4. Along with the adjustedt-statistics in parentheses, (: ) that
are reported in all three tables, Table 4 also lists the unadjustedt-statistics from the second step
estimation in brackets, [: ]. Although the extent of adjustment varies, the maximum downward
adjustment oft-ratios is around 20%. An intuitive explanation for the generally modest reductions
in statistical significance is that much of the forecast model uncertainty is “averaged out” over the
forecast horizon by the discounted average of equilibrium price change forecasts,h0�zt�1.
Analytical Gradient Solutions
Nonlinear interactions of the frictions parameters and the forecast model parameters are confined
to the scalar summary of industry forecasts in the decision rule,h0�zt�1. Usingn � pq to reduce

27
subscript clutter. then� 1 coefficient vectorh� is completely defined byH, then� n companion
matrix of the industry forecast model, and them friction arguments,�. From (12), the restricted
coefficient vector,h�, can be partitioned into four components
h� = [A(B)][A(1)][�0
m(Im �G)�1 (H 0 � In)][(Inm �GH 0)�1][�m ��];
= [A(B)] [A(1)] [W1] [W2] [w1]; (A:6)
where the first four partitions on the last line of(A:6) are functions of the unknown frictions
parameters,�.
To indicate the partial derivatives with respect to thejth argument of the parameter vector,
�(j), the following notation conventions are used. Element-by-element differentiation of vectors
and matrices is represented by the relevant subscripted�n(j) vector(s). For example, the partial
derivative of then� 1 vectorb with respect to its second element is@b=@b(2) = [0; 1; 0; : : : ; 0]0 =
�n(2). Similarly, the partial derivative of them � n of matrix B with respect to itsijth element is
denoted by@B=@B(ij) = �m(i) �0
n(j). Twom �m transformation matrices are useful also:T1 is
an upper-triangular matrix for effecting moving-summations, with�1 in each element of the first
row and1 in each of the remaining nonzero elements;T2 is a reverse-diagonal discounting matrix
with �Bm�i+1 in them� i + 1th element of theith row.
As shown in the main text, the bottom row of them�m companion matrix,G, of the friction
lead polynomial contains powers of the discount factor,B, and the parameters of the friction lag
polynomial,a0 = [a1; a2; : : : ; am]. The relationship between these parameters and the friction
parameters,�, in the decision rule likelihood,(A:1), is given by� = T1a � �m(1). Denotingg0 as
the bottom row of G, then it is seen thatg0 = a0T 02 = (�0+ �0
m(1))T0�11 T 02. In turn, them�m matrix
G is defined byG = T3 + �m(m) g0, whereT3 is constructed by borderingIm�1 by a column of
zeroes on the left and a row of zeroes on the bottom. It follows that the partial derivative ofG with
respect to thejth element of� is, @G=@�(j) = �m(m) �0
m(j)T0�11 T 02.
Using these definitions, analytical expressions for the gradients required by the Gauss-Newton
regression in(A:2) are constructed from the following partial derivatives:
@A(B)=@�(j) = ��0m(m)T2T�11 �m(j);
@A(1)=@�(j) = �0
m(m)T�11 �m(j);
@W1=@�(j) = �0
m(m)[Im �G]�1[@G=@�(j)][Im �G]�1 (H 0 � In);
@W2=@�(j) = [Imn �GH 0]�1[(@G=@�(j))H 0][Imn �GH 0]�1:
Finally, the gradient of the likelihood of friction parameters with respect to the vector of
forecast model parameters,gy(hx) � @Ly=@h0x, is required for the construction ofM�;h0
x. Let hx
denote the column stack of the firstnx rows of the companion matrix of the full forecast model,H.

28
The ordered elements of this(nxn)� 1 vector are referenced byhx;(kij), wherekij � (j� 1)nx+ i
for 1 � i � nx and1 � j � n. Using this subscripting convention, the required elements of
@h�=@hx are
@W1=@hx;(kij) = �0
m(m)[Im �G]�1 [�n(j) �0
n(i)]:
@W2=@hx;(kij) = [Imn �GH 0]�1[G (�n(j) �0
n(i)][Imn �GH 0]�1;

Table 1Cointegration Construction of Industry Price Trend a
p�t / �cpct + �ipit + �vpvt + f(t):
industry cost shareb f(t)industry SIC �c �i �v � t SEEc ADFd
textiles 22 .051 .339 .610 .359 -.0027 .036 -5.45���
(5.9) (-4.6)
lumber 24 .113 .145 .741 .0025 .082 -3.47��
(19.4)
rubber & 30 .011 .449 .540 .278 -.0005 .024 -3.85��
plastics (10.1) (1.6)
primary 33 .071 .168 .761 .875 -.0019 .053 -4.59���
metals (6.9) (-2.6)
motor 371 .005 .410 .585 .0023 .036 -3.10�
vehicles (14.2)
scientific 38 .007 .341 .652 .0036 .046 -3.44��
instruments (48.7)
aIndustry-specific log input prices aggregated with industry input share weights into primary commodity,pc,intermediate material,pi, and value-added,pv , input categories. The log of the unit cost of industry value addedis estimated by the log of the industry labor compensation rate,w, less the log of industry trend productivity,�.
bConstructed from the 1982 US industry input-output accounts, Bureau of Economic Analysis (1991).
cSample span 1957q1-1995q4.
dRejection of the hypothesis that the cointegrating discrepancy,pt � p�t, is I(1) at 90% (*), 95% (**), and 99%
(***) confidence levels, using critical values in MacKinnon (1991).

Table 2Industry Price Adjustment Under Geometric Frictions a
�pt = �A(1)[pt�1 � p�t�1] + h0�zt�1 + at:
manufacturing industriesSIC 22 SIC 24 SIC 30 SIC 33 SIC 371 SIC 38
rubber & primary motor scientifictextiles lumber plastics metals vehicles instruments
frictionparametersb m = 1 m = 1 m = 1 m = 1 m = 1 m = 1
A(1) .09 .05 .21 .13 .13 .08(2.1) (1.2) (4.4) (3.0) (5.0) (3.9)
R2 .10 .13 .44 .11 .62 .28SEE .018 .030 .011 .022 .010 .010
BG(12) c .00 .03 .00 .00 .00 .06
friction weights
mean lag (qtrs) 10.2 19.4 3.8 5.9 6.6 10.9mean lead (qtrs) 8.3 13.7 3.4 6.9 5.7 8.7
price trend,�p�,expectations
�R2(%) d 98% 7% 98% 86% 10% 70%
LR(h�jzt�1) e .00 .01 .00 .00 .31 .01
aSample span 1957q1-1995q4.
bm denotes the order of the polynomial,A(L)�1, that generates friction weights.
cRejection probability of serially independent residuals, Breusch-Godfrey test (12 lags).
dProportion ofR2 due to forward price trend expectations,h0�zt�1 � EtfA(1)
1Pi=0
(�B)i�p�t+ig.
eRejection probability of RE overidentifying restrictions on industry expectation coefficient vector,h�.

Table 3Industry Price Adjustment Under Polynomial Frictions a
�pt = �A(1)[pt�1 � p�t�1] + A�(L)�pt�1 + h0�zt�1 + at:
manufacturing industriesSIC 22 SIC 24 SIC 30 SIC 33 SIC 371 SIC 38
rubber & primary motor scientifictextiles lumber plastics metals vehicles instruments
frictionparametersb m = 3 m = 2 m = 3 m = 3 m = 5 m = 2
A(1) .09 .09 .15 .14 .10 .06(2.8) (2.5) (4.3) (4.2) (4.7) (3.4)
A�(1) .58 .35 .45 .56 .38 .36(8.0) (4.3) (5.2) (6.9) (3.4) (4.8)
R2 .55 .23 .60 .43 .70 .38SEE .012 .028 .009 .018 .009 .009
BG(12) c .77 .49 .94 .93 .98 .98
friction weights
mean lag (qtrs) 3.4 6.6 2.7 2.1 5.1 9.2mean lead (qtrs) 3.3 5.8 2.6 2.1 5.0 7.8
price trend,�p�,expectations
�R2(%) d 2% 1% 12% 6% 5% 18%
LR(h�jzt�1) e .07 .26 .15 .71 .31 .18
aSample span 1957q1-1995q4.
bm denotes the order of the polynomial,A(L)�1, that generates friction weights.
cRejection probability of serially independent residuals, Breusch-Godfrey test (12 lags).
dProportion ofR2 due to forward price trend expectations,h0�zt�1.
eRejection probability of RE overidentifying restrictions on industry expectation coefficient vector,h�.

Table 4Industry Price Adjustment with Cyclical Margins a
�pt = �A(1)[pt�1 � p�t�1] + A�(L)�pt�1 + h0�zt�1 +1X
k=0
dkh0ukzt�1 + at:
manufacturing industriesSIC 22 SIC 24 SIC 30 SIC 33 SIC 371 SIC 38
rubber & primary motor scientifictextiles lumber plastics metals vehicles instruments
frictionparametersb m = 3 m = 2 m = 3 m = 3 m = 5 m = 2
A(1) .09 .08 .15 .15 .11 .06[2.9]c [2.2] [4.6] [4.4] [5.7] [3.6](2.9) (2.2) (4.2) (4.3) (4.5) (3.2)
A�(1) .59 .34 .44 .49 .21 .36[8.1] c [4.3] [6.5] [5.7] [1.8] [5.1](7.6) (4.2) (5.2) (5.5) (1.6) (4.8)
R2 .57 .23 .60 .45 .71 .38SEE .012 .028 .009 .018 .009 .009
BG(12) d .88 .42 .72 .95 .81 .99
capacity utilizationexpectations
LR(D(L)jzt�1) e .07 .60 .95 .04 .05 .77
D(1) 0.22 0.11 -0.03 0.32 -0.23 0.48[0.4] c [0.1] [-0.3] [1.6] [-2.4] [0.6](0.4) (0.1) (-0.3) (1.5) (-1.9) (0.6)
LR(h�; huk jzt�1) f .05 .47 .06 .87 .09 .09
aSample span 1957q1-1995q4.
bm denotes the order of the polynomial,A(L)�1, that generates friction weights.
ct-statistics in brackets, [.], arenotadjusted for generated regressor bias; see discussion in Appendix.
dRejection probability of serially independent residuals, Breusch-Godfrey test (12 lags).
eRejection probability of no pricing response to expectations of forward utilization rates,h0ukzt�1 (k = 0; 1).
fRejection probability of RE overidentifying restrictions on industry expectation coefficient vectors,h� andhuk .

Figure 1: Quarterly Lag and Lead Friction Weights of Producer Pricing Decision Rulesa
WEI
GHT
S
SIC 22 Solid: m=3 Dotted: m=1
-12 -8 -4 0 4 8 12
0.0
0.05
0.10
0.15
SIC 24 Solid: m=2 Dotted: m=1
-12 -8 -4 0 4 8 12
0.0
0.05
0.10
0.15
WEI
GHT
S
SIC 30 Solid: m=3 Dotted: m=1
-12 -8 -4 0 4 8 12
0.0
0.05
0.10
0.15
SIC 33 Solid: m=3 Dotted: m=1
-12 -8 -4 0 4 8 12
0.0
0.05
0.10
0.15
WEI
GHT
S
LAGS LEADS
SIC 371 Solid: m=5 Dotted: m=1
-12 -8 -4 0 4 8 12
0.0
0.05
0.10
0.15
LAGS LEADS
SIC 38 Solid: m=2 Dotted: m=1
-12 -8 -4 0 4 8 12
0.0
0.05
0.10
0.15
aGenerated by Euler equations containing2m-order polynomials in lag and lead operators.