Embed Size (px)
Citation preview
8/10/2019 Rata Cresterii Economice
http://slidepdf.com/reader/full/rata-cresterii-economice 1/21
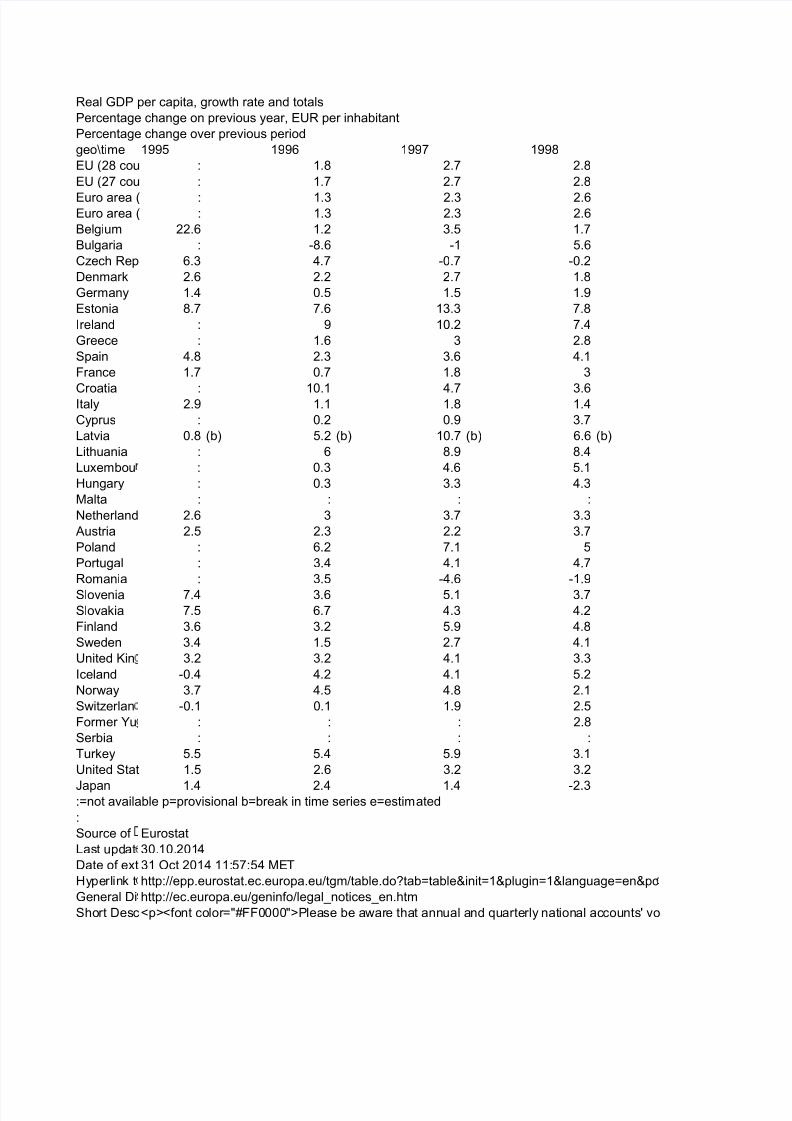
Real GDP per capita, growth rate and totals
Percentage change on previous year, EUR per inhabitant
Percentage change over previous period
geo\time 1995 1996 1997 1998
EU (28 cou : 1.8 2.7 2.8
EU (27 cou : 1.7 2.7 2.8
Euro area ( : 1.3 2.3 2.6Euro area ( : 1.3 2.3 2.6
Belgium 22.6 1.2 3.5 1.7
Bulgaria : -8.6 -1 5.6
Czech Rep 6.3 4.7 -0.7 -0.2
Denmark 2.6 2.2 2.7 1.8
Germany 1.4 0.5 1.5 1.9
Estonia 8.7 7.6 13.3 7.8
Ireland : 9 10.2 7.4
Greece : 1.6 3 2.8
Spain 4.8 2.3 3.6 4.1
France 1.7 0.7 1.8 3
Croatia : 10.1 4.7 3.6Italy 2.9 1.1 1.8 1.4
Cyprus : 0.2 0.9 3.7
Latvia 0.8 (b) 5.2 (b) 10.7 (b) 6.6 (b)
Lithuania : 6 8.9 8.4
Luxembou : 0.3 4.6 5.1
Hungary : 0.3 3.3 4.3
Malta : : : :
Netherland 2.6 3 3.7 3.3
Austria 2.5 2.3 2.2 3.7
Poland : 6.2 7.1 5
Portugal : 3.4 4.1 4.7
Romania : 3.5 -4.6 -1.9
Slovenia 7.4 3.6 5.1 3.7
Slovakia 7.5 6.7 4.3 4.2
Finland 3.6 3.2 5.9 4.8
Sweden 3.4 1.5 2.7 4.1
United Kin 3.2 3.2 4.1 3.3
Iceland -0.4 4.2 4.1 5.2
Norway 3.7 4.5 4.8 2.1
Switzerlan -0.1 0.1 1.9 2.5
Former Yu : : : 2.8
Serbia : : : :
Turkey 5.5 5.4 5.9 3.1
United Stat 1.5 2.6 3.2 3.2
Japan 1.4 2.4 1.4 -2.3:=not available p=provisional b=break in time series e=estimated
:
Source of Eurostat
Last updat 30.10.2014
Date of ext 31 Oct 2014 11:57:54 MET
Hyperlink t http://epp.eurostat.ec.europa.eu/tgm/table.do?tab=table&init=1&plugin=1&language=en&pc
General Di http://ec.europa.eu/geninfo/legal_notices_en.htm
Short Desc<p><font color="#FF0000">Please be aware that annual and quarterly national accounts' vo

8/10/2019 Rata Cresterii Economice
http://slidepdf.com/reader/full/rata-cresterii-economice 2/21
Code: tsdec100
8/10/2019 Rata Cresterii Economice
http://slidepdf.com/reader/full/rata-cresterii-economice 3/21
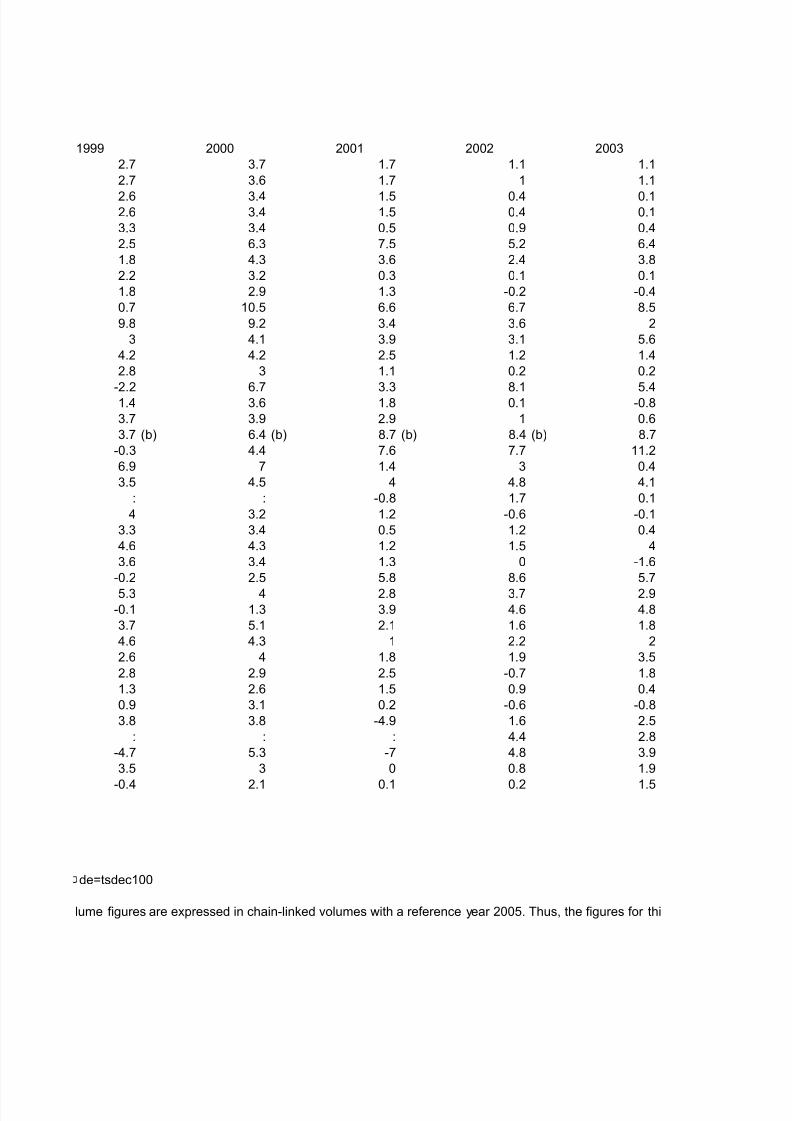
1999 2000 2001 2002 2003
2.7 3.7 1.7 1.1 1.1
2.7 3.6 1.7 1 1.1
2.6 3.4 1.5 0.4 0.12.6 3.4 1.5 0.4 0.1
3.3 3.4 0.5 0.9 0.4
2.5 6.3 7.5 5.2 6.4
1.8 4.3 3.6 2.4 3.8
2.2 3.2 0.3 0.1 0.1
1.8 2.9 1.3 -0.2 -0.4
0.7 10.5 6.6 6.7 8.5
9.8 9.2 3.4 3.6 2
3 4.1 3.9 3.1 5.6
4.2 4.2 2.5 1.2 1.4
2.8 3 1.1 0.2 0.2
-2.2 6.7 3.3 8.1 5.41.4 3.6 1.8 0.1 -0.8
3.7 3.9 2.9 1 0.6
3.7 (b) 6.4 (b) 8.7 (b) 8.4 (b) 8.7
-0.3 4.4 7.6 7.7 11.2
6.9 7 1.4 3 0.4
3.5 4.5 4 4.8 4.1
: : -0.8 1.7 0.1
4 3.2 1.2 -0.6 -0.1
3.3 3.4 0.5 1.2 0.4
4.6 4.3 1.2 1.5 4
3.6 3.4 1.3 0 -1.6
-0.2 2.5 5.8 8.6 5.7
5.3 4 2.8 3.7 2.9
-0.1 1.3 3.9 4.6 4.8
3.7 5.1 2.1 1.6 1.8
4.6 4.3 1 2.2 2
2.6 4 1.8 1.9 3.5
2.8 2.9 2.5 -0.7 1.8
1.3 2.6 1.5 0.9 0.4
0.9 3.1 0.2 -0.6 -0.8
3.8 3.8 -4.9 1.6 2.5
: : : 4.4 2.8
-4.7 5.3 -7 4.8 3.9
3.5 3 0 0.8 1.9
-0.4 2.1 0.1 0.2 1.5
de=tsdec100
lume figures are expressed in chain-linked volumes with a reference year 2005. Thus, the figures for thi

8/10/2019 Rata Cresterii Economice
http://slidepdf.com/reader/full/rata-cresterii-economice 4/21
8/10/2019 Rata Cresterii Economice
http://slidepdf.com/reader/full/rata-cresterii-economice 5/21
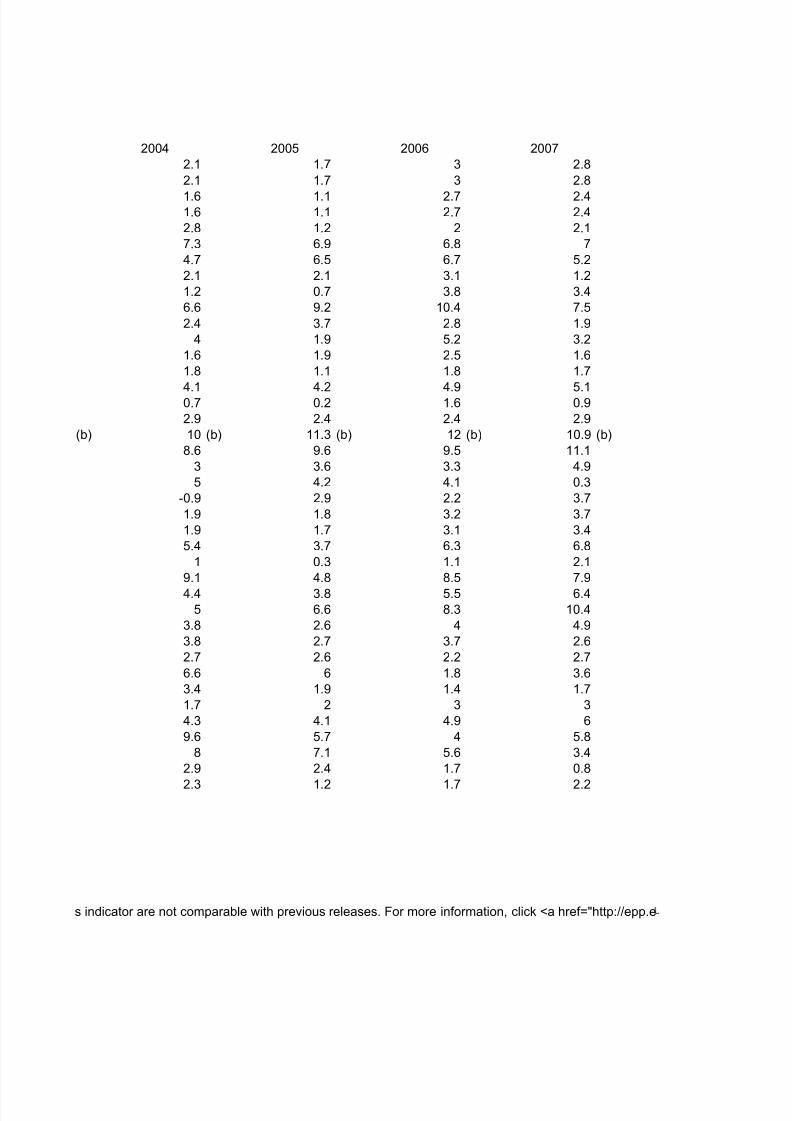
2004 2005 2006 2007
2.1 1.7 3 2.8
2.1 1.7 3 2.8
1.6 1.1 2.7 2.41.6 1.1 2.7 2.4
2.8 1.2 2 2.1
7.3 6.9 6.8 7
4.7 6.5 6.7 5.2
2.1 2.1 3.1 1.2
1.2 0.7 3.8 3.4
6.6 9.2 10.4 7.5
2.4 3.7 2.8 1.9
4 1.9 5.2 3.2
1.6 1.9 2.5 1.6
1.8 1.1 1.8 1.7
4.1 4.2 4.9 5.10.7 0.2 1.6 0.9
2.9 2.4 2.4 2.9
(b) 10 (b) 11.3 (b) 12 (b) 10.9 (b)
8.6 9.6 9.5 11.1
3 3.6 3.3 4.9
5 4.2 4.1 0.3
-0.9 2.9 2.2 3.7
1.9 1.8 3.2 3.7
1.9 1.7 3.1 3.4
5.4 3.7 6.3 6.8
1 0.3 1.1 2.1
9.1 4.8 8.5 7.9
4.4 3.8 5.5 6.4
5 6.6 8.3 10.4
3.8 2.6 4 4.9
3.8 2.7 3.7 2.6
2.7 2.6 2.2 2.7
6.6 6 1.8 3.6
3.4 1.9 1.4 1.7
1.7 2 3 3
4.3 4.1 4.9 6
9.6 5.7 4 5.8
8 7.1 5.6 3.4
2.9 2.4 1.7 0.8
2.3 1.2 1.7 2.2
s indicator are not comparable with previous releases. For more information, click <a href="http://epp.e

8/10/2019 Rata Cresterii Economice
http://slidepdf.com/reader/full/rata-cresterii-economice 6/21
8/10/2019 Rata Cresterii Economice
http://slidepdf.com/reader/full/rata-cresterii-economice 7/21
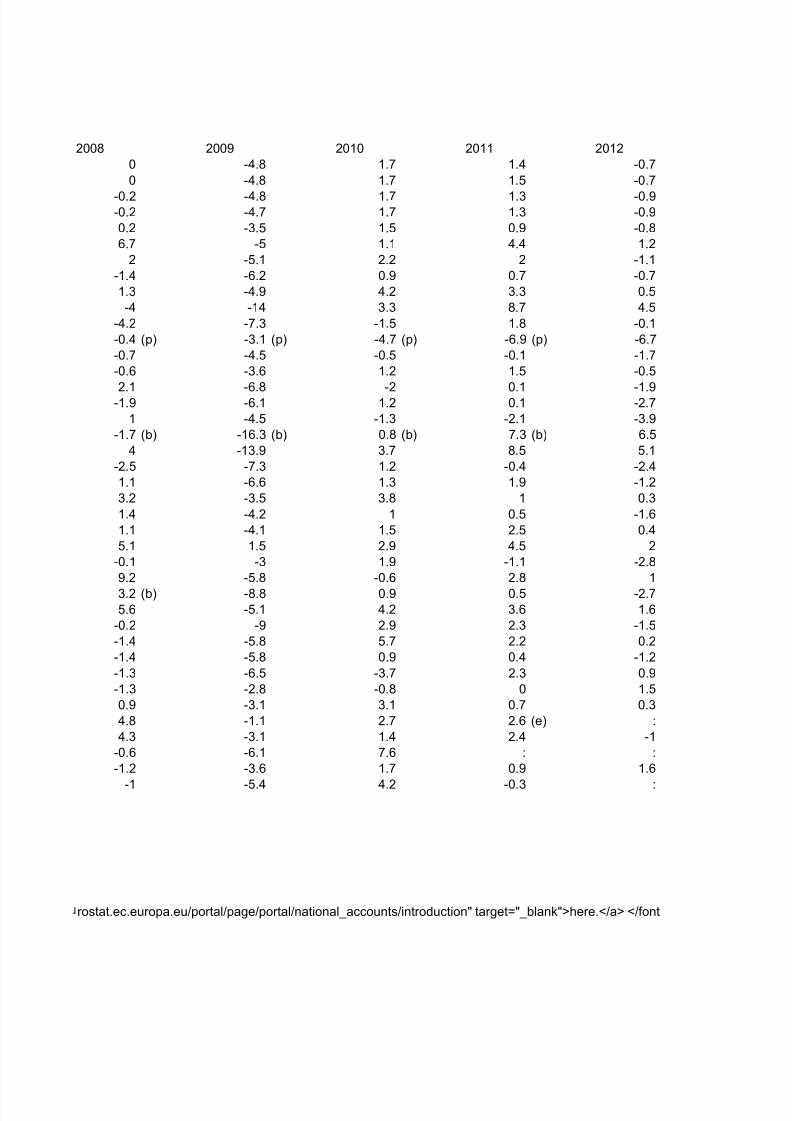
2008 2009 2010 2011 2012
0 -4.8 1.7 1.4 -0.7
0 -4.8 1.7 1.5 -0.7
-0.2 -4.8 1.7 1.3 -0.9-0.2 -4.7 1.7 1.3 -0.9
0.2 -3.5 1.5 0.9 -0.8
6.7 -5 1.1 4.4 1.2
2 -5.1 2.2 2 -1.1
-1.4 -6.2 0.9 0.7 -0.7
1.3 -4.9 4.2 3.3 0.5
-4 -14 3.3 8.7 4.5
-4.2 -7.3 -1.5 1.8 -0.1
-0.4 (p) -3.1 (p) -4.7 (p) -6.9 (p) -6.7
-0.7 -4.5 -0.5 -0.1 -1.7
-0.6 -3.6 1.2 1.5 -0.5
2.1 -6.8 -2 0.1 -1.9-1.9 -6.1 1.2 0.1 -2.7
1 -4.5 -1.3 -2.1 -3.9
-1.7 (b) -16.3 (b) 0.8 (b) 7.3 (b) 6.5
4 -13.9 3.7 8.5 5.1
-2.5 -7.3 1.2 -0.4 -2.4
1.1 -6.6 1.3 1.9 -1.2
3.2 -3.5 3.8 1 0.3
1.4 -4.2 1 0.5 -1.6
1.1 -4.1 1.5 2.5 0.4
5.1 1.5 2.9 4.5 2
-0.1 -3 1.9 -1.1 -2.8
9.2 -5.8 -0.6 2.8 1
3.2 (b) -8.8 0.9 0.5 -2.7
5.6 -5.1 4.2 3.6 1.6
-0.2 -9 2.9 2.3 -1.5
-1.4 -5.8 5.7 2.2 0.2
-1.4 -5.8 0.9 0.4 -1.2
-1.3 -6.5 -3.7 2.3 0.9
-1.3 -2.8 -0.8 0 1.5
0.9 -3.1 3.1 0.7 0.3
4.8 -1.1 2.7 2.6 (e) :
4.3 -3.1 1.4 2.4 -1
-0.6 -6.1 7.6 : :
-1.2 -3.6 1.7 0.9 1.6
-1 -5.4 4.2 -0.3 :
rostat.ec.europa.eu/portal/page/portal/national_accounts/introduction" target="_blank">here.</a> </font

8/10/2019 Rata Cresterii Economice
http://slidepdf.com/reader/full/rata-cresterii-economice 8/21
8/10/2019 Rata Cresterii Economice
http://slidepdf.com/reader/full/rata-cresterii-economice 9/21
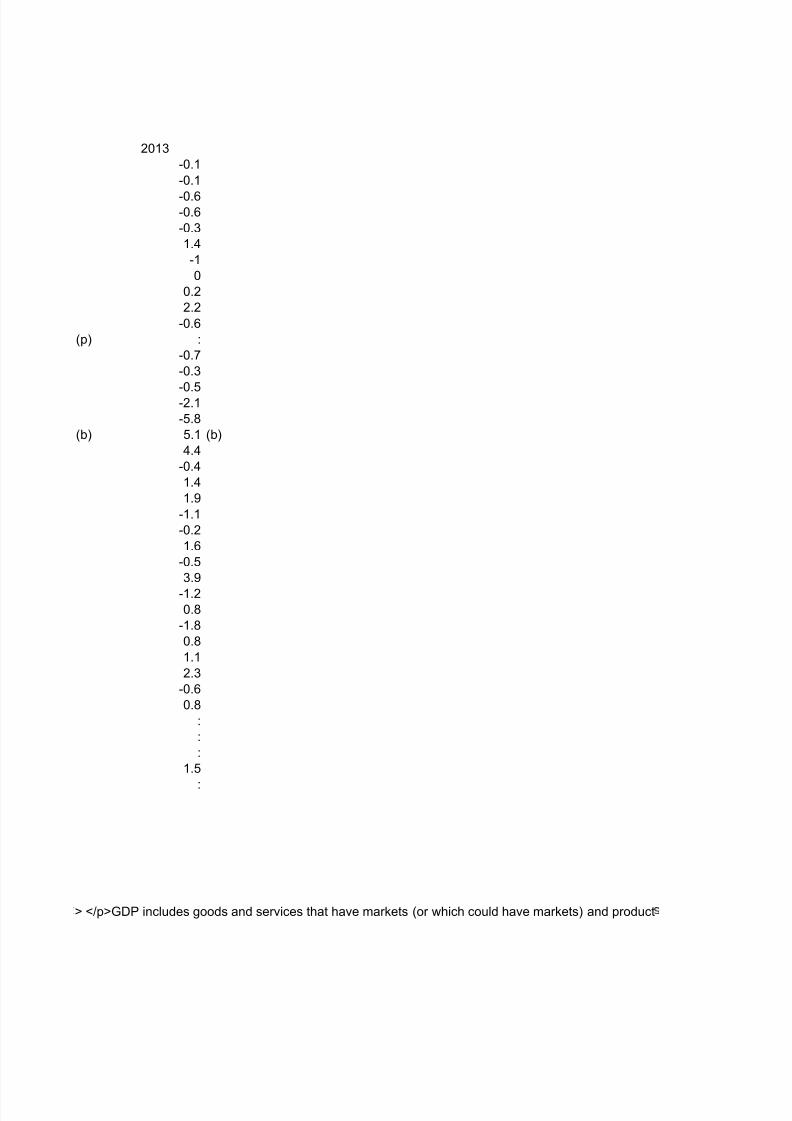
2013
-0.1
-0.1
-0.6-0.6
-0.3
1.4
-1
0
0.2
2.2
-0.6
(p) :
-0.7
-0.3
-0.5-2.1
-5.8
(b) 5.1 (b)
4.4
-0.4
1.4
1.9
-1.1
-0.2
1.6
-0.5
3.9
-1.2
0.8
-1.8
0.8
1.1
2.3
-0.6
0.8
:
:
:
1.5
:
> </p>GDP includes goods and services that have markets (or which could have markets) and product

8/10/2019 Rata Cresterii Economice
http://slidepdf.com/reader/full/rata-cresterii-economice 10/21

8/10/2019 Rata Cresterii Economice
http://slidepdf.com/reader/full/rata-cresterii-economice 11/21
which are produced by general government and non-profit institutions. For measuring the growth rate o

8/10/2019 Rata Cresterii Economice
http://slidepdf.com/reader/full/rata-cresterii-economice 12/21

8/10/2019 Rata Cresterii Economice
http://slidepdf.com/reader/full/rata-cresterii-economice 13/21
f real GDP, the GDP at current prices are valued in prices of the previous year and the thus computed

8/10/2019 Rata Cresterii Economice
http://slidepdf.com/reader/full/rata-cresterii-economice 14/21

8/10/2019 Rata Cresterii Economice
http://slidepdf.com/reader/full/rata-cresterii-economice 15/21
olume changes are imposed on the level of a reference year; this is called a chain-linked series. Accord

8/10/2019 Rata Cresterii Economice
http://slidepdf.com/reader/full/rata-cresterii-economice 16/21

8/10/2019 Rata Cresterii Economice
http://slidepdf.com/reader/full/rata-cresterii-economice 17/21
ingly, price movements will not inflate the growth rate. Real GDP per capita is calculated as the ratio of

8/10/2019 Rata Cresterii Economice
http://slidepdf.com/reader/full/rata-cresterii-economice 18/21

8/10/2019 Rata Cresterii Economice
http://slidepdf.com/reader/full/rata-cresterii-economice 19/21
real GDP to the average population of a specific year. It is often used as an indicator of how well off a c

8/10/2019 Rata Cresterii Economice
http://slidepdf.com/reader/full/rata-cresterii-economice 20/21

8/10/2019 Rata Cresterii Economice
http://slidepdf.com/reader/full/rata-cresterii-economice 21/21
un