Embed Size (px)
Citation preview

BioProcess Technology Consultants, Inc.www.bptc.com
Thomas C. RansohoffBPI WestMarch 1, 2017San Francisco, CA USA
Challenges in Forecasting Demand and the Value of Flexibility in Manufacturing
2
Outline Forecasting Demand for Biopharmaceutical Products
• BPTC Methodology• Sources of Uncertainty
Flexibility‐Enabling Technologies Estimating the Value of Flexibility in BioPharma Manufacturing
• Modified Maleyeff model approach• Estimation of value in SUB vs. SS case for development stage biopharmaceutical
Conclusions
3
Challenges in Demand Forecasting
4
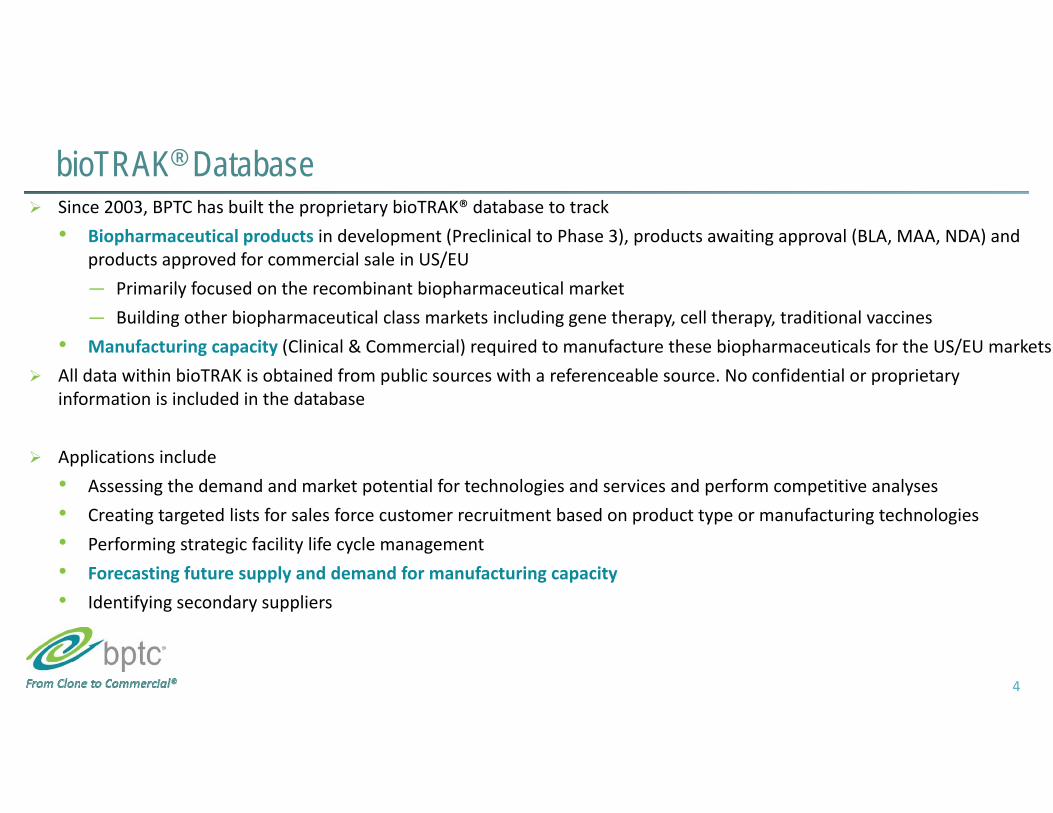
bioTRAK® Database Since 2003, BPTC has built the proprietary bioTRAK® database to track
• Biopharmaceutical products in development (Preclinical to Phase 3), products awaiting approval (BLA, MAA, NDA) and products approved for commercial sale in US/EU― Primarily focused on the recombinant biopharmaceutical market― Building other biopharmaceutical class markets including gene therapy, cell therapy, traditional vaccines
• Manufacturing capacity (Clinical & Commercial) required to manufacture these biopharmaceuticals for the US/EU markets All data within bioTRAK is obtained from public sources with a referenceable source. No confidential or proprietary
information is included in the database
Applications include• Assessing the demand and market potential for technologies and services and perform competitive analyses• Creating targeted lists for sales force customer recruitment based on product type or manufacturing technologies• Performing strategic facility life cycle management• Forecasting future supply and demand for manufacturing capacity• Identifying secondary suppliers
5
Demand Forecasting Overview Methodology Our “product‐by‐product” approach to industry‐wide analysis of the demand for
biomanufacturing capacity is dependent on underlying methodology and assumptions
Key elements of methodology of BPTC’s Product‐by‐Product analysis:
―Estimating current demand for commercial products
―Estimating future demand for commercial products
―Estimating future demand for products currently in the pipeline (Phase 2+)
6
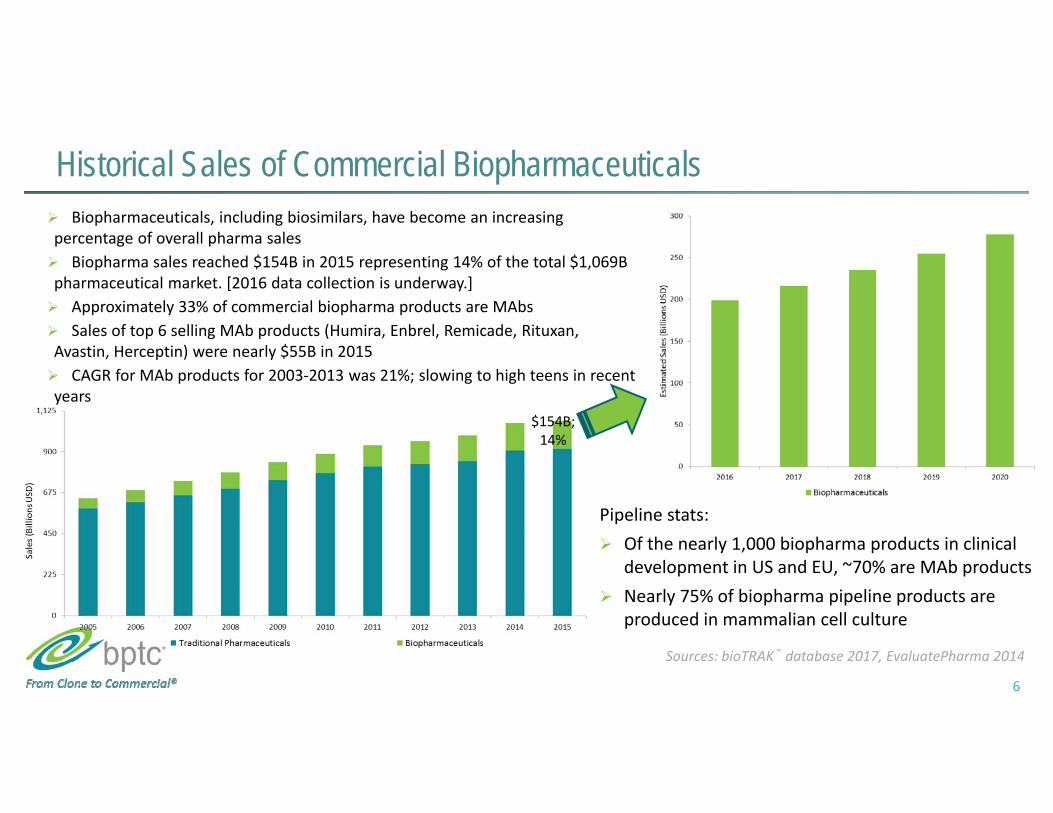
Historical Sales of Commercial Biopharmaceuticals Biopharmaceuticals, including biosimilars, have become an increasing percentage of overall pharma sales Biopharma sales reached $154B in 2015 representing 14% of the total $1,069B pharmaceutical market. [2016 data collection is underway.] Approximately 33% of commercial biopharma products are MAbs Sales of top 6 selling MAb products (Humira, Enbrel, Remicade, Rituxan, Avastin, Herceptin) were nearly $55B in 2015 CAGR for MAb products for 2003‐2013 was 21%; slowing to high teens in recent years
Sources: bioTRAK® database 2017, EvaluatePharma 2014
Pipeline stats: Of the nearly 1,000 biopharma products in clinical
development in US and EU, ~70% are MAb products Nearly 75% of biopharma pipeline products are
produced in mammalian cell culture
$154B; 14%
7
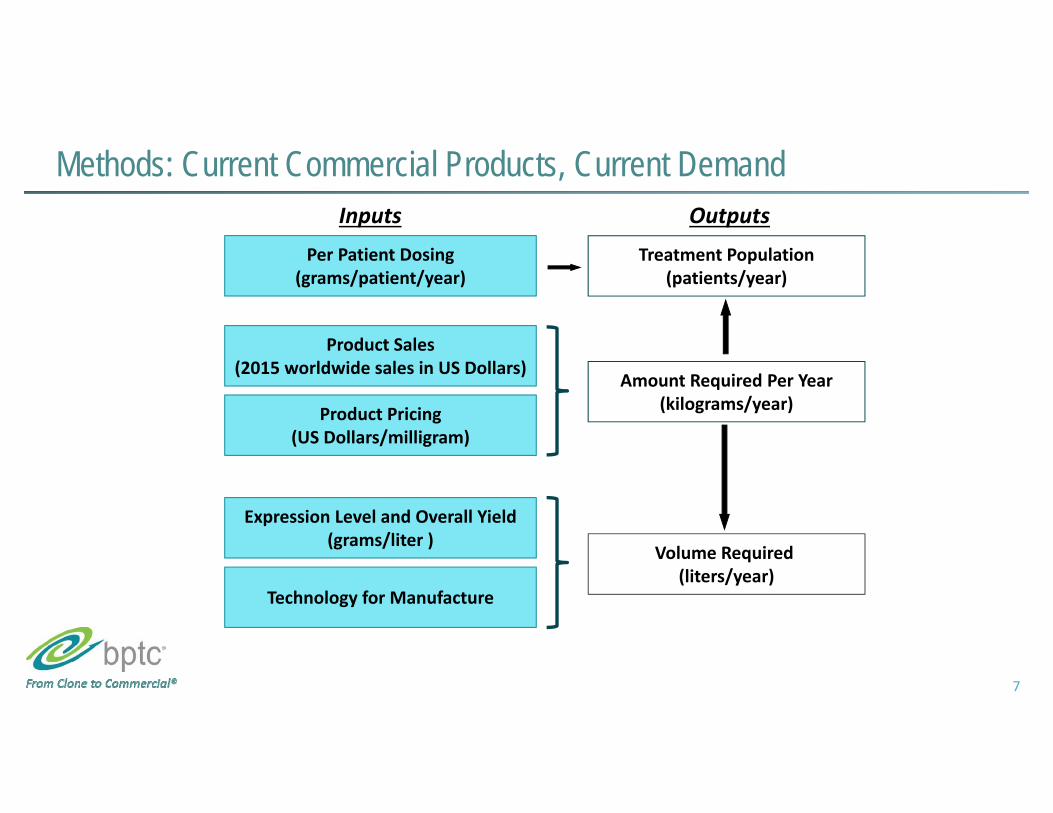
Methods: Current Commercial Products, Current DemandInputs Outputs
Per Patient Dosing(grams/patient/year)
Product Sales(2015 worldwide sales in US Dollars)
Amount Required Per Year(kilograms/year)
Expression Level and Overall Yield(grams/liter )
Volume Required (liters/year)
Technology for Manufacture
Product Pricing(US Dollars/milligram)
Treatment Population(patients/year)
8
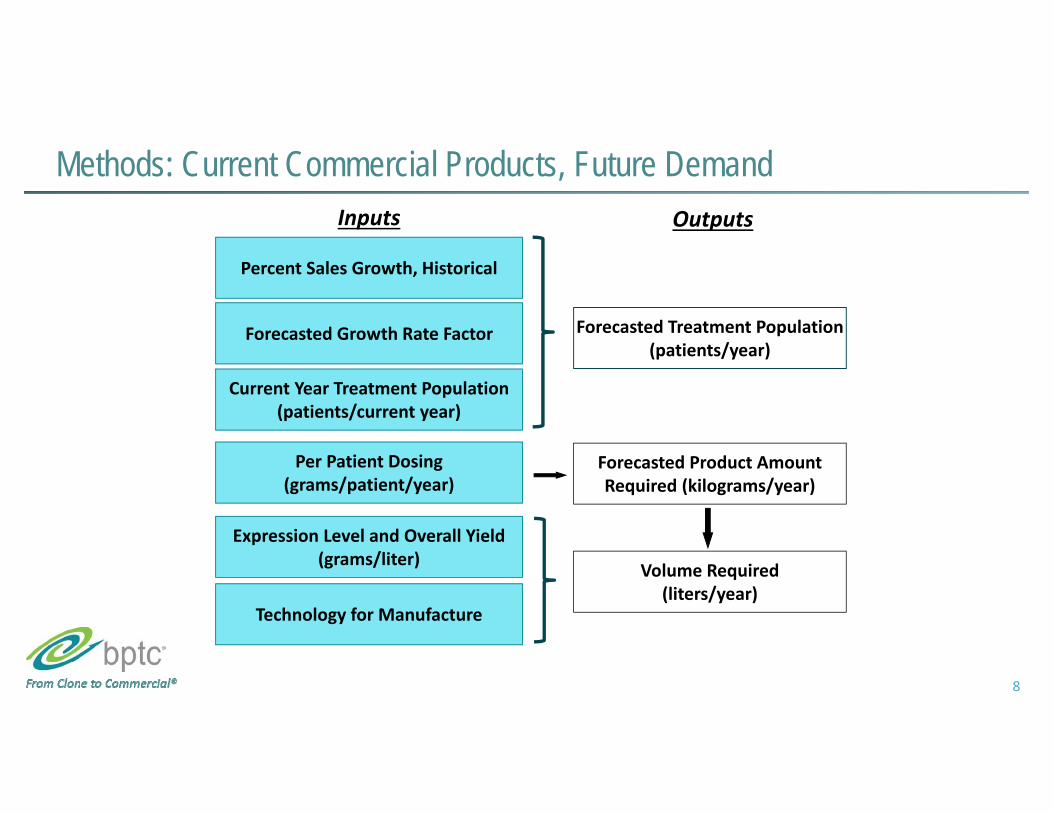
Methods: Current Commercial Products, Future DemandInputs Outputs
Percent Sales Growth, Historical
Forecasted Growth Rate Factor Forecasted Treatment Population(patients/year)
Expression Level and Overall Yield(grams/liter) Volume Required
(liters/year)Technology for Manufacture
Current Year Treatment Population(patients/current year)
Per Patient Dosing(grams/patient/year)
Forecasted Product AmountRequired (kilograms/year)
9
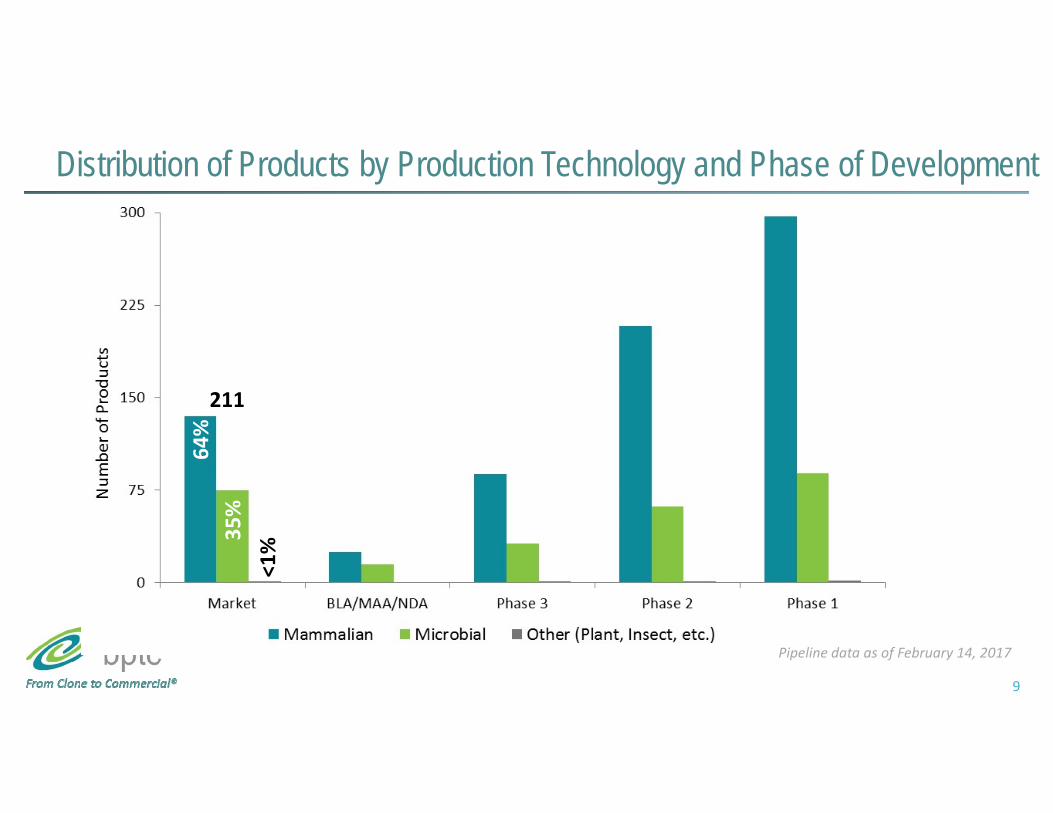
Distribution of Products by Production Technology and Phase of Development
211
64%
35%
<1%
Pipeline data as of February 14, 2017

10
Methods: Pipeline Products, Future Commercial DemandInputs Outputs
Per Patient Dosing(grams/patient/year)
Indication Prevalence (patients/year)
Amount RequiredPost‐launch* (kilograms/year)
Expression Level and Overall Yield(grams/liter)
Volume RequiredPost‐launch* (liters/year)
Technology for Manufacture
Market Penetration(% of prevalence)
* Launch date and probability determined by current phase of development
CONFIDENTIAL

11
Forecasted Volumetric Requirements for Future Commercial Product Demand
Colored bars represent the projected success‐adjusted L of Commercialproduct required
Orange portion of each bar represents an estimate of the clinical demand in a given year
Volumetric capacity estimates less certain than kg/yr due to lack of visibility to yields
~1.9 ML
~3.4 ML

12
Analyzing Variance Drivers to Demand – Monte-Carlo Simulations Monte‐Carlo simulation is a quantitative technique to estimate the impact of uncertainty or risk of
certain inputs or assumptions on the range and probability of potential outcomes. In this example,
• The outcome whose range estimated is future demand for manufacturing capacity• The inputs and assumptions whose impact we evaluated were:
Inputs Outputs
Percent Sales Growth, Historical
Forecasted Growth Rate Factor Forecasted Treatment Population(patients/year)
Expression Level and Overall Yield(grams/liter) Volume Required
(liters/year)Technology for Manufacture
Current Year Treatment Population(patients/current year)
Per Patient Dosing(grams/patient/year)
Forecasted Product AmountRequired (kilograms/year)
Commercial
Inputs Outputs
Per Patient Dosing(grams/patient/year)
Indication Prevalence (patients/year)
Amount RequiredPost‐launch* (kilograms/year)
Expression Level and Overall Yield(grams/liter)
Volume RequiredPost‐launch* (liters/year)
Technology for Manufacture
Market Penetration(% of prevalence)
* Launch date and probability determined by current phase of development
Pipeline
+/‐ 20%Inputs Outputs
Per Patient Dosing(grams/patient/year)
Product Sales(2015 worldwide sales in US Dollars)
Amount Required Per Year(kilograms/year)
Expression Level and Overall Yield(grams/liter )
Volume Required (liters/year)
Technology for Manufacture
Product Pricing(US Dollars/milligram)
Treatment Population(patients/year)
+/‐ 20%
+/‐ 30%+/‐ 30%
+/‐ 30%
13
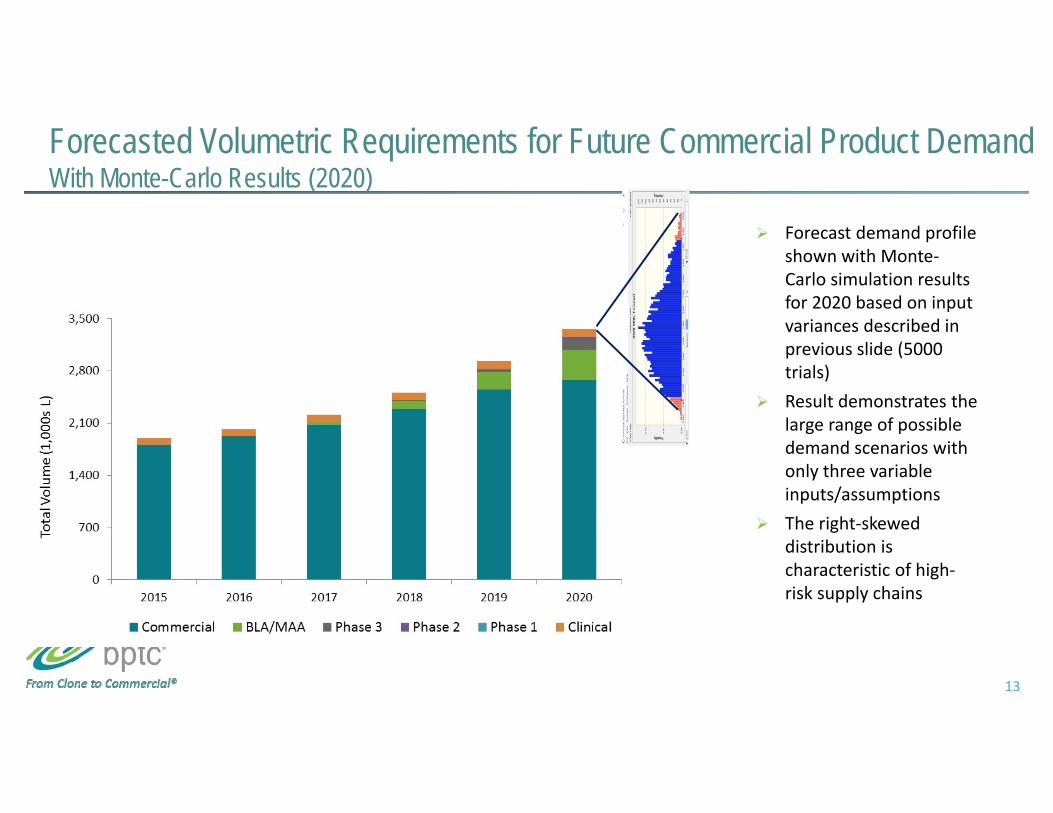
Forecasted Volumetric Requirements for Future Commercial Product DemandWith Monte-Carlo Results (2020)
Forecast demand profile shown with Monte‐Carlo simulation results for 2020 based on input variances described in previous slide (5000 trials)
Result demonstrates the large range of possible demand scenarios with only three variable inputs/assumptions
The right‐skewed distribution is characteristic of high‐risk supply chains
14
Challenges in Demand Forecasting for Individual Products Many of the same challenges for forecasting future demand exist within organizations for products
in development Brastow and Rice published an example of using Monte‐Carlo simulations to characterize future
demand outcome ranges for individual company pipelines1
Many examples exist of product launches with actual demand that varied significantly from forecasts, and uncertainty often remains post‐launch:• Anti‐PCSK‐9 products (evolocumab and alirocumab) were forecast to generate combined
revenues of $450M in 2016 and $5B in 2020. ― Combined 2016 sales (~$250M) were “well below pre‐launch expectations” despite significant investments in marketing and
promotion― Will Amgen’s recent announcement of positive clinical results from FOURIER trial change trajectory?
• Anti PD‐1 products (nivolumab and pembrolizumab) were forecast to generate between $4‐7B in revenue in 2020. ― Combined 2016 sales of the two products were $5B in only second full year of sales with nivolumab sales ~2.5x pembrolizumab― Will recent lung cancer results change the demand trajectories of these two products?
1‐Brastow WC, Rice CW. Planning pharmaceutical manufacturing strategies in an uncertain world. Bioprocess Int. 2003 Jun;1(6):46‐55.
15
Flexibility-Enabling Technologies

16
Many technologies being adopted by industry enable more flexible operations
First Movers Second tier
General acceptance
Aging Technologies
Adapted from: Morten Munk, NNE Pharmaplan: “Continuous Bioprocessing –What is holding the industry back from implementing CBP more broadly?”
Outsourcing to CMOs is another flexibility‐enabling strategy of importance to industry
17
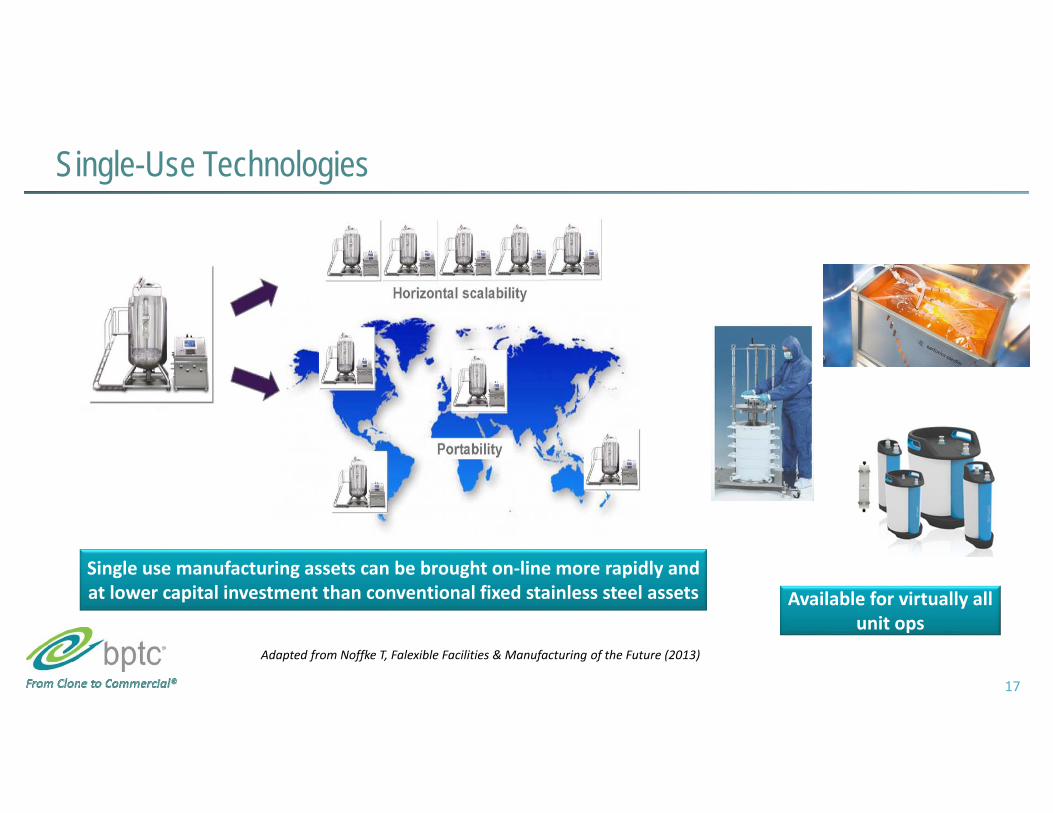
Single-Use Technologies
Single use manufacturing assets can be brought on‐line more rapidly and at lower capital investment than conventional fixed stainless steel assets
Adapted from Noffke T, Falexible Facilities & Manufacturing of the Future (2013)
Available for virtually all unit ops

18
Flexible, Modular Facilities
Modular facilities designs, such as KUBio and KeyPlants, offer flexible designs with standard components/modules that can be built quickly and efficiently
Media and Buffer Preparation/Hold
Support areas
Final Purif.
MaterialStaging andDispensing
Airlocks and Corridors
Inoculum
Airlocks and Corridors
Cell Culture and Purification
TM
KUBio is a trademark of General Electric Company
19
Themes from Symposium on Continuous Manufacturing of Pharmaceuticals2
Value of Flexibility Benefits
• Flexibility – virtually every speaker mentioned flexibility as a significant beneift• Time to Market• Reduced Capital• Reduced Materials• Improved Control of Product Quality• Reduced Labor (extent?)
Many different approaches to implementation; fully continuous not required• Individual steps/process sections• Integrated batch operations• End‐to‐end
2‐2nd International Symposium on Continuous Manufacturing of Pharmaceuticals, Sep 26‐27, 2016, Cambridge, MA

20
Estimating the Value of Flexibility
21
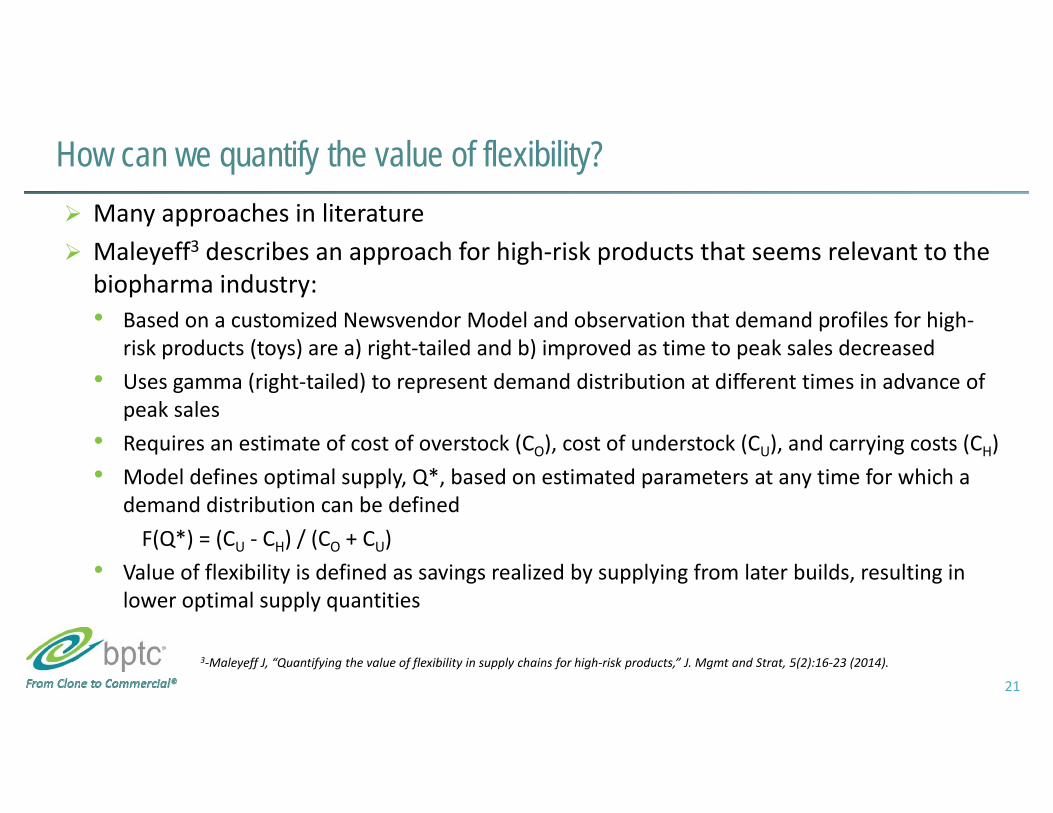
How can we quantify the value of flexibility? Many approaches in literature Maleyeff3 describes an approach for high‐risk products that seems relevant to the
biopharma industry:• Based on a customized Newsvendor Model and observation that demand profiles for high‐
risk products (toys) are a) right‐tailed and b) improved as time to peak sales decreased• Uses gamma (right‐tailed) to represent demand distribution at different times in advance of
peak sales• Requires an estimate of cost of overstock (CO), cost of understock (CU), and carrying costs (CH)• Model defines optimal supply, Q*, based on estimated parameters at any time for which a
demand distribution can be definedF(Q*) = (CU ‐ CH) / (CO + CU)
• Value of flexibility is defined as savings realized by supplying from later builds, resulting in lower optimal supply quantities
3‐Maleyeff J, “Quantifying the value of flexibility in supply chains for high‐risk products,” J. Mgmt and Strat, 5(2):16‐23 (2014).
22
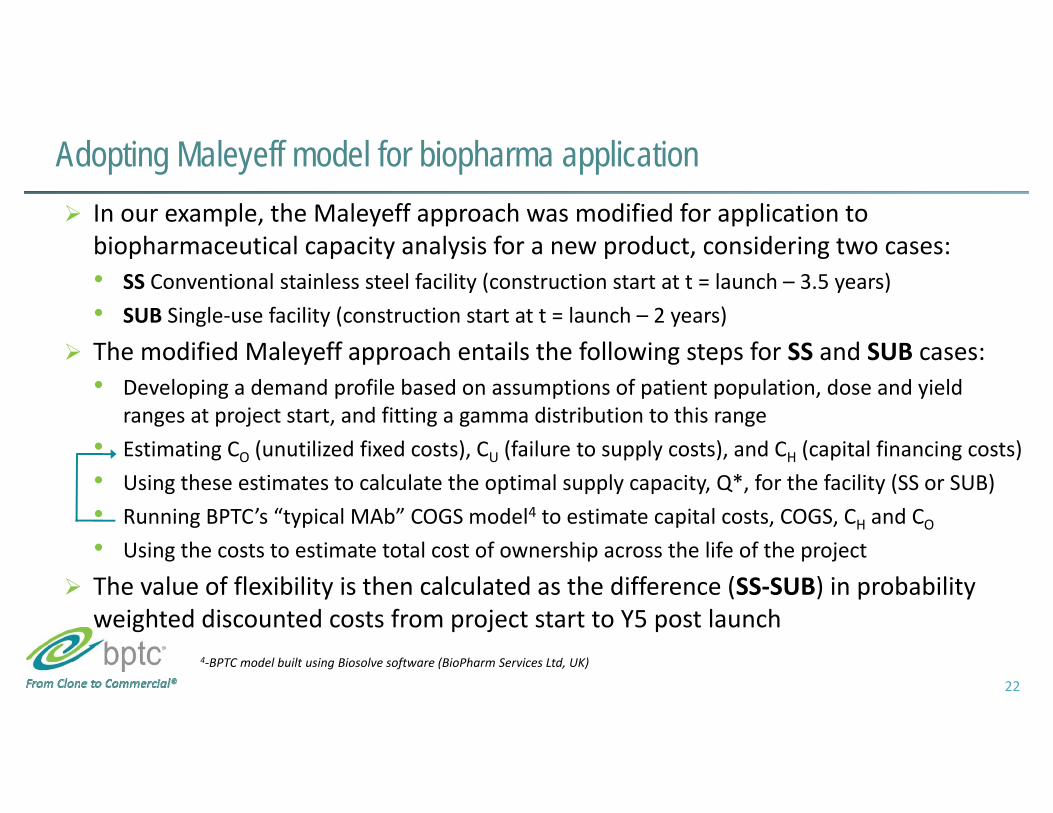
Adopting Maleyeff model for biopharma application In our example, the Maleyeff approach was modified for application to
biopharmaceutical capacity analysis for a new product, considering two cases:• SS Conventional stainless steel facility (construction start at t = launch – 3.5 years)• SUB Single‐use facility (construction start at t = launch – 2 years)
The modified Maleyeff approach entails the following steps for SS and SUB cases:• Developing a demand profile based on assumptions of patient population, dose and yield
ranges at project start, and fitting a gamma distribution to this range• Estimating CO (unutilized fixed costs), CU (failure to supply costs), and CH (capital financing costs)• Using these estimates to calculate the optimal supply capacity, Q*, for the facility (SS or SUB)• Running BPTC’s “typical MAb” COGS model4 to estimate capital costs, COGS, CH and CO• Using the costs to estimate total cost of ownership across the life of the project
The value of flexibility is then calculated as the difference (SS‐SUB) in probability weighted discounted costs from project start to Y5 post launch
4‐BPTC model built using Biosolve software (BioPharm Services Ltd, UK)

23
Estimating Demand Profile Based on bioTRAK estimates of typical Phase times, SS project start will be during
Phase 2 and SUB project start during Phase 3 SS case assumptions:
• 5‐year demand range: 20,000‐100,000 patients• Patient dosing range: 1.6‐8.4 g/patient*yr• Overall yield (DP) range: 0.64‐1.28 g DP/L CC• Resulting CC demand range: 25‐1,313 kL/yr
SUB case assumptions:• 5‐year demand range: 30,000‐100,000 patients• Patient dosing range: 4‐6 g/patient*yr• Overall yield (DP) range: 0.8‐1.12 g DP/L CC• Resulting CC demand range: 107‐750 kL/yr
‐5E‐07
0
0.0000005
0.000001
0.0000015
0.000002
0.0000025
0 200000 400000 600000 800000 1000000 1200000 1400000
L/yr
‐5E‐07
0
0.0000005
0.000001
0.0000015
0.000002
0.0000025
0.000003
0.0000035
0.000004
0.0000045
0.000005
0 200000 400000 600000 800000 1000000 1200000 1400000
24
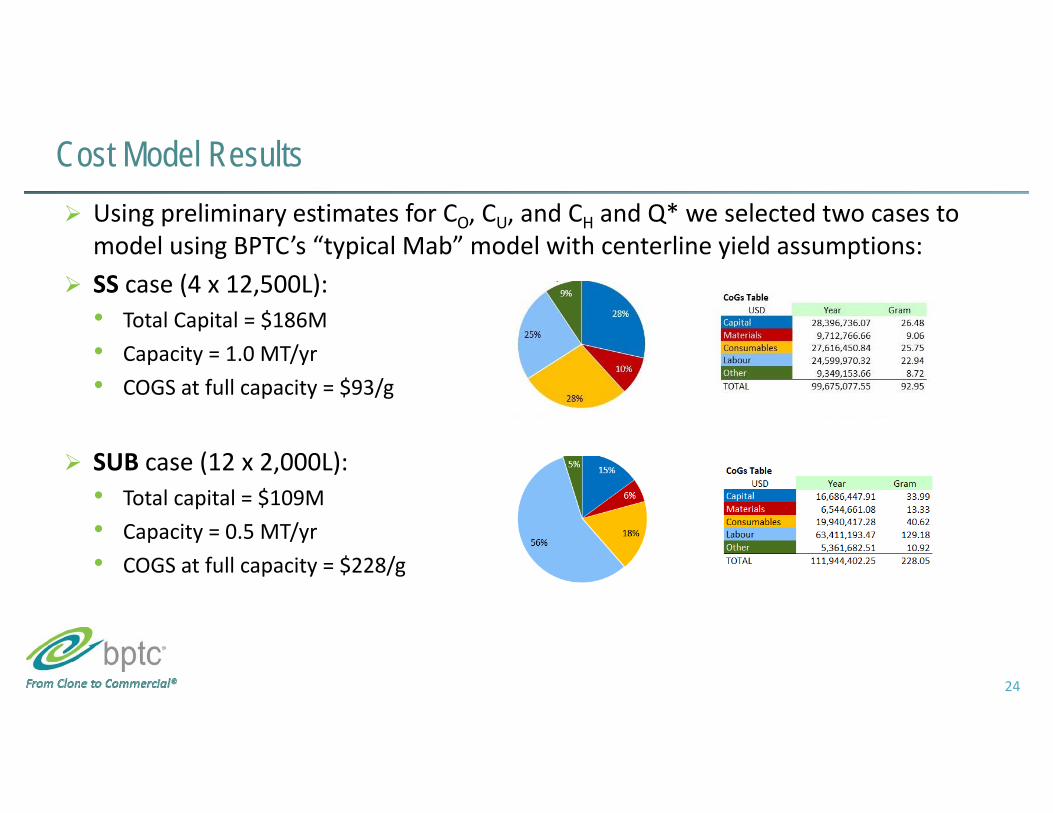
Cost Model Results Using preliminary estimates for CO, CU, and CH and Q* we selected two cases to
model using BPTC’s “typical Mab” model with centerline yield assumptions: SS case (4 x 12,500L):
• Total Capital = $186M• Capacity = 1.0 MT/yr• COGS at full capacity = $93/g
SUB case (12 x 2,000L):• Total capital = $109M• Capacity = 0.5 MT/yr• COGS at full capacity = $228/g

25
Verification of Scale Selection with Model Parameters Next we updated our estimates for CO, CU, and CH based on the COGS model results and recalculated Q*
to verify scale selection For both cases, CU = Cost of failure to supply = $3,600/g, based on:
• Centerline dose assumption = 5 g/patient*yr• Treatment price = $20,000/patient*yr• Gross margin = 90%
SS case (4 x 12,500L):• CO = Fixed portion of COGS = $42/g • CH = Financing cost for capacity = $329/L = $3/g• F(Q*) = 0.99
SUB case (12 x 2,000L):• CO = Fixed portion of COGS = $104/g • CH = Financing cost for capacity = $227/L = $2/g• F(Q*) = 0.97
In both cases, calculated optimal supply capacity was within 10% of modeled case. Re‐iteration to converge to tighter limit possible.

26
Estimating Value of Flexibility Total Cost of Supply based on Discounted Cash Flows Total cost of supply estimated for each
case using• BPTC cost model‐generated capital cost and
COGS values• bioTRAK assumptions for demand ramp‐up
(through Y5) • Discount rate = 5%
Value of flexibility for SUB case estimated as difference of sum‐products of• Cumulative discounted costs to end of phase
and• Probability of success per phase (bioTRAK
assumptions)
$‐
$50.00
$100.00
$150.00
$200.00
$250.00
$300.00
$350.00
$400.00
$450.00
$500.00
0 2 4 6 8 10 12
Total Cost o
f Sup
ply ($M)
Year
TOTAL COST OF SUPPLY COMPARISON
SUB Case
SS Case
Launch
End of P3
End of P2
POS=26%POS=58%
POS=90%
ScenarioCumulative Cost Difference ($M)
Probability of Occurrence
Failure End of Phase 2 75$ 32% Failure End of Phase 3 96$ 32% Failure End of BLA 70$ 10% Commercial Supply to Y5 (4)$ 26%TOTAL ESTIMATED VALUE ($M) 61$
27
Conclusions Forecasting future demand for biopharmaceuticals is challenging
• Many parameters required to estimate demand have significant uncertainties• Result is a future demand profile with a large range of potential outcomes• Monte‐Carlo simulations can be used to estimate the range of outcomes
Industry has developed and is adopting technologies that enable flexibility• Examples include single‐use technologies, modular construction, and continuous processing
Tools to estimate the value of flexibility are needed• One possible approach is presented based on a Maleyeff (modified newsvendor) model• This approach is based on observation that accuracy of demand estimates are a) right skewed
and b) improve as time to peak sales decreases• Example of SS vs. SUB facility comparison for a development‐stage biopharmaceutical shows
how “modified Maleyeff” approach can be used to estimate the significant value of flexibility

28
Acknowledgements
BPTC Colleagues• Howard Levine• Dawn Ecker• Rick Stock• Terence Davidovits
Morten Munk

Thank You!
BioProcess Technology Consultants, Inc.12 Gill Street, Suite 5450Woburn, MA 01801
+1.781.281.2704
Thomas C. Ransohoff