Embed Size (px)
Citation preview

THE URBAN TRANSPORTATION CENTER AT THE UNIVERSITY OF ILLINOIS AT CHICAGO
Ranking Northeast Illinois New Starts Transit Potential Expansion for Metra and CTA
July 2017
UIC 2117-9050-02-C
Prepared For National Center for Transit Research Center for Urban Transportation Research University of South Florida
The Urban Transportation Center University of Illinois at Chicago
412 S. Peoria St., 340 CUPPAH, Chicago, IL 60607-7036 www.utc.uic.edu

A REVIEW OF CAPITAL IMPROVEMENT GRANT PROGRAM AND THE NEED FOR A UNIFORM PROJECT SELECTION PROCESS
BY
P. S. SRIRAJ
JORDAN SNOW JENNY KANE
JANE WILBERDING DIVYANGA GANESH
URBAN TRANSPORTATION CENTER COLLEGE OF URBAN PLANNING AND PUBLIC AFFAIRS
UNIVERSITY OF ILLINOIS AT CHICAGO JULY 2017

1
Contents 1.0 ACKNOWLEDGEMENT 2
2.0 ABBREVIATIONS 3
3.0 INTRODUCTION 6
4.0 HISTORYOF THE NEW STARTS-CIG PROGRAM 7
4.1 STURAA (1987) 8
4.3 TEA-21 (2000) 8
4.4 Prior to SAFETEA 9
4.5 SAFETEA (2007) 9
4.6 SAFETEA-LU (2009) 9
4.7 MAP-21 9
4.8 FAST Act 2015 10
5.0 LITERATURE REVIEW 11
5.1 OUTLINE 11
5.3 NEW STARTS PROJECTS HISTORICAL PERSPECTIVE 12
5.3.1 Federal Level 18
○ 5.3.1.1 Planning Stage 18
○ 5.3.1.2 Preliminary Engineering Stage 18
○ 5.3.1.3 Final Design and Construction Stage 18
○ 5.3.1.4 Operation Stage 18
5.3.2 State/Local Level 19
5.3.2.1 Economic Impact Assessment EIA (source 42, 44) 19
5.3.2.2 Land Use and Construction Impact 20
5.3.2.4 Environmental Impact Analysis 20
5.3.2.5 Social Impact Assessment: Public Safety and Health Impacts 21
5.4 PROJECT SELECTION CRITERIA: NEW STARTS PROJECT 21
5.4.1 Federal Level 21
5.4.1.1 Project Justification 21
5.4.1.2 Local Financial Commitment 22
5.4.2 State Level 22
● 5.4.2.1 Accessibility and Land use: Transit Oriented Developments (TOD) 22
● 5.4.2.2 Economic development measure 23

2
● 5.4.2.3 Environmental performance measure 24
5.5 NEW STARTS PROJECT SELECTION AT THE LOCAL LEVEL 25
5.5.1 CMAP’s evaluation 25
5.5.2 Memphis Light Rail Corridor’s project evaluation 26
5.6 INTERVIEWS OF MPOS - New Starts Ranking at the Local Level 28
5.6.1 Interviews 28
5.6.2 Summary of Interviews 29
5.6.2.1 Riverside County Transportation Commission (RCTC) 29
5.6.2.2 Puget Sound Regional Council (PSRC) 29
5.6.2.3 Oakland Metropolitan Transportation Commission (MTC) 30
5.6.2.4 Metropolitan Washington Council of Governments (MWCOG) 31
5.6.2.5 Los Angeles County Metropolitan Transportation Authority (LACMTA or “Metro”) 32
5.6.2.6 Denver Regional Transportation District (RTD) 32
5.6.2.7 Florida Department of Transportation (FDOT) 33
5.7 RECOMMENDATIONS 34
5.7.1 Timeline Evaluation 35
5.7.2 Economic Impact Analysis based on VMT and Other Criteria 35
5.7.3 Performance based funding movement 36
6.0 CONCLUSION 36
7.0 LIST OF TABLES 37
8.0 REFERENCES 37
1.0 ACKNOWLEDGEMENT
This work was sponsored by the Illinois Department of Transportation and through the Metropolitan Transportation Support Initiative (METSI), the Urban Transportation Center, at the University of Illinois at Chicago. The authors would also like to acknowledge the support received from the US Department of Transportation through the National Center for Transit Research (NCTR), University of South Florida for this work.
3
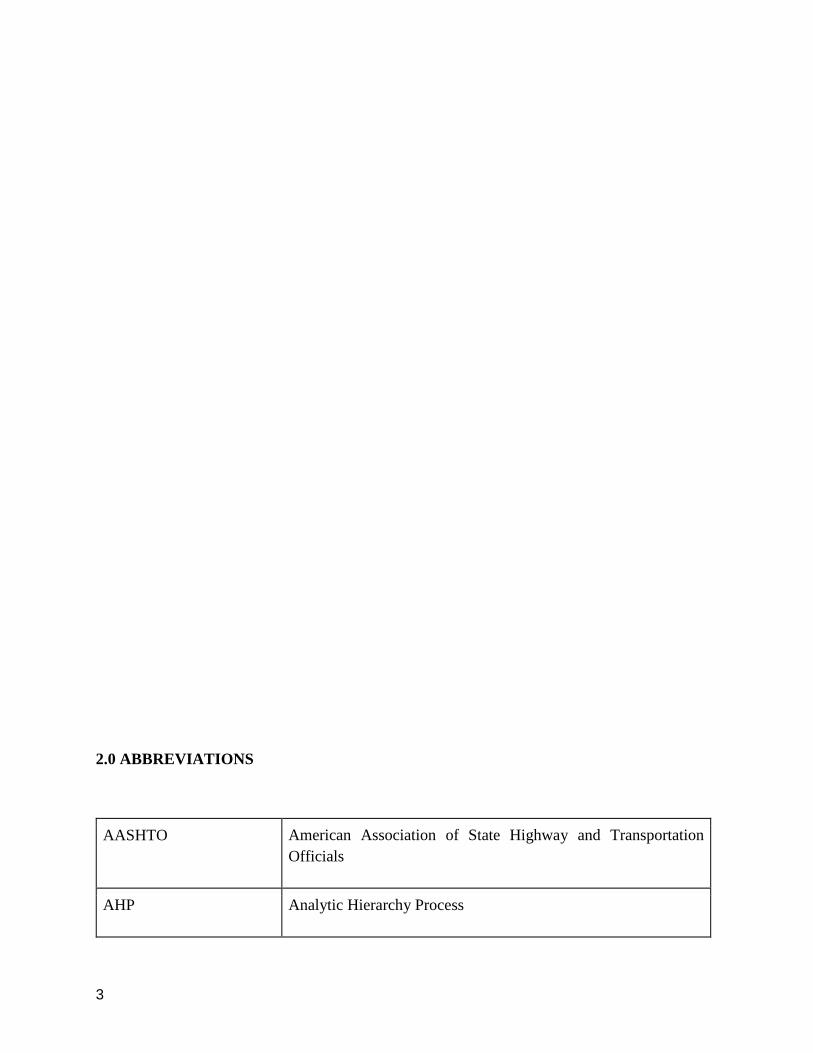
2.0 ABBREVIATIONS
AASHTO American Association of State Highway and Transportation Officials
AHP Analytic Hierarchy Process

4
APTA American Public Transportation Association
CIG Capital Investment Grant
CMAP Chicago Metropolitan Agency for Planning
CTAA Community Transportation Association of America
DOT Department of Transportation
EIA Economic Impact Analysis
EPA Environmental Protection Agency
FFGA Full Funding Grant Agreement
FTA Federal Transit Administration
FY Fiscal Year
GAO Government Accountability Office
ISTEA Intermodal Surface Transportation Act
LACMTA Los Angeles County Metropolitan Transportation Authority
MPO Metropolitan Planning Organization
MTC Oakland Metropolitan Transportation Commission

5
MWCOG Metropolitan Washington Council of Governments
NEPA National Environmental Policy Act
NPRM Notice of Proposed Rulemaking
PSRC Puget Sound Regional Council
RCTC Riverside County Transportation Commission
RTD Regional Transportation Department
SAFETEA Safe, Accountable, Flexible, Efficient Transportation Equity Act
SAFETEA-LU Safe, Accountable, Flexible, Efficient Transportation Equity Act: A Legacy for Users
SIA Social Impact Analysis
STURAA Surface Transportation and Uniform Relocation Assistance Act
TCRP Transit Cooperative Research Program
TEA-21 Transportation Equity Act for the 21st Century
TOD Transit Oriented Development
TSUB Transportation System User Benefit

6
UMTA Urban Mass Transportation Act
3.0 INTRODUCTION
Large scale public investment initiatives are always subject to tremendous scrutiny and are looked at through the prism of multiple stakeholders and constituents. It is thus imperative to ensure a level of transparency when it comes to the decision making process associated with project selection, prioritization, and ranking.
This report reviews the programs and policies of the United States Department of Transportation (DOT)’s project selection and evaluation process to fund new capital-intensive projects in the transportation sector. The Federal formula programs administered and overseen by the Federal Transit Administration (FTA) are the basis for this review. Within the federal formula funding

7
programs, the Capital Improvement Grants (CIG) is the primary funding program assigned for transit capital investments like heavy rail, commuter rail, light rail, streetcars, bus and other rapid transit projects. There are over 70 projects across the nation under the Capital Investment Grant program.
According to a APTA study (2013), as of 2010, 78 rail systems were operating in the US, with ridership growing 36% between the years of 1995 to 2012. It is interesting to note that the growth in transit seems to be happening alongside a depletion of transit funds and even in instances that funding was received, they seemed to have come from appropriations and not from flex funding sources. The APTA study also specifically discusses “pipeline” projects, in which projects have obtained a status of preliminary engineering or higher. This helps to materialize the current state of new start funding allocations and project future trends.
To provide a better understanding of how the CIG program works, this report traces the origins and history of the evolution of this funding program at the federal level, combined with a review of the program’s administration across different metropolitan areas around the country. A series of semi-structured telephone interviews were conducted to catalogue and understand the project prioritization process at the local level leading to selection of candidate projects for FTA CIG consideration from each of these regions. It is expected that this report will provide an insight into the complexities associated and embedded in the project prioritization and selection process both at the regional and federal levels. The report is expected to be used as a guide and a resource for applicants to the CIG Program.
4.0 HISTORY OF THE NEW STARTS-CIG PROGRAM
The Capital Investment Grant Program was first introduced in Section 3 of the Urban Mass Transportation Act (UMTA) of 1964 (P.L. 88-365). The earliest versions of the New Starts program were introduced by the forerunner to the FTA, the Urban Mass Transportation Administration (UMTA). The US Department of Transportation (USDOT), under which UMTA operated, responded to congressional delegates from large urban areas that demanded an increased federal presence in funding mass transit projects (source 78, p. 3). The UMTA itself was created in 1964 in response to the deteriorating condition of mass transit systems in many large metropolitan areas. Suburbanization and the construction of urban interstates prompted the popularization of commutes by private vehicle from outlying areas to jobs located in central business districts (source 81). These changing land use patterns combined with a shift in transportation modal utilization combined to bankrupt many privately run bus and rail lines in American cities (Ibid). By the early 1960s public officials at every level of United States government began to realize that the failure of privately-run mass transit systems was enacting a burden on the residents living in metropolitan areas that depended on bus and rail transportation modes.
The beginning of 1970 saw an increase in demand for federal funding. The Department of Transportation framed policy statements for funding based on which this federal funding

8
would be distributed to projects. This funding allocation to those qualifying projects are called New Starts. The selection criteria were later written into federal law, long-range plans etc. The policies were framed in the years 1976, 1978, 1980 and 1984 and were based on the following baselines.
● Cost effectiveness● Local financial commitment● Multi-year contract● Local land use planning support● Rating system
4.1 STURAA (1987)
In 1987 the Congress formed Surface Transportation and Uniform Relocation Assistance Act (STURAA; P.L. 100-17) to judge the CIG projects and ensure its eligibility for federal funding and required a detailed report from the DOT recommending a continuous funding for the subsequent fiscal years. The criteria included an alternative analysis with a preliminary engineering for the project, cost effectiveness and that the project should be supported with a stable and dependable local financial commitment. [1]
4.2 ISTEA (1991)
The Intermodal Surface Transportation Act (ISTEA; P.L. 102-40) introduced by Congress contained few more additions to the evaluation criteria. Mobility improvements justification based on environmental benefits and operating efficiencies were added as main consideration factors to cost effectiveness criteria. Apart from these main factors, ISTEA also contained a list of secondary consideration factors like congestion relief, energy consumption, transit supportive land use policies considering future improvements and economic development. But the program retained the previously framed considerations on local financing commitment and alternative analysis based on preliminary engineering. Later in 1994 Section 3 was renamed to Section 5309 with a Title 49. [2]
4.3 TEA-21 (2000)
The Transportation Equity Act mostly left CIG’s New Starts program unchanged except for few additional considerations on the technical aspects and cost of sprawl. This was to ensure the capacity of transit agency to handle the project through its completion. TEA-21 also requested FTA to rate its projects on three categories, highly recommended, recommended and not recommended. Additionally, TEA-21 also recommended a final evaluation stage for the projects proceeding from preliminary engineering stage to its design stage. FTA published several program

9
guidance reports in response to TEA-21 recommendations and approved it as a final rule for New Starts approval. [3]
4.4 Prior to SAFETEA
As per the recommendation from GAO and DOT’s, FTA announced funding to targeted projects that was ranked at least medium or more for its cost-effectiveness criteria. According to the Notice of Proposed Rulemaking (NPRM) in 2007, the funding criteria recommended for FTA for project funding should satisfy a medium rating with 50% weightage on cost-effectiveness and the balance with 20% on land use and economic development, 20% on mobility benefits, 5% on environmental benefits and 5% on ridership. This was not accepted by the House Transportation and Infrastructure Committee as it would place too much emphasis on cost-effectiveness and not give weightage to the economic development of transit projects. Also, many criticized that SAFETEA would favour only suburban projects like BRT and commuter rail and will fail to look at more centrally located transit projects like street cars.[4]
4.5 SAFETEA (2007)
The Safe, Accountable, Flexible, Efficient Transportation Equity Act (SAFETY; P.L. 109-59) created a legacy for users. It enhanced the importance of land use policies and future patterns support for public transportation and economic development for FTA’s consideration of project justification. It introduced the Small Starts program that involved smaller transportation projects based on a simpler approval process. SAFETEA made changes to the three-point scale evaluation of TEA-21 to five-point scale of high, medium-high, medium, medium-low and low. [5]
4.6 SAFETEA-LU (2009)
Due to the project weightage concerns in the SAFETEA act, Congress included the Technical Corrections Act of 2008 (P.L. 110-244), 49 U.S.C 5309 to give comparable but not equal, or numerical weightage to each project justification criteria that contributes to the overall project rating. In February of 2009, the NPRM withdrew the previous criteria and issued final guidance in July which rated cost effectiveness as 20%, mobility improvements 20%, land use 20%, environmental benefits 10%, and operating efficiency 10%. Along with this FTA also announced that it would accept only those projects that satisfied a medium rating based on the above criteria. Also, the FTA announced a new NPRM for changes in New Starts and Small Starts with revised policy guidance in January 9, 2013.[6]
4.7 MAP-21
The new rule proposed by FTA quoted two main goals: To simplify the evaluation process, and simplify the baseline alternative requirement for evaluation. But before these changes were finalized MAP-21 was already enacted and made substantial changes to the CIG program. The changes included funding for substantial improvements in existing fixed-guideway lines that

10
would increase the capacity of the project by 10%. These projects were termed Core Capacity projects. Other changes involved in MAP-21 were the reduction in project stages from four to three (Project development, Engineering and Construction stages) in the New Starts program. To enter the first stage, the project must simply apply to FTA and initiate a reviewing process by National Environmental Policy Act (NEPA); P.L. 91-190). This act eliminated the alternative analysis previously required by NEPA in a transportation problem in a specific area. It also changed the cost-effectiveness from travel time increase to the cost per rider and eliminated operating efficiencies to congestion relief. These changes introduced by MAP-21 were framed to improve the rating projects. Finally, on August 5, 2015, the final policy on CIG was announced by FTA but characterized these as”interim” and contained four key guidelines,
1. The breakpoint measure on Congestion Relief made applicable to New Starts and Small Starts projects.
2. Including the local financial commitment along with the breakpoints for all justification criterion for the evaluation of Core Capacity projects.
3. A prerequisite requirement to be satisfied for the entry into each phase of CIG program to be made for every project.
4. Qualified projects under New Starts, Small Starts and Core Capacity can be entitled to automatic ratings on some evaluations through warrants.[7]
4.8 FAST Act 2015
This was framed in December of 2015 and changed few guidelines of the CIG program. This proposed that a New Starts project must require a matching in the total cost of the project with 80% Federal funding and 20% local funding for it to satisfy the FFGA (Full Funding Granting Agreement). However, the Congressional Conference Report with Department of Transportation Appropriations Act signed an agreement stating that FTA would not sign for a FFGA after September 30, 2002 for projects that have a Federal share of more than 60%.
1. Small Starts projects were allotted to those that costs less than $300 million from $250
million and allocated $100 million from $75 million. New Starts project with $300 million or more and requesting a funding of $100 million or more from FTA.
2. The BRT service in a Small Starts project added bi-directional service to weekdays from only weekend.
3. The law also created Expedite Project Delivery for CIG pilot program to fund projects that would benefit both public transportation and intercity passenger rail with eligible cost being attributed to the transit portion of the project.[8]

11
5.0 LITERATURE REVIEW 5.1 OUTLINE The previous section tracing the legislative history and the evolution of the New Starts/CIG program documents the many changes in the program over the years starting from 1964. The FTA has revised the project selection criteria over the last several years in an attempt to make it a well targeted federal initiative that benefits applicants that demonstrate the need along with strong local support. One of the reasons for developing this report is to understand how the projects are recommended to FTA’s selection panel from the local level. This is necessitated in part due to the lack of understanding on the part of potential applicants/project stakeholders as to what are the key issues that they need to demonstrate in their application that will make it attractive to obtain the local support needed. The process for New Starts project selection is divided into two main categories in this report: Project Selection and Project Prioritization process. Each category is discussed in detail to provide an understanding of each category at the federal and local level. The selection of a transportation investment project at the local level is typically grouped into four categories. It was also found from the Georgia Transportation Authority that the perception existing among stakeholder is that a project selection process is subject to political influence. But, whether political influence is real or perceived, the perception is likely to persist if scoring exceptions and weak procedural controls remain.
● The identification and measurement of benefits from the projects, including direct and indirect economic development benefits.
● Identification and measurement of the costs associated with the investments (financing investments).
● Distribution of the benefits and costs by population group and by location. ● Environmental effects of the projects under examination. [9]
A planning division controls the project prioritization process to ensure an objective, data-driven project selection process. Initially the planning division does not require all projects to be scored or objectively evaluated. For those projects that are scored, the Planning Division reviews data to ensure that scores are complete and accurate. Lastly, prioritization ensures that project scores or other objective analysis serve as the basis for decision-making. But if this environment is not transparent, it could erode the trust with stakeholders and increase the risk of undue political influence. [10] This report focuses on finding out this transparency in the local prioritization/selection process for New Starts project funding through published literature and with the help of semi-structured interviews of local stakeholders from around the country. The review of published documentation

12
about the project prioritization/selection process at the federal, state, and local levels is taken up next. 5.3 NEW STARTS PROJECTS HISTORICAL PERSPECTIVE This section identifies the status of all the New Starts projects starting from Fiscal Year (FY) 2005 through 2016 that contain projects rated and evaluated by FTA for FFGAs. The reason behind considering 2005 Fiscal Year is because it was after this year the FTA’s evaluation for New Starts projects was revised and became more structured. [11] Table 1A- A table representing number of New Starts projects evaluated under the reauthorization bill for each Fiscal Year.
Fiscal Year
Projects evaluated by FTA
Exempted from rating
Selected Rated No of FFGA projects approved by FTA
Estimated Funding
Reauthorization Bill for the FY
2005 38 9 7 29 5 $7.6 billion TEA-21
2006 34 7 11 27 11 $25 million SAFETY- LU
2007 20 - 7 12 5 (2 pending)
$1.47 billion SAFETY- LU
2008 19 5 14 14 2 $6.30 billion SAFETY- LU
2009 SAFETY- LU
2010 14 5 5 5 5 $433.6 million
SAFETY- LU
2011 SAFETY- LU
2012 19 - 8 - - $33.82 billion SAFETY- LU

13
The above table represents the different projects selected for each fiscal year based on a selection process of FTA explained in the legislative history. Review of Past CIG Projects This section identifies the status of all the New Starts, Small Starts and Core Capacity projects starting from FY2005 through FY 2008 that contains projects rated and evaluated by FTA for FFGAs. FY2005 Out of 38 projects evaluated by FTA, 29 were rated and 9 were exempted from the rating process. FTA proposed 7 projects for funding for the FY2005. The total cost of the five projects are estimated to be $7.6 billion. Out of 7, 5 projects were selected for FFGA
1. Cleveland, Euclid Corridor Transportation Project 2. Las Vegas, Resort Corridor Fixed Guideway 3. New York, Long Island Rail Road East Access 4. Pittsburgh North Shore LRT connector 5. Phoenix, Central Phoenix/East Valley Light Rail Transit Corridor (LRT)
Figure 1A - The number and percentage of projects rated by category, Fiscal Years from 2003-2005

14
FY 2006 The annual report listed 34 projects in preliminary and in the final design. FTA evaluated and rated 27 projects, seven were exempted from rated as they requested $25 million in New Starts and 11 projects were selected for FFGA
1. San Diego, Mid Coast Light Rail Transit Extension 2. Denver, West Corridor Light Rail Transit 3. New York, Second Avenue Subway 4. Washington County(Oregon), Wilson Ville to Beaverton Commuter Rail 5. Dallas, North West-South East Light Rail 6. Salt Lake City, Weber County to Salt Lake City Commuter Rail 7. 4- FFGA – 9.9 Billion (Federal New Starts share – $3.6 Billion) 8. Charlotte, South Corridor Light Rail Transit 9. New York, Long Island Rail Road East Side Access 10. Phoenix, Central Phoenix/East Valley Light Rail Transit Corridor 11. Pittsburgh, North Shore Light Rail Transit Connector
FY 2007 During the evaluation cycle, FTA evaluated and rated 20 projects, recommended five projects for new FFGAs and two projects with pending FFGAs. FTA also identified five other projects that may be eligible for funding outside of FFGAs. The administration’s fiscal year 2007 budget proposal requests $1.47 billion for the New Starts program, which is about $200 million more than the amount received the previous. The table below shows the New Starts projects proposed for FFGA for FY 2007.

15
One was rated as “high,” 17 were rated as “medium,” and two were rated as “low.” FTA recommended 12 of the 20 projects for funding. Specifically, FTA recommended five projects for new FFGAs and two projects with pending FFGAs.6 In addition, FTA identified 5 other projects that may be eligible for funding outside of FFGAs. The administration’s budget request of $1.47 billion for the New Starts program is about $200 million more than the amount received last year. The majority of the $1.47 billion would be allocated to projects with existing and pending FFGAs and projects proposed for new FFGAs identified 24 projects in preliminary engineering and final design (see fig. 3). FTA evaluated and rated 20 of these projects, 13 and 4 projects were statutorily exempt from being rated because their sponsors requested less than $25 million in New Starts funding.14 FTA evaluated and rated fewer projects during the fiscal year 2007 cycle than in fiscal year 2006. According to FTA, this decrease occurred because 12 proposed projects are no longer in preliminary engineering or final design.15 FTA stated in its annual report that the sponsors of these projects have either
1. fully implemented the project; 2. Received the total New Starts funding requested to implement the project; 3. Terminated or suspended project development activities; 4. Withdrawn from the New Starts process while they address outstanding issues; or 5. Decided not to pursue New Starts funding.
FY 2008 FTA’s [DG1] Annual Report on New Starts: Proposed Allocations of Funds for Fiscal Year 2008 (annual report) identified 19 New Starts projects in preliminary engineering and final design. FTA evaluated and rated 14 of these projects, rating two as “high,” 12 as “medium,” and none as “low.”16 Five additional projects were statutorily exempt from being rated because their sponsors requested less than $25 million in federal funding. FTA recommended 10 New Starts projects for

16
funding. Specifically, FTA recommended two New Starts projects for proposed FFGAs. The total capital cost of these two projects is estimated to be $6.30 billion, with the total federal New Starts share expected to about one-third of this total. Below table represents New Starts and Small Starts project for FY 2008.
Figure 2A: Visual representation of the overall structure of Strategic Assessment process by RCTC.

17
From the Figure 1A we found that the projects that were listed for FFGA did not detail on how it got represented for the initial selection at the Federal level. This project prioritization has been studied by many researchers on various aspects of how a project to reaches the Federal level from the local level. The report focuses on understanding this project prioritization at the local level through a substantial number of literature studies and interviews. PROJECT PRIORITIZATION – FEDERAL AND STATE/LOCAL LEVELS Project prioritization approaches are numerous and can be done quantitatively, qualitatively, or using mixed methods (both quantitative and qualitative). The prioritization process allows for a

18
project to position itself and determine if the project is deemed suitable enough to move forward for funding request and making it eligible for receiving New Starts funding or other capital intensive grants. This is categorized into two levels, the local level and the federal level prioritization. In the following paragraph the project prioritization method at the federal level is briefed initially followed by the different methods of prioritization at the state level.
5.3.1 Federal Level
The Legal Research Digest 30 Published in 2010 under TCRP project j-5 “Legal Aspects of Transit and Intermodal Transportation Programs,” by Daniel Duff, Edward J. Gill, Jr., and G. Kent Woodman, Thompson Coburn LLP. James B. McDaniel, TRB Counsel for Legal Research Projects, discusses on the prioritization method followed at the Federal level for New Starts Program. [12]
● The TCRP report discusses on the FTA’s decision for selecting a project for the New Starts funding. The prioritization consists of the following stages and typically takes six to 12 years for a project to gain FTA’s New Starts funding. These five stages considered for a project prioritization is called Project Development of the New Starts Process.
○ 5.3.1.1 Planning Stage In this stage, the transit agency performs a system and alternate analysis planning for the project to develop. This stage takes about 1 to 2 years and requires FTA’s approval for it to proceed forward to the next step.
○ 5.3.1.2 Preliminary Engineering Stage After the initial approval, the project moves to the next stage which is the Preliminary Engineering stage. This stage take minimum of two to three years to process with FTA approval towards the end of the second or third year.
○ 5.3.1.3 Final Design and Construction Stage These two stages are considered one of the key stages for a project to enter Full Funding Grant Agreement (FFGA) stage. Those projects filtered by FTA after the first two stages enters this level. Here the approval process takes about three to seven years. This includes the final design of the project along with preliminary construction process. Once a project crosses this stage receives FFGA eligibility.
○ 5.3.1.4 Operation Stage This is the final stage that includes construction and completion of the project along with the operation and maintenance of the project.
● In the TCRP report, Deloitte's criticism on New Starts assessment discusses that the FTA’s
assessment on the project development stage was intensive and a burdensome process, and there are no clear and concise definitions mentioned for each project development stage. With the Project status not known at the development stage the overall annual rating creates an unnecessary burden. The current nomenclature for New Starts phases does not

19
accurately reflect the required process activities and causes confusion for program stakeholders. [13]
5.3.2 State/Local Level
State level project prioritization has been studied by many researchers in various topics to justify if the prioritization at the region level matches the federal process. It was found that all these prioritization steps followed by different regions converge to a single conclusion stage but follows different methods and approach to arrive to it. The following paragraphs quote from various literature studies, the different methods used by state transit agencies in achieving project prioritization. For example, considering health benefits as a prioritization aspect. Health impacts are largely compared with other transportation economic impacts that helps in improving transit service quality and supports transit oriented developments. 5.3.2.1 Economic Impact Assessment EIA (source 42, 44) Todd Littman’s report on “Evaluating Transportation Economic Development Impacts,” published August 18, 2010, details on how a transportation policy and planning decisions affect jobs, income and tax revenues. [14] Planning decisions are important in creating economic impacts. The report in general discusses that excessive vehicle travel can reduce productivity. The study is based on how the vehicle travel and operating cost effects on efficient pricing. Though economic impacts could be hard to model, studies from previously modelled projects have been shown to be inaccurate. In the current practice this evaluation is based on exaggerating the economic benefits while overlooking inefficiencies. Those projects that ignore additional cost to consumers, business and governments and increase in the dependency for the public transportation. The report explains on how transportation projects have been evaluated by Victoria Transport Policy Institute. According to the report, the state selection process is based on satisfying the following transportation planning policies questions that are required for rating the projects.
- To make sure if the proposed transportation projects satisfies the demand being provided. - To produce account for all costs involved in the proposed transportation project, which
includes insurance cost, external cost due to congestion, road and parking facility costs, accident and pollution risk imposed on others.
- If equity between high and low value trips being maintained. - Are space efficient modes (buses, vanpools and carpools) given priority under congested
conditions? - Are policies reviewed to minimize unintended biases favouring inefficient modes? - What portion of vehicle travel would decline if transportation planning were more
comprehensive and neutral, and transportation pricing were more efficient? The other way to prioritize a transportation project at the state level was involving alternative mode improvements that could help in economic benefits.
- Traffic congestion reductions. - Road and parking facility cost savings.

20
- Accident reductions. - Consumer cost savings. - Energy conservation and pollution emission reductions. - Improved access to education and employment by disadvantaged people. - Support for more compact land use development and therefore increased accessibility.
Though the above-mentioned ways were not strictly followed by all MPOs for local selection these were some of the preferred economic policy on prioritization of projects for local selection. 5.3.2.2 Land Use and Construction Impact A rating scale on local selection depends on two criteria “abstract” and “concrete” and later filtered to sub-criteria based on the context. The intensity of rating scales depends on the desirable thresholds based on the local priorities and site specific conditions. For TOD the criteria rating is low, moderate and high. These intensities are also determined by paired comparisons. Currently, the evaluation for transportation projects consider very few land use impacts as criteria. Also, the current prioritization lacks individual evaluations on long term indirect impacts that are required for project prioritization like sprawl increase due to roadway expansions that are ignored by the location selection committee. [15] 5.3.2.3 Accessibility: Equity Analysis and Travel Impacts Equity refers to the fairness to reach a destination through various modes required for completing that trip. Also, the distinction between mobility to accessibility has now reached its importance in transportation planning. Accessibility is the analysis that allows the identification of the best transportation to complete a trip. The current practice involves few equity indicators to prioritize projects for local selection such as
● Roadway cost, reflecting the degree of user fee involved by each user, ● Is the fair unbiased. ● The quality of service is equally distributed for all users including paratransit.
Though these practices were referred to be the current practice by Todd Litman in his (Source 44) ‘Comprehensive Transportation Planning Framework’ report, it still lacks to mention on which local MPO follows these methods for its prioritization. [16] 5.3.2.4 Environmental Impact Analysis Environmental Impact analysis has always been one of the key factors in both selection and prioritization of a project at the federal and local level. The prioritization involves evaluating the cost imposed by roads and vehicle traffic like noise, water pollution, waste creation, habitat loss, road kills and aesthetic degradation. Even a small project could be responsible in creating such impacts and tend to become cumulative.
21
In the current practice air pollution, direct land use impacts are some of the key evaluation criteria while indirect impacts like sprawl, noise and water pollutants gets pushed away. Litman, in his “Comprehensive Transportation Planning Framework,” explains that these criteria stand separately than to be viewed in a comprehensive way so that cumulative impacts could be avoided.
5.3.2.5 Social Impact Assessment: Public Safety and Health Impacts This evaluation is not being included in the prioritization but identified by Litman in his study. The report addresses public safety and health to be a part of the key prioritization criteria as these convey the degree of public interest in the project. In current practice, this is evaluated as traffic crash risk per unit of travel (per 100 million vehicle-miles, per billion vehicle-kilometres, or per 100 million vehicles driving through an intersection). [17] But the current practice ignores effect due to change in vehicle travel due to increased mileage. For example, the change in walking and cycling tend to be ignored by the roadway expansions and understate the benefits of such an alternate mode. Litman also explains that planning decisions have to involve health and safety benefits along with the other criteria. This will help determine a better mobility management strategy that would solve problems like traffic, parking congestion and excessive consumer cost and solve the inadequate mobility for non-driving groups. 5.4 PROJECT SELECTION CRITERIA: NEW STARTS PROJECT In a project selection process, the state and the federal government display methods on the eligibility criteria and the process in which a project gets selected to receive New Starts funding.
5.4.1 Federal Level
The project prioritization helps determine the ways in which a project can be put first for receiving FTA’s funding. In those five stages, a New Stats project is continuously evaluated by the FTA on the basis of a variety of selection criteria. Based on these requirements FTA uses two broad selection criteria, project justification and local financial commitment. [18] 5.4.1.1 Project Justification Under this criterion are a set of other factors that are necessary to be satisfied by a New Starts project.
- Mobility Improvements: This uses benefits based on passenger mile and number of transit dependents from the project to the share of transit dependants in the region.
- Environmental Benefits: Air quality designation by the Environmental Protection Act (EPA) in the project area with the rating in those areas to attain a medium rating.

22
- Cost Effectiveness: This is measured based on the cost per hour of travel time saved by using the proposed transportation service. The Transportation System User Benefit (TSUB) details out the process for evaluating the cost effectiveness.
- Operating Efficiencies: This is considered to be part of the cost effectiveness and it’s the sponsor's choice to detail this criterion separately or as a part of the cost effectiveness factor.
- Transit-Supportive Land use and Future Patterns: These are the land use policies and future plans in transit oriented development. The key goal is to make mixed and high density developments in the transportation corridor to maintain ridership and generate new ones.
- Economic Development Efforts: There are different methods explained by the SAFETEA-LU act to quantify and measure the economic benefits of the project.
- Reliability of Forecasts: Includes those requirements that needs to be detailed on the before and after study of the project.
- Other Factors include nature and extent of the transportation problem the project wishes to address and other factors that the project wanted to propose in favour of the case and not captured elsewhere.
5.4.1.2 Local Financial Commitment This includes the acceptable degree of local financing required for the project. The statutory requirement usually states a 20% of local share and is considered higher rating. Without a strong local share commitment, a project is unlikely to receive New Starts funding.
5.4.2 State Level
After looking at much of literature highlight roles in the selection criteria of FTA, the local and regional agencies have also facilitated significant policies at the state level. There are different selection methods adopted by various local planning organizations. A few methods from varied literature sources are discussed below. FTA requires project sponsors to report on measures of transit-supportive land use and economic development. The land use measure considers the transit-supportiveness of existing land use patterns. The economic development measures (considered as part of the land use measure prior to 2009) include transit-supportive land use plans and policies, and performance and impacts of these policies. While specific environmental outcomes related to land use change (such as water quality or habitat preservation) are not assessed, long-term changes to land use and development patterns can have a significant impact on environmental outcomes. Thus, land use and economic development criteria are related to the measurement of environmental benefits.
● 5.4.2.1 Accessibility and Land use: Transit Oriented Developments (TOD) The TCRP report Project J-5, “Legal Aspects of Transit and Intermodal Transportation Programs,” was prepared by John L. Renne, Ph.D., AICP; Keith Bartholomew, J.D.; and

23
Patrick Wontor. James B. McDaniel, TRB Counsel for Legal Research Projects. It outlines the TOD policy for selection of transit project for funding [19]. The TCRP report argues that many states implicitly or explicitly prohibit transit agencies to directly engage in the development activities. In some states these prohibitions are based constitutionally, while other states are made to face barriers by passing legislation. Examples of this type of authorization include the organic acts for the California transit districts, in particular those for the San Jose, Sacramento, Sonoma–Marin, and San Mateo districts, which expressly authorize the agencies to engage in TOD projects. These authorizations typically include a definition of TOD; for example, note this provision from the Sacramento Regional Transit District Act. As used in this section, a “transit-oriented joint development project” means a development project for commercial, residential, or mixed-use purposes that is undertaken in connection with existing, planned, or proposed transit facilities and is located one-fourth mile or less from the exterior boundary of the parcel on which that facility is located. (Examples Discussed in Appendix Pg 33)
● 5.4.2.2 Economic development measure The TCRP report on “Methodology for Determining the Economic Development Impacts of Transit Projects” published in 2012 discusses on the evaluation criteria and different economic evaluation methods used by MPOs [20]. This criterion was developed by FTA in October of 2008 and implies the selection of those projects that are new and stand-alone. Selection criteria for those projects also include if the project is located near stations or in the presence of transit supportive plans and policies like pedestrian mobility or network connectivity, parking designs and building setbacks. The economic climate for these projects are a key documentation that includes a long term metropolitan growth forecasts in the station area or the project corridor. The TCRP report also added few interviews of the MPOS and regional transit agencies staffs and representatives on how the selection process is determined for economic development criteria so that the project could get an overall rating at the FTA’s selection process. The interviews identified that there was a general lack of consensus on how to define economic benefits, beyond the direct employment benefits of project construction and operations. But local decision makers valued the economic benefits of transit projects and wanted them to count towards the New Starts/Small Starts project rating process. Some respondents asserted that economic benefits measures are used by agencies to boost a New Starts/Small Starts project rating when it does not meet cost effectiveness criteria, although others disagree with this assertion. There are many models used by different agencies. Methods considered by few agencies included Travel-Demand forecasting as a part of economic benefit as it helps in converting cost and user benefits to dollars, value of time, regional benefits like housing price, jobs and retail spending and Input-output (I-O) models have been used by some agencies, including New Jersey Transit, as well as the Chicago Transit Authority

24
● 5.4.2.3 Environmental performance measure The 2012 TCRP report on “Assessing Environmental Performance on Major Transit Investments” mentions environmental impacts as one of the key selection factors for New Starts project selection at the local level. This analysis method includes air quality, energy, livability, and land use evaluations as key factors in the selection and evaluation process for transit investments at local level. As discussed in the above sections, along with land use and economic development, the environmental outcomes are also considered in local evaluations of alternatives for New Starts selection. The selection process undergoes the following stages,
- A 20-member panel: This includes representatives from transit agencies, state departments of transportation (DOTs), a regional planning commission, a Department of Urban Planning from a major university, environmental and transportation planning consulting firms, an environmental action organization, the EPA, FTA, and several transportation industry associations including the American Public Transportation Association (APTA), American Association of State Highway and Transportation Officials (AASHTO), and the Community Transportation Association of America (CTAA).
- In the first stage the literature review of recent environmental documents are conducted and current practices in environmental evaluation for transit projects are reviewed. Comments by the stakeholders, including transit industry representatives, are used to of increase the environmental performance.
- At the Second stage alternatives are shortlisted based on the comments received and the alternatives are subjected to further analysis. The alternatives included in the TCRP report are: light rail, diesel and electric commuter rail, and bus rapid transit projects located in a mix of urban and suburban areas. The environmental data collected for each project is analysed and filtered based on “tiers” – highly promising, somewhat promising, and not promising. These comments are finally submitted to the FTA’s selection process.
The TCRP report Project J-5, “Legal Aspects of Transit and Intermodal Transportation Programs,” From California’s Transit Village Development Planning Act of 1994, is one of the earliest TOD policy documents in the U.S. This act helps in directing new developments near the transit station areas in cities and counties that qualify under specific land use and transit operational standards. These districts were considered to be more important due to density which was considered a bonus for the development of the project to meet the federal standards. These qualified areas become eligible for special state funds allocated for transportation improvement projects in village districts. The California Jobs Housing Incentive Grant Program provided $25 million onetime funding to the local governments for construction. New Jersey, arguably the originator of the TOD concept, provided incentives to state grants. The project involved a construction of Llewellyn Park in 1857 along the rail road extension. To qualify, local governments committed to provide a future rail

25
extension line, light rail, ferry, bus transfer station along with future housing and employment opportunities. 5.5 NEW STARTS PROJECT SELECTION AT THE LOCAL LEVEL REVIEW OF PUBLISHED LITERATURE Project selection at the local level has largely been deemed subjective and this section sheds light in understanding the selection process as currently constituted in two metropolitan areas: (1) the Greater Chicago Metropolitan Area and (2) the Memphis Metropolitan Area. The review in this section is based on the Chicago Metropolitan Agency for Planning’s (CMAP) 2040 Long Range Transportation Plan (LRTP) and the capital projects selected as part of it and a case analysis of the Memphis Light Rail Corridor’s project evaluation by University of Memphis.
5.5.1 CMAP’s evaluation
An initial filtering of projects for Full Funding Grant Agreement (FFGA) happened at the MPO level. At CMAP, according to the “GO TO 2040” planning guide, there were specific recommendations made for certain capital projects based on ‘Invest Strategically in Transportation’ criteria. There are various evaluation criteria that help in selection of project.
- Prioritizing investments: Here the region should prioritize efforts in modernizing the existing assets than expanding on the system. This helps in improving the efficiency and effectiveness of the transportation system by spending the resources wisely.
- Finding innovative revenues: This requirement is to generate revenues through more efficient user fees and should be better structure to reflect actual maintenance and operation needs. Though the federal and state gas tax have been a major share in the revenue these are considered short term and a replacement revenue stream has to be explored.
The evaluation by CMAP was based on the performance of a project when placed under regional indicators and planning factors established by USDOT. The evaluation framework was based on the best practices in MPOs from Baltimore, Boston, Los Angeles, Portland, and San Francisco. These places were selected based on various commonalities associated with the geographic areas and the underlying demographics and resulted in the following measures being identified [21]
- Comparative evaluation criteria either as a part of the long-range plan or independent plan. - Multi-modal perspective - Inclusion of land use, community and environmental impacts as a part of evaluation. - A specific process to assess relative merit of proposals to plan goals and objectives.
CMAP made use of the following principles for project evaluation/selection in developing a long-range transportation plan. -
- Linkage to goals, objectives, and policies. - Reconciliation of technical analysis results with participation of the public and local
officials. - Other stakeholders in the planning process.
26
- Relative emphasis on objective, quantitative analysis; Scenario-based versus project evaluation.
- Technical difficulty/data availability. - Modelling capabilities. - Number and types of projects evaluated. - Specific evaluation measures.
These are common to all the best practice examples and serve to address the fundamental purpose of the plan. But the technical evaluations may vary with value-based community preferences and priorities. A major difference in using this best practice method is the evaluation of the entire multi-project scenario versus the individual projects. Also, by making scenarios as a basis for evaluation helps in responding to the concerns about the role of evaluation process in prioritizing projects. After these evaluations, only a small group of projects get selected under “major capital projects.” The project enters fiscally constrained if it does not exceed the funding expectations. It is also required by the project to be evaluated for pollution emissions and must meet air quality budget or pollution emissions limits set by Illinois Environmental Protection Agency (EPA). Once the project meets all these requirements then it is said to be ‘in conformity’. The MPO policy committee then votes to amend GO TO 2040 by adding Byrne Circle Interchange improvements to the plan’s list of fiscally constrained projects.
5.5.2 Memphis Light Rail Corridor’s project evaluation
The light rail line being proposed in Memphis is a 8.2-mile new line from Downtown Memphis to Memphis Airport, via southeast Memphis. Based on the preliminary studies, 30,000 projected daily riders are expected to benefit from this project at a cost of $404 million. The project proposal was “evaluated” using a multi-criteria decision support process that seems to make it a transparent and unbiased effort at reviewing the efficacy of a proposed project.
The Analytic Hierarchy Process (AHP) model used in this article describes a framework of the actual planning process implemented in Memphis by the public transit planning authority. The model is a case-specific mapping of the actual light rail decision making in the city. But more importantly, AHP informs as well as is informed by the decision-making and planning processes in the city. The AHP model for the selection of the top-priority corridor was completed in 2000. The model identified the southeast corridor as the best alternative. The AHP prediction later proved to be true when the southeast corridor was selected by the local transit authority board of commissioners (January 2001) based on the recommendation of the regional rail steering committee. The model was relatively easy to use even in the face of limited or incomplete information. The inductive methodology of AHP is useful in situations where deductive, predictive, or observational techniques (e.g., regression analysis) encounter a limitation in the

27
absence of precedence or with structural transformation, such as with introduction of a new public transit system. Furthermore, it provides flexibility in measurement that is helpful in situations, for example, FTA New Starts program, where multiple criteria with certain desirable thresholds of intensity must be considered strategically and adaptively responsive to local priorities and site-specific-conditions. [22] The FY 2003 annual report on New Starts project status is as follows: 25 projects have full-funding grant agreements (FFGAs); 11, in final design; 39, in preliminary engineering; and 142, additional studies and projects authorized in TEA-21 in the early planning stages or alternatives analysis. As the competition for funds increases, project sponsors have increased local matching capital funds to 50%t, instead of the past norm of a 20% local match with 80% from the FTA. The funding split for road and highway funds is still 80% federal and 20%local, provided the 20-year long-range transportation plan meets air quality guidelines (FTA 2002). This project was intended to facilitate efficient decision making at the local level while the project competes nationally at the federal level. The local authority initially gave importance to the FTA’s New Starts criteria. But to deal with this uncertainty, a sensitivity analysis was performed by the local agency to determine the possible effects of weighing FTA criteria differently. The scenarios helped in examining the varying importance of the criteria on ranking of corridors. Later this relative importance changed to a scenario reflecting the increased weightage given to TOD-based on the dynamic sensitivity analysis. The impact of the increased priority of TOD on the rest of the criteria and the rank order of alternatives are as follows:
● Mobility to jobs (3.0% to 0.6%) ● Mobility of public (0.4%) ● Mobility of low-income residents (.4% to .5%) ● TOD (.8% to 9.6%) ● Operating costs (6.0%) ● Capital construction costs (0.8% to 6.4%) ● Use of shared rights-of-way (9.9% to 3.8%) ● Traffic congestion (9.8% to 7.6%) ● Impact on sensitive areas (8.8% to 4.0%)
From both the above evaluation examples, we understand that the local evaluation process does not follow a uniformity despite the freedom given for the preference in percentage weightage in each evaluation criteria. The difference found from the above analysis process explains that each MPO followed the evaluation of its projects on a scenario according to their own needs. This also underscores the random nature of evaluation criteria that are used as well as the weights assigned for different criteria (from one region to another). In the absence of a uniform directive, the different approaches makes transferability a difficult proposition to achieve.

28
5.6 INTERVIEWS OF MPOS - New Starts Ranking at the Local Level
5.6.1 Interviews
The Urban Transportation Center at UIC conducted a series of interviews with different MPOs to understand the New Starts project selection on how transit capital projects are vetted, prioritized and forwarded for inclusion in the Long Range Plan for the region and on to the Federal Government as a regionally supported project. These interviews were either phone calls or personal interviews and were based on a semi-structured interview format with questions that were common for all MPOs. The MPO/agencies selected for interviewing were Florida DOT, Denver Regional Transportation District (RTD), Los Angeles County Metropolitan Transportation Authority (LACMTA or “Metro”), Metropolitan Washington Council of Governments (MWCOG), Oakland Metropolitan Transportation Commission (MTC), Puget Sound Regional Council (PSRC) and Riverside County Transportation Commission (RCTC). The officials from the respective MPOs were given a questionnaire that contained the following set of questions. Semi-Structured Interview Questions
1. Verification of pending projects for New Starts funding from the FTA table. 2. Is there any new project added apart from the FTA’s list? 3. Is there a process followed by the MPO for project prioritization? If so, what funding
program(s) doe this apply to? 4. Describing the process for prioritization and selection for New Starts project. 5. Explain the key players in this selection and prioritization process like transit agencies,
state DOTs and others. Explain their role. From which of these players does the project idea evolve?
6. Whose support or endorsement must be obtained before moving forward with an application to FTA – politicians, business community, advocacy groups, others?
7. Do you have any recently completed – or projects underway – that can exemplify how the process works in your region?
8. Why was that project given the green light versus others in the long-range plan? 9. Would you describe it as an objective, subjective, or hybrid process? Any decision-making
heuristics or formulas used? If there were objective measures, any examples you could share?
10. Has MAP-21 changed the way your agency handles the project prioritization or selection process?

29
5.6.2 Summary of Interviews
5.6.2.1 Riverside County Transportation Commission (RCTC)
● Interviewee: Deputy Executive Director. ● Decision Making: County Transportation Commission (CTCs) are the primary decision
makers in the Southern California Association of Governments. ● Projects: RCTC is in the middle of construction of a Small Starts Project, commuter rail
extension. This was published by FTA as a Small Starts as its a 22-mile corridor with a five station extension and there was no project that was competitive in New Starts and is the only New Starts-type project. RCTC worked with its four major cities and the county on the Small Starts application. Also, dealt with state of California, specifically for environmental requirements (CEQA).
● Selection: The County voters approved a sales tax referendum in 1988 which lasted for 20 years and another one in 2002 that extended for 30 years. This was its primary funding stream (half a cent sales tax). The project selection process started more subjectively. This included considering the suggestions from everyone but the final decision was based on numbers for all project and performance standards for freight project selection that would fit the project to federal funding requirements. A strategic assessment is performed during the evaluation process of transportation projects. The RCTC’s strategic assessment document helps in understanding the process the projects are evaluated and selected for New Starts. [23] A visual representation of this process is explained in the appendix Figure 2A. The strategic outreach process gathers public input on long-range transportation priorities throughout the County. This process involves a number of methodologies like, public meetings and online and traditional phone surveys. The assessment also takes into consideration of the transportation plans and priorities of stakeholders within the County, which includes local governments, private sector groups, and social service providers.
5.6.2.2 Puget Sound Regional Council (PSRC)
● Interviewee: Program Manager ● Decision Making: The project sponsors decide the funding initiative (New Starts funding)
and PSRC may help provide data or verify if it meets the regional long-range goals. PSCR is good at handling the performance metrics and actively coordinate with the state. Performance measures will play more of a role in the upcoming plan process.
● Projects: There were no New Starts in the PSRC planning process. ● Selection: Transit projects are generally incorporated into the region’s long range plan from
the 80 jurisdictions within the region. Initially the candidate projects are submitted to PSRC. The Council makes a determination if they are above or below a certain threshold. Projects get approved by PSRC Board and evaluated based on air quality or other metrics. By the time the PSCR evaluation gets completed the projects are far enough in the process that environmental review is complete and there is a line-item financial plan. The PSRC

30
Transportation 2040 groups investments into four categories: State of Good Repair, System Expansion, Programmatic Investments, and Local Projects. The Prioritization evaluation framework was applied to the first three investment categories, but not to Local Projects, since these investments are developed through local comprehensive planning processes and reflect local priorities. The total investment in the Fiscally Constrained portion of T2040 of PSRC is $173 Billion. The Transportation 2040 Investment Categories (fiscally constrained) includes the following sections to prioritize funding. [24]
- Regional System Expansion ($65 Billion): This includes investments in highways, arterials, transit, and bicycle/pedestrian facilities. This category also includes investments in existing and future transit capital as well as auto ferry capital costs. - Local Projects ($20 Billion): This category includes investments in local transit, streets, and arterials as identified in local comprehensive plans. - Programmatic ($7 Billion): This category includes investments in demand management, intelligent transportation systems, traffic operations, and passenger ferries. - State of Good Repair ($81 Billion): Includes estimation of state, local government, and transit agency investment in preservation, maintenance, and operation. This category also includes existing and future transit service cost.
5.6.2.3 Oakland Metropolitan Transportation Commission (MTC)
● Interviewee: Director of Programming and Allocations ● Decision Making: The decision-making process in the MPO depends on the political
support for the project. MTC works with counties, congestion management agencies, cities, transit operators. The plan that the Bay Area adopted in July 2013 saw a significant switch in its evaluation process. The New Starts and Small Starts funding reserve was created based on region’s historical precedent and requirement. But MTC was not comfortable assigning the dollars to a specific project.
● Project: BART to San Francisco was top priority, then San Francisco Muni Central Subway. MTC developed its own performance standards even before MAP-21 and made sure their evaluation standards fit with the federal standards.
● Selection: MTC is a Bay-area MPO with nine counties and27 transit operators. In the late 1990s, a regional agreement called the Resolution 3434 was adopted by the MPO. On July of 2013, a significant switch in selection process was made. The MTC staff performed a quantitative assessment on the 900 projects that were submitted. The evaluation was based on the travel mode for the first 200 projects and by groups and type for the remaining 700 projects. The benefit cost analysis was performed on all the 900 projects. And the end result of the analysis was based on high, medium and low performers. The MTC included some low performers if they met other goals like equity, accessibility and environmentally effective standards. while other projects made into the plan through a ”compelling case argument,” where the sponsors revised the scope to make compelling cases. If the change

31
still did not match the goal then project was withdrawn. The Bay area also identified two next generation New Starts projects, Downtown San Francisco Transit Centre and Phase II of BART to Silicon Valley. Knowing the MTC’s decision regarding the funding allocation of dollars for specific projects, s these two projects still made it into the funding pool. These two projects were not keen on the New Starts funding but wanted to get into the MTC advocacy pipeline. The MTC analysed the projects based on TOD potential, ridership, how it supports the development of the urban core and greenhouse gas emission goals that fit the plan
5.6.2.4 Metropolitan Washington Council of Governments (MWCOG)
● Interviewee: Department of Transportation Planning ● Decision Making: Due to the lack of consent with the political side, the MWCOG
recommended to have a discussion with San Francisco MTC to understand their travel demand model which ran through several scenarios. MWCOG is a tri-state agency and each jurisdiction is weighted equally. Very little has been done till date in terms of prioritization or ranking of projects as they claim it was not feasible in political terms. Understanding from WMATA, it was observed that the MPO does a scenario analysis called the Momentum Strategic Plan. Through this analysis WMATA recently analysed 25 different transit extension projects and prioritised those to the top that were more fiscally feasible. The decision for prioritization were made based on ridership, operations, impacts on existing system, land use change. Currently, WMATA’s top priority is on expanding capacity in the urban core through underground tunnels. It has proposed a $12.20 billion-dollar expenditure for executing this plan.
● Project: Current project includes the Dulles Rail and Maryland Purple Line. Possible future projects include the H Street Streetcar, and the Arlington Streetcar (rejected earlier from Small Starts; project has since grown). All the New Starts projects are advanced at the state level.
● Selection: A performance evaluation was ran into a political resistance during the evaluation of top eight projects in Seattle. Virginia is historically oriented towards highway and Maryland towards Transit. The MPO is more focussed in its air quality programs and perform scenarios in terms of greenhouse gas emissions analysis. They do not believe in visioning exercise while evaluating for New Starts. After the implementation of MAP-21 the transit safety and asset management were given more importance. Only 9% of all the money from long-range plan had been slated for expansion; the remaining 91% was used for operations and maintenance. Congestion analysis is one of the key assessment in MWCOG for highways. According to the interviewee if the next federal reauthorization puts money behind performance standards based on congestion reduction, the transit the state prioritization might favor more for transit projects.
32
5.6.2.5 Los Angeles County Metropolitan Transportation Authority (LACMTA or “Metro”) ● Interviewee: Program Management Department Head ● Decision Making: The LACMTA decided to take an aggressive step towards competing
for the New Starts funding as it after witnessing New York’s multiple New Starts grant at once. According to LACMTA, the best fit project with a early planning for New Starts funding would definitely reach the federal FFGA. For example, the Red Line was built with New Starts funds and therefore its expansion was always planned on the basis of New Starts and was embedded in the development of the entire project. The metro planning team estimates annual New Starts funds based on its historical precedent.
● Project: The Purple Line ($12 billion) and the Regional Connector ($670 Million) were recently awarded FFGAs.
● Selection: The project selection is a combination of funding assumptions and cost benefit analysis. The metro has three main teams to do the selection: The financial programming team, environmental planning team and the project delivery team. The selection is done by the financial team first assessing the funding sources and working closely with the environmental team who put these funds together. The project delivery team identifies the best suitable project in terms of engineering and construction. The level of subjectivity in this selection varies from each project or depends on the annual selection methods framed. The MPO must pay attention to the political delegation if the project is under the federal, state or local control. The MPO must also be familiar with the federal workers involved in the New Starts program as a great deal of judgement and experiences come under the selection process. The agencies that are involved in the projects should be comfortable with the program so that it increases the success ratio for receiving New Starts funding.
5.6.2.6 Denver Regional Transportation District (RTD)
● Interviewee: Senior Transportation Planner ● Decision Making: The financial plan was a part of the FasTracks 2004 ballot initiative. The
application for New Starts for East Rail extension was already in process. The RTD was under the decision-making phase of determining which corridors would be most successful after the FasTracks was passed. It was the only agency to take up the FTA’s Public Private Partnership (PPP) successfully.
● Project: East Rail line was at the top; the Gold Line commuter corridor also performed well.
● Selection: The East Rail line was selected based on ridership for the horizon year. Also, Denver, with its current performance metrics, was facing constraint in its selection process. One of the main difference in the RTD’s project selection due to the changes in the FTA’s rule was, cost benefit analysis was no longer tied primarily to user benefits and was just included as an option. The North Metro and Northwest Rail was unsuccessful due to low benefits and high cost. After receiving the funding for the Eagle, they performed a study

33
for applying for the New Starts program. The southeast extension performed well under old rules but RTD could not do the same for the whole project. Land-use was based on the DRCOG’s long range model. RTD was one of the few agencies that had its own travel demand model. According to RTD, it find the MAP-21 performance measure program unclear. RTD makes a monthly call and a quarterly meeting with the FTA. FasTracks is poised to comply and already has quality of life tracking in the works and not to give more than what FTA requires.
5.6.2.7 Florida Department of Transportation (FDOT)
● Interviewee: FDOT ● Decision Making: Florida has been a donor state pertaining to the gas tax contribution to
the HTP compared to the revenues it received. The return on HTF on transit improvement was lesser to the return on HTF for highways. During the year 2003-2004 the FDOT developed a program that helped in supporting the process for competing for FTA. A couple of years later 10% of these were dedicated to New Starts and was used in the project development stage.
● Project: Sunrail Jackson BRT streetcar. ● Selection: There were several New Starts proposals in the 5-year plan with an uncommitted
funds of $280 million for the projects. FDOT is in the process of making an implementation process for fixed guideway projects. Document stamp collection funded up to $70 million a year at its peak but currently it funds approximately $37 to $40 million. The MPO does the prioritization and makes up to 25% of the local match. The selection process by FDOT includes four key processes.
- Working with local agencies - Public participation - Environmental impact analysis - ROI - Return on Investment
Although, there were selection process framed by FDOT, they lacked in the quantitative approach. The New Starts allocation rate of return increased from 12.87% (2008) to 44.7% (2012). The ridership increment percentage rate was 3% every year with 12.87; 42.18; 42.27; 44.17. Being the third largest populous state with 80% population concentrated in the city, FDOT’s ridership goal is to achieve 2 times the population growth.
These are just a handful of the MPOs selected and interviewed based on whether the jurisdiction has a multiple transit system or more than one New Starts request at the local or the federal level. Also, from the interviews we see that each MPO has framed a process for the selection of New Starts project, yet, there is lack of uniformity between the MPO. The selection process involving cost effectiveness, environmental impacts and benefit cost analysis based on ridership is found to be similar with MPOs located in Florida, Denver, Washington and Oakland MTC. Though there are some commonality found in the selection process between these MPOs, in large each process

34
itself lacks transparency. The reason behind this report is to identify the transparent process from the MPO’s side for the New Starts project selection. Unfortunately, it is seen from the above literature and the case analysis that the selection and prioritization process is unclear and not uniform at the local level. Hence, it is necessary to identify the steps that can be carried out at the local level 5.7 RECOMMENDATIONS From the study interviews and academic sources, we understand that the selection and prioritization process at the local MPO level is inconsistent. Also, the goal of this report is to identify the best practices from the study and present recommendation methods for a better and transparent process. Before evaluating the recommendations, it is necessary to list out and review the barriers in the valuation methodologies, which is the key evaluation aspect of New Starts program.
● Issues and barriers within valuation methodologies - Balancing between valuation process and prohibitive user experience. - Unsatisfactory capture of alternative benefits - Long development and evaluation time frame - Lack of consideration for alternative funding mechanisms
● Suggestion on alternate evaluation methodologies and best practices from the study are, - Data Envelopment Analysis - Principal Component Analysis - Cost Benefit Analysis
Since the inception of the New Starts program, the program has been cited and referenced as a model for other federal transportation programs, however several major challenges within the program have been identified. The report discusses three main issues with the New Start program: frequent changes causing confusion and delays within projects, evaluation process measures are not accountable for all project benefits, and identifying the appropriate balance between sufficient evaluation and minimizing complexity is difficult to successfully define. Key recommendations include: Applicability of valuation methodologies across all states. Under this valuation are the three main methods.
● Tailor the New Starts evaluation process to risks posed by the projects. ● Consider greater use of letters of intent. ● Early systems work agreements and establishing consistent project schedules that are
comprehensive to all projects across the country.

35
5.7.1 Timeline Evaluation
As the New Starts programs continues to develop, it is vital for officials and policy makers to have access to milestone data on past projects proposals and existing conditions. Being more aware of this issue, the FTA has recently taken steps to obtain this data and the GAO attempts to evaluate and examine the storage and effectiveness of the data that is retained for future transportation projects. The report researches the typical timetable for proposed New Starts project, finding that the this can greatly vary between projects and that frequent policy and guidance changes to the New Starts program can result in additional costs and delays as project sponsors are required to redo analyses to reflect the changes; it is important that the length of project development within New Starts program does not serve as a deterrent as more communities turn to transit to solve their mobility issues. The GAO additionally explored alternative options which would potentially expedite the New Starts process, recommending a greater use of Letters of Intent within the Early Systems Work Agreement, establishing consistent Use Project Development Tools, and revising the Internal Review Process to make the process faster and easier for the parties involved. In order to more effectively fund and construct regional transit projects, CMAP emphasizes the importance of policy and investment coordination between transit agencies, state DOTs and MPOs. Currently, IDOT’s main evaluation criteria focuses on the physical condition of the system. The DOT’s documentation does not specify exactly how these measures are used to evaluate or prioritize projects, and relevant stakeholders, such as MPOs are not a part of the decision-making process. The study looked into a number of case studies throughout the country and found that all peer agencies illustrate transparency both in their use of performance data and reported extensive data sharing among DOT and MPO, with a clear, defensible rationale to the public as to why a given project was or was not selected. Two particular features the study suggested were to establish a two-year programming cycle in order to complete a rigorous performance-based programming process and to factor in other elements prior to determining whether a project will or will not be funded, such as project readiness and federal funding restrictions. Overall, it was concluded that there was an opportunity to learn from these alternative methodologies to produce a more efficient funding prioritization strategy.
5.7.2 Economic Impact Analysis based on VMT and Other Criteria
This study walks through the process of designing, conducting environmental assessment, bidding, funding/financing, and constructing a new rail transit system in the United States. (Essentially a step-by- step of New Starts.) It identifies points in the process and reasons why costs escalate dramatically compared to projects decades ago. The EIA with VMT describes how public opinion/opposition can slow a project and add costs, as well as inconsistent or ineffective political leadership. The author identifies light rail contemporary projects in Salt Lake City and Denver li where the per-mile cost is significantly lower than projects in North Carolina and Virginia.

36
5.7.3 Performance based funding movement
For receiving most of the federal transportation funding, agencies must engage in a performance measuring method that measures up to the standards established by Congress and monitored by USDOT and FTA. The report aims to provide guidance on selecting performance measures appropriate to a particular project without prescribing set measures and analyzing various evaluation methods through the following:
● Performance measurement ● Peer comparison ● Benchmarking
Through this process, a standardized peer-selection process is framed. This would incorporate the following objectives into the process: administrative, operative, planning and public and market focus. The final result would emphasize an overall effectiveness and benchmarking in measuring the feasibility and progress of transportation projects. 6.0 CONCLUSION The report focuses on studying the current state of practice and understand the theory on how project sponsors evaluate and prioritize transit capital projects, specific to the Federal Transit Administration’s (FTA) New Starts program. The report helps us initially to understanding the New Starts program and its evolution over the course of time since its inception, selection process and prioritization of projects at federal and State level as well as the pros and cons of the various approaches that have been used across the country and over time. Though the FTA has come up with a selection process for the project to enter New Starts funding, the selection/prioritization process at the local level seems to lack uniformity from region to region and across time points. The local level understanding has been the key focus of this report. From the interviews and the literature study, it has been identified that there is no explanation detailed for this local selection process and uniformity at the MPO level. The study interviews explain that some of the MPOs are still unclear with the FTA’s rule and their own selection process and as a result end up in a seemingly arbitrary and non-transparent selection process. The report identifies these gaps and builds recommendations on how to create a uniform method for fair selection process for the local MPOs. These recommendations are built from the best practices studies from the literature and the through interviews. These recommendation methods not only help in streamlining the local selection process and building uniformity but also helps in creating a transparent and healthy government.

37
This report also documents that there is no uniformity followed at the local level during the selection process. While some of the MPOs do not even seem to follow a structure for selection of projects, there are other MPO’s that do have a structure for selection process.
7.0 LIST OF TABLES Table 1A- A table representing number of New Starts projects evaluated under the reauthorization bill for each Fiscal Year. Page 12 8.0 REFERENCES [1] Members & Committees of Congress. (2016, June 20). Public Transportation Capital Investment Grant (New Starts) Program: Background and Issues for Congress. Retrieved from https://www.everycrsreport.com, Page 1-3 [2] Members & Commitees of Congress. (2016, June 20). Public Transportation Capital Investment Grant (New Starts) Program: Background and Issues for Congress. Retrieved from https://www.everycrsreport.com, Page 15 [3] Members & Commitees of Congress. (2016, June 20). Public Transportation Capital Investment Grant (New Starts) Program: Background and Issues for Congress. Retrieved from https://www.everycrsreport.com, Page 16 [4] Members & Committees of Congress. (2016, June 20). Public Transportation Capital Investment Grant (New Starts) Program: Background and Issues for Congress. Retrieved from https://www.everycrsreport.com, Page 16 [5] Members & Committees of Congress. (2016, June 20). Public Transportation Capital Investment Grant (New Starts) Program: Background and Issues for Congress. Retrieved from https://www.everycrsreport.com Page 17 [6] Members & Committees of Congress. (2016, June 20). Public Transportation Capital Investment Grant (New Starts) Program: Background and Issues for Congress. Retrieved from https://www.everycrsreport.com, Page 17 [7] Members & Committees of Congress. (2016, June 20). Public Transportation Capital Investment Grant (New Starts) Program: Background and Issues for Congress. Retrieved from https://www.everycrsreport.com, Page 18 [8] Members & Committees of Congress. (2016, June 20). Public Transportation Capital Investment Grant (New Starts) Program: Background and Issues for Congress. Retrieved from https://www.everycrsreport.com, Page 18 [9] North Central. (January 20). North Central Pennsylvania Project Prioritization Process & Scoring Methodology. Retrieved from http://www.ncentral.com/wp-content/uploads/2013/08/Final-Chapter-6-0.pdf, Page 14-19
38
[10] Greg S. Griffin, State Auditor Leslie McGuire, Director . (2016, December). Georgia Department of Audits and Accounts Performance Audit Division . Retrieved from https://www.southernenvironment.org/uploads/words_docs/16-17_Transportation_Project_Selection_and_Prioritization_Final-2.pdf, Page 13-15 [11] Government Accountability Office, (n.d.). Retrieved from http://www.gao.gov [12] Daniel Duff, Edward J. Gill, Jr., and G. Kent Woodman, Thompson Coburn LLP. James B. McDaniel, TRB Counsel, Legal Research Digest 30, (2010), TCRP project j-5 “Legal Aspects of Transit and Intermodal Transportation Programs,” Page 10-21 [13] Daniel Duff, Edward J. Gill, Jr., and G. Kent Woodman, Thompson Coburn LLP. James B. McDaniel, TRB Counsel, Legal Research Digest 30, (2010), TCRP project j-5 “Legal Aspects of Transit and Intermodal Transportation Programs,” Page 20-30 [14] Todd Litman. (2010, August 18). Evaluating Transportation Economic Development Impacts. Page 22, 25, 45. [15] Todd Litman and Rowan Steele. (2012, December 27). Comprehensive Transport Planning Framework. Page 3-27 [16] Todd Litman and Rowan Steele. (2012, December 27). Comprehensive Transport Planning Framework. Page 33, 39 [17] Todd Litman and Rowan Steele. (2012, December 27). Comprehensive Transport Planning Framework. Page 45,51 [18] Transit Cooperative Research Program Sponsored by the Federal Transit Administration. (2010, February). Legal Research Digest 30. Page 6-10 [19] Transit Cooperative Research Program Sponsored by the Federal Transit Administration. (2011, August). Legal Research Digest 36. Page 20 [20] Transit Cooperative Research Program Sponsored by the Federal Transit Administration. (2012). “Methodology for Determining the Economic Development Impacts of Transit Projects”. Page 20 [21] CMAP. (2009, March). Development of Evaluation Measures for Major Capital Projects. From http://www.cmap.illinois.gov/documents/10180/31056/BestPracticesEvaluationMeasures3-10.pdf/42b66458-d23b-44cf-ad08-790777db3f7f. Page 4-14 [22] Reza Banai, University of Memphis. (2006). Public Transportation Decision-Making: A Case Analysis of the Memphis Light Rail Corridor and Route Selection with Analytic Hierarchy Process1. From (https://www.nctr.usf.edu/jpt/pdf/JPT%209-2%20Banai.pdf) [23] Budget and Implementation Committee Aaron Hake, Government Relations Manage. (2015, May 13). RIVERSIDE COUNTY TRANSPORTATION COMMISSION . From http://www.rctcdev.info/onthemove/pdfs/10.AH.RCTC.Strategic%20Assessment%20Contract%20Award.pdf [24] Puget Sound Regional Council. (2014, May 29). Transportation 2040 Update .