Embed Size (px)
Citation preview
Randomized, Controlled Trial ofInsulin for Acute Poststroke
HyperglycemiaMichael McCormick, MD,1 Donald Hadley, PhD,2
John R. McLean, PhD,3 Jennifer A. Macfarlane, PhD,3
Barrie Condon, PhD,1 and Keith W. Muir, MD1
Objective: Poststroke hyperglycemia is common and is associated with increased risk of death and dependence,but appropriate management remains uncertain. Glucose potassium insulin (GKI) infusion did not benefit patientswith moderate poststroke hyperglycemia in a recent trial. Using magnetic resonance imaging (MRI), previousstudies identified a relationship between recruitment of ischemic tissue to the final infarct and hyperglycemia,possibly mediated by brain lactic acidosis.Methods: We undertook a randomized, placebo-controlled trial of GKI infusion in patients with blood glucose�126mg/dl (7mmol/l) within 24 hours of ischemic stroke. The primary endpoint was infarct growth on MRI be-tween baseline and day 7. Brain lactate concentrations were measured with magnetic resonance spectroscopy.Results: Forty patients were randomized, 15 to saline and 25 to GKI infusions of different durations. Capillaryblood glucose concentrations were lowered significantly from 6 to 12 hours after GKI initiation. There was nosignificant difference on any measure of infarct growth between the GKI and saline groups. In a secondary analysis,GKI was associated with significantly greater infarct growth in patients with complete intracranial vessel occlusioncompared with controls (p � 0.011 for group–vessel status interaction). Brain lactate levels increased in controlsubjects, but were significantly lower with GKI infusion. Predominantly asymptomatic hypoglycemia occurred in76% of GKI-treated subjects.Interpretation: GKI infusion within 24 hours of stroke lowered blood glucose and attenuated an increase in brainlactate, but did not affect cerebral infarct growth. Exploratory analysis found that GKI infusion was associated withgreater infarct growth in patients with persistent arterial occlusion, and with a high incidence of asymptomatichypoglycemia.
ANN NEUROL 2010;67:570–578
Hyperglycemia occurs in up to 60% of acute strokepatients and is an independent risk factor for poor
outcome.1 Possible mechanisms include reduced salvageof the ischemic penumbra (causing greater infarctgrowth),2 mediated by lactic acidosis in anaerobically me-tabolizing ischemic brain tissue,3 and also a higher risk ofhemorrhagic transformation following intravenous (IV)thrombolysis.4,5 Although guidelines recommend bloodglucose monitoring and intervention for hyperglycemia,evidence on management is limited,6 and practice varieswidely.7 In the only large clinical trial, the Glucose Insu-
lin in Stroke Trial (GIST-UK),8 24-hour glucose potas-sium insulin (GKI) infusion in patients with moderatehyperglycemia (108–306mg/dl [6.0–17.0mmol/l]) didnot improve outcome. However, interpretation ofGIST-UK is compromised by under-recruitment (only 1⁄3of its planned sample size), late treatment initiation (mean13 hours after onset), and only marginal reduction ofblood glucose (10mg/dl [0.57mmol/l] compared withcontrol).
Magnetic resonance imaging (MRI) offers a poten-tial biomarker for treatment effects in acute stroke with
Published online in Wiley InterScience (www.interscience.wiley.com). DOI: 10.1002/ana.21983
Received Sep 14, 2009, and in revised form Dec 30. Accepted for publication Jan 8, 2010.
Address correspondence to Prof Muir, Institute of Neurological Sciences, Southern General Hospital, Glasgow G51 4TF, Scotland, UK.E-mail: [email protected]
From the 1Division of Clinical Neurosciences, University of Glasgow; and 2Department of Neuroradiology and 3Department of Clinical Physics,Institute of Neurological Sciences, Southern General Hospital, Glasgow, Scotland, UK.
Additional Supporting Information may be found in the online version of this article.
ORIGINAL ARTICLE
570 © 2010 American Neurological Association
modest sample sizes, and previous investigations in post-stroke hyperglycemia2,3 indicated potential surrogatemarkers related to specific mechanisms. We undertook arandomized, placebo-controlled trial (Spectroscopic Eval-uation of Lesion Evolution in Stroke: Trial of Insulin forAcute Lacticacidosis [SELESTIAL]; registered at www.clinicaltrials.gov [NCT00124826]) to determine the ef-fects of insulin on infarct growth and brain lactate inacute ischemic stroke patients, and additionally used pro-ton magnetic resonance spectroscopy (1H-MRS) to mea-sure brain lactate concentrations.
Subjects and MethodsThe trial protocol was approved by the Multicentre ResearchEthics Committee for Scotland (04/MRE00/31). All patientsgave informed consent or were recruited through assent by rel-atives.
PatientsPatients older than 18 years with acute hemispheric stroke �24hours after onset (onset defined as the time last known to bewell) and capillary blood glucose �126mg/dl (7.0mmol/l), irre-spective of prior diagnosis of diabetes, were prospectively re-cruited at an academic acute stroke service. Patients were ex-cluded if they were MRI incompatible (eg, had pacemakers) orhad intracerebral hemorrhage. Routine clinical management in-cluded brain imaging and IV thrombolysis with alteplase whenindicated.
RandomizationPatients were randomized to GKI infusion or placebo (0.9% sa-line) by means of computer-generated random assignment inconsecutively numbered sealed, opaque envelopes. In a pilotphase (first 10 subjects), treatment allocation was 1:1 placebo:GKI for 48 hours; in the main phase, allocation was in a 1:1:1ratio of placebo:24-hour duration GKI infusion:72-hour GKIinfusion.
Clinical AssessmentStroke severity was determined by the National Institutes ofHealth Stroke Scale (NIHSS)9 on days 1, 3, and 7 to coincidewith MRI scans. Strokes were categorized using the OxfordshireCommunity Stroke Project system.10 Functional outcome wasby the modified Rankin Scale (mRS) structured interview11,12 at1 month. All clinical assessments were undertaken by a singleobserver who was not blinded to treatment allocation.
InfusionPlacebo consisted of 0.9% normal saline. The GKI infusionconsisted of 500ml 10% dextrose, 20mmol potassium chloride,and 16 units of soluble recombinant human insulin. Infusionbags ran at 100ml/hr. For patients randomized to GKI for 24hours, normal saline was given for the subsequent 48 hours. Thedose of insulin was titrated to maintain capillary blood glucose
72–126mg/dl (4–7mmol/l) by adjusting the insulin dose inGKI infusion solution (as per GIST-UK protocol, reproduced inthe Supplementary Fig). Capillary blood glucose was recordedevery 4 hours in the placebo group, and in the GKI groups,hourly until euglycemia was achieved and thereafter every 2hours for the duration of GKI infusion. In the event of symp-tomatic hypoglycemia (capillary blood glucose �72mg/dl[4.0mmol/l]) or asymptomatic hypoglycemia persisting for 30minutes, 10ml of 50% dextrose was administered. Blood pres-sure and heart rate were recorded every 4 hours.
Blood glucose, glycosylated hemoglobin (HbA1c) concen-tration, and electrolytes were measured pretreatment, and glu-cose and electrolyte measurements were repeated at 24 and 48hours.
MRI ProtocolSubjects underwent MRI at 3 time points: day 1 (�24 hoursfrom onset), day 3 (�1) and day 7 (�2). All scans were ob-tained using a 1.5-Tesla scanner with an 8-channel head coil(Signa NVi, using Excite 11.0 software, General Electric, Fair-field, CT). Sequences acquired included diffusion-weighted im-aging (DWI), T2-weighted fluid attenuated inversion recovery(FLAIR), gradient echo, 3-dimensional time of flight magneticresonance angiography (MRA) of the circle of Willis, and axialPROton Brain Examine (PROBE) single-voxel 1H-MRS cen-tered in the diffusion lesion. A multislice, single-shot, spin-echoecho-planar imaging sequence was used for DWI. Slice thicknesswas 5mm with a 1.5mm gap, with 24 slices set to include thewhole brain. Matrix size was 128 � 128, field of view was26cm � 20.8cm, repetition time (RT) was 8,000 milliseconds,echo time (TE) was 70.9 milliseconds, number of excitations(NEX) was 4, and b values were 1,000 seconds/mm2 and 0 sec-onds/mm2.
For postprocessing, all scans were deidentified by an in-dependent physicist blinded to clinical data (including treatmentallocation) and presented in random order to the researcher re-sponsible for lesion volume measurement. Lesion volumes inmilliliters were measured using semiautomated software(Cheshire, Perceptive Informatics, USA). Lesions were initiallyidentified by visual inspection, and initial semiautomated seg-mentation was followed by editing of the region of interest. Day7 FLAIR was measured with reference to day 1 DWI, to differ-entiate acute from chronic lesions. Time of flight MRA was clas-sified by an experienced neuroradiologist blinded to clinical datausing the Arterial Occlusive Lesion (AOL) classification13 (AOL0 � no recanalization of the primary occlusion; AOL 1 � in-complete or partial recanalization of the primary occlusion withno distal flow; AOL 2 � incomplete or partial recanalization ofthe primary occlusion with distal flow; AOL 3 � complete re-canalization of the primary occlusion with distal flow).
SpectroscopyA single voxel was placed within the largest visible DWI lesionfor 1H-MRS. Voxel size was 2 � 2 � 2cm, but was reduced forsmall DWI lesions. MRS parameters were TR � 1,500 milli-seconds, TE � 144 milliseconds, NEX � 256. Global au-
McCormick et al: Insulin in Acute Stroke
May, 2010 571

toshimming was performed. Voxel placement on follow-up scanswas informed by reference to initial MRS imaging. MRS datawere processed using LCModel software.14 Concentrations oflactate, n-acetyl aspartate, and creatine were determined and ex-pressed as values relative to the creatine peak. In vivo spectrawere analyzed as a linear combination of a basis set of completemodel spectra of individual metabolite solutions in vitro. Datawere analyzed over the 4.0 to 1.0ppm window of chemicalshifts.
Statistical AnalysisThe study sample size was calculated using assumptions derivedfrom the study of Parsons et al.3 A 57% relative reduction in theproportion of patients exhibiting lesion volume expansion be-tween baseline and day 7 (from 70 to 30%) would be detectedwith 80% power (2p � 0.05) with 15 subjects per group.
Continuous data were compared by unpaired t tests ifnormally distributed, otherwise by Mann–Whitney U tests, andcategorical variables by chi-square tests. Infarct growth was con-sidered as absolute growth in milliliters by subtracting day 1DWI volume from day 7 FLAIR volume, and was also expressedas a percentage of initial DWI volume, and as a categorical vari-able using a 20% increase in volume. Blood glucose and bloodpressure were assessed by repeated measures analysis of variance
(ANOVA), and between-groups effects were tested using pre-treatment values as covariates. Vessel patency and treatmentgroup effects on infarct growth were analyzed by 2-wayANOVA using a general linear model. Results were consideredstatistically significant for p � 0.05. SPSS version 15.0 (SPSSInc., Chicago, Ill) was used.
ResultsBetween December 2003 and January 2006, 40 subjectswere randomized (10 pilot phase, 30 main phase; patientdisposition is shown in Fig 1). All GKI regimes weregrouped together and compared to control in main anal-yses. Thirty-seven patients had MRI scans performed atall time points, 2 patients had only day 1 MRI (1 wors-ened clinically and 1 refused further imaging), and 1 pa-tient had a follow-up scan at day 7 but not at day 3.
Of the 40 patients, 12 (30%) had a preadmissiondiagnosis of diabetes. Thirteen (33%) received IV alte-plase. Baseline demographics and clinical features are de-scribed in the Table. Mean blood glucose was higher andmedian time to infusion slightly shorter in the GKIgroup; other features did not differ.
Admissions N=1002
Acute Ischaemic StrokeN=530
ScreenedN=80
Initial Brain ImagingN=50
36 No consent or assent2 died1 deteriorated prior to scanning2 withdrew consent9 unable to access scan within time window
2 unable to tolerate scan2 no DWI lesion1 Posterior Circulation Stroke4 non-strokes1 Withdrew consent after baseline scans
40 patients randomised
Completed MRI day 7
Completed MRI day 3
Completed MRI day 1
Randomised
1041015
841014
1041015
GKI 72h
n=10
GKI 48h
n=5
GKI 24h
n=10
Control
n=15
FIGURE 1: Patient disposition throughout the trial. DWI � diffusion-weighted imaging; GKI � glucose potassium insulin;MRI � magnetic resonance imaging.
ANNALS of Neurology
572 Volume 67, No. 5
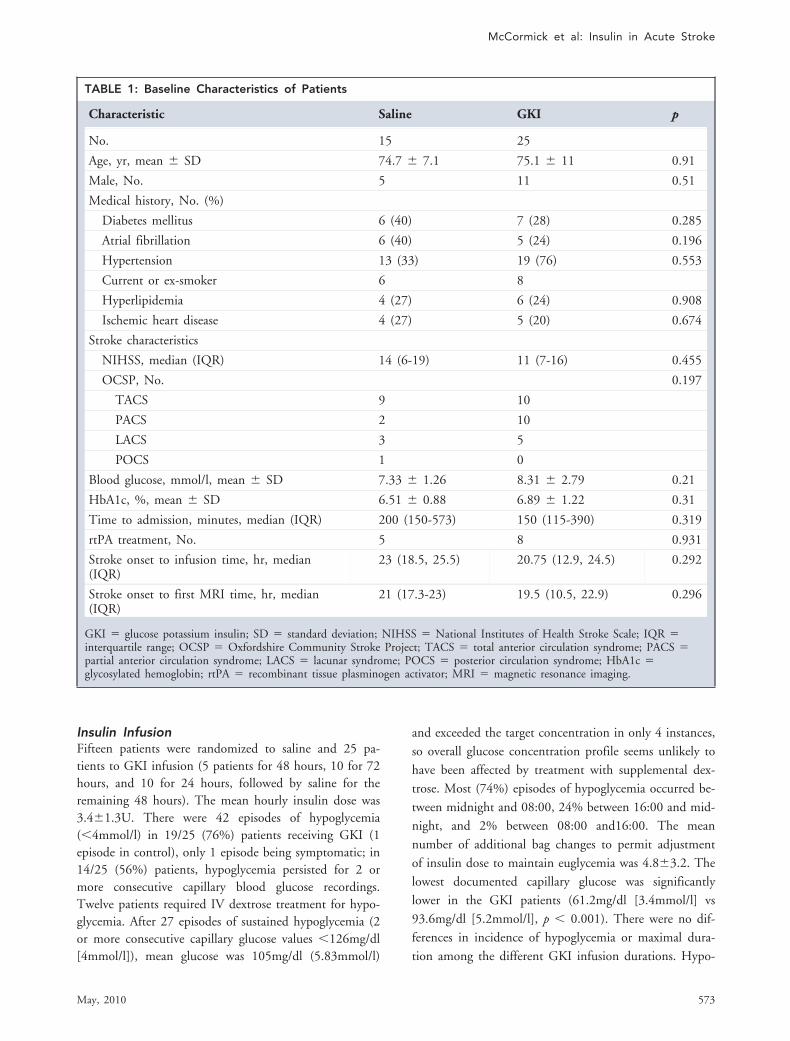
Insulin InfusionFifteen patients were randomized to saline and 25 pa-tients to GKI infusion (5 patients for 48 hours, 10 for 72hours, and 10 for 24 hours, followed by saline for theremaining 48 hours). The mean hourly insulin dose was3.4�1.3U. There were 42 episodes of hypoglycemia(�4mmol/l) in 19/25 (76%) patients receiving GKI (1episode in control), only 1 episode being symptomatic; in14/25 (56%) patients, hypoglycemia persisted for 2 ormore consecutive capillary blood glucose recordings.Twelve patients required IV dextrose treatment for hypo-glycemia. After 27 episodes of sustained hypoglycemia (2or more consecutive capillary glucose values �126mg/dl[4mmol/l]), mean glucose was 105mg/dl (5.83mmol/l)
and exceeded the target concentration in only 4 instances,so overall glucose concentration profile seems unlikely tohave been affected by treatment with supplemental dex-trose. Most (74%) episodes of hypoglycemia occurred be-tween midnight and 08:00, 24% between 16:00 and mid-night, and 2% between 08:00 and16:00. The meannumber of additional bag changes to permit adjustmentof insulin dose to maintain euglycemia was 4.8�3.2. Thelowest documented capillary glucose was significantlylower in the GKI patients (61.2mg/dl [3.4mmol/l] vs93.6mg/dl [5.2mmol/l], p � 0.001). There were no dif-ferences in incidence of hypoglycemia or maximal dura-tion among the different GKI infusion durations. Hypo-
TABLE 1: Baseline Characteristics of Patients
Characteristic Saline GKI p
No. 15 25
Age, yr, mean � SD 74.7 � 7.1 75.1 � 11 0.91
Male, No. 5 11 0.51
Medical history, No. (%)
Diabetes mellitus 6 (40) 7 (28) 0.285
Atrial fibrillation 6 (40) 5 (24) 0.196
Hypertension 13 (33) 19 (76) 0.553
Current or ex-smoker 6 8
Hyperlipidemia 4 (27) 6 (24) 0.908
Ischemic heart disease 4 (27) 5 (20) 0.674
Stroke characteristics
NIHSS, median (IQR) 14 (6-19) 11 (7-16) 0.455
OCSP, No. 0.197
TACS 9 10
PACS 2 10
LACS 3 5
POCS 1 0
Blood glucose, mmol/l, mean � SD 7.33 � 1.26 8.31 � 2.79 0.21
HbA1c, %, mean � SD 6.51 � 0.88 6.89 � 1.22 0.31
Time to admission, minutes, median (IQR) 200 (150-573) 150 (115-390) 0.319
rtPA treatment, No. 5 8 0.931
Stroke onset to infusion time, hr, median(IQR)
23 (18.5, 25.5) 20.75 (12.9, 24.5) 0.292
Stroke onset to first MRI time, hr, median(IQR)
21 (17.3-23) 19.5 (10.5, 22.9) 0.296
GKI � glucose potassium insulin; SD � standard deviation; NIHSS � National Institutes of Health Stroke Scale; IQR �interquartile range; OCSP � Oxfordshire Community Stroke Project; TACS � total anterior circulation syndrome; PACS �partial anterior circulation syndrome; LACS � lacunar syndrome; POCS � posterior circulation syndrome; HbA1c �glycosylated hemoglobin; rtPA � recombinant tissue plasminogen activator; MRI � magnetic resonance imaging.
McCormick et al: Insulin in Acute Stroke
May, 2010 573
glycemia was not associated with infarct growth orfunctional outcome.
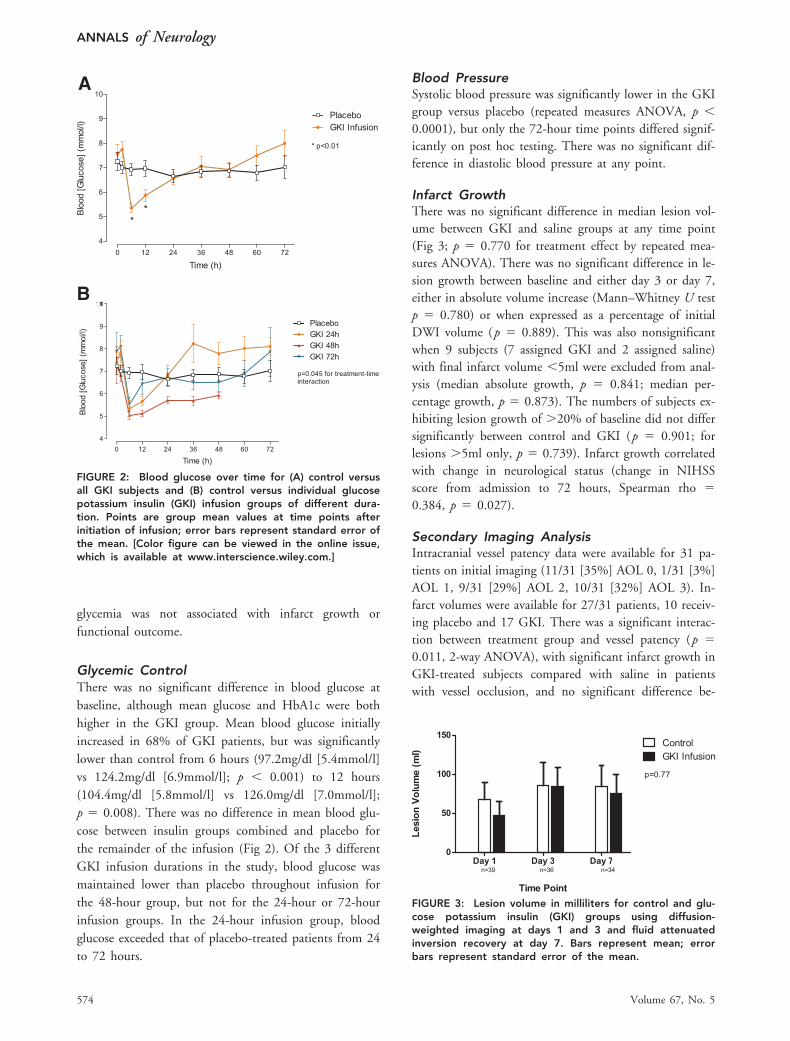
Glycemic ControlThere was no significant difference in blood glucose atbaseline, although mean glucose and HbA1c were bothhigher in the GKI group. Mean blood glucose initiallyincreased in 68% of GKI patients, but was significantlylower than control from 6 hours (97.2mg/dl [5.4mmol/l]vs 124.2mg/dl [6.9mmol/l]; p � 0.001) to 12 hours(104.4mg/dl [5.8mmol/l] vs 126.0mg/dl [7.0mmol/l];p � 0.008). There was no difference in mean blood glu-cose between insulin groups combined and placebo forthe remainder of the infusion (Fig 2). Of the 3 differentGKI infusion durations in the study, blood glucose wasmaintained lower than placebo throughout infusion forthe 48-hour group, but not for the 24-hour or 72-hourinfusion groups. In the 24-hour infusion group, bloodglucose exceeded that of placebo-treated patients from 24to 72 hours.
Blood PressureSystolic blood pressure was significantly lower in the GKIgroup versus placebo (repeated measures ANOVA, p �0.0001), but only the 72-hour time points differed signif-icantly on post hoc testing. There was no significant dif-ference in diastolic blood pressure at any point.
Infarct GrowthThere was no significant difference in median lesion vol-ume between GKI and saline groups at any time point(Fig 3; p � 0.770 for treatment effect by repeated mea-sures ANOVA). There was no significant difference in le-sion growth between baseline and either day 3 or day 7,either in absolute volume increase (Mann–Whitney U testp � 0.780) or when expressed as a percentage of initialDWI volume (p � 0.889). This was also nonsignificantwhen 9 subjects (7 assigned GKI and 2 assigned saline)with final infarct volume �5ml were excluded from anal-ysis (median absolute growth, p � 0.841; median per-centage growth, p � 0.873). The numbers of subjects ex-hibiting lesion growth of �20% of baseline did not differsignificantly between control and GKI (p � 0.901; forlesions �5ml only, p � 0.739). Infarct growth correlatedwith change in neurological status (change in NIHSSscore from admission to 72 hours, Spearman rho �0.384, p � 0.027).
Secondary Imaging AnalysisIntracranial vessel patency data were available for 31 pa-tients on initial imaging (11/31 [35%] AOL 0, 1/31 [3%]AOL 1, 9/31 [29%] AOL 2, 10/31 [32%] AOL 3). In-farct volumes were available for 27/31 patients, 10 receiv-ing placebo and 17 GKI. There was a significant interac-tion between treatment group and vessel patency (p �0.011, 2-way ANOVA), with significant infarct growth inGKI-treated subjects compared with saline in patientswith vessel occlusion, and no significant difference be-
FIGURE 3: Lesion volume in milliliters for control and glu-cose potassium insulin (GKI) groups using diffusion-weighted imaging at days 1 and 3 and fluid attenuatedinversion recovery at day 7. Bars represent mean; errorbars represent standard error of the mean.
A
B
FIGURE 2: Blood glucose over time for (A) control versusall GKI subjects and (B) control versus individual glucosepotassium insulin (GKI) infusion groups of different dura-tion. Points are group mean values at time points afterinitiation of infusion; error bars represent standard error ofthe mean. [Color figure can be viewed in the online issue,which is available at www.interscience.wiley.com.]
ANNALS of Neurology
574 Volume 67, No. 5
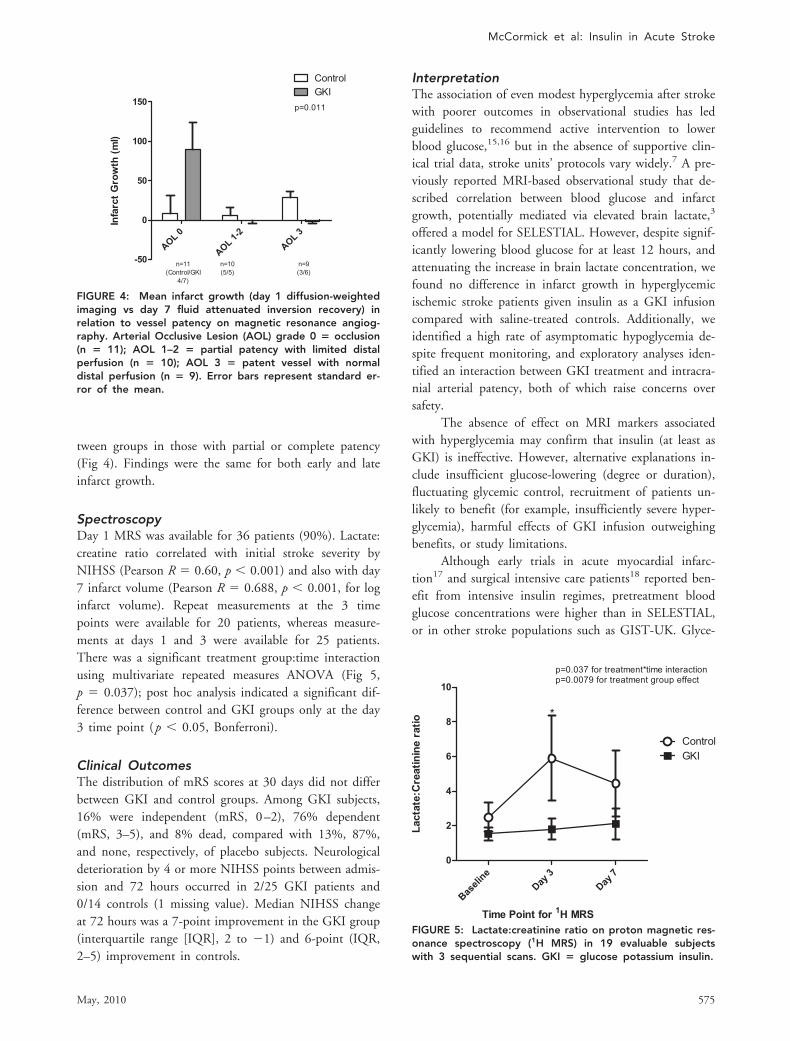
tween groups in those with partial or complete patency(Fig 4). Findings were the same for both early and lateinfarct growth.
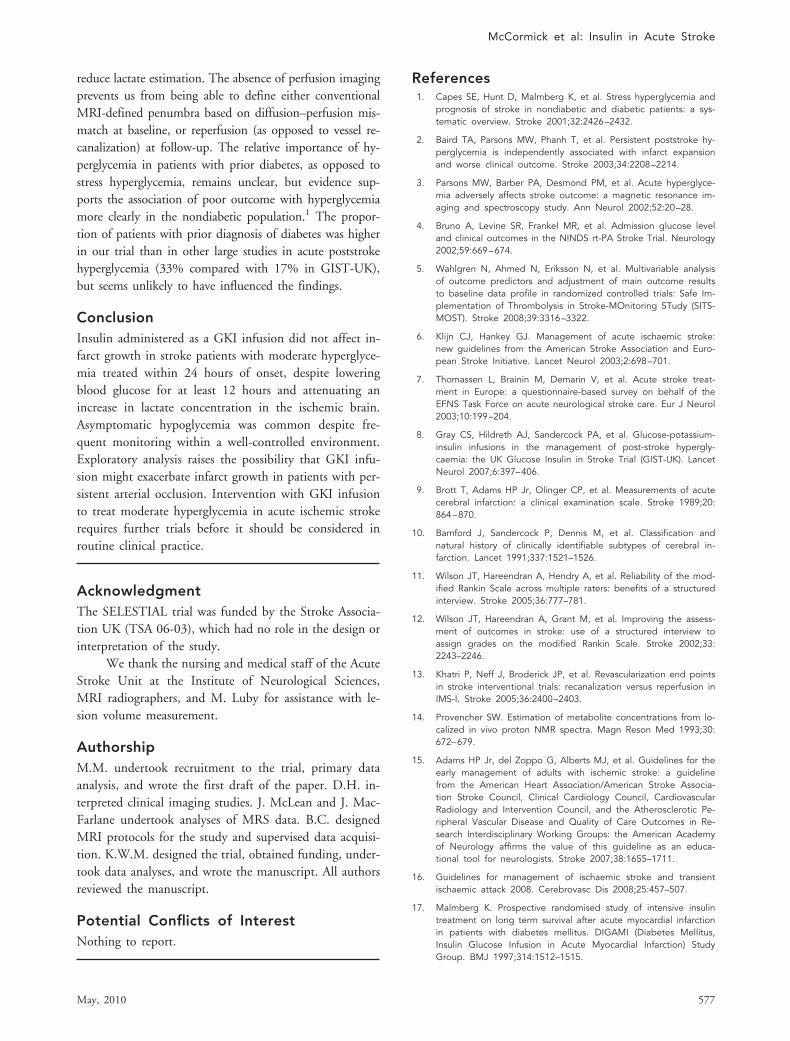
SpectroscopyDay 1 MRS was available for 36 patients (90%). Lactate:creatine ratio correlated with initial stroke severity byNIHSS (Pearson R � 0.60, p � 0.001) and also with day7 infarct volume (Pearson R � 0.688, p � 0.001, for loginfarct volume). Repeat measurements at the 3 timepoints were available for 20 patients, whereas measure-ments at days 1 and 3 were available for 25 patients.There was a significant treatment group:time interactionusing multivariate repeated measures ANOVA (Fig 5,p � 0.037); post hoc analysis indicated a significant dif-ference between control and GKI groups only at the day3 time point (p � 0.05, Bonferroni).
Clinical OutcomesThe distribution of mRS scores at 30 days did not differbetween GKI and control groups. Among GKI subjects,16% were independent (mRS, 0–2), 76% dependent(mRS, 3–5), and 8% dead, compared with 13%, 87%,and none, respectively, of placebo subjects. Neurologicaldeterioration by 4 or more NIHSS points between admis-sion and 72 hours occurred in 2/25 GKI patients and0/14 controls (1 missing value). Median NIHSS changeat 72 hours was a 7-point improvement in the GKI group(interquartile range [IQR], 2 to �1) and 6-point (IQR,2–5) improvement in controls.
InterpretationThe association of even modest hyperglycemia after strokewith poorer outcomes in observational studies has ledguidelines to recommend active intervention to lowerblood glucose,15,16 but in the absence of supportive clin-ical trial data, stroke units’ protocols vary widely.7 A pre-viously reported MRI-based observational study that de-scribed correlation between blood glucose and infarctgrowth, potentially mediated via elevated brain lactate,3
offered a model for SELESTIAL. However, despite signif-icantly lowering blood glucose for at least 12 hours, andattenuating the increase in brain lactate concentration, wefound no difference in infarct growth in hyperglycemicischemic stroke patients given insulin as a GKI infusioncompared with saline-treated controls. Additionally, weidentified a high rate of asymptomatic hypoglycemia de-spite frequent monitoring, and exploratory analyses iden-tified an interaction between GKI treatment and intracra-nial arterial patency, both of which raise concerns oversafety.
The absence of effect on MRI markers associatedwith hyperglycemia may confirm that insulin (at least asGKI) is ineffective. However, alternative explanations in-clude insufficient glucose-lowering (degree or duration),fluctuating glycemic control, recruitment of patients un-likely to benefit (for example, insufficiently severe hyper-glycemia), harmful effects of GKI infusion outweighingbenefits, or study limitations.
Although early trials in acute myocardial infarc-tion17 and surgical intensive care patients18 reported ben-efit from intensive insulin regimes, pretreatment bloodglucose concentrations were higher than in SELESTIAL,or in other stroke populations such as GIST-UK. Glyce-
FIGURE 5: Lactate:creatinine ratio on proton magnetic res-onance spectroscopy (1H MRS) in 19 evaluable subjectswith 3 sequential scans. GKI � glucose potassium insulin.
FIGURE 4: Mean infarct growth (day 1 diffusion-weightedimaging vs day 7 fluid attenuated inversion recovery) inrelation to vessel patency on magnetic resonance angiog-raphy. Arterial Occlusive Lesion (AOL) grade 0 � occlusion(n � 11); AOL 1–2 � partial patency with limited distalperfusion (n � 10); AOL 3 � patent vessel with normaldistal perfusion (n � 9). Error bars represent standard er-ror of the mean.
McCormick et al: Insulin in Acute Stroke
May, 2010 575

mic control in SELESTIAL fluctuated, despite frequentmonitoring. Although the GKI regime reduced meanblood glucose between 6 and 12 hours after initiation,and by a greater degree than in GIST-UK (25.2mg/dl[1.4mmol/l] at 12 hours in SELESTIAL vs 10.3mg/dl[0.57mmol/l] in GIST-UK) or in acute myocardial infarc-tion,19,20 glucose levels thereafter were not significantlydifferent from control. Although not significantly differ-ent from control, mean blood glucose in the GKI groupappeared to increase initially in the GKI group (previ-ously reported in the CREATE-ECLA trial20) and to ex-ceed control from 24 to 72 hours. Unlike some previousstudies,2,21 blood glucose in the control group did notdecline significantly over 72 hours. Whether these glyce-mic control issues are specific to GKI infusion is un-known; alternative insulin regimens in stroke (such ascontinuous infusion22) have been tested in trials only for24 hours. The appropriate duration of glucose loweringafter stroke is also unclear, but observational data suggestthat poor outcomes are more strongly associated with per-sistent hyperglycemia over at least 48 hours.2,23 It is pos-sible that the duration of adequate glucose lowering inour trial was too short to observe a benefit, but it coveredthe period during which infarct expansion is most likelyto occur. Conversely, longer treatment may have in-creased the risk of hypoglycemia.
Symptomatic hypoglycemia was uncommon in ourtrial, but asymptomatic hypoglycemia occurred in mostGKI-treated patients despite a monitoring regime moreintensive than would be routine in stroke units. Althoughwe found no association of asymptomatic hypoglycemiawith any index of clinical or radiological outcome, recentdata in other clinical areas such as ITU indicate poorerclinical outcomes associated with insulin-induced hypo-glycemia,24–27 and there is evidence from animal focalischemia models of exacerbation of infarct volume by hy-poglycemia �3mM28 and of higher mortality associatedwith reduction in blood glucose by �2mmol/l from base-line in GIST-UK.8 Substantial nursing time was requiredto monitor and adjust infusion rates, and there is an ad-ditional concern that prolonged IV infusions may delaymobilization, a possibly important factor in the benefitsof stroke unit care.29 Because hypoglycemic episodes oc-curred predominantly overnight in SELESTIAL, presum-ably related to overnight fasting and reduced insulin re-quirements, pre-emptive overnight reduction in insulininfusion rates may be safer.
Although it should be regarded with caution, ourobservation of greater infarct growth with GKI when amajor intracranial artery was occluded also raises the pos-sibility that GKI might worsen outcomes in a subgroup of
patients who cannot be defined without imaging. The ap-parently graded response according to degree of vessel pa-tency and consistent findings for both day 3 and day 7infarct volumes support the possibility that this finding isbiologically correct and not chance. Experimentally, insu-lin caused larger infarcts and higher mortality due tobrain edema than did saline infusion after permanentmiddle cerebral artery occlusion in acutely hyperglycemiccats.30 Such an effect could be explained by critical reduc-tion in penumbral perfusion pressure, to which a grouplacking collaterals may be particularly vulnerable, as aconsequence of systolic blood pressure reduction withGKI (also seen in GIST-UK), although it is unclearwhether this is a result of blood pressure maintenance bysaline infusion in the control group, rather than any hy-potensive effect of GKI.
Our trial had several limitations. The proportion ofpatients with infarct growth is smaller at later time points(eg, �12 hours) after stroke onset,31 reflecting the timecourse of the ischemic penumbra, and predominantly lateimaging (only 2 patients had MRI �6 hours, and 10 �12hours after onset) may have reduced the proportion likelyto contribute meaningful data. Additionally, the high pro-portion of patients receiving thrombolytic therapy mayhave obscured an effect, because reperfusion limits infarctgrowth.32 Nonetheless, sustained hyperglycemia is a betterpredictor of poor outcome rather than single readings,2 andthe adverse effect even in a thrombolysis population ex-tends beyond the first few hours.23 Day 7 may not be op-timal for final infarct volume measurement, because brainswelling may persist. However, there is currently no gener-ally agreed time point for outcome infarct volume, and day7 was chosen to minimize losses to follow-up. Despite theseissues with timing of imaging studies, we found a signifi-cant relationship between clinical deficit and infarct volumechange that is consistent with previous studies, and thetime at which we initiated treatment is clinically relevant.Voxel placement for 1H-MRS, as for the study by Parsonsand colleagues,3 was necessarily within the DWI lesion, be-cause perfusion imaging was not immediately available. Al-though it would be expected that lactate in the penumbra(presumed outside the DWI lesion) would be more patho-physiologically relevant, we observed a correlation withboth stroke severity and final infarct volume, and an atten-uation of increase in lactate concentration in the GKIgroup, in keeping with a proposed biological mechanism ofhyperglycemia in stroke. Failure to detect a relationship be-tween lactate concentration and lesion growth may reflectfactors such as the late time point for initial MRI, or a highproportion of small lesions (typical post-thrombolysis)where adjacent noninfarcted tissue included in voxels may
ANNALS of Neurology
576 Volume 67, No. 5
reduce lactate estimation. The absence of perfusion imagingprevents us from being able to define either conventionalMRI-defined penumbra based on diffusion–perfusion mis-match at baseline, or reperfusion (as opposed to vessel re-canalization) at follow-up. The relative importance of hy-perglycemia in patients with prior diabetes, as opposed tostress hyperglycemia, remains unclear, but evidence sup-ports the association of poor outcome with hyperglycemiamore clearly in the nondiabetic population.1 The propor-tion of patients with prior diagnosis of diabetes was higherin our trial than in other large studies in acute poststrokehyperglycemia (33% compared with 17% in GIST-UK),but seems unlikely to have influenced the findings.
ConclusionInsulin administered as a GKI infusion did not affect in-farct growth in stroke patients with moderate hyperglyce-mia treated within 24 hours of onset, despite loweringblood glucose for at least 12 hours and attenuating anincrease in lactate concentration in the ischemic brain.Asymptomatic hypoglycemia was common despite fre-quent monitoring within a well-controlled environment.Exploratory analysis raises the possibility that GKI infu-sion might exacerbate infarct growth in patients with per-sistent arterial occlusion. Intervention with GKI infusionto treat moderate hyperglycemia in acute ischemic strokerequires further trials before it should be considered inroutine clinical practice.
AcknowledgmentThe SELESTIAL trial was funded by the Stroke Associa-tion UK (TSA 06-03), which had no role in the design orinterpretation of the study.
We thank the nursing and medical staff of the AcuteStroke Unit at the Institute of Neurological Sciences,MRI radiographers, and M. Luby for assistance with le-sion volume measurement.
AuthorshipM.M. undertook recruitment to the trial, primary dataanalysis, and wrote the first draft of the paper. D.H. in-terpreted clinical imaging studies. J. McLean and J. Mac-Farlane undertook analyses of MRS data. B.C. designedMRI protocols for the study and supervised data acquisi-tion. K.W.M. designed the trial, obtained funding, under-took data analyses, and wrote the manuscript. All authorsreviewed the manuscript.
Potential Conflicts of InterestNothing to report.
References1. Capes SE, Hunt D, Malmberg K, et al. Stress hyperglycemia and
prognosis of stroke in nondiabetic and diabetic patients: a sys-tematic overview. Stroke 2001;32:2426–2432.
2. Baird TA, Parsons MW, Phanh T, et al. Persistent poststroke hy-perglycemia is independently associated with infarct expansionand worse clinical outcome. Stroke 2003;34:2208–2214.
3. Parsons MW, Barber PA, Desmond PM, et al. Acute hyperglyce-mia adversely affects stroke outcome: a magnetic resonance im-aging and spectroscopy study. Ann Neurol 2002;52:20–28.
4. Bruno A, Levine SR, Frankel MR, et al. Admission glucose leveland clinical outcomes in the NINDS rt-PA Stroke Trial. Neurology2002;59:669–674.
5. Wahlgren N, Ahmed N, Eriksson N, et al. Multivariable analysisof outcome predictors and adjustment of main outcome resultsto baseline data profile in randomized controlled trials: Safe Im-plementation of Thrombolysis in Stroke-MOnitoring STudy (SITS-MOST). Stroke 2008;39:3316–3322.
6. Klijn CJ, Hankey GJ. Management of acute ischaemic stroke:new guidelines from the American Stroke Association and Euro-pean Stroke Initiative. Lancet Neurol 2003;2:698–701.
7. Thomassen L, Brainin M, Demarin V, et al. Acute stroke treat-ment in Europe: a questionnaire-based survey on behalf of theEFNS Task Force on acute neurological stroke care. Eur J Neurol2003;10:199–204.
8. Gray CS, Hildreth AJ, Sandercock PA, et al. Glucose-potassium-insulin infusions in the management of post-stroke hypergly-caemia: the UK Glucose Insulin in Stroke Trial (GIST-UK). LancetNeurol 2007;6:397–406.
9. Brott T, Adams HP Jr, Olinger CP, et al. Measurements of acutecerebral infarction: a clinical examination scale. Stroke 1989;20:864–870.
10. Bamford J, Sandercock P, Dennis M, et al. Classification andnatural history of clinically identifiable subtypes of cerebral in-farction. Lancet 1991;337:1521–1526.
11. Wilson JT, Hareendran A, Hendry A, et al. Reliability of the mod-ified Rankin Scale across multiple raters: benefits of a structuredinterview. Stroke 2005;36:777–781.
12. Wilson JT, Hareendran A, Grant M, et al. Improving the assess-ment of outcomes in stroke: use of a structured interview toassign grades on the modified Rankin Scale. Stroke 2002;33:2243–2246.
13. Khatri P, Neff J, Broderick JP, et al. Revascularization end pointsin stroke interventional trials: recanalization versus reperfusion inIMS-I. Stroke 2005;36:2400–2403.
14. Provencher SW. Estimation of metabolite concentrations from lo-calized in vivo proton NMR spectra. Magn Reson Med 1993;30:672–679.
15. Adams HP Jr, del Zoppo G, Alberts MJ, et al. Guidelines for theearly management of adults with ischemic stroke: a guidelinefrom the American Heart Association/American Stroke Associa-tion Stroke Council, Clinical Cardiology Council, CardiovascularRadiology and Intervention Council, and the Atherosclerotic Pe-ripheral Vascular Disease and Quality of Care Outcomes in Re-search Interdisciplinary Working Groups: the American Academyof Neurology affirms the value of this guideline as an educa-tional tool for neurologists. Stroke 2007;38:1655–1711.
16. Guidelines for management of ischaemic stroke and transientischaemic attack 2008. Cerebrovasc Dis 2008;25:457–507.
17. Malmberg K. Prospective randomised study of intensive insulintreatment on long term survival after acute myocardial infarctionin patients with diabetes mellitus. DIGAMI (Diabetes Mellitus,Insulin Glucose Infusion in Acute Myocardial Infarction) StudyGroup. BMJ 1997;314:1512–1515.
McCormick et al: Insulin in Acute Stroke
May, 2010 577
18. van den Berghe G, Wouters P, Weekers F, et al. Intensive insulin ther-apy in the critically ill patients. N Engl J Med 2001;345:1359–1367.
19. Malmberg K, Ryden L, Wedel H, et al. Intense metabolic controlby means of insulin in patients with diabetes mellitus and acutemyocardial infarction (DIGAMI 2): effects on mortality and mor-bidity. Eur Heart J 2005;26:650–661.
20. Mehta SR, Yusuf S, Diaz R, et al. Effect of glucose-insulin-potassium infusion on mortality in patients with acute ST-segment elevation myocardial infarction: the CREATE-ECLA ran-domized controlled trial. JAMA 2005;293:437–446.
21. Gray CS, Hildreth AJ, Alberti GK, O’Connell JE. Poststrokehyperglycemia: natural history and immediate management.Stroke 2004;35:122–126.
22. Bruno A, Kent TA, Coull BM, et al. Treatment of hyperglycemiain ischemic stroke (THIS): a randomized pilot trial. Stroke 2008;39:384–389.
23. Yong M, Kaste M. Dynamic of hyperglycemia as a predictor ofstroke outcome in the ECASS-II trial. Stroke 2008;39:2749–2755.
24. Brunkhorst FM, Engel C, Bloos F, et al. Intensive insulin therapyand pentastarch resuscitation in severe sepsis. N Engl J Med2008;358:125–139.
25. Finfer S, Heritier S. The NICE-SUGAR (Normoglycaemia in IntensiveCare Evaluation and Survival Using Glucose Algorithm Regulation)Study: statistical analysis plan. Crit Care Resusc 2009;11:46–57.
26. Griesdale DE, de Souza RJ, van Dam RM, et al. Intensive insulintherapy and mortality among critically ill patients: a meta-analysisincluding NICE-SUGAR study data. CMAJ 2009;180:821–827.
27. Wiener RS, Wiener DC, Larson RJ. Benefits and risks of tightglucose control in critically ill adults: a meta-analysis. JAMA2008;300:933–944.
28. Zhu CZ, Auer RN. Optimal blood glucose levels while using in-sulin to minimize the size of infarction in focal cerebral ischemia.J Neurosurg 2004;101:664–668.
29. Indredavik B, Bakke F, Slordahl SA, et al. Treatment in a com-bined acute and rehabilitation stroke unit: which aspects aremost important? Stroke 1999;30:917–923.
30. de Courten-Myers GM, Kleinholz M, Wagner KR, Myers RE. Nor-moglycemia (not hypoglycemia) optimizes outcome from middlecerebral artery occlusion. J Cereb Blood Flow Metab 1994;14:227–236.
31. van Everdingen KJ, van der Grond J, Kappelle LJ, et al.Diffusion-weighted magnetic resonance imaging in acute stroke.Stroke 1998;29:1783–1790.
32. Davis SM, Donnan GA, Parsons MW, et al. Effects of alteplasebeyond 3 h after stroke in the Echoplanar Imaging ThrombolyticEvaluation Trial (EPITHET): a placebo-controlled randomised trial.Lancet Neurol 2008;7:299–309.
ANNALS of Neurology
578 Volume 67, No. 5