Embed Size (px)
Citation preview

Editorial Board
Editor Assistant Editor
Dr. Benoy JosephProfessor Emeritus
Cleveland State University, U.S.A.
Dr. Michael D. PatraExecutive Director
Reserve Bank of India, Mumbai
Dr. Rupa Rege Nitsure Group Chief Economist
L&T Finance Holdings Ltd., Mumbai
Dr. Pravakar SahooAssociate Professor
Institute of Economic Growth, Delhi
Dr. Mohit AnandAssociate Professor (International Business)FORE School of Management, New Delhi
Dr. AnuradhaBalaramAdviser
Ministry of AgricultureGovernmentof India, New Delhi
Dr. Joshi JacobAssociate Professor (Finance & Accounts)
IIM-Ahmedabad
Dr. Priya Nair RajivAssistant Professor (OB & HR), IIM-Kozhikode
Dr. M. BhasiDirector, School of Management Studies
Cochin University of Science and Technology, Kochi
Dr. Sam ThomasAssistant Professor (Systems & Finance)
School of Management StudiesCochin University of Science and Technology, Kochi
Dr. Joseph I. InjodeyExecutive Director
Rajagiri College of Social Sciences and RajagiriBusiness School, Kochi
Dr. Binoy JosephPrincipal
Rajagiri College of Social Sciences, Kochi
Dr. Rosemary VargheseAssociate Professor (Business Communications)
Rajagiri Centre for Business Studies, Kochi
Dr. Joji AlexAssociateProfessor (Marketing)
Rajagiri Centre for Business Studies, Kochi
Dr. Mathew JosephProfessor (Economics) & Mentor (Research)Rajagiri Centre for Business Studies, Kochi
Dr. Mathew JosephProfessor (Economics) & Mentor (Research)
Rajagiri Centre for Business Studies, Kochi
Dr. Neetha J. EappenAssistant Professor (Operations Management)
Rajagiri Centre for Business Studies, Kochi
Copyright © 2015, Rajagiri Centre for Business Studies, Kochi.
Volume 9 Issue 1 June 2015
C O N T E N T S
EditorialMathew Joseph 1
Assessing the Potential Barriers to M-Commerce Adoption in IndiaShahir Bhatt and Amola Bhatt 3
A Causality Analysis on the Empirical Nexus between CapitalFormation and Economic Growth: Evidence from IndiaB. Venkatraja 25
Overconfidence, Risk Tolerance and Investment Strategy:A Study of Capital Market Investors in IndiaMinimol M. C. 43
Service Quality Indirectly Influences Customer Loyalty viaCustomer Satisfaction: Results from a Literature SurveySameer Sharma, Divya Mittal and Shiv Ratan Agrawal 63
Book Review
The Big Data-Driven Business: How to Use Big Data toWin Customers, Beat Competitors and Boost ProfitsRussel Glass and Sean Callahan, John Wiley & Sons, New Jersey, 2015,224 pages, $21.78.Bejoy John Thomas 87


Volume 9 Issue 1 June 2015
Editorial
Known as the next-generation e-commerce, m-commerce (mobile commerce) which enablesbuying and selling of goods and services through wireless hand-held devices such as cellulartelephone and laptop, has made great strides in Europe, the US and Asia. Despite its fastgrowth, there are a number of factors hindering its adoption. Shahir Bhatt and Amola Bhattanalyses those factors in the context of India and examines the relationship between themand the demographics.
The relationship between capital formation and gross domestic product has been wellestablished both theoretically and empirically. However, there has been limited research onthis relationship in the case of India. B. Venkatraja fills this gap by examining both theshort-run and long-run linkages between capital formation and economic growth in Indiaduring the period 1970-2013 by using the cointegration econometric tool and vector error-correction model. The study also explores the linear interdependencies between capitalformation and economic growth.
The assumption of rationality of investors as posited in traditional finance theories has beenquestioned. One behavioural trait exhibited by an investor who is not rational isoverconfidence. Minimol M. C. enquires into the existence overconfidence among Indiancapital-market investors and the impact of that on their trading strategies.
A number of studies have shown that service-quality attributes directly influence customersatisfaction. Similarly, studies have revealed the positive connection between customersatisfaction and customer loyalty. However, studies have not been able to establish a directlink between service quality and customer loyalty. Sameer Sharma, Divya Mittal and RatanAgarwal review the vast literature in this area to conclude that service quality indirectlyinfluences customer loyalty through customer satisfaction.
This issue also contains a review by Bejoy John Thomas of the book entitled, “The Big Data-Driven Business: How to Use Big Data to Win Customers, Beat Competitors and BoostProfits” by Russel Glass and Sean Callahan, published in 2015.
I would be happy to receive your comments, suggestions and feedback.
Mathew JosephEditor
Rajagiri Management JournalE-mail: [email protected]

1 Assistant Professor, Institute of Management, Nirma University, Ahmedabad.E-mail: [email protected]
2 Assistant Professor, Institute of Management, Nirma University, Ahmedabad.Email: [email protected]
Rajagiri Management JournalVolume 9, Issue 1, June 2015
Assessing the Potential Barriers toM-Commerce Adoption in India
Shahir Bhatt1 and Amola Bhatt2
Abstract
In the era of information technology and click-and-mortarbusinesses, execution of commercial transactions is experiencinga paradigm shift. New-age consumers have shifted to electroniccommerce, and with the advent of smart phone and internet usageon mobile phones, people are gradually tempted to use mobilecommerce. In spite of the various benefits offered by mobilecommerce, there are various factors which inhibit its adoption.Dearth of relevant research in this area makes the case for thisempirical study. Data is collected from 296 respondents using aself-administered questionnaire. Analysis is done usingmultivariate techniques like factor analysis followed by ANOVAand independent sample t-test. Five factors, namely, unawareness,mobile-device inoperability, personalization, time consumption/confusion, and cost are found to hinder the adoption of m-commerce. Additionally, it is seen that there is a relationshipbetween unawareness and age, unawareness and educationalqualification, personalization and educational qualification,personalization and occupation, and time consumption/ confusionand age.
Keywords: M-commerce, Unawareness, Mobile-deviceinoperability, Personalization, Timeconsumption / confusion, Cost.
1. Introduction
An enormous growth of penetration in mobile devices is noted in researchstudies (Barnes & Scornavacca, 2004; Dholakia, N., Dholakia, R.R., Lehrer,M., & Kshetri, N., 2004; Massoud & Gupta, 2003). Mobile is now at theheart and soul of communication – from personal communication, mobilecommerce, to entertainment and professional networking. Mobile commercecan pose as a solution to issues of productivity and sustainability.
Mobile commerce, which is commonly referred to as m-commerce,has become an imperative in today’s business environment (Rottenberg &Sisi, 2002). According to Oxford Dictionary, m-commerce means commercialtransactions conducted electronically by mobiles. Investopedia definesmobile commerce as the use of information technologies and communicationtechnologies for the purpose of mobile integration of different value chainsand business processes, and for the purpose of management ofbusiness relationships. Sadeh (2002) characterizes m-commerce in a similarvein as “the emerging set of applications and services people can accessfrom their Internet-enabled mobile devices.” This has been stated moreaccurately by Chaffey (2009, p. 6) who defines m-commerce as “electronictransactions and communications conducted using mobile devices such aslaptops, PDAs, and mobile phones, and typically with a wirelessconnection”.
As per the data released by the Telecom Regulatory Authority of India (TRAI)in December 2014, of the total 237 million internet subscribers in the country,92 per cent comprise mobile wireless subscribers, which clearly highlightsthe importance of mobile internet services. According to TechNavio Report(2012), the mobile-commerce market in India is expected to grow at anannual compound rate of 71 per cent over the period 2012-2016. In adifferent vein, Rackspace Survey released in September 2014 found that whilehuge numbers of consumers in Asia-Pacific are using their smartphones tobrowse and purchase items from m-commerce sites, the impact of a pooruser experience acts as a deterrent in the adoption of m-commerce.M-commerce can be said to be in the nascent stage. It has a potential to dealwith various transactions like mobile banking, mobile ticketing, mobileentertainment, and mobile advertising. Therefore, an extensive research inthis area is very much needed (Kao, 2009).
Shahir Bhatt and Amola Bhatt
Rajagiri Management Journal4

M-commerce is extremely user friendly as it can be used by any individualcarrying a mobile-phone, unlike e-commerce, which is not as much felicitous.On one hand, m-commerce is handy and can be used at any point of time,on the other, it also poses a risk as far as security of transactions is concerned.Moreover, since mobiles are used by illiterate segment of customers also,they can also be educated on the usage of m-commerce. However, for this tohappen, it is essential that the issues faced by existing customers and themore literate lot be known. Thus, the present study elicits the problems facedby consumers in adopting m-commerce specifically. The results from thestudy would help the businesses in shaping appropriate strategies to promotetheir products through m-commerce.
2. Literature Review
2.1 Association between m-commerce and e-commerce
Approaches to association between m-commerce and e-commerce have differedover a period of time. Vrechopoulos, Constantiou, Sideris, Doukidis andMylonopoulos (2003) consider m-commerce as an extended form of e-commercebased on internet technology that offers services and products through mobilenetwork and device. Feng, Hoegler, and Stucky (2006) went on further to statethat m-commerce is more than e-commerce due to its different interaction style,usage pattern and value chain. They also stated that m-commerce is a new andinnovative business opportunity with its own unique characteristics andfunctions, such as mobility and broad reachability. However, Sharma (2009)adapted a very simplistic approach that m-commerce is a subset of e-commercewhich includes all e-commerce transactions carried out using a mobile (hand-held) device. He meant that the functionality of m-commerce, as far as theimplementation of business transactions is concerned, is the same as that of e-commerce.
2.2 Impact of demographic factors on usage of m-commerce
Alkhunaizan and Love (2013) in their research analyzed the effect ofdemographical factors (gender, age, and education) on mobile-commerceusage in Saudi Arabia. Findings of the study indicate that age has astatistically significant impact on the actual usage while gender andeducation do not impact the actual usage of mobile commerce. In contrast,Park, Yang and Lehto (2007) find moderating factors such as gender andeducation to have a significant influence but interestingly, Internet usage
Assessing the Potential Barriers to M-Commerce Adoption in India
Rajagiri Management Journal 5
experience is found to have no significant effect on m-commerce adoption.Rhee and Kim (2004) and Chinn and Fairlie (2006) as cited in Gitau andNzuki (2014) found that people with high education level were more likelyto use the Internet. This finding can be used to conclude that such peopleare more likely to use mobile and other electronic devices for carrying outcommercial transactions. Dai and Palvia (2008) have revealed that youngerusers tend to adopt m-commerce more than the older users. Teo (2001) hasshowed that males in general are inclined to use the technology more thanfemales. This indicated that gender also influenced the technology usageand could be extended to m-commerce transactions.
2.3 Factors affecting adoption of m-commerce
Qingfei, Shaobo and Gang (2008) noted the importance of “user acceptance”in the development and success of m-commerce. With the help of m-commerce, marketers can reduce time by easily accessing information in areal-time environment and can cultivate new business opportunities.Consumer experiences evoked with mobile phones may differ by shoppingmotivations, as m-commerce can provide both hedonic (entertainment) andutilitarian (efficiency and time-critical) features (Anckar & D’Incau, 2002).Bhatt and Bhatt (2014) explored the major factors influencing the adoptionof m-commerce and segmented the m-commerce customers into groups. Thefactors which came out from this study as influencing the usage of m-commerce were: attitude towards m-commerce, perceived benefits, adventure,perceived risk and idea (awareness about the usage of m-commerce). Further,three segments of m-commerce users were brought out from the study, whichincluded reserved shoppers, utilitarian shoppers, and assured shoppers. Thakurand Srivastava (2013) also investigated the factors influencing the adoptionof mobile commerce based on constructs from the technology-acceptancemodel and innovation-resistance theory in India.
2.4 Factors discouraging adoption of m-commerce
M-commerce is considered as an innovative platform where the benefits fromit are continuously at odds with the concerns and needs of individual privacy.Consequently, the advantages of m-commerce must be weighed against itspotential for privacy violations (Milne, 2003). Kini (2009) conducted a studyamong MBA students in Chile and found that despite this community being anextensive user of electronic commerce, it is not content with using mobile
Rajagiri Management Journal6
Shahir Bhatt and Amola Bhatt
commerce owing to mobile-access speed, service quality and price factors. Fongand Burton (2008) also conducted an experiment in China to understand theChinese acceptance of m-commerce. The results suggested that the Chinese werenot too eager to explore m-commerce story despite their agreeing to theconvenience it offers. High subscription fees and poor download speed are criticalbarriers to m-commerce success (Samtani, Leow, Lim, & Goh, 2003). Othertechnical factors that can impact m-commerce adoption include user interfaceconstraints, slow network connections, information security, or even the threatof government regulations (Wen and Mahatanankoon, 2004). Rahman (2013)noted that language barrier is also an issue as far as m-commerce is concerned,especially in the developing countries. He surveyed the customers of Bangladeshand found that due to rampant illiteracy and lack of knowledge of English,many people could not use the services of m-commerce. In addition to this, healso states that perceived risk, government regulations and cost were cited asissues by the customers but they were not very significant. A similar study wasconducted in India, which states that language barrier is an equally disturbingfeature which discourages Indian customers from resorting to m-commerce.Other factors which potentially obstruct the usage of m-commerce are completelack of Internet connectivity in some areas, less graphic resolutions as comparedto laptops or computers, lack of awareness due to widespread illiteracy andless number of mobile phone users in India as compared to world scenario(Gupta & Vyas, 2014). Batra and Juneja (2013) focus more on the technicalproblems related to the usage of m-commerce like security issues, lack ofubiquitous wireless network coverage, lack of standards, and technicalmismatches among various wireless devices and smartphones. Moreover, thecost of smartphones and low access speed exacerbate the situation. Similarreasons are cited by Carlsson and Walden (2002) and Wu and Wang (2005) asthey emphasize that the constraints of mobile devices adversely affect the usageof m-commerce.
Thus, many risks must be overcome to ensure the success of mobilecommerce. These include inefficiencies within the device and the system,security and privacy concerns, high user costs from time-usage charges, thepossible abuse of advertising, user comfort levels, and fulfilment issues causedby absence of incentives to use m-commerce (Chae & Kim, 2004; Chiu, 2001;Ding & Hampe, 2003; Herb, 2001; Srivastava, 2005; Yeo & Huang, 2003;and Mahatankoon & Vila-Ruiz, 2007).
Several researchers studied the antecedents and determinants of m-commerce(Langendoerfer, 2002; Martin, 2012; and Jaradat & Rababaa 2013). Majority
Rajagiri Management Journal 7
Assessing the Potential Barriers to M-Commerce Adoption in India
of research on m-commerce in India is conducted on factors influencing theadoption of m-commerce (Bhatti, 2007; Patel, 2011; Batra & Juneja, 2013; andBhatt & Bhatt, 2014). Very few studies till date have been conducted exclusivelyon the potential barriers to m-commerce adoption in India (Gupta & Vyas, 2014;Batra & Juneja, 2013; and Tandon, Mandal & Saha, 2003).
Mobile user’s perceptions and intention to use m-commerce are differentiatedby the variability of the user’s demographics, shopping motivations, and mediadependency. So, a research indicating the perceptions of consumers towardsm-commerce and segmenting the customers based on their demographic orother factors would help the retailers identify their target audience and designappropriate marketing strategies. Hence, the researchers have made attemptsto study the aspects that can hinder the adoption of m-commerce, so that theimpact of these factors can be minimized by the retailers or the retailers canmake the consumers aware of the potential benefits and how they can avoid theperceived losses.
3. Research Objectives
The literature review suggested that researchers have studied the factorsinfluencing the usage of m-commerce and the impact of demographic factorson the same. However, there is a dearth of research which pinpoints theproblems faced by customers in adopting m-commerce, especially in India.Hence, the present study is undertaken with the following objectives:
To explore the factors hindering m-commerce adoption To examine the relationship between the factors brought out in the
study and the demographics
4. Research Methodology
The sampling unit for the study is consumer who is aware about e-commerce.The participants were provided with the definition of m-commerce to avoidpossible misunderstanding about it. The respondents belonged to Ahmedabaddistrict of the State of Gujarat. The survey was conducted from April 2014 toJune 2014. The questionnaire constructed for the study included several questionswhich were continuous and categorical in nature. A scale was constructed withfive point Likert-type statements in which respondents were asked to indicatetheir level of agreement (1 = strongly disagree to 5 = strongly agree). Thequestionnaire for the study was based on the scale developed by Mahatanankoon
Rajagiri Management Journal8
Shahir Bhatt and Amola Bhatt
and Vila-Ruiz (2007) consisting of 24 items. The reliability of the scale was foundsound and apt for the current study. The sampling technique used for the studywas convenient sampling. Reponses were obtained from 296 respondents. Therespondents were guaranteed anonymity and confidentiality of their responses.SPSS 19 was used to analyze the data. Factor analysis and one-way ANOVAwere used to analyze the data collected.
5. Sample Characteristics
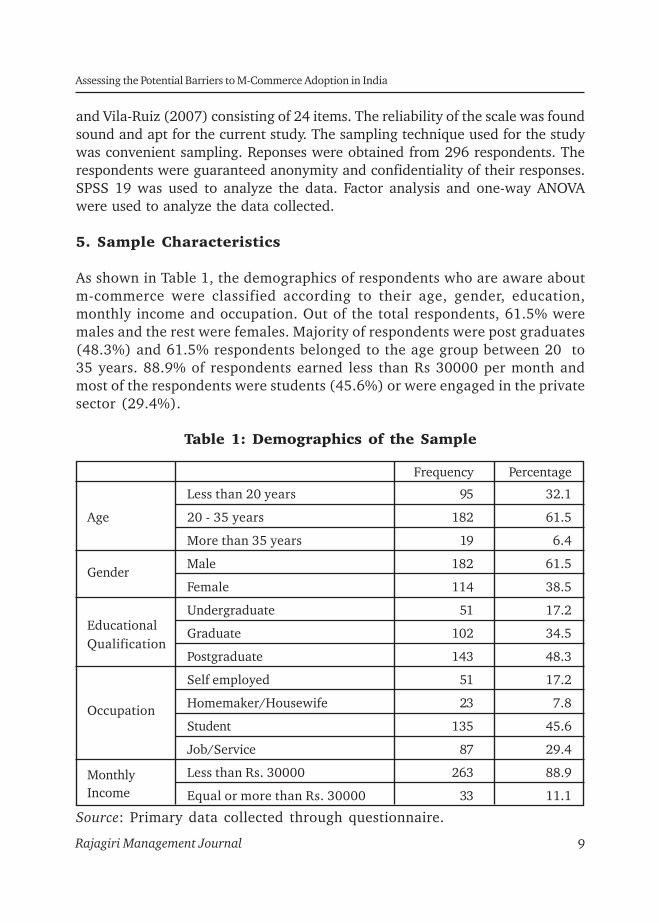
As shown in Table 1, the demographics of respondents who are aware aboutm-commerce were classified according to their age, gender, education,monthly income and occupation. Out of the total respondents, 61.5% weremales and the rest were females. Majority of respondents were post graduates(48.3%) and 61.5% respondents belonged to the age group between 20 to35 years. 88.9% of respondents earned less than Rs 30000 per month andmost of the respondents were students (45.6%) or were engaged in the privatesector (29.4%).
Table 1: Demographics of the Sample
Frequency Percentage
Less than 20 years 95 32.1
Age 20 - 35 years 182 61.5
More than 35 years 19 6.4
GenderMale 182 61.5
Female 114 38.5
EducationalUndergraduate 51 17.2
QualificationGraduate 102 34.5
Postgraduate 143 48.3
Self employed 51 17.2
Occupation Homemaker/Housewife 23 7.8
Student 135 45.6
Job/Service 87 29.4
Monthly Less than Rs. 30000 263 88.9
Income Equal or more than Rs. 30000 33 11.1
Source: Primary data collected through questionnaire.
Rajagiri Management Journal 9
Assessing the Potential Barriers to M-Commerce Adoption in India

6. Factors Hindering M-commerce Adoption
To determine the important factors hindering m-commerce, the factorabilityof 24 items measuring perceptions of consumers was examined. Therespondents were asked to rate 24 variables using a 5-point Likert scale,which ranged from ‘strongly disagree’ to ‘strongly agree’. Firstly, the internalconsistency of the items was checked using Cronbach’s alpha. The Cronbach’salpha value came to 0.910 for the entire scale of 24 items which wasconsidered to be excellent, as the closer the reliability coefficient gets to thevalue of 1 the better is the reliability of the measures (Cronbach, 1951).Moreover, deletion of any item could not significantly improve the reliabilityresults. Next, the Bartlett’s test of sphericity (Bartlett, 1954) was found tobe significant (Chi-Square 3944.859, p-value < 0.0001). The Kaiser-Mayer-Olkin (KMO) measure of sampling adequacy was high at 0.885. The KMOvalue of 0.885 was excellent since it exceeded the recommended value of0.6 (Kaiser, 1974). The two results of (KMO and Bartlett’s) suggested thatthe data was appropriate to proceed with the factor analysis using all the 24items of the scale (Malhotra, 2010). The principal component analysis withvarimax rotation was used as the basic idea was to identify the factors,thereby narrowing the scope and computing factor loadings for the same.
Exploratory factor analysis (EFA) was performed and it was found that allthe items carried an eigenvalue of more than 1. Hence, all the factors wereretained as they were considered significant to the study. The result wasthat there were a total of 5 factors, which explained 66.32 % of the totalvariance. Moreover, factor reliability tests which state whether all items in aparticular factor are internally consistent and will consistently load on thesame factor, were conducted. These are represented by the Cronbach’s alphavalue for each factor in Table 2. The table gives the rotated component matrixdimensions along with the Cronbach’s alpha value for better understandingof the factors.
Factor 1 has an eigenvalue of 8.861 and has ten variables clubbed under it.The reliability of the variables that constitute the factor is 0.913 (Cronbach’salpha). This can be labelled as “unawareness”, as these ten variables revealedthe unawareness of consumers towards m-commerce. This included theindividual’s unawareness towards m-commerce applications and theirpricing schemes, lack of knowledge of mobile service provider, demands forconventional business transactions and thus exhibiting resistance towardschange, and lack of knowledge of the manufacturer as well as Internet
Shahir Bhatt and Amola Bhatt
Rajagiri Management Journal10

Table 2: Factors Hindering M-commerce
1 2 3 4 5 Relia- Meanbility Value
Factor 1: Unawareness I lack knowledge of thepricing scheme of .841M-commerceI am unaware of existingM-commerce applications .805
I am unaware of mymobile capabilities .767
My mobile service providerdoes not support .733M-commerce applicationManufacturer doesn’tdevelop apps for my .641mobile 0.913 2.59Internet vendor do notoffer mobile transaction .599servicesI prefer face-to-faceinteraction while .591purchasingI am used to the physicalform of payment .568
My mobile carrier doesn’tprovide other services .540
Lack of telecom standardshinders acceptance .540
Factor 2: MobileDevice InoperabilityRoaming capabilitieshinders acceptance of .820M-commerce
Interoperability of differentsender hinders the .814acceptance 0.796 2.69Reliability of mobilecarriers hinders acceptance .607
Assessing the Potential Barriers to M-Commerce Adoption in India
Rajagiri Management Journal 11

My mobile can becustomized to reflect .581M-commerce activitiesFactor 3:PersonalizationI am able to customize myM-commerce activities .816
I need to personalize myM-commerce activities .791 0.761 2.94I prefer to purchase viamy computer .758
I prefer electronic formof payment .610
Factor 4: TimeConsumption/ConfusionUsing my computer thanmobile to purchase is faster .737
Functions of my mobilehinders acceptance of .599M-commerce 0.762 2.63My mobile is cumbersomefor M-commerce activities .592
I am impatient withM-commerce .524
Factor 5: CostIt is costly to addM-commerce in .717subscription plan 0.652 3.08It is too time consumingto perform M-commerce .631activities
Source: Primary data collected through questionnaire.
vendor. The items received a mean score of 2.59 on a scale of 1 to 5 wheremajority agreed that unawareness towards m-commerce is an importantreason hindering m-commerce adoption. Consumers often perceive m-commerce as surfing the Internet, checking sports, or viewing weatherinformation. Some may be aware of m-commerce applications but do notknow how to install them on their devices. Mahatankoon and Vila-Ruiz (2007)
Shahir Bhatt and Amola Bhatt
Rajagiri Management Journal12
have also cited this as an influential factor; and this result coincides withprior research. In addition to that, m-commerce marketing relies on word-of-mouth and other intricate social factors. For example, a consumer willutilize mobile applications if his/her friends are active mobile users (Lu, Yu,Liu & Yao, 2003; and Kleijnen & Wetzels, 2004).
Factor 2 has an eigenvalue of 2.899 and has four variables clubbed under it.The reliability of the variables that constitute the factor is 0.796 (Cronbach’salpha). This can be labelled as “mobile-phone inoperability”, as these fourvariables included poor reliability of mobile carriers, inability of mobile phonesto customize and poor roaming capabilities. The items received a mean scoreof 2.69 on a scale of 1 to 5 where majority indicated the inefficiency ofmobile phones as the reason for not adopting m-commerce. Carlsson andWalden (2002) also stated the slow speed of service and the limited screensize of mobile devices as the main hindrance for adoption of m-commerceexpansion. The difficulties because of limitations of mobile devices diminishthe potential uses of mobile commerce. It is evident that m-commerce wouldnot be able to fulfil its potential without widespread proliferation of wirelessdevices and related applications.
Factor 3 has an eigenvalue of 1.983 and has four variables clubbed under it.The reliability of the variables that constitute the factor is 0.761 (Cronbach’salpha). This can be labelled as “personalization”, as these four variablescomprise the inability to customize m-commerce activities, and thepreference towards e-commerce. The items received a mean score of 2.94on a scale of 1 to 5 where majority had a neutral opinion towardscustomization. Langendoerfer (2002) revealed that psychological factorsmainly related to privacy issues are responsible for the lack of advocacy form-commerce rather than technological issues. Mahatankoon and Vila-Ruiz(2007) also stated that electronic commerce customers may decide to buyproducts from a trusted vendor just by looking at its reliability and reviews,but for m-commerce consumers, this functionality still remains a challenge.M-commerce services must be personalized and tailored to each consumerbased on his/her profile, location and need. These operations range fromcustomized ring-tone recommendations to location-based services (Ho &Kwok, 2003). One of the reasons for preferring e-commerce in comparisonto m-commerce is security. Mobile phones are more likely to be stolencompared to computers and laptops. So, it is quite important for thecompanies to ensure that the security of the customers are not compromisedin such cases. Often the customers face trouble while losing their mobile
Assessing the Potential Barriers to M-Commerce Adoption in India
Rajagiri Management Journal 13
phones (Varshney, 2004). Examining barriers to adoption, Khodawandi,Pousttchi and Wiedemann (2003) indicate that the lack of perceived security(defined as subjective security) is the most frequent reason for a refusal.Rogger and Celia (2004) found similar results.
Factor 4 has an eigenvalue of 1.115 and has four variables clubbed under it.The reliability of the variables that constitute the factor is 0.762 (Cronbach’salpha). This can be labelled as “time consuming / confusion,” as these fourvariables comprise speed-related issues leading to impatience amongstcustomers and computer purchases being faster than mobile purchases. Theitems received a mean score of 2.63 on a scale of 1 to 5 where majorityagreed that speed is an important determinant hindering the spread of m-commerce. It is found that mobile phones are slower in terms of speed ascompared to computers. Optimization of m-commerce application wouldresult into customer satisfaction. Upkar (2002) reveals that companies usingm-commerce need to remove several images that might be vital for theapplications. He further states that companies should not include someattractive flash, scripts or plug-ins in their m-commerce websites or apps.
Factor 5 has an eigenvalue of 1.059 and has two variables clubbed under it.The reliability of the variables that constitute the factor is 0.652 (Cronbach’salpha). This can be labelled as “cost”, as these variables include theopportunity cost of opting for m-commerce. The items received a mean scoreof 3.08 on a scale of 1 to 5 where majority cited cost as the most importantreason hindering m-commerce adoption. Similarly, some studies revealedthat high subscription fees are a critical barrier to m-commerce success(Samtani, Leow, Lim & Goh, 2003).
7. Hypothesis
The study tested the following hypothesis:
Ho: There is no significant relationship between factors hindering m-commerce and the demographics
H1: There is significant relationship between factors hindering m-commerceand the demographics
One-way ANOVA (analysis of variance)/ independent sample t-test is usedto test the hypothesis. On a variable of interest, ANOVA tests the significance
Shahir Bhatt and Amola Bhatt
Rajagiri Management Journal14

of differences between two or more groups, while t-test looks at differencesbetween two groups. Of the independent variables relating to demographics,gender contains only two groups while the other variables like age,educational qualification, occupation and monthly income consist of morethan two categories. Hence, t-test is applied for gender while ANOVA is usedfor the remaining variables. Data is normally distributed and homogeneityof variance is checked using Levene’s statistic which can be seen in Table 3.Post-hoc tests (Tuckey/Games Howell) are also carried out to further analyzethe data wherever a significant relationship is established.
Table 3: Relationship of Factors with Demographics
Age Gender Educational Occup- MonthlyQualification ation Income
Levene 0.398 0.365 0.002 0.708 0.428statistic (Sig)3
Unawareness Anova/Welch / 4.334 0.496 10.071 2.112 0.875t-statistic4
Significance5 0.014 0.620 0.000 0.099 0.350
Levene statistic 0.074 0.094 0.170 0.066 0.669Mobile-device (Sig)
Inoperability Anova/Welch/ 1.740 1.539 2.371 0.889 0.362t-statistic
Significance 0.177 0.125 0.095 0.447 0.548
Levene statistic 0.027 1.570 0.712 0.077 0.950(Sig)
3 Levene’s test is used for determining the homogeneity of variances. In the given table, thesignificance value of Levene’s test is shown. If this significance value is less than 0.05, thenull hypothesis of equal variances is rejected.
4 ANOVA test indicates whether there is an overall difference between the groups. However,it can only be used if the data meets the assumption of homogeneity of variance (asindicated by Levene’s test). If the data does not satisfy the assumption of homogeneity ofvariance, Welch F-test is run to identify the overall difference between the groups. The t-test is also used to find the difference between the groups, when the groups are limited totwo. In this case for “gender”, t-test is run as groups are only two. If the groups exceedtwo, then ANOVA is used. The statistics in this row relate to ANOVA or Welch F or t-test asapplicable under the given constraints.
5 The significance value given in this row is used to accept or reject the null hypothesis testedusing ANOVA or Welch or t-test.
Assessing the Potential Barriers to M-Commerce Adoption in India
Rajagiri Management Journal 15
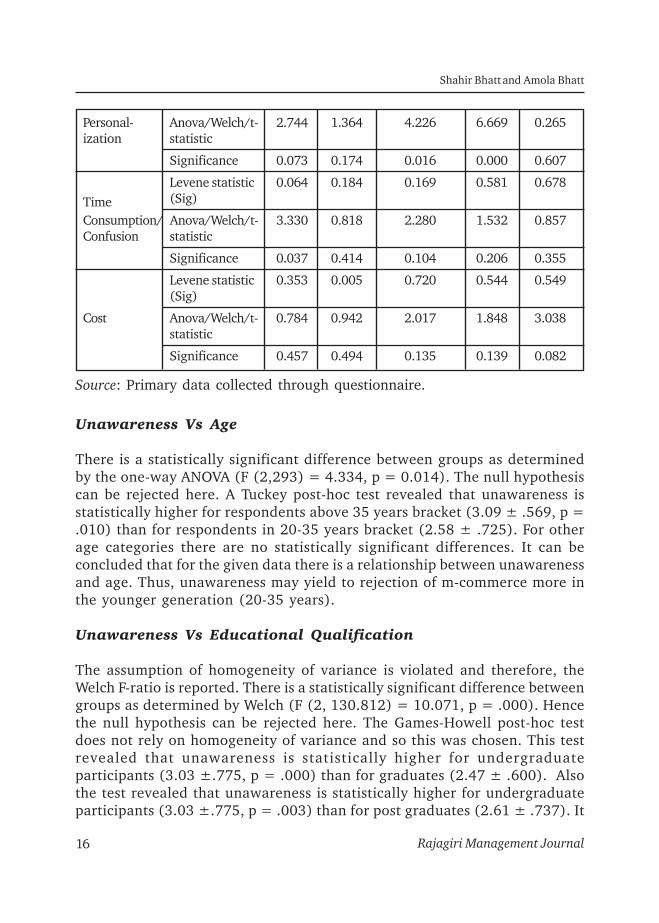
Personal- Anova/Welch/t- 2.744 1.364 4.226 6.669 0.265ization statistic
Significance 0.073 0.174 0.016 0.000 0.607
Levene statistic 0.064 0.184 0.169 0.581 0.678Time (Sig)
Consumption/ Anova/Welch/t- 3.330 0.818 2.280 1.532 0.857Confusion statistic
Significance 0.037 0.414 0.104 0.206 0.355
Levene statistic 0.353 0.005 0.720 0.544 0.549(Sig)
Cost Anova/Welch/t- 0.784 0.942 2.017 1.848 3.038statistic
Significance 0.457 0.494 0.135 0.139 0.082
Source: Primary data collected through questionnaire.
Unawareness Vs Age
There is a statistically significant difference between groups as determinedby the one-way ANOVA (F (2,293) = 4.334, p = 0.014). The null hypothesiscan be rejected here. A Tuckey post-hoc test revealed that unawareness isstatistically higher for respondents above 35 years bracket (3.09 ± .569, p =.010) than for respondents in 20-35 years bracket (2.58 ± .725). For otherage categories there are no statistically significant differences. It can beconcluded that for the given data there is a relationship between unawarenessand age. Thus, unawareness may yield to rejection of m-commerce more inthe younger generation (20-35 years).
Unawareness Vs Educational Qualification
The assumption of homogeneity of variance is violated and therefore, theWelch F-ratio is reported. There is a statistically significant difference betweengroups as determined by Welch (F (2, 130.812) = 10.071, p = .000). Hencethe null hypothesis can be rejected here. The Games-Howell post-hoc testdoes not rely on homogeneity of variance and so this was chosen. This testrevealed that unawareness is statistically higher for undergraduateparticipants (3.03 ±.775, p = .000) than for graduates (2.47 ± .600). Alsothe test revealed that unawareness is statistically higher for undergraduateparticipants (3.03 ±.775, p = .003) than for post graduates (2.61 ± .737). It
Shahir Bhatt and Amola Bhatt
Rajagiri Management Journal16

can be concluded that for the given data there is a relationship betweenunawareness and educational qualification. It can be stated that graduatesand post graduates believe that lack of knowledge can be the critical factorhindering m-commerce adoption.
Personalization Vs Educational Qualification
There is a statistically significant difference between groups as determinedby one-way ANOVA (F (2,293) = 4.226, p = 0.016). The null hypothesis canbe rejected here. A Tuckey post-hoc test exhibited that personalization isstatistically lower for undergraduates (2.68 ±.700, p = .020) than forgraduates (3.00 ± .640). Also the test showed that personalization isstatistically lower for undergraduates (2.68 ±.700, p = .023) than for postgraduates (2.98 ± .733). It can be concluded that for the given data there isa relationship between personalization and educational qualification. It canbe inferred that graduates and post graduates may not opt for m-commerceif it is not tailored as per their requirements.
Personalization Vs Occupation
There is a statistically significant difference between groups as determinedby one-way ANOVA (F (2,293) = 6.669, p = 0.000). The null hypothesis canbe rejected here. A Tuckey post-hoc test exhibited that personalization isstatistically higher for students (3.12 ±.651, p = .008) than for people inservice (2.80 ± .727). For other occupation categories, there are nostatistically significant differences. It can be concluded that for the givendata there is a relationship between personalization and occupationalbackground. It can be inferred that students require customized mobileapplications, and if not provided, that can be a reason for minimizing m-commerce transactions.
Time Consumption /Confusion Vs Age
There is a statistically significant difference between groups as determinedby one-way ANOVA (F (2,293) = 3.330, p = 0.037). The null hypothesis canbe rejected here. A Tuckey post-hoc test exhibited that time consumption/confusion is higher for respondents above the age of 35 years (2.98 ±.494, p= .043) than for respondents below the age of 20 years (2.53 ± .584). Forother age categories there are no statistically significant differences. It canbe concluded that for the given data there is a relationship between timeconsumption/confusion and age. It can be inferred that older consumersmay reject the use of m-commerce if found time consuming and confusing.
Assessing the Potential Barriers to M-Commerce Adoption in India
Rajagiri Management Journal 17

8. Limitations and Future Scope
Every study is prone to certain limitations owing to time and monetaryconstraints. The present study is restricted in its geographical scope as ithas been carried out in the Ahmedabad district of the State of Gujarat. Ifcarried out nationwide, with a larger sample size, the accuracy of findingscan be improved and the findings can be generalized to a greater extent.Also, it would facilitate comparison of results pertaining to differentgeographical regions, so that area specific strategies could also be developed.Different paradigms of research methodology can be used to study the factorswhich discourage the customers from adopting m-commerce. In the presentstudy, exploratory factor analysis has been conducted to identify the factorswhich can hinder the adoption of m-commerce. This study can be extendedwith the help of confirmatory factor analysis and structured equationmodelling to further validate the factors which have come out of this researchand design a model based on the same.
9. Conclusion
The advent of technology and proliferation of electronic gadgets havesignificantly impacted the business world. Communication has experiencedradical shift from the age of telephone to mobile phones and phablets.Likewise, commercial transactions which took place on physical platformsare now done online using electronic devices like computers and laptops,and the trend is turning towards usage of smartphones and i-pads. Hence,it becomes pertinent to study how customers view the usage of e-commerceand m-commerce facilities. Similarly, it becomes equally important to studythe factors which have the potential to hinder the growth of e-commerceand m-commerce. The present study focuses on the same.
Based on data collection and analysis, it is found that five factors, namely,unawareness, mobile-device inoperability, personalization, consumption/confusion, and cost hinder the adoption of m-commerce. Lack of knowledgerelated to m-commerce pricing, applications and supporting infrastructurecould act as a huge deterrent. Similarly, incapacity of mobile phones, issuesrelated to speed and cost could also pose as obstacles in the development ofm-commerce. To improve the spread of m-commerce, people will need to bemade more aware about the usage and plans of m-commerce. Some retailershave already started providing incentives and other offers for promoting theusage of online transactions. Simultaneously, the make of mobile phoneswill also need to be revamped, such that these transactions can be carried
Shahir Bhatt and Amola Bhatt
Rajagiri Management Journal18
out easily and in a cost-effective manner. Later on, the scope of addingcustomized features can also be considered for improving the usage of m-commerce.
Additionally, it is found that there is a relationship between unawarenessand age, unawareness and educational qualification, personalization andeducational qualification, personalization and occupation and timeconsumption/confusion and age. The younger generation agrees tounawareness being a hindrance, while the comparative elder lot believe thattime consumption may pose as an issue in m-commerce development. Also,graduates and post graduates believe that lack of knowledge can be thecritical factor hindering m-commerce adoption and they would also like m-commerce to be more personalized in approach. These factors can be keptin mind while promoting m-commerce to a particular target audience.
References
Alkhunaizan, A., & Love, S. (2013). Effect of demography on mobile commerce frequencyof actual use in Saudi Arabia. Advances in information systems and technologies,pp. 125-131, Springer.
Anckar, B. , & D’Incau, D. (2002). Value creation in mobile commerce: Findings froma consumer survey. Journal of Information Technology Theory and Application (JITTA),4(1), Article 8.
Article (May 29, 2014). Mobile commerce services are struggling in India. Retrievedfrom http://mobile-financial.com/news/mobile-commerce-services-are-struggling-india
Barlett, M.S. (1954). A note on multiplying the factors for various chi-squareapproximations. Journal of the Royal Statistical Society, 16 (Series B): 296-298.
Barnes, S.J., & Scornavacca, E., (2004). Mobile marketing: The role of permission andacceptance. International Journal of Mobile Communication, 2 (2),128-139
Batra, S., & Juneja, N. (2013). M-commerce in India: Emerging issues. InternationalJournal of Advanced Research in IT and Engineering.
Bhatt, S., & Bhatt, A. (2014). M-commerce and its influence on consumer’s perceptions.SAJOSPS-South Asian Journal for Political Studies, 15 (1), 84-88.
Bhatti, T. (2007). Exploring factors influencing the adoption of mobile commerce.Journal of Internet Banking and Commerce, 12 (3)
Assessing the Potential Barriers to M-Commerce Adoption in India
Rajagiri Management Journal 19
Business World Article (2014). From e-commerce to m-commerce on the move. Retrievedfrom http://www.businessworld.in/news/economy/from-e-to-m-%E2%80%93-commerce-on-the-move/1673988/page-1.html.
Carlsson, C., & Walden, P. (2002). Mobile commerce: Some extensions of core conceptsand key issues. Proceedings of the SSGRR 2002 Conference, L’Aquila, Italy, July 29 -August 4, 2002.
Chae, M. & Kim, J. (2003). What’s so different about the mobile Internet?Communications of the ACM, 46 (12), pp. 240-247.
Chaffey, D. (2009). E-business and E-commerce management: Strategy, implementationand practice (4th ed.).
Chiu, W. (2001). Web site personalization. Websphere Documentation (IBM white paper).Retrieved from http://www.ibm.com.
Chronbach, L. J. (1951). Coefficient alpha and the internal structure of tests.Psychometrika, 22(3), pp. 297-334.
Dai, H. & Palvia, P. (2008). Factors affecting mobile commerce adoption: A cross-cultural study in China and the United States. The Data Base for Advances inInformation Systems, 40(4), pp. 43-61.
Dholakia, N., Dholakia, R.R., Lehrer, M., & Kshetri, N., (2004). Global heterogeneityin the emerging m-commerce landscape, University of Rhode Island, Kingston, RI.
Ding, M.S., & Hampe, J.F. (2003). Reconsidering the challenges of m payments: Aroadmap to plotting the potential of the future m-commerce market. In Proceedingsof the 16th Bled Electronic Commerce Conference, 873-884, Slovenia, Bled.
Economic Times Article (Dec 1, 2014). M-Commerce to contribute upto 70% of onlineshopping: Experts. Retrieved from http://articles.economictimes.indiatimes.com/2014-12-01/news/56614582_1_mobile-internet-users-m-commerce-cent.
Economic Times Article (Feb 20, 2014). Mobiles increasingly affecting purchasingdecisions: InMobi. Retrieved from http://articles.economictimes.indiatimes.com/2014-02-20/news/47527187_1_inmobi-mobile-devices-digital-goods.
Feng, H., Hoegler, T., & Stucky, W. (2006). Exploring the critical success factors formobile commerce. Paper presented at the International Conference on Mobile Business(ICMB’06), IEEE Computer Society.
Fong, J., & Burton, S. (2008). A cross-cultural comparison of electronic word-of-mouthand country-of-origin effects. Journal of Business Research, 61 (3), pp. 233-42.
Shahir Bhatt and Amola Bhatt
Rajagiri Management Journal20
Gitau, L., & Nzuki, D. (2014). Analysis of determinants of m-commerce adoption byonline consumers. International Journal of Business, Humanities and Technology,4(3), pp. 88-94.
Gupta, S., & Vyas A. (2014). Benefits and drawbacks of m-commerce in India: A review.International Journal of Advanced Research in Computer and CommunicationEngineering, 3(4), pp. 6327-6329.
Herb, B. (2001). Let your cell phone do the e-shopping, eWeek, 18 (2), pp. 1-2.
Ho, S. Y., & Kwok, S. H. (2003). The attraction of personalized service for users inmobile commerce: An empirical study. ACM SlGecom Exchanges, 3 (4), pp. 10-18.
Impact of m-commerce on overall Indian information technology: Essay (n.d.).Retrieved from http://www.uniassignment.com/essay-samples/information-technology/impact-of-mcommerce-on-overall-indian-information-technology-essay.php.
Indian Retailer Article (2014). How m-commerce will fare in 2015? Retrieved fromhttp://www.indianretailer.com/article/multi-channel/mobile-commerce/How-m-commerce-will-fare-in-2015-2702.
Jaradat, M.R.M., & Rababaa, M.S. (2013). Assessing key factor that influence on theacceptance of mobile commerce based on modified UTAUT. International Journal ofBusiness and Management, 8(23), pp. 102-112.
Kaiser, H.F. (1974). An index of factorial simplicity. Psychometrica, 39, pp. 31-36.
Khodawandi, D., Pousttchi, K., & Wiedemann, D.G. (2003). Akzeptanz mobilerbezahlverfahren in Deutschland. In Proceedings of the 3rd Workshop on MobileCommerce (pousttchi, K. and Turowski, K. Eds.), pp. 42-57, Augsburg, Germany.
Kini, R. B. (2009). Adoption and evaluation of mobile commerce in Chile. The ElectronicJournal Information Systems Evaluation, 12(1), pp. 75 – 88
Kleijnen, M.H.P., M. Wetzels, & K. de Ruyter (2004). Consumer acceptanceof wireless finance., Journal of Financial Services Marketing, 8 (3), pp.206-217
Kotler, P (2000). Marketing management. The Millennium Edition, Upper Saddle River,Prentice Hall.
Langendoerfer, P. (2002). M-commerce: Why it does not fly (yet?). In Proceedings of theSSGRR 2002s Conference, L’Aquila, Italy, July 29 - August 4, 2002.
Assessing the Potential Barriers to M-Commerce Adoption in India
Rajagiri Management Journal 21
Lu, J., C. S. Yu, C. Liu, & J. E. Yao (2003). Technology acceptance model for wirelessInternet. Internet Research: Electronic Networking and Applications, 13 (3), pp.206-222.
Mahatanankoon, P. & Vila-Ruiz, J. (2007). Why won’t consumers adopt m-commerce?An exploratory study. Joumal of Intemet Commerce, 6(4)
Malhotra, N. (2010). Marketing research: An applied orientation, Pearson Education,New Delhi.
Martin, S.S. (2012). Factors determining firms’ perceived performance of mobilecommerce. Industrial Management & Data Systems, 112(6), pp. 946-963.
Massoud, S.L., & Gupta O. (2003). Consumer perception and attitude toward mobilecommunication. International Journal of Mobile Communication, Vol. 1, No.4, pp.390-408.
M-Commerce definition (n.d.). Retrieved from http://www.investopedia.com/
M-Commerce definition (n.d.). Retrieved from http://www.oxforddictionaries.com
Milne, G. R. & Rohm A. J. (2003). The 411 on mobile privacy. Marketing of InformationTechnology and Decision Making, 2(2), pp. 313-332.
Mishra S. (2014). Adoption of m-commerce in India: Applying theory of plannedBehaviour model. Journal of Internet Banking and Commerce, 19(1), pp. 1-17.
Park, J., Yang, S., & Lehto, X. (2007). Adoption and usage of mobile technologies forChinese consumers. Journal of Electronic Commerce Research, 31(3), pp. 196–206.
Qingfei, M., Shaobo, J., & Gang, Q. (2008). Mobile commerce user acceptance studyin China: A revised UTAUT model’. Tsinghua Science and Technology, 13(3), pp.257-264.
Rackspace Survey (2014). Survey on Mobile Commerce Users . Retrievedfrom http:www.rackspace.com/cn/...releases/asia-mobile-commerce-survey-result
Rahman, M. (2013). Barriers to m-commerce adoption in developing countries – Aqualitative study among the stakeholders of Bangladesh. The International TechnologyManagement Review, 3(2), pp. 80-91.
Rogger, A.J., & Celia, I. (2004). Akzeptanz des Kaufens und Bezahlens mit demMobiltelefon. In Proceedings of the 4th Workshop on Mobile Commerce (Pousttchi,K. and Turowski, K. Eds.), pp. 79-85, Augsburg, Germany.
Shahir Bhatt and Amola Bhatt
Rajagiri Management Journal22
Rossi, B. (Oct 24, 2014). Why do retailers still not see mobile commerce as a priority?Retrieved from http://mobile-financial.com/news/why-do-retailers-still-not-see-mobile-commerce-priority.
Rottenberg, C. & Sisi, L. (2002).The mobil speedpass and mobile commerce. MURJ, 7,p. 33.
Sadeh, N. (2002). M-commerce: technologies, services, and business models, New York:John Wiley & Sons.
Samtani, A., Leow, T.T., Lim, H.J., & Goh P. G. J. (2003). Overcoming the barriers ofsuccessful m-commerce in Singapore. International Journal of Mobile Communication1(1/2), pp. 194-231.
Sharma, D. (2009). Government policies & regulations: Impact on mobile commerce inIndian context. Indian Broadcasting (Engineering) Services, Government of India.
Singh, S. (Oct 21, 2014). Mobile-Commerce comes of age in India. Retrieved fromhttp://timesofindia.indiatimes.com/tech/tech-news/Mobile-commerce-comes-of-age-in-India/articleshow/44898756.cms.
Srivastava, L. (2005). Mobile phones and the evolution of social behavior. Behaviourand Information Technology, 24 (2), pp. 111-129.
Tandon, R., Mandal, S., & Saha, D. (2003). M-commerce – Issues and challenges.www.hipc.org/hipc2003/HiPC03Posters/m-commerce.pdf.
TechNavio Report (2012). Mobile commerce market in India 2012-2016. Retrievedfrom http://www.technavio.com/report/mobile-commerce-market-india-2012-2016.
Thakur, R., & Srivastava, M. (2013). Customer usage intention of mobile commerce inIndia: An empirical study. Journal of Indian Business Research, 5(1), pp. 52–72.http://dx.doi.org/10.1108/17554191311303385.
Upkar, V. (2002). M-commerce: Framework, applications and networking support,Kluwer Academic Publishers Hingham, MA, USA, Volume 7, SSGRR 2002s Conference,L’Aquila, Italy, July 29 - August 4, 2002.
Varshney, U. (2004). Using wireless networks for enhanced monitoring of patients.Tenth America’s Conference on Information Systems, New York.
Varshney, U., & Vetter, R. (2002). Mobile commerce: Framework, applications andnetworking support. Mobile Networks and Applications, 7(3), pp. 185-198.
Assessing the Potential Barriers to M-Commerce Adoption in India
Rajagiri Management Journal 23

Vrechopoulos, A.P., Constantiou, I.D., Sideris, I., Doukidis, G.I., & Mylonopoulos, N.(2003). The critical role of consumer behavior research in mobile commerce.International Journal of Mobile Communications, 1(3), pp. 329-340.
Wen, J. H., & Mahatanankoon, P. (2004). M-commerce operation modes andapplications. International Journal of Electronic Business, 2(3), pp. 301-315.
Wu, J. H., & Wang, S.C. (2005) What drives mobile commerce? An empirical evaluationof the revised technology acceptance model. Information and Management, 42, 719-729.
Yeo, J., & W. Huang (2003). Mobile e-commerce outlook. International Journal ofInformation Technology and Decision Making, 2(2), pp. 313-332.
Shahir Bhatt and Amola Bhatt
Rajagiri Management Journal24
Rajagiri Management JournalVolume 9, Issue 1, June 2015
A Causality Analysis on the EmpiricalNexus between Capital Formation andEconomic Growth: Evidence from India
B. Venkatraja1
Abstract
The study investigates the causal relationship between grosscapital formation (GCF) and gross domestic product (GDP) overthe period 1970-2013 using annual data. The study has employedeconometric tools to analyse the behaviour of both the series.Johansen’s co-integration test has been applied to explore thelong-run equilibrium relationship between GCF and GDP. Theanalysis reveals that GCF and GDP are cointegrated and, hence,a long-run equilibrium relationship exists between them. Thevector error correction model (VECM) has shown that the laggedterms of gross capital formation influence the gross domesticproduct of India. The Granger causality test exhibits the presenceof short-run relationship between GCF and GDP and therelationship appears to be bidirectional. It is therefore concludedthat high capital formation drives economic growth and, in turn,high economic growth contributes to the accumulation of morecapital assets in India.
Keywords: Gross capital formation, Gross domesticproduct, Investment, Economic growth,Cointegration.
1Assistant Professor, Shri Dharmasthala Manjunatheshwara Institute for Management Devel-opment (SDMIMD), Mysore. Email: [email protected]
1. Introduction
Capital formation or accumulation refers to the process of amassing orstocking of assets of value, the increase in wealth or the creation of furtherwealth. Capital formation can be differentiated from savings becauseaccumulation deals with the increase in stock of needed real investmentsand not all savings are necessarily invested. Savings are essentially the firstand the foremost requirement for capital formation to take place. Only whenthe banking institutions channelize such mobilized savings of householdsand business firms for investment, capital accumulation takes place. Anempirical examination of the savings and investment behaviour in the Indianeconomy over the period from 1950-51 to 2005-06 made by Joshi (2007)reveals that while a one per cent increase in the household financial savingsrate increases the capital formation rate in the long term by 0.25 per cent.
Economic theories have shown that capital formation plays a crucial role inthe models of economic growth. Keynes (1936) was the first to call attentionto the existence of an independent investment decision in the economy. Heobserved that investment depends on the prospective marginal efficiency ofcapital relative to some interest rate that reflects the opportunity cost of theinvested funds. After Keynes, the evolution of investment theory was linkedto simple growth models. These models gave rise to the accelerator theory,which makes investment a linear function of changes in output.
Other investment theories include the neoclassical model developed byJorgenson and Hall (1967) and the “Q” theory associated with Tobin (1969).In the Q theory of capital formation the ratio of the market value of theexisting capital stock to its replacement cost is the main force drivinginvestment and growth. Another approach dubbed as neoliberal propoundedby Galbis (1979) emphasizes the importance of financial deepening and highinterest rates in stimulating growth. The core argument rests on the claimthat developing countries suffer from financial repression and that if thesecountries were liberated from their repressive conditions, this would inducesavings, investment and growth.
The Harrod-Domar model describes the economic mechanism by which moreinvestment leads to more growth. For a country to develop and grow, itmust divert part of its resources from current consumption needs and investthem in capital formation. Diversion of resources from current consumptionis called saving. While saving is not the only determinants of growth, theHarrod-Domar model suggests that it is an important ingredient for growth.
B. Venkatraja
Rajagiri Management Journal26
Its argument is that every economy must save a certain proportion of itsnational income if only to replace the worn-out capital goods. The modelshows that growth is directly related to the saving-income ratio and inverselyrelated capital-output ratio. Hence, considering the Harrod-Domar modelas a theoretical framework, the present study aims to investigate therelationship between capital formation and economic growth of India.
2. Review of Literature
Capital formation is a key to economic growth. Some past empirical studies(Hernandez-Cata, 2000; Ndikumana, 2000; Ben-David, 1998; Collier &Gunning, 1999; Ghura & Hadji, 1996; and Khan & Reinhart, 1990) conductedin Africa, Asia and Latin America have established the critical linkage betweencapital formation and the rate of growth. This analogy has been supported bya number of very recent studies. The study by Athukorala and Sen (2002) is acomprehensive Indian case study of saving, investment and growth. Theempirical analysis found strong support for the view that the levels ofinvestment as well as its efficiency are the proximate causes of growth.
Calderón and Liu (2003) examine the direction of causality between financialdevelopment and economic growth of 109 developing and industrial countriesfrom 1960 to 1994. The paper finds the following: (1) financial developmentgenerally leads to economic growth; (2) the Granger causality from financialdevelopment to economic growth and the Granger causality from economicgrowth to financial development coexist; (3) financial deepening contributesmore to the causal relationships in the developing countries than in the industrialcountries; (4) the longer the sampling duration, the larger the effect of financialdevelopment on economic growth; (5) financial deepening propels economicgrowth through both a more rapid capital accumulation and productivitygrowth, with the latter channel being the strongest.
Verma and Pahlavani (2007) estimate the interdependencies between capitalformation, saving and output for Iran for the period 1960 to 2003. Theanalysis uses Lee and Strazicich procedure to endogenously determine thatstructural breaks occurred in 1979 for real output, 1983 for saving and1977 for investment. The relationships were estimated using Johansen’s fullinformation maximum likelihood (FIML) procedure which is appropriatefor estimating the effects of non-stationary variables in a simultaneoussetting. The estimates indicate a Solow-style relationship where a one percent increase in saving will be associated with a 0.55 per cent increase inthe long-run equilibrium level of output. The short-run estimates show that
A Causality Analysis on the Empirical Nexus between Capital Formation and Economic Growth: Evidence from India
Rajagiri Management Journal 27
saving has a short-run equilibrating effect on output with elasticity -0.13,which further supports the Solow model whereby changes to saving haveonly transitory effects on the growth in output. The other important resultfound that investment dynamically Granger causes output growth with ashort-run elasticity of 0.17, consistent with the endogenous growthexplanation. The structural change parameter estimates that the effect onthe growth in output fell by around 10 per cent after 1979.
Bakare (2010), in his study, focuses on capital formation and economicgrowth of Nigeria by applying the Harrod-Domar model. The ordinary leastsquare multiple regression analytical method was used to examine therelationship between capital formation and economic growth. The studytested the stationarity and cointegration of Nigeria’s time series data andused an error-correction mechanism to determine the long-run relationshipamong the variables examined. The empirical study found that the data werestationary and cointegrated and showed that there is a significantrelationship between capital formation and economic growth in Nigeria.The results supported the Harrod-Domar model which proved that the growthrate of national income will directly or positively be related to saving ratioand capital formation (i.e. the more an economy is able to save and investout of a given GNP, the greater will be the growth of that GDP).
Mehta (2011), in his study, empirically tested the short-run and long-runrelationship between capital formation and economic growth variables inIndia with the help of cointegration technique and vector error correctiontechnique. The study reveals a long-run relationship between capitalformation and economic growth. From the policy point of view it suggeststhat more thrust may be given for boosting the capital formation in theeconomy in order to achieve high economic growth in Indian economy.
Hussin and Saidin (2012) examine the impact of foreign direct investment(FDI), openness, and gross fixed capital formation on economic growth (GDP)over the period 1981-2008 in ASEAN-4 countries by using panel estimationmodels. The findings show that all variables are correlated with each otherand also have a positive relationship to GDP. FDI appears to be the most efficientvariable in assisting the economic growth followed by openness and grossfixed capital formation. However, the results from ordinary least squares (OLS)method shows that only gross fixed capital formation is significant to growthand contributes positively to GDP in each of the ASEAN-4 countries.
Nowbutsing (2012) discerns the short-run and long-run impacts of public,private, and foreign fixed capital formation on growth of the economy of
B. Venkatraja
Rajagiri Management Journal28
Mauritius using the bounds testing methodology for the period 1976-2010.In addition, a composite index is used to control for conditional factors.The index comprises measures of human capital, public infrastructure,financial development, and trade openness. As regards trade openness,difference is made between services trade and merchandise trade. Amongthe measures of capital formation, positive and significant effects arereported for FDI, whereby a percentage point increase in FDI contributes0.17 per cent to long-run economic growth. Moreover, the impact of privatecapital formation on economic growth is positive but insignificant, and thatof public capital formation is negatively insignificant. This study separatelytests for accelerator, or simply, the growth effects on public, private, andforeign capital formation. And, significant accelerator effect is establishedonly in the case of private capital formation. Finally, significant crowding-out is established from foreign to private capital formation. And, thecrowding-out hypothesis also holds from foreign to public capital formation,and vice-versa. However, insignificant crowding-out is detected betweenprivate and public capital formation. Among the conditional factors, humancapital stock, public infrastructure, financial development and trade areimportant contributors to economic growth.
Gangal and Gupta (2013) analyse the impact of public expenditure oneconomic growth of India from 1998 to 2012. This study includes annualdata of total public expenditure (TPE) and gross domestic product (GDP)per capita as an indicator of economic growth. ADF unit root test,cointegration test and Granger causality test techniques have been applied.The study reveals that there is linear stationarity in both the variables thatindicates the long-run equilibrium and there is a positive impact of totalpublic expenditure on economic growth. There is a unidirectional relationshipfrom TPE to GDP found by the Granger causality test.
Ugochukwu and Chinyere (2013) investigate the impact of capital formationon economic growth in Nigeria by employing ordinary least square (OLS)technique. To test for the properties of time series, Phillip-Perron test wasused to determine the stationarity of the variables and it was discoveredthat gross fixed capital formation and economic growth are integrated oforder zero (I(0)). Johansen cointegration test was employed to determinethe order of integration while error correction model was employed todetermine the speed of adjustment to equilibrium. The empirical findingssuggest that capital formation has positive and significant impact oneconomic growth in Nigeria for the period under review.
Mehrara and Maysam (2013) investigate the causal relationship betweengross domestic investment and GDP for the Middle East and North Africa
A Causality Analysis on the Empirical Nexus between Capital Formation and Economic Growth: Evidence from India
Rajagiri Management Journal 29

(MENA) region countries by using panel unit-root tests and panel cointegrationanalysis for the period 1970-2010. The results show a strong causality fromeconomic growth to investment in these countries. Yet, investment does nothave any significant effects on GDP in short- and long-run. It means that it isthe GDP that drives investment in these countries, and not vice versa. So thefindings of this paper support the point of view that it is higher economic growththat leads to higher investment.
Uneze (2013) examines the causal relationship between capital formation andeconomic growth in sub-Saharan African countries using panel cointegrationand causality testing techniques. It is found that causality is bi-directional,suggesting that higher economic growth leads to higher capital formation andthe increases in capital formation, in turn, results in higher economic growth.
Kanu and Ozurumba (2014) studied the impact of capital formation on theeconomic growth of Nigeria. It was ascertained that in the short run, grossfixed capital formation had no significant impact on economic growth; whilein the long-run, the VAR model estimate indicates that gross fixed capitalformation, total exports and the lagged values of GDP had positive long-runrelationships with economic growth in Nigeria. It was also ascertained thatthere exists an inverse relationship between imports, total national savings andeconomic growth; while GDP was seen to have a unidirectional causalrelationship with exports, gross fixed capital formation, imports and totalnational savings.
Shuaib and Dania (2015) examine the impact of capital formation on theeconomic development of Nigeria, using time series data from 1960 to 2013.The paper applied the Harrod-Domar model to Nigerian economic developmentmodel and tested if it has a significant relationship with the Nigerian economy.The paper explored various econometric and statistical methods to examine therelationship between capital formation and economic development. The papertested for stationarity and conducted different diagnostic tests of Nigeria’s timeseries data. From the empirical findings, it was discovered that there is asignificant relationship between capital formation and economic developmentin Nigeria. The results corroborated the Harrod-Domar model which provedthat the growth rate of national income will directly be related to saving ratioand capital formation, i.e., the more an economy is able to save and invest outof a given GNP, the greater will be the growth of that GDP.
Based on the review of the literature presented above, it can be concluded thatempirical findings for different countries are in line with the theoretical predictions.These studies explain whether there exist a positive or negative relationship
B. Venkatraja
Rajagiri Management Journal30

between capital formation and economic growth and also the strength ofrelationship, the direction of the cause-and-effect relationship etc., which have alot of policy implications for national governments. It is pertinent to note thatthough a good number of research studies focused on investigating the impact ofcapital accumulation on economic growth in countries of Asia, Africa, Americaand Europe, hardly there are any significant research contributions empiricallyanalyzing the causal relationship between capital formation and economic growthin India. Therefore, the present paper is an attempt in filling this vacuum.
3. Objectives
The main objective of this study is to explore the causal nexus between capitalaccumulation and economic growth in India. The specific objectives are:
To examine the dynamics of short-term linkages between capitalformation and economic growth.
To explore the presence of long-term equilibrium relationship betweencapital formation and economic growth.
To capture the linear interdependencies among the variables under study.
4. Methodology
4.1 Variables and Data
As the present study aims at exploring the causal relationship between capitalaccumulation and economic growth in the Indian context, capital formationand economic growth form the two main variables. Gross capital formation(GCF) and gross domestic product (GDP) are used as the proxies for capitalformation and economic growth respectively. The study uses the annual datafor the period from 1970 to 2013 which gives 44 annual observations. Allthe necessary data for the sample period are obtained from the secondarysources. Data are processed by applying econometric tools and techniquesfor facilitating further analysis through EViews econometric package.
4.2 Econometric Specification
The study has employed certain econometric tools and techniques foranalysing the relationship between the variables. The study consists of thefollowing steps:
A Causality Analysis on the Empirical Nexus between Capital Formation and Economic Growth: Evidence from India
Rajagiri Management Journal 31

Test the stationary of data Test the co-integration between the variables Fitting an error correction model if cointegration is established, and Test the causal relationship between the variables.
4.2.1 Test of Stationarity - Unit Root Test
Empirical work based on time series data assumes that the underlying timeseries is stationary. Broadly speaking a data series is said to be stationary ifits mean and variance are constant over time and the value of covariancebetween two time periods depends only on the distance or lag between thetwo time periods and not on the actual time at which the covariance iscomputed (Gujarati & Sangeetha, 2007). The present study investigateswhether GDP and GCF series are stationary by applying the unit root test.
An empirical way of checking the stationarity of the time series is by applyingunit root test. It has become widely popular test of stationarity over the pastseveral years. Stationarity condition has been tested using augmentedDickey-Fuller (ADF) method. ADF test is the modified version of Dickey-Fuller(DF) test. ADF makes a parametric correction in the original DF test forhigher order correlation by adding lagged difference terms of the dependentvariable to the right hand side of the regression. The ADF test, in the presentstudy, consists of estimating the following regression.
Yt represents the series to be tested, bo is the intercept term, is the coefficientof the lagged value of Yt, µ1 is the parameter of the augmented lagged firstdifference of the dependent variable, Yt-i represents the i th order autoregressiveprocess, et is the white noise error term. The number of lagged differenceterms to include is determined empirically, the idea being to include enoughterms so that the error term is serially uncorrelated (Gujarathi & Sangeetha,2007).
The stationary condition under ADF test requires that the probability (p)value is less than 1 (IpI<1). Another way of stating the same is that the computedt-value should be more negative than the critical t-value (t-statistic <critical value). The computed t-statistic will have a negative sign and largenegative t-value is generally an indication of stationarity (Gujarathi & Sangeetha,2007).
B. Venkatraja
Rajagiri Management Journal32
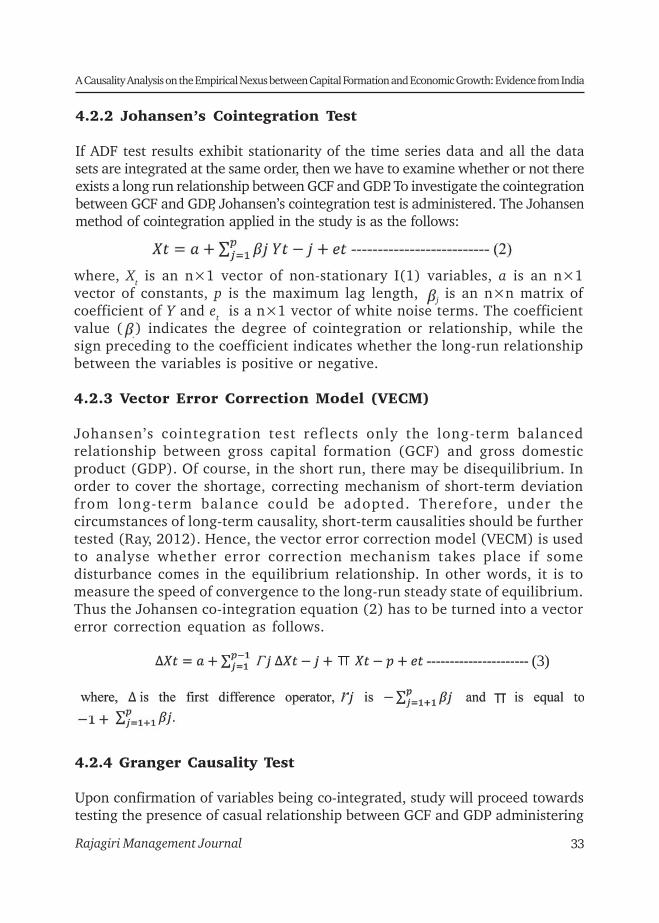
4.2.2 Johansen’s Cointegration Test
If ADF test results exhibit stationarity of the time series data and all the datasets are integrated at the same order, then we have to examine whether or not thereexists a long run relationship between GCF and GDP. To investigate the cointegrationbetween GCF and GDP, Johansen’s cointegration test is administered. The Johansenmethod of cointegration applied in the study is as the follows:
where, Xt is an n×1 vector of non-stationary I(1) variables, a is an n×1vector of constants, p is the maximum lag length, j is an n×n matrix ofcoefficient of Y and et is a n×1 vector of white noise terms. The coefficientvalue ( ) indicates the degree of cointegration or relationship, while thesign preceding to the coefficient indicates whether the long-run relationshipbetween the variables is positive or negative.
4.2.3 Vector Error Correction Model (VECM)
Johansen’s cointegration test reflects only the long-term balancedrelationship between gross capital formation (GCF) and gross domesticproduct (GDP). Of course, in the short run, there may be disequilibrium. Inorder to cover the shortage, correcting mechanism of short-term deviationfrom long-term balance could be adopted. Therefore, under thecircumstances of long-term causality, short-term causalities should be furthertested (Ray, 2012). Hence, the vector error correction model (VECM) is usedto analyse whether error correction mechanism takes place if somedisturbance comes in the equilibrium relationship. In other words, it is tomeasure the speed of convergence to the long-run steady state of equilibrium.Thus the Johansen co-integration equation (2) has to be turned into a vectorerror correction equation as follows.
4.2.4 Granger Causality Test
Upon confirmation of variables being co-integrated, study will proceed towardstesting the presence of casual relationship between GCF and GDP administering
A Causality Analysis on the Empirical Nexus between Capital Formation and Economic Growth: Evidence from India
Rajagiri Management Journal 33
(3)
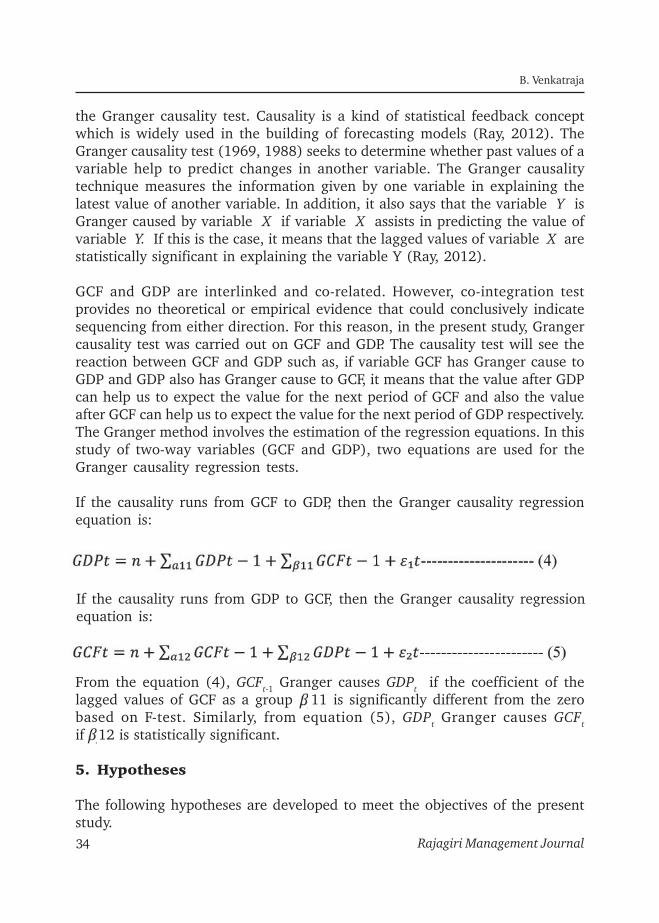
If the causality runs from GDP to GCF, then the Granger causality regressionequation is:
From the equation (4), GCFt-1 Granger causes GDPt if the coefficient of thelagged values of GCF as a group 11 is significantly different from the zerobased on F-test. Similarly, from equation (5), GDPt Granger causes GCFtif 12 is statistically significant.
5. Hypotheses
The following hypotheses are developed to meet the objectives of the presentstudy.
the Granger causality test. Causality is a kind of statistical feedback conceptwhich is widely used in the building of forecasting models (Ray, 2012). TheGranger causality test (1969, 1988) seeks to determine whether past values of avariable help to predict changes in another variable. The Granger causalitytechnique measures the information given by one variable in explaining thelatest value of another variable. In addition, it also says that the variable Y isGranger caused by variable X if variable X assists in predicting the value ofvariable Y. If this is the case, it means that the lagged values of variable X arestatistically significant in explaining the variable Y (Ray, 2012).
GCF and GDP are interlinked and co-related. However, co-integration testprovides no theoretical or empirical evidence that could conclusively indicatesequencing from either direction. For this reason, in the present study, Grangercausality test was carried out on GCF and GDP. The causality test will see thereaction between GCF and GDP such as, if variable GCF has Granger cause toGDP and GDP also has Granger cause to GCF, it means that the value after GDPcan help us to expect the value for the next period of GCF and also the valueafter GCF can help us to expect the value for the next period of GDP respectively.The Granger method involves the estimation of the regression equations. In thisstudy of two-way variables (GCF and GDP), two equations are used for theGranger causality regression tests.
If the causality runs from GCF to GDP, then the Granger causality regressionequation is:
B. Venkatraja
Rajagiri Management Journal34

Parti- GCF GDP
culars t-stati- Critical Value p-value t-stati- Critical Value p-valuestic stic
1% -3.605593 1% -3.605593 0.9743
At level -0.801132 5% -2.936942 0.8079 -0.279363 5% -2.936942
10% -2.606857 10% -2.606857
At 1st1% -3.596616 1% -3.605593 0.0497
difference -3.603060 5% -2.933158 0.0038 -4.235106 5% -2.936942
10% -2.604867 10% -2.606857
The results of ADF unit root test show that both variables under study, namelyGDP and GCF, did not attain stationarity at level (I (0)). However, after firstdifferencing (I (1)), both the variables become stationary. The results indi-cate that the null hypotheses H1(GCF has a unit root) and H2(GDP has a unitroot) can be rejected as the t-statistic value is smaller than the ADF criticalvalue at first difference (I (1)) at 1% level of significance. That is, in case ofGCF the t-value is -3.603, which is lower than calculated ADF critical value(-3.596), at 1% level of significance. Even in respect of GDP the t-value (-4.235) is smaller to the computed ADF critical value (-3.605) at 1% level ofsignificance. Hence, one can conclude that GDP and GCF time series arestationary at first difference (I(1)) in ADF test. In other words, GDP andGCF time series data do not have any unit root problem and hence, they canbe taken up for testing the presence of cointegration.
H1: GCF has a unit rootH2: GDP has a unit rootH3: There is no co-integration between GCF and GDPH4: GDP does not Granger cause GCFH5: GCF does not Granger cause GDP
6. Results and Discussion
In order to test whether there exists any cointegration and causality betweengross domestic product (GDP) and gross capital formation (GCF), the pre-condition is that the time series data pertaining to both the variables arestationary and do not encounter unit root problem. For this purpose ADF unitroot test is administered and the results are presented in Table 1.
Table 1: ADF Unit Root Test for GCF and GDP
A Causality Analysis on the Empirical Nexus between Capital Formation and Economic Growth: Evidence from India
Rajagiri Management Journal 35
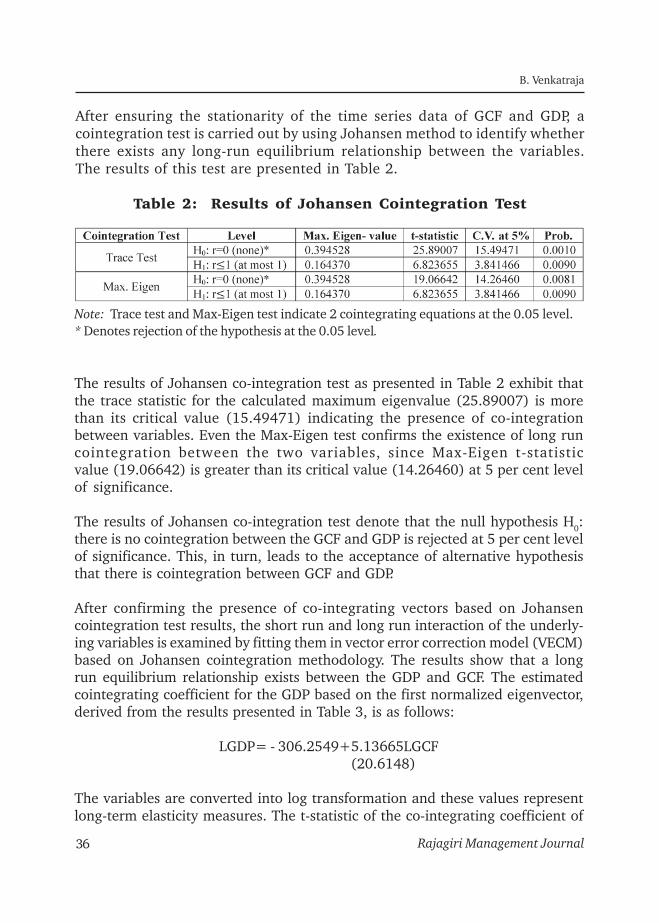
After ensuring the stationarity of the time series data of GCF and GDP, acointegration test is carried out by using Johansen method to identify whetherthere exists any long-run equilibrium relationship between the variables.The results of this test are presented in Table 2.
Table 2: Results of Johansen Cointegration Test
Note: Trace test and Max-Eigen test indicate 2 cointegrating equations at the 0.05 level.* Denotes rejection of the hypothesis at the 0.05 level.
The results of Johansen co-integration test as presented in Table 2 exhibit thatthe trace statistic for the calculated maximum eigenvalue (25.89007) is morethan its critical value (15.49471) indicating the presence of co-integrationbetween variables. Even the Max-Eigen test confirms the existence of long runcointegration between the two variables, since Max-Eigen t-statisticvalue (19.06642) is greater than its critical value (14.26460) at 5 per cent levelof significance.
The results of Johansen co-integration test denote that the null hypothesis H0:there is no cointegration between the GCF and GDP is rejected at 5 per cent levelof significance. This, in turn, leads to the acceptance of alternative hypothesisthat there is cointegration between GCF and GDP.
After confirming the presence of co-integrating vectors based on Johansencointegration test results, the short run and long run interaction of the underly-ing variables is examined by fitting them in vector error correction model (VECM)based on Johansen cointegration methodology. The results show that a longrun equilibrium relationship exists between the GDP and GCF. The estimatedcointegrating coefficient for the GDP based on the first normalized eigenvector,derived from the results presented in Table 3, is as follows:
LGDP= - 306.2549+5.13665LGCF (20.6148)
The variables are converted into log transformation and these values representlong-term elasticity measures. The t-statistic of the co-integrating coefficient of
B. Venkatraja
Rajagiri Management Journal36
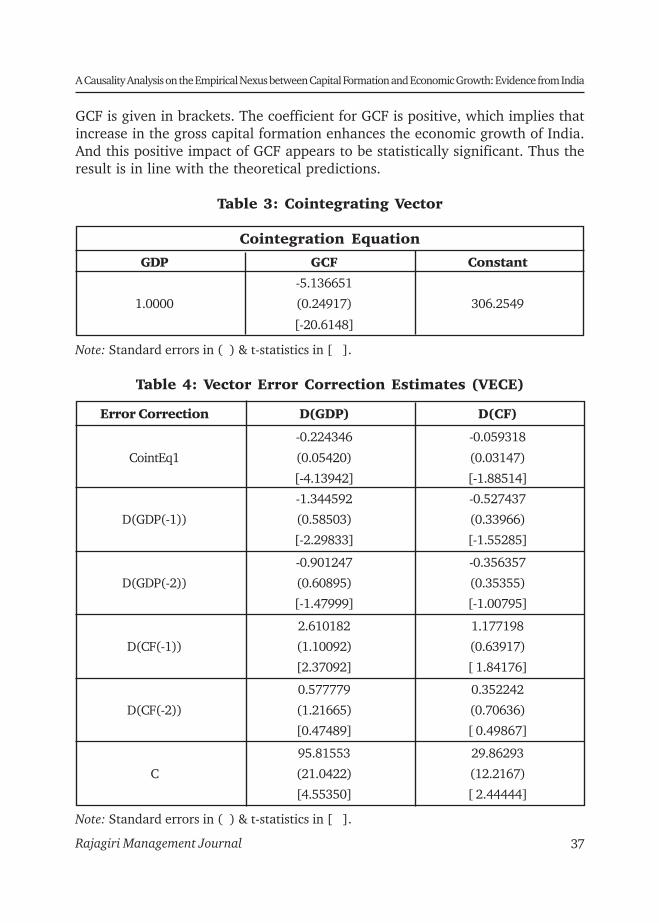
GCF is given in brackets. The coefficient for GCF is positive, which implies thatincrease in the gross capital formation enhances the economic growth of India.And this positive impact of GCF appears to be statistically significant. Thus theresult is in line with the theoretical predictions.
Table 3: Cointegrating Vector
Cointegration Equation
GDP GCF Constant
-5.136651
1.0000 (0.24917) 306.2549
[-20.6148]
Note: Standard errors in ( ) & t-statistics in [ ].
Table 4: Vector Error Correction Estimates (VECE)
Error Correction D(GDP) D(CF)
-0.224346 -0.059318
CointEq1 (0.05420) (0.03147)
[-4.13942] [-1.88514]
-1.344592 -0.527437
D(GDP(-1)) (0.58503) (0.33966)
[-2.29833] [-1.55285]
-0.901247 -0.356357
D(GDP(-2)) (0.60895) (0.35355)
[-1.47999] [-1.00795]
2.610182 1.177198
D(CF(-1)) (1.10092) (0.63917)
[2.37092] [ 1.84176]
0.577779 0.352242
D(CF(-2)) (1.21665) (0.70636)
[0.47489] [ 0.49867]
95.81553 29.86293
C (21.0422) (12.2167)
[4.55350] [ 2.44444]
Note: Standard errors in ( ) & t-statistics in [ ].
A Causality Analysis on the Empirical Nexus between Capital Formation and Economic Growth: Evidence from India
Rajagiri Management Journal 37

The coefficient of error correction term (ECT), as shown in Table 4, isnegative (-0.224346) and statistically significant at 5 per cent level ofsignificance, indicated by greater t-statistic value (4.13942) than criticalvalue (1.96) at 5 per cent level. This implies that GDP do respondsignificantly to re-establish the equilibrium relationship once deviationoccurs. Thus the statistically significant negative ECT confirms the long-run equilibrium relation between GDP and GCF. The significant negativesign of relation between GDP and GCF reflects a healthy convergence rateto equilibrium point per period. From the results presented in the Table 4,it could be inferred that GDP will converge towards its long-run equilibriumafter the change in GCF at lag 1. Thus, the value of next year’s GDP isinfluenced to a higher degree by the current year’s GCF and this predictionappears to be accurate by 95 per cent.
The results also show that the change in the GCF is not influenced muchby the lagged value of GDP. Therefore, VECM results confirm that GDPconverges toward its long-run equilibrium after the change in GCF at lag1. Thus, from this it is found that capital formation has significant positiveimpact on economic growth process of Indian economy.
As the Johansen cointegration test exhibits only the presence of long-runequilibrium relationship between GCF and GDP, pairwise Granger causalitytest is applied to capture the degree and direction of relationship betweenthe two variables under study. The results of Granger causality test arepresented in Table 5.
Table 5: Results of Granger Causality Test
Null Hypotheses Observations F-statistic Probability Decision
GDP does notGranger cause GCF 36 6.23944 0.0005 Reject
GCF does notGranger cause GDP 36 6.07513 0.0006 Reject
From the results it appears that there exists causality between GCF and GDP.The test explores bidirectional causality between the two variables. Thecausality runs from GCF to GDP and from GDP to GCF. It means that thevalue after GCF can help us to expect the value for the next period of GDP
B. Venkatraja
Rajagiri Management Journal38

and also the value after GDP can help us to expect the value for the nextperiod of GCF. Hence, GDP is Granger caused by GCF and GCF is Grangercaused by GDP. Based on the results of Granger causality test, F-statistic valuesare significant and hence, null hypotheses (H4: GDP does not Granger causeGCF and H5: GCF does not Granger cause GDP) are rejected. This leads to theconclusion that capital formation Granger cause economic growth andeconomic growth also Granger cause capital formation. Therefore, capitalformation and economic growth are mutually correlated in India.
7. Summary and Findings
The paper examines the relationship between capital formation and economicgrowth in India using annual data over the period 1970 to 2013. The unitroot properties of the time series data were assessed using ADF test afterwhich the cointegration and causality tests were conducted. The vector errorcorrection model was also estimated in order to examine the short-rundynamics. The major findings of this study are the following:
Based on the results of unit root test, the null hypotheses that thereexist unit root problem in GCF and GDP time series data are rejected.The unit root test ensured that both GCF and GDP are stationary atfirst difference [I(1)] in case of augmented Dickey Fuller (ADF) test.
The Johansen cointegration test confirmed that economic growthand capital formation are cointegrated, indicating an existence oflong-run equilibrium relationship between the two. The trace testunder Johansen cointegration method indicates two cointegratingequations at 5 per cent level of significance.
The normalized cointegrating equation derived from the VECMindicates that capital formation has profound positive impact on GDP.This long-run positive relationship is tested statistically significantby a negative coefficient of the error correction term.
The Granger causality test results revealed the presence ofbidirectional causality. It suggests that GDP does Granger cause GCFand GCF does Granger cause GDP. Thus, the causality runs from GCFto GDP and from GDP to GCF indicating that, in Indian economy,high economic growth leads to high capital formation and, in turn,high capital formation drives economic growth.
A Causality Analysis on the Empirical Nexus between Capital Formation and Economic Growth: Evidence from India
Rajagiri Management Journal 39
8. Conclusion
The study reveals bidirectional causality between capital formation andeconomic growth in India and these results have significant policyimplications. It is imperative for the national government to create pre-conditions for capital accumulation. Firstly, fiscal and monetary measuresmust encourage households and business community to save more.Secondly, banking services should be made available in every village so asto promote rural savings and mobilize their savings. Thirdly, a liberal andcompetitive investment climate should be created so that savings mobilizedby the banks will channel towards investment in the creation of morecapital assets such as physical capital, human capital and technology. Thisimproves the potential for productivity growth. The onus of providing veryconducive environment for capital formation is on the government.Agricultural sector, manufacturing sector and services sectors as well couldgain from strongly-built capital assets. Therefore, it is imperative for theGovernment of India to frame a policy for encouraging public, privateand foreign investment in such areas of the economy which would enhancesectoral capital formation, and, in turn, driving inclusive economic growth.
As the results of the VECM test reveal that economic growth of India isinfluenced by the capital formation of the previous year, key policy measuresfocusing on developing infrastructure, improving human resource qualitythrough health, education and sanitation, mechanization of all spheres ofeconomic activities should be drafted by the government. These steps wouldspeed up the process of development and, in turn, would attract foreigndirect investment and absorb more domestic savings into investment.Hence, the liberalized savings and investment policy on the one hand, andinclusive growth policy on the other, will have profound positive andcomplementarity effect on each other to augment the process of wellbeingin the country.
References
Athukorala, Prem-Chandra & Sen K. (2002). Saving, investment and growth in India,New Delhi: Oxford University Press.
Bakare, A.S. (2010). A theoretical analysis of capital formation and growth in Nigeria.Far East Journal of Psychology and Business, 3(1), 12-24.
Ben-David, D. (1998). Convergence clubs and subsistence economies. Journal ofDevelopment Economics, 55, 155-171.
B. Venkatraja
Rajagiri Management Journal40
Calderón, Cesar & Liu, Lin (2003). The direction of causality between financialdevelopment and economic growth. Journal of Development Economics, 72, 321–334.
Collier, P. & Gunning, J.W. (1999). Explaining African economic performance. Journalof Economic Literature, 37, March, 64-111.
Galbis, V. (1979). Money, investment, and growth in Latin America. EconomicDevelopment and Cultural Change, 27(3), 423-443.
Gangal, L.N. Vijay & Gupta, Honey (2013). Public expenditure and economic growth:A case study of India. Global Journal of Management and Business Studies, 3(2),191-196.
Ghura, D. & Hadji Michael, T. (1996). Growth in sub-Saharan Africa. Staff Papers,International Monetary Fund, 43, September.
Granger, C.W. J. (1969). Investigating causal relations by econometric models andcross spectral methods. Econometrica, 37, 424-438, accessible at: http://dx.doi.org/10.2307/1912791.
Gujrati,N.Damodar & Sangeetha (2007). Basic econometrics. New Delhi: Tata McGraw-Hill Publishing Company Limited, 4th Ed.
Herandez-Cata, E. (2000). Raising growth and investment in sub-Saharan Africa: Whatcan be done? Policy Discussion Paper: PDP/00/4, International Monetary Fund,Washington, D .C.
Hussin, Fauzi & Saidin, Nooraini (2012). Economic growth in ASEAN-4 countries: Apanel data analysis. International Journal of Economics and Finance, 4(9), 119-129. Also available at: http://dx.doi.org/10.5539/ijef.v4n9, p119.
Jorgenson, Dale & Hall, Robert E. (1967). Tax policy and investment behavior. AmericanEconomic Review, 57, Available at http: //www.stanford.edu/~rehall/Tax-Policy-AER-June-1967.pdf.
Joshi, H. (2007). The role of domestic savings and foreign capital flows in capitalformation in India, RBI Occasional Papers, 28 (3).
Keynes, John Maynard. (1936). The general theory of employment, interest and money.London: Macmillan.
Kanu, Success Ikechi & Ozurumba, Benedict Anayochukwu (2014). Capital formationand economic growth in Nigeria. Global Journal of Human-Social Science:Economics, 14(4), 43-58.
Khan, M.S. & Reinhart, C.M. (1990). Private investment and economic growth indeveloping countries. World Development, 18 (1), 19-27.
A Causality Analysis on the Empirical Nexus between Capital Formation and Economic Growth: Evidence from India
Rajagiri Management Journal 41
Mehta, Rekha. (2011). Short-run and long-run relationship between capital formationand economic growth in India. IJMT, 19(2), 170-180.
Mehrara , Mohsen & MaysamMusai (2013). The causality between capital formationand economic growth in MENA Region. International Letters of Social and HumanisticSciences, 8, 1-7.
Ndikumana, L. (2000). Financial determinants of domestic investment in sub-SaharanAfrica. World Development, 28 (2), 381-400.
NitiAyog website. Planning Commission Achieves.
Nowbutsing, Bhissum (2012). Capital formation and economic growth in Mauritius:Does FDI matter?. Retrieved fromhttp://sites.uom.ac.mu/wtochair/images/stories/cProceedings12 Bhissum_Nowbutsing_Paper_WTO_Capital_Formation_and_Economic_Growth_in_Mauritius_Does_FDI_matter.pdf. Retrieved on 23.05.2015.
Ray, Sarbapriya (2012). Impact of foreign direct investment on economic growth inIndia: A Co integration Analysis. Advances in Information Technology andManagement (AITM) 2(1), 187-201.
Reserve Bank of India. (2014). Handbook of statistics on indian economy, Retrievedfrom: http://www.rbi.org.in/scripts/AnnualPublications.aspx?head=Handbook%20of%20Statistics%20on%20Indian%20Economy.
Shuaib, I. M & Dania, Evelyn Ndidi (2015). Capital formation: Impact on the economicdevelopment of Nigeria 1960-2013. European Journal of Business,Economics andAccountancy, 3(3), 23-40.
Tobin, James. (1969). A general equilibrium approach to monetary theory. Journal ofMoney, Credit and Banking, 1(1), 15-29. Also available at: http://www.jstor.org/stable/1991374.
Ugochukwu, Ugwuegbe S. & Chinyere, Uruakpa Peter (2013). The impact of capitalformation on the growth of Nigerian economy. Research Journal of Finance andAccounting, 4(9), 36-42.
Uneze, Eberechukwu (2013). The relation between capital formation and economicgrowth: Evidence from sub-Saharan African countries. Journal of Economic PolicyReform, 16 (3), 272-286.
Verma, R, Wilson, E. & Pahlavani, M. (2007). The role of capital formation and savingin promoting economic growth in Iran. Middle East Business and Economic Review,19(1), 8-22. Retrieved from http://ro.uow.edu.au/commpapers/454.
B. Venkatraja
Rajagiri Management Journal42

1 Assistant Professor, Rajagiri Centre for Business Studies, Kochi. E-mail: [email protected]
Rajagiri Management JournalVolume 9, Issue 1, June 2015
Overconfidence, Risk Tolerance andInvestment Strategy:
A Study of Capital Market Investors inIndia
Minimol M. C.1
Abstract
Traditional finance theories postulate that capital markets areefficient and that investors are rational. Markowitz, Fama andSamuelson pioneered thinking in traditional finance in the fiftiesand sixties. Later on, objections were raised on the assumptionof rationality of investors. One actual behavioural trait exhibitedby investors, which is far from being rational, is overconfidence.The present paper investigates the existence of overconfidenceamong investors, their risk tolerance levels and their impact oninvestment strategies adopted by them. The study showedsignificant levels of overconfidence that can impact investors’strategy. Investors do fall into very distinctive categories of risktolerance levels. They can be risk taking and risk averse, butmajority are risk neutral. Investors can have distinctive levels ofrisk attitude/tolerance and overconfidence, but it is found thattheir risk attitude does not impact or determine theiroverconfidence.
Keywords: Traditional finance, Behavioural finance,Overconfidence, Risk tolerance.

1. Introduction
The primary role of the capital market in any economy is to ensuremobilization of capital and its allocation to various productive avenues inan efficient manner. Firms should be able to make appropriate productionand investment decisions as well. All market participants make theirinvestment decisions on information gathered from various sources. Anindividual, investing in stocks of firms, would attempt to minimize risksand maximize returns. In the traditional approach to decisions oninvestments and stock portfolio selection, investors were expected to followa framework based on expected performance of investments and his riskappetite. This foundation later came to be referred to as the modern portfoliotheory (Markowitz, 1952).
For an investor going for an investment in a stock, his future risks and returnsdepend largely on two things: one, the future trends in stock price, and two,the price he pays for the purchase. This inevitably raises two questions: one,whether the purchase price paid by the investor is correct and two, whetherthe future price trends can be predicted accurately. The concept of efficient-market hypothesis has been extensively used to provide answer to the firstquestion. Prices at any time in the market fully reflect all availableinformation on the stock, provided the capital markets are efficient. Thus,prices paid by investors are always correct, thereby, making it impossible toconsistently generate above normal trading gains. Empirical evidence isscarce to reject efficiency of markets (Fama, 1965). As to the second question,there have been arguments and counter-arguments regarding whether thepast history of a stock’s price can be effectively used to accurately predictthe future price of the stock. Many chartist theories, assuming that pastbehaviour of a stock price is rich in information content of its futurebehaviour, postulate that future prices can be predicted. History repeats itselfso that patterns in past prices repeat in the future, thus facilitating betterinvestment decisions and better returns. The theory of random walk is incomplete contrast with the chartist’s assumptions (Fama, 1970).
In competitive markets, prices display changes over time that takes the formof a random walk, with no predictable bias. It means that if prices areproperly anticipated, next period’s price differences are uncorrelated with,or completely independent of, previous period’s price differences. If numeroussequences of prices are observed, it will turn out that, on an average, there
Minimol M. C.
Rajagiri Management Journal44

exists no upward or downward shift anywhere. This means one thing – thereis no way of making profits by extrapolating past changes in prices by chartsor by mathematics (Samuelson, 1965).
Fallacy of Traditional Finance
Traditional finance theories that have attempted to define investmentdecisions are primarily normative in nature. They define a prescribedbehaviour that the investors should ideally follow to construct a portfolio,rather than a behaviour that is actually followed (Fabozzi, Gupta &Markowitz, 2002). This raises the question on whether investors are reallyrational. This is because, where it is postulated on one hand that capitalmarkets are efficient to reflect true and fair prices, irrational investors onthe other hand can thwart the correct prices. They can cause the marketprices to move away from the fair price. The simplest description of humanbehaviour would assume that people are motivated by self-interest and canbe calculating when valuable opportunities arise, learning from others’success. It does not mean that investors can be irrational or thoughtless. Itimplies that investors can be biased by various external social influences,perceptive skills and simplified thumb rules in their decision making(Andreassen, 1993).
Irrational investors can cause price deviations in the short-run (bring downprices by selling, being pessimistic), but rational investors, stepping in, wouldcorrect the prices immediately (bring up prices by buying, being optimisticand seeing opportunity to buy at low prices) (Friedman, 1953). But thisargument has suffered theoretical criticisms. Strategies adopted by rationalinvestors to correct prices can be very risky and costly, making it ineffectiveto practice. Thus, mispricing remains unchallenged, casting serious doubtson market efficiency (Barberis & Thaler, 2002).
A number of studies in the field of behavioural finance empirically haveshown that overconfidence influences the investment strategies adopted byinvestors. However, such studies are done mostly in Western countries andnot in the Indian context. Therefore, the present study intends to analyzethe levels of overconfidence exhibited by equity investors in India andunderstand the relationship between overconfidence and investment strategy.
Overconfidence, Risk Tolerance and Investment Strategy : A Study of Capital Market Investors in India
Rajagiri Management Journal 45
The attempt is to verify whether Indian investors are far from being rationalas is assumed by traditional finance theories. It is also intended to understandthe risk-taking capacity of investors that can influence the way they behavein the market. The role of overconfidence and risk capacity in guidinginvesting behaviour is also studied.
2. Literature Review
Review of literature is done in three areas: behavioural finance in general,overconfidence, and risk perception in investing.
2.1 Behavioural Finance
The fallacy of traditional or standard finance assuming rationality ofinvestors is that it ignores the emotional and cognitive weaknesses that affectthem (Statman, 1995). There are common investment mistakes that arecaused by these weaknesses. Traditional finance fails to address actualinvestment behaviour and its consequences (Baker & Nofsinger, 2001).Traditional finance can be very satisfying and simple only if its predictionsabout the market and investors are confirmed. Moreover, it has been provedover the years that market and investor behaviour cannot be easilyunderstood under the traditional framework. Behavioural finance is the newapproach to financial markets to respond to the difficulties faced by thetraditional framework. The new approach argues that many phenomena inthe financial markets can be better understood using models which acceptthat agents are not fully rational (Barberis & Thaler, 2002). It integratesclassical economics and finance with psychology and decision-makingsciences, attempting to explain two things – one, why anomalies have beenobserved in finance literature, and two, how investors systematically makeerrors in judgment. These errors or mental mistakes can cause investors toform biased expectations regarding the future, which in turn causes thesecurities to be mispriced (Fuller, 1998). There are investors who are proneto committing errors that can be minor or fatal, seriously damaging theirwealth (Shefrin, 2000). Such investors take risks that they do notacknowledge, experience outcomes that are not anticipated, commitunjustified trading, and end up blaming themselves or others for the outcome(Kahneman & Piepe, 1998). There has been extensive amount of work doneon the types of mistakes committed by investors, casting doubts over theexistence of rationality.
Minimol M. C.
Rajagiri Management Journal46
Investors can bias their investment decisions by having their judgment basedon stereotypes, causing them to buy stock that represents desirable qualities,rather than intrinsically good ones. In cognitive dissonance, investors maytend to reject or ignore their recollections or beliefs about the poor pastperformance of their investments and even try to remember that theirinvestments had performed better than what it actually did (Akerlof &Dickens, 1982). Investors can also be biased by their preference for stocksthat are more familiar to them, putting too much faith in them. They, forcingthemselves to believe that familiar stocks are better than even diversifiedportfolio, can excessively trade in such stocks. Familiarity bias can compelinvestors to prefer and buy stocks of firms that have a very local businesspresence (Huberman, 2001). Investors can tend to be affected by their swingsof mood in their analysis and judgment of investments. They can also sufferfrom optimism bias causing failure in critical investment analysis andignoring negative information on their stocks.
Fischer and Gerhardt (2007) identified the basic behavioural factors affectinginvestor as: fear, love, greed, optimism, herd instinct, the focus on the recentexperience, and overconfidence. Hon-Snir, Kudryavtsev, and Cohen (2012)examined five behavioural biases in decision-making process in the stockmarket and differences of possible individual solutions due to thesebehavioural deviations such as disposition effect, herd behaviour, availabilityheuristic, gambler’s fallacy and hot-hand fallacy. Bikas, Daiva, and Lina(2012), explained the psychological effects of investing activities. Gholizadehand Iraj (2013) identified meaningful relationship between behavioral biasessuch as, compatibility, familiar concept, realistic belief, fresh point,irreversibility and investment decisions among investors in Tehran stockmarket.
2.2 Overconfidence
Investors can also be misled to excessively believe in their capabilities ofselecting better-performing stocks. They can consider their knowledge ofstocks to be much better and their predictions of future markets to be moreaccurate. Overconfidence can also be very pervasive and act as a trap (Belsky& Gilovich, 1999). It can be said that investors also fall into the error ofwrongly interpreting information to confirm their prior beliefs particularlywhere they possess very limited capacity or experience to manage informationeffectively. Even in cases where investors had actually experienced setbacks
Overconfidence, Risk Tolerance and Investment Strategy : A Study of Capital Market Investors in India
Rajagiri Management Journal 47
in their stock investments, when they were asked, they were sure that thefuture expected returns of their portfolios would generate above-averagereturns (Baker & Nofsinger, 2002). Investors can overestimate the accuracyof the market information available to them and exhibit biases in the waythey interpret the information. They believe more in their valuation of stockand are less concerned about what others believe about the stock (Barber &Odean, 1999). It has also been proved that overconfidence in investors canlead to high levels of trading activity (Barber & Odean, 2001). Glaser andWeber (2007), tested the hypothesis that overconfident investors will trademore than rational investors by correlating individual overconfidence scoreswith several measures of trading volume of individual investors. Rostamiand Zohreh (2015) found out that there is a significant relationship betweenoverconfidence bias and investing in Tehran stock exchange.
2.3 Risk Perception
Risk is commonly defined in negative terms. It is used to denote theprobability of suffering losses, or having actions that involve unpredictabledangers. But when it comes to defining risk in finance and investments, itsimply refers to uncertainty of returns – the extent of variation that occursin the actual returns generated from the expected in the course of a particularchoice of investment decision (Andreassen, 1993). Under the concept ofrationality, risk in investments can include losses as well as gains, since it isnot the direction (up or down) of movement of returns, but the magnitudethat is important.
Risk and its evaluation are very important in the matter of investmentdecisions. Random variations in returns and its volatility make accuratepredictions of risk very difficult. Underestimation of risk can cause very poorinvestment decisions (Biais & Weber, 2008). Shafi, Muhammad, Mubashir,Imran, and Kashif (2011) suggested strong relationship between riskperception and investment decision.
2.4 Overconfidence, Risk Tolerance and Investment Strategy
Investors need not necessarily be always rational when it comes to decisionsabout their investments. It is also known that investors can be classified onthe basis of their risk tolerance levels. While some can be extremely averseto risk taking, there can be some who love it. Jauhari (2011) clustered the
Minimol M. C.
Rajagiri Management Journal48
behaviour of an Indian investor investing in various instruments into“fundamental perspective”, “acquaintance perspective”, “public perspective”,and “individual perspective”. Rakesh (2014) analysed the behaviour ofindividual investor in Indian stock market and concluded that investorsassimilate the objectives of saving, the factors influencing the saving, andthe sources of information for decision making.
Literature talks about overconfidence that can lead to irrational investmentdecisions. It also talks about the varying levels of risk tolerance amonginvestors which can cause changes in the investment strategy. But most ofthe studies in this regard are undertaken in Western countries. Most of thestudies on risk tolerance are undertaken from traditional-financeperspective, and not from the behavioural-finance perspective. Not muchstudies are undertaken on the relationship between risk tolerance andoverconfidence. There exist gaps in the literature pertaining to therelationship between overconfidence and investment strategy in the Indiancontext, risk tolerance and investment strategy from behavioural-financeperspective and relationship between risk tolerance and overconfidence.
3. The Scope of Study
The present study is undertaken in the framework of behavioural finance,which tries to establish the relationship between behavioural anomalies –overconfidence, risk tolerance and investment strategy. A number of studiesin the field of behavioural f inance, empirically have shown thatoverconfidence influences the investment strategies adopted by investors.However, such studies are done mostly in Western countries and not in theIndian context. Therefore, the present study intends to analyze the levels ofoverconfidence exhibited by equity investors in India and understand therelationship between overconfidence and investment strategy in India. Theattempt is to verify whether Indian investors are far from being rational asis being postulated in traditional finance theories. It is also intended tounderstand the risk-taking capacity of investors that can influence the waythey behave in the market. Thus, the role of overconfidence and risk-takingcapacity as guiding investing behaviour is studied.
3.1 Objectives of the Study
The following are the objectives of the present study:
Overconfidence, Risk Tolerance and Investment Strategy : A Study of Capital Market Investors in India
Rajagiri Management Journal 49
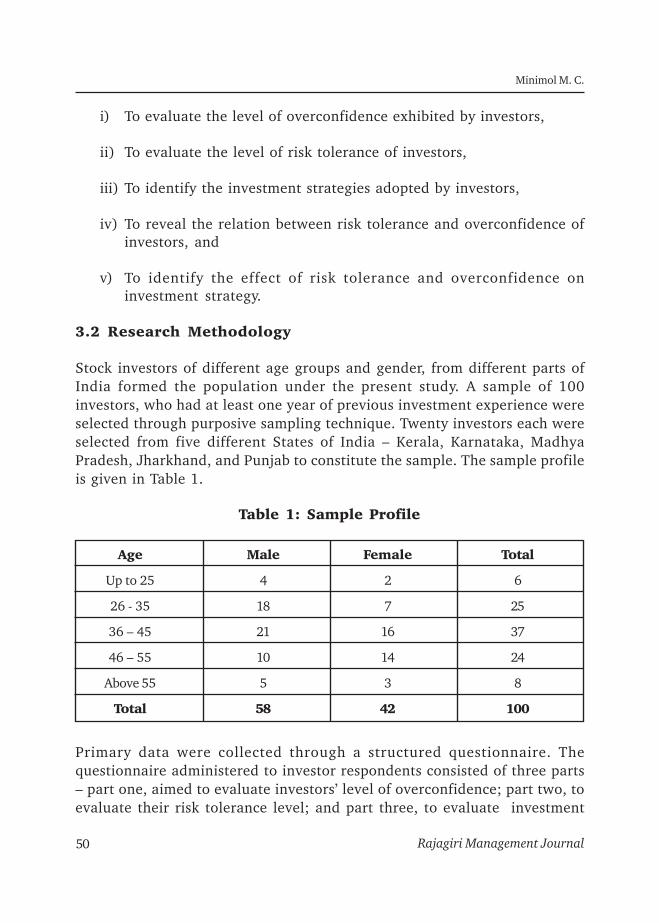
i) To evaluate the level of overconfidence exhibited by investors,
ii) To evaluate the level of risk tolerance of investors,
iii) To identify the investment strategies adopted by investors,
iv) To reveal the relation between risk tolerance and overconfidence ofinvestors, and
v) To identify the effect of risk tolerance and overconfidence oninvestment strategy.
3.2 Research Methodology
Stock investors of different age groups and gender, from different parts ofIndia formed the population under the present study. A sample of 100investors, who had at least one year of previous investment experience wereselected through purposive sampling technique. Twenty investors each wereselected from five different States of India – Kerala, Karnataka, MadhyaPradesh, Jharkhand, and Punjab to constitute the sample. The sample profileis given in Table 1.
Table 1: Sample Profile
Age Male Female Total
Up to 25 4 2 6
26 - 35 18 7 25
36 – 45 21 16 37
46 – 55 10 14 24
Above 55 5 3 8
Total 58 42 100
Primary data were collected through a structured questionnaire. Thequestionnaire administered to investor respondents consisted of three parts– part one, aimed to evaluate investors’ level of overconfidence; part two, toevaluate their risk tolerance level; and part three, to evaluate investment
Minimol M. C.
Rajagiri Management Journal50

strategies. The questionnaire was developed based on the variables -overconfidence, risk tolerance and investment strategies - identified fromprevious studies, contextualized into Indian scenario and finalized afterdiscussion with investment experts.
The questionnaire consisted of different statements pertaining to the threeparts mentioned above. The responses were marked on a five-point scale ofagreement to the given statements – highly disagree (HDA), disagree (DA),neutral (N), agree (A) and highly agree (HA). The scoring pattern ofresponses was like this: one for “highly disagree”, two for “disagree”, etc. onan ascending scale culminating with five for “highly agree”.
Reliability and validity of estimates were tested using different statisticaltools. Chronbach’s alpha estimate showed a value of 0.78 indicating highreliability. A pilot study was conducted among 25 per cent of the sample.Overconfidence was measured on the basis of respondents’ level of responsetowards the statements included in the questionnaire. The statements donot purport to directly measure the investors’ overconfidence in investments,rather overconfidence is considered as a natural behavioural anomaly, whichpreexist among investors who are essentially human, exposed or subjectedto fallibility. This view is drawn from the existing literature.
4. Results and Discussion
The results of the study are grouped into five parts. They are:
Part One: Overconfidence among Investors,
Part Two: Risk Tolerance among Investors,
Part Three: Relation between Levels of Risk Tolerance and Overconfidence,
Part Four: Investment Strategies, and
Part Five: Impact of Overconfidence and Risk Attitude on InvestmentStrategy Adoption.
Major findings of the study are given under the five headings below:
Overconfidence, Risk Tolerance and Investment Strategy : A Study of Capital Market Investors in India
Rajagiri Management Journal 51
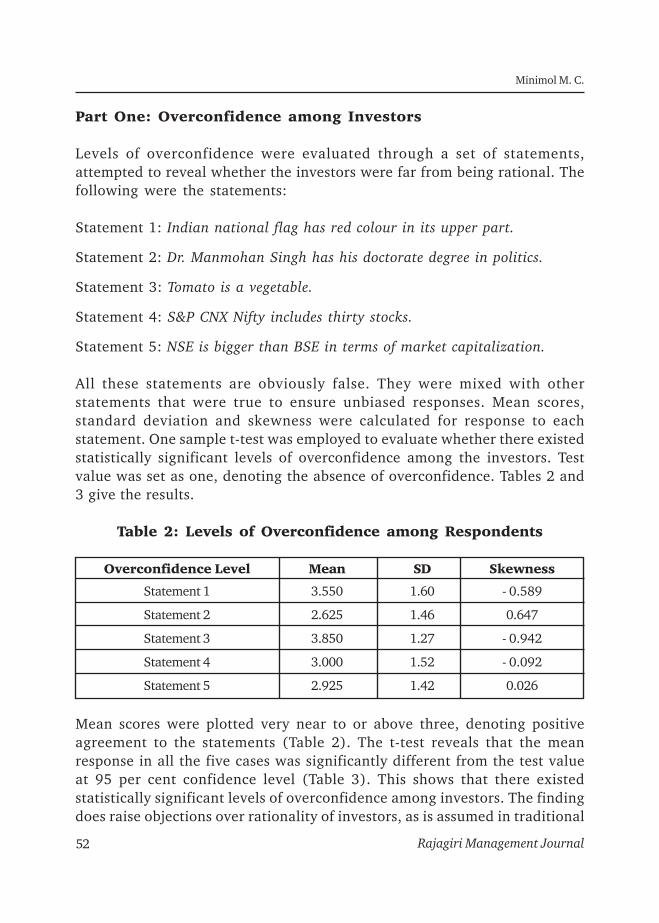
Mean scores were plotted very near to or above three, denoting positiveagreement to the statements (Table 2). The t-test reveals that the meanresponse in all the five cases was significantly different from the test valueat 95 per cent confidence level (Table 3). This shows that there existedstatistically significant levels of overconfidence among investors. The findingdoes raise objections over rationality of investors, as is assumed in traditional
Part One: Overconfidence among Investors
Levels of overconfidence were evaluated through a set of statements,attempted to reveal whether the investors were far from being rational. Thefollowing were the statements:
Statement 1: Indian national flag has red colour in its upper part.
Statement 2: Dr. Manmohan Singh has his doctorate degree in politics.
Statement 3: Tomato is a vegetable.
Statement 4: S&P CNX Nifty includes thirty stocks.
Statement 5: NSE is bigger than BSE in terms of market capitalization.
All these statements are obviously false. They were mixed with otherstatements that were true to ensure unbiased responses. Mean scores,standard deviation and skewness were calculated for response to eachstatement. One sample t-test was employed to evaluate whether there existedstatistically significant levels of overconfidence among the investors. Testvalue was set as one, denoting the absence of overconfidence. Tables 2 and3 give the results.
Table 2: Levels of Overconfidence among Respondents
Overconfidence Level Mean SD Skewness
Statement 1 3.550 1.60 - 0.589
Statement 2 2.625 1.46 0.647
Statement 3 3.850 1.27 - 0.942
Statement 4 3.000 1.52 - 0.092
Statement 5 2.925 1.42 0.026
Minimol M. C.
Rajagiri Management Journal52
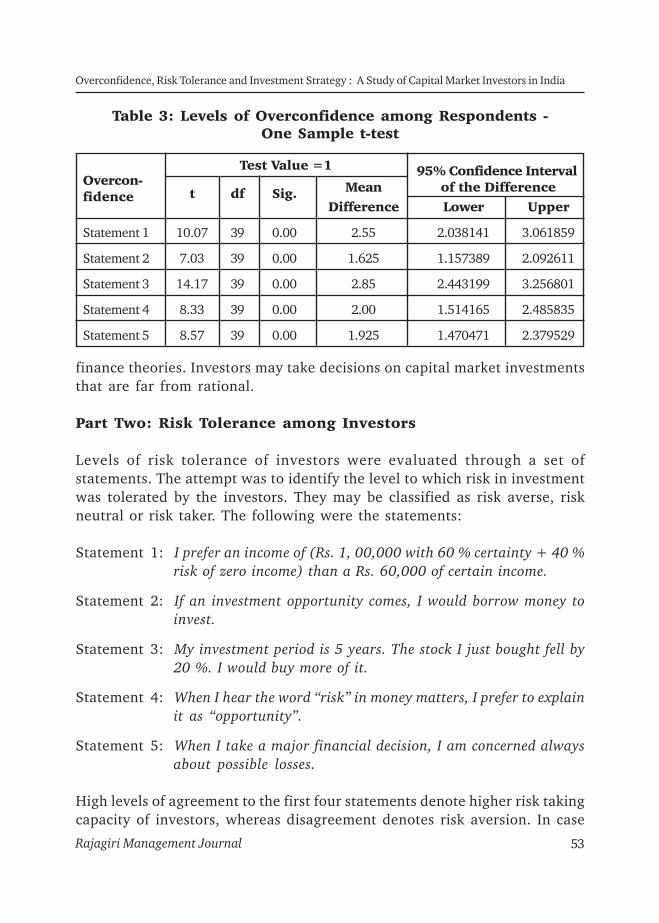
Table 3: Levels of Overconfidence among Respondents -One Sample t-test
Test Value =1 95% Confidence IntervalOvercon-
t df Sig. Mean of the Differencefidence
Difference Lower Upper
Statement 1 10.07 39 0.00 2.55 2.038141 3.061859
Statement 2 7.03 39 0.00 1.625 1.157389 2.092611
Statement 3 14.17 39 0.00 2.85 2.443199 3.256801
Statement 4 8.33 39 0.00 2.00 1.514165 2.485835
Statement 5 8.57 39 0.00 1.925 1.470471 2.379529
finance theories. Investors may take decisions on capital market investmentsthat are far from rational.
Part Two: Risk Tolerance among Investors
Levels of risk tolerance of investors were evaluated through a set ofstatements. The attempt was to identify the level to which risk in investmentwas tolerated by the investors. They may be classified as risk averse, riskneutral or risk taker. The following were the statements:
Statement 1: I prefer an income of (Rs. 1, 00,000 with 60 % certainty + 40 %risk of zero income) than a Rs. 60,000 of certain income.
Statement 2: If an investment opportunity comes, I would borrow money toinvest.
Statement 3: My investment period is 5 years. The stock I just bought fell by20 %. I would buy more of it.
Statement 4: When I hear the word “risk” in money matters, I prefer to explainit as “opportunity”.
Statement 5: When I take a major financial decision, I am concerned alwaysabout possible losses.
High levels of agreement to the first four statements denote higher risk takingcapacity of investors, whereas disagreement denotes risk aversion. In case
Overconfidence, Risk Tolerance and Investment Strategy : A Study of Capital Market Investors in India
Rajagiri Management Journal 53

On an average, investors exhibited substantial levels of risk neutral attitude,with mean scores hovering around three. Nearly sixty per cent of investorsexhibited risk neutral attitude, whereas as nearly twenty per cent eachexhibited risk aversion and risk taking attitude.
Part Three: Relation between Risk Tolerance and Overconfidence
It was attempted to establish the existence of relation or association thatexist between risk attitude and overconfidence of investors. It may beargued that risk takers are overconfident by nature. There is enoughempirical proof of investors overestimating their capacity of stockselect ion, performance of port fo l io and ass imi lat ion of marketinformation. If investors can be overconfident in their investmentdecisions, what drives it? Is it their risk tolerance levels that make investorsoverconfident? Can it be said that an investor who enjoys risk tends tounderestimate the intricacies of investments and overestimate theircapacity to outperform the market. To identify the existence of associationbetween risk attitude and overconfidence, Somers’ D test was performed.Table 5 gives the details.
of statement five, agreement denotes risk aversion and disagreement denoteshigher risk tolerance. These statements were mixed with other statementsto ensure unbiased response. Frequencies of responses give an indication ofrisk attitude of investors. Mean scores, standard deviation and skewnesswere calculated for response to each statement (Table 4).
Table 4: Risk Attitude among Respondents
Opinion of Respondents
Risk Attitude HDA DA N A HA Mean SD Skewness
Statement 1 5 28 13 38 18 3.350 1.210 - 0.269
Statement 2 30 15 20 33 3 2.625 1.295 - 0.066
Statement 3 3 23 20 45 10 3.375 1.030 - 0.387
Statement 4 3 20 25 45 8 3.350 0.975 - 0.427
Statement 5 13 55 13 18 3 2.425 1.010 0.766
Minimol M. C.
Rajagiri Management Journal54
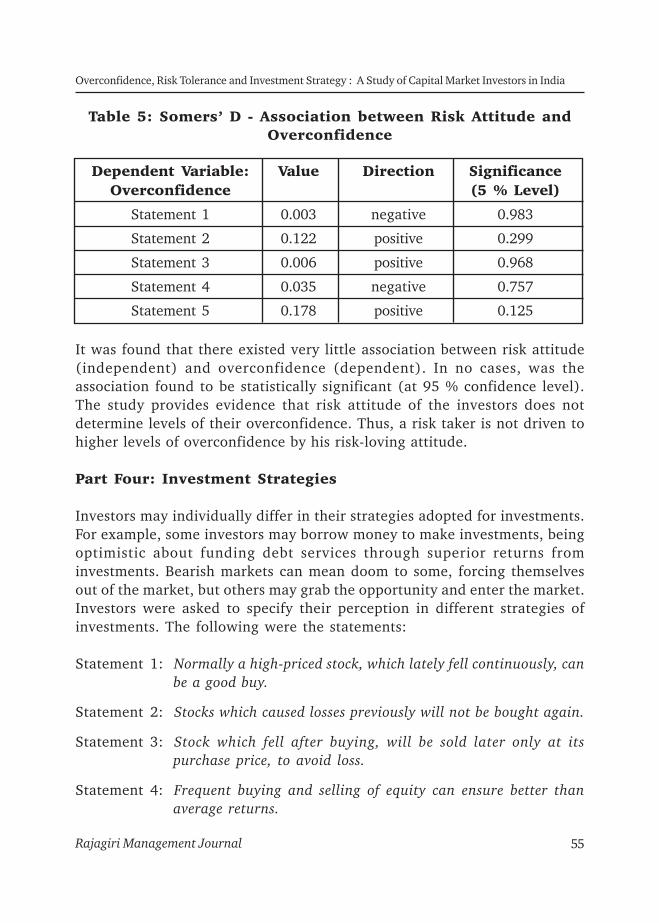
Dependent Variable: Value Direction SignificanceOverconfidence (5 % Level)
Statement 1 0.003 negative 0.983
Statement 2 0.122 positive 0.299
Statement 3 0.006 positive 0.968
Statement 4 0.035 negative 0.757
Statement 5 0.178 positive 0.125
It was found that there existed very little association between risk attitude(independent) and overconfidence (dependent). In no cases, was theassociation found to be statistically significant (at 95 % confidence level).The study provides evidence that risk attitude of the investors does notdetermine levels of their overconfidence. Thus, a risk taker is not driven tohigher levels of overconfidence by his risk-loving attitude.
Part Four: Investment Strategies
Investors may individually differ in their strategies adopted for investments.For example, some investors may borrow money to make investments, beingoptimistic about funding debt services through superior returns frominvestments. Bearish markets can mean doom to some, forcing themselvesout of the market, but others may grab the opportunity and enter the market.Investors were asked to specify their perception in different strategies ofinvestments. The following were the statements:
Statement 1: Normally a high-priced stock, which lately fell continuously, canbe a good buy.
Statement 2: Stocks which caused losses previously will not be bought again.
Statement 3: Stock which fell after buying, will be sold later only at itspurchase price, to avoid loss.
Statement 4: Frequent buying and selling of equity can ensure better thanaverage returns.
Table 5: Somers’ D - Association between Risk Attitude andOverconfidence
Overconfidence, Risk Tolerance and Investment Strategy : A Study of Capital Market Investors in India
Rajagiri Management Journal 55
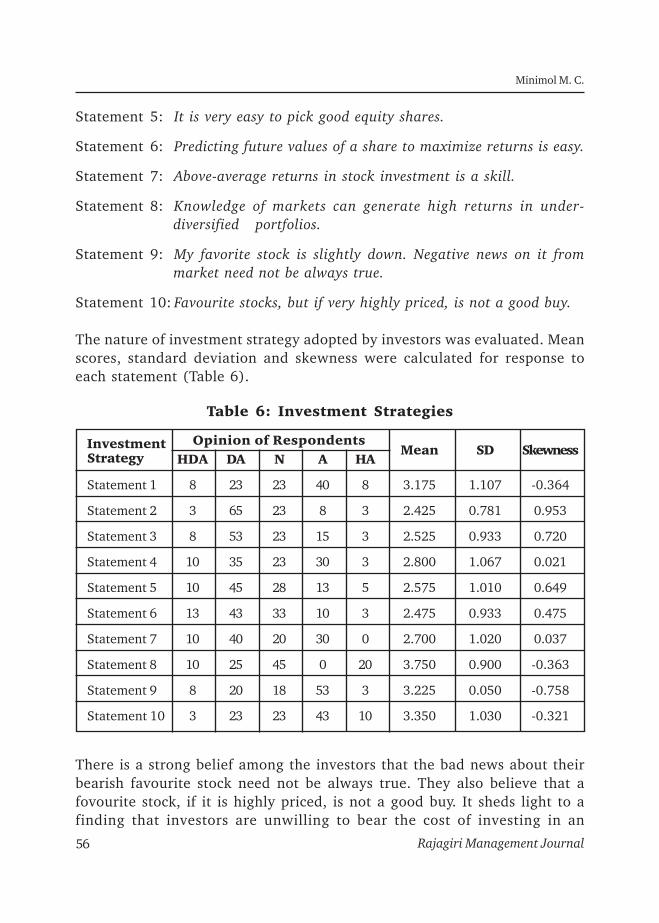
Table 6: Investment Strategies
Investment Opinion of RespondentsMean SD Skewness
Strategy HDA DA N A HA
Statement 1 8 23 23 40 8 3.175 1.107 -0.364
Statement 2 3 65 23 8 3 2.425 0.781 0.953
Statement 3 8 53 23 15 3 2.525 0.933 0.720
Statement 4 10 35 23 30 3 2.800 1.067 0.021
Statement 5 10 45 28 13 5 2.575 1.010 0.649
Statement 6 13 43 33 10 3 2.475 0.933 0.475
Statement 7 10 40 20 30 0 2.700 1.020 0.037
Statement 8 10 25 45 0 20 3.750 0.900 -0.363
Statement 9 8 20 18 53 3 3.225 0.050 -0.758
Statement 10 3 23 23 43 10 3.350 1.030 -0.321
There is a strong belief among the investors that the bad news about theirbearish favourite stock need not be always true. They also believe that afovourite stock, if it is highly priced, is not a good buy. It sheds light to afinding that investors are unwilling to bear the cost of investing in an
Statement 5: It is very easy to pick good equity shares.
Statement 6: Predicting future values of a share to maximize returns is easy.
Statement 7: Above-average returns in stock investment is a skill.
Statement 8: Knowledge of markets can generate high returns in under-diversified portfolios.
Statement 9: My favorite stock is slightly down. Negative news on it frommarket need not be always true.
Statement 10: Favourite stocks, but if very highly priced, is not a good buy.
The nature of investment strategy adopted by investors was evaluated. Meanscores, standard deviation and skewness were calculated for response toeach statement (Table 6).
Minimol M. C.
Rajagiri Management Journal56
expensive favourite stock, but on the other hand, they are willing to sufferlosses from holding on to their poor-performing favourite stock. There isalso solid belief among investors that an expensive stock can be a good buyin its bearish trend. Investors also believe that frequent reshuffling of portfoliocan increase returns and that generation of such higher returns is aninvestment skill.
Investors pursued a strategy of buying back stocks that previously had causedlosses. They also reported being ready to suffer temporary losses, by sellingoff a stock bought, if its price fell, after buying. It indicates that investorswere unwilling to hold on to a loss-making stock, but would buy it backlater at favourable prices. Investors found that picking the right stock wasnot very easy, and that it was difficult to predict future stock prices tomaximize returns.
Part Five: Effect of Overconfidence and Risk Attitude onInvestment Strategy
Attempt was made to identify whether the risk attitude and levels ofoverconfidence of investors impacted the investment strategies adopted byinvestors. For example, what makes an investor believe that a stock, whichwas sold off for making losses in portfolio previously, can be bought backlater? Is it his risk attitude or is it his overconfidence that makes him decideso? To identify the existence of impact of risk attitude and overconfidenceon adoption of investment strategies, a regression analysis was performed.Table 7 gives the results.
It is very important to note that the risk attitude of the investors does notimpact any of the decisions on investment strategies. None of the values arestatistically significant at 5 % level of significance. In contrast, it is foundthat overconfidence of investors did significantly impact the investmentstrategies adopted.
Investors belief that a normally high-priced stock in a bearish trend is agood buy was significantly (0.003 significance value) impacted by theiroverconfidence. Changes in overconfidence level (predictor) caused 47.2 percent of changes in their investment strategy of belief of good buy of bearishstock (dependent). Investors belief that frequent buying and selling can
Overconfidence, Risk Tolerance and Investment Strategy : A Study of Capital Market Investors in India
Rajagiri Management Journal 57
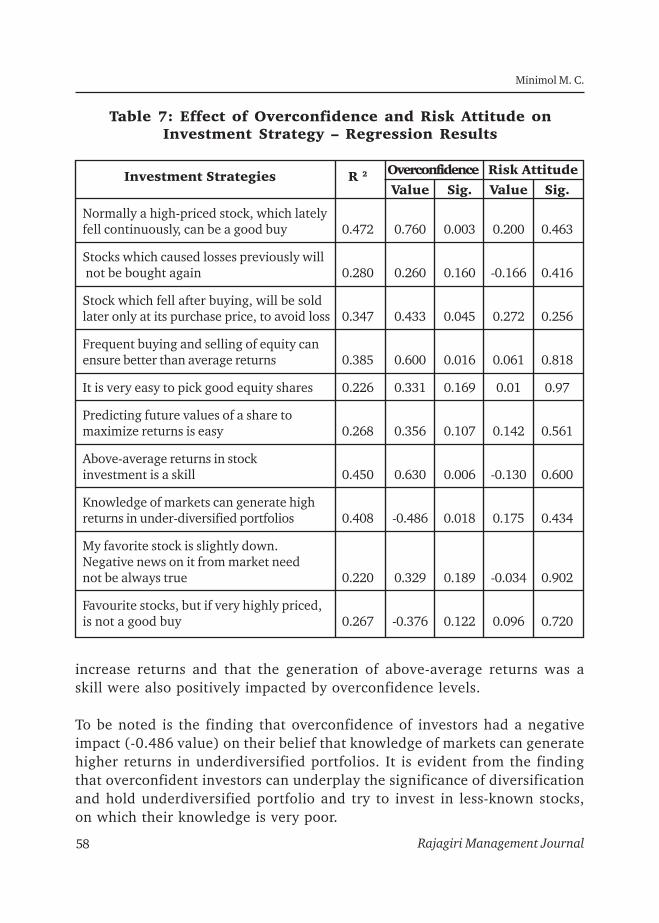
Table 7: Effect of Overconfidence and Risk Attitude onInvestment Strategy – Regression Results
Investment Strategies R 2 Overconfidence Risk Attitude
Value Sig. Value Sig.
Normally a high-priced stock, which latelyfell continuously, can be a good buy 0.472 0.760 0.003 0.200 0.463
Stocks which caused losses previously will not be bought again 0.280 0.260 0.160 -0.166 0.416
Stock which fell after buying, will be soldlater only at its purchase price, to avoid loss 0.347 0.433 0.045 0.272 0.256
Frequent buying and selling of equity canensure better than average returns 0.385 0.600 0.016 0.061 0.818
It is very easy to pick good equity shares 0.226 0.331 0.169 0.01 0.97
Predicting future values of a share tomaximize returns is easy 0.268 0.356 0.107 0.142 0.561
Above-average returns in stockinvestment is a skill 0.450 0.630 0.006 -0.130 0.600
Knowledge of markets can generate highreturns in under-diversified portfolios 0.408 -0.486 0.018 0.175 0.434
My favorite stock is slightly down.Negative news on it from market neednot be always true 0.220 0.329 0.189 -0.034 0.902
Favourite stocks, but if very highly priced,is not a good buy 0.267 -0.376 0.122 0.096 0.720
increase returns and that the generation of above-average returns was askill were also positively impacted by overconfidence levels.
To be noted is the finding that overconfidence of investors had a negativeimpact (-0.486 value) on their belief that knowledge of markets can generatehigher returns in underdiversified portfolios. It is evident from the findingthat overconfident investors can underplay the significance of diversificationand hold underdiversified portfolio and try to invest in less-known stocks,on which their knowledge is very poor.
Minimol M. C.
Rajagiri Management Journal58

5. Limitations of the Study
The study concentrates only on one investment bias – that is over confidence.It does not cover the effect of any other investment bias on investmentstrategy. The study was conducted using a small sample. Inherent limitationsof a small sample survey can be present in this study although efforts weremade to solve this problem by making the sample more representative of thepopulation.
6. Conclusion
The present study attempted to evaluate the levels of overconfidence andrisk attitude of Indian capital market investors and find insights on variousstrategies adopted by them. It also attempted to: (i) identify whether thereexists any relationship between risk attitude and overconfidence, and (ii)identify whether risk attitude and overconfidence impacted investment beliefsand strategies. The findings emerged from the study are as follows. First,investors need not necessarily be rational when it comes to stock investments.There existed significant levels of overconfidence in their behaviour thatcan impact their investment activities. This is against the postulations oftraditional finance theories. Second, investors do fall into very distinctivecategories of risk tolerance levels. There can be risk taking and risk-averseinvestors, but majority are risk neutral. Third, while investors can havedistinctive levels of risk attitude/tolerance and overconfidence, their riskattitude does not impact or determine their overconfidence. That is, a risktaker need not necessarily be overconfident in investment decisions, or arisk averse investor need not be low on overconfidence. Fourth, investorsare more sentimental regarding their favourite stocks. They tend to believethat bad news on their favourite stock need not always be true. This mayprompt investors in holding on to loss-making favourite stocks. They alsotend to stay away from an expensive favourite stock. Fifth, frequent portfoliorevision was done to generate higher returns which was considered to be aninvestment skill. Prediction of future markets to maximise returns wasbelieved to be difficult. Sixth, risk attitude/tolerance of investors was foundnot to impact investment strategies adopted. Finally, overconfidence ofinvestors was found to significantly affect investment strategies. The impactof overconfidence is very evident particularly when it comes to decisions onbuying a bearish loss-making stock, postponing sales of a poor stock to avoidlosses, frequency of stock trading to improve returns, investment skills etc.
Overconfidence, Risk Tolerance and Investment Strategy : A Study of Capital Market Investors in India
Rajagiri Management Journal 59

7. Implications of the Study and Future Direction of Research
Investors are not necessarily rational with regard to their stock marketinvestments, and hence investment strategies can better be designed afterconsidering various investment biases. Also, investors do fall into verydistinctive categories of risk tolerance levels. There can be risk-taking andrisk-averse investors, but majority are risk-neutral. Future studies can beundertaken in the same area by adding more number of investment biases.Studies can also be undertaken by expanding the list of investment strategies.This study can even be extended by incorporating other investmentalternatives.
References
Akerlof, G. & Dickens, W. (1982). The economic consequences of cognitive dissonance.American Economic Review, 72 (3).
Andreassen, P. (1993). The psychology of risk: A brief primer. Working Paper 87,available at SSRN: http://ssrn.com/abstract=150928.
Baker, H. Kent, & Nofsinger, John R. (2002). Psychological bias of investors. FinancialServices Review, 11(2).
Barber, B., & Odean, T. (2001). Boys will be boys: Gender, overconfidence and commonstock investment. Quarterly Journal of Economics, 116 (1).
Barber, B., & Odean, T. (1999). The courage of misguided convictions. Financial AnalystsJournal, 55 (5).
Barberis, N. & Thaler, R. A. (2003). Survey of behavioral finance. In Constantinides, G.M., et al. (eds.). Handbook of the Economics of Finance, Elsevier Science B. V.
Belsky, G., & Gilovich, T. (1999). Why smart people make big money mistakes and howto correct them. Simon & Schuster, New York.
Biais, B. & Weber, M. (2008). Hindsight bias, risk perception and investmentperformance. Management Science, 55(6), pp.1018-1029.
Bikas E., Daiva Jureviciene & Lina N. (2012). Behavioural finance: The emergence anddevelopment trends. International Business School, Lithuania.
Fabozzi, F. J., Gupta, F., & Markowitz, H. M. (2002). The legacy of modern portfoliotheory. The Journal of Investing, Fall.
Minimol M. C.
Rajagiri Management Journal60
Fama, E. F. (1965). The behaviour of stock market prices. The Journal of Business, Vol.38, No. 1.
Fama, E. F. (1970). Efficient capital markets: A review of theory and empirical work.The Journal of Finance, Vol. 25, No. 2.
Fischer, R., & Gerhardt, R. (2007). Investment mistakes of individual investors and theimpact of financial advice. European Business School, Working Paper, 233.
Friedman, M. (1953). The case for flexible exchange rates. Essays in positive economics,University of Chicago Press.
Fuller, Russell J. (1998). Behavioral finance and the sources of alpha. Journal of PensionPlan Investing, Vol. 2, No. 3, Winter.
Gholizadeh, H. M. & Iraj Shakerinia, S. S. (2013). The role of behavioural biases oninvestment decisions: Case studies of Tehran stock. International Research Journalof Applied and Basic Sciences, Vol 4(4), 819-824.
Glaser, M. & Weber M. (2007). Overconfidence and trading volume. Geneva Risk Insur,32: 1-36.
Hon-Snir, S., Kudryavtsev, A., & Cohen, G. (2012). Stock market investors: Who ismore rational, and who relies on intuition? Shlomit International Journal ofEconomics and Finance, 4(5), 56 72.
Huberman, G. (2001). Familiarity breeds investment. Review of Financial Studies, 14 (3).
Irwan T., & Roy S. (2011). Over confidence and excessive trading behavior: An empiricalstudy, International Journal of Business and Management, Vol 6, No.7.
Jauhari A. (2011). Market research on behaviour of Indian investors. Report submittedto IMT, Ghaziabad.
Kahneman, D., & Piepe, M. W. (1998). Aspects of investor psychology, Journal of PortfolioManagement, 24 (4).
Markowitz, H. M. (1952). Portfolio selection. The Journal of Finance, Vol.7, No. 1.
Rakesh, H. M. (2014). A study on individual investor’s behavior in stock markets ofIndia. International Journal in Management and Social Sciences, 2 (2).
Rostami, M. & Zohreh, A. (2015). Impact of behavioural biases (overconfidence,ambiguity-aversion and loss-aversion) on investment decision making in Tehranstock exchange. Journal of Scientific Research and Development, 2(4):60-64.
Overconfidence, Risk Tolerance and Investment Strategy : A Study of Capital Market Investors in India
Rajagiri Management Journal 61
Samuelson, Paul A. (1965). Proof that properly anticipated prices fluctuate randomly.Industrial Management Review, 6: 2, Spring.
Shafi, H. Muhammad, A. Mubashir, H., Imran, S. & Kashif, Ur R. (2011). Relationshipbetween risk perception and employee investment behavior. Journal of Economicsand Behavioural Studies, 3 (6), pp.345-351.
Shefrin, H. (2000). Beyond greed and fear: Understanding behavioural finance and thepsychology of investing. Harward Business School Press, Boston.
Statman, Meir. (1995). Behavioral finance versus standard finance. In Wood, Arnold S.(ed.), Behavioral finance and decision theory in investment management,Charlottesville, VA: AIMR.
Minimol M. C.
Rajagiri Management Journal62
Rajagiri Management JournalVolume 9, Issue 1, June 2015
Service Quality IndirectlyInfluences Customer Loyalty viaCustomer Satisfaction: Results
from a Literature Survey
Sameer Sharma1 , Divya Mittal2 and Shiv Ratan Agrawal3
Abstract
Very little research has been done on the effect of service qualitydimensions on customer loyalty. This paper aims to explorethe indirect influence of service quality and its dimensions oncustomer loyalty via customer satisfaction through a surveyof existing literature. The study also investigates the directinfluence of service quality dimensions as a whole andindividually on customer satisfaction. The findings show thatservice quality parameters such as tangibles, reliability,responsiveness, assurance and empathy as a whole, andindividually, indirectly influence customer loyalty throughcustomer satisfaction. It also shows that service qualitydimensions directly influence customer satisfaction. Tomaintain a competitive edge in the market, service-marketingmanagers can focus on dimensions of service quality with aview to measuring, controlling and improving the satisfactionand loyalty levels of their customers.
Keywords: Service quality, Customer satisfaction,Customer loyalty.
1Professor & Director/Dean, People’s Institute of Management & Research, People’sUniversity, Bhopal, Madhya Pradesh. E-mail: [email protected],[email protected] Professor, People’s Institute of Management & Research, People’sUniversity, Bhopal, Madhya Pradesh. E-mail: [email protected],[email protected] Scholar, Maulana Azad National Institute of Technology (MANIT), Bhopal,Madhya Pradesh. E-mail: [email protected]

1. Introduction
Declining customer satisfaction and loyalty become the major concern ofservice firms because these two factors determine the performance of thefirms. Furthermore, the factor that simultaneously influences customersatisfaction and loyalty is customer perception of service quality. Withincreasingly intense competition for customers in today’s service industry,these factors are high management priorities (Parasuraman, 1997). Financialexecutives and banking strategies are becoming more focussed on servicequality to increase customer satisfaction, customer loyalty and businesssuccess in the financial services industry (Arasli, Mehtap-Smadi, &Katircioglu, 2005).
In a highly competitive and customer-centred market economy, serviceorganisations are forced to provide high-quality services that generatecustomer satisfaction and customer loyalty, enlarge market share and improvetheir performance results.With time, firms are adding advanced services totheir customers. In most services, customer satisfaction mainly depends onthe process of service delivery, a fact that highlights the important role of theservice quality parameters. In any case, customer satisfaction is an importantconcept because the relationship between customer satisfaction andfinancial performance has been repeatedly confirmed (Gruca & Rego, 2005).
Customer satisfaction is quite a complex issue and it is also responsiblefor customer retention and customer loyalty and hence for company’sperformance. In general, a two percent enhancement of customerretention can lead to a ten percent reduction of overhead costs, which,in turn, improves the profitability (Jamieson, 1994). There is always apossibility that a dissatisfied customer starts searching for another firmoffering similar services, resulting in a break in the relationship withthe firm, with which he is dissatisfied. Intensive competition has grownin the financial services market, resulting in greater variety and choicefor customers within each product market (Asuncion, Martin, &Quintana, 2004).
In marketing of services, the quality of customer service holds primarysignificance, particularly in the context of sustained business growth ofthe firm. A study of individual service quality dimensions could provideresearchers and managers with a better understanding of the linkagesamong service quality, customer satisfaction and customer loyalty. As
Sameer Sharma, Divya Mittal and Shiv Ratan Agrawal
Rajagiri Management Journal64
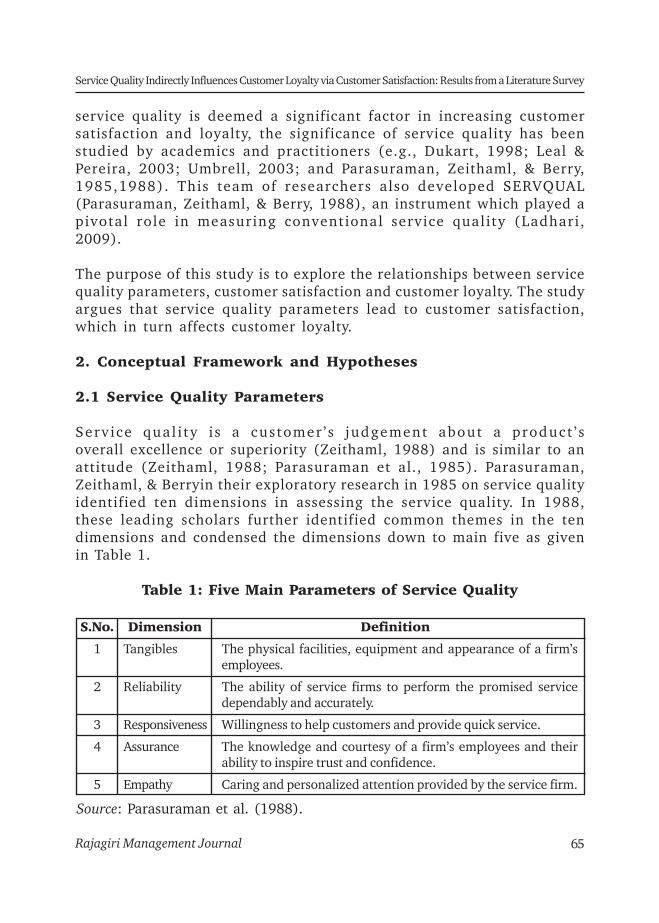
service quality is deemed a significant factor in increasing customersatisfaction and loyalty, the significance of service quality has beenstudied by academics and practitioners (e.g., Dukart, 1998; Leal &Pereira, 2003; Umbrell, 2003; and Parasuraman, Zeithaml, & Berry,1985,1988). This team of researchers also developed SERVQUAL(Parasuraman, Zeithaml, & Berry, 1988), an instrument which played apivotal role in measuring conventional service quality (Ladhari ,2009).
The purpose of this study is to explore the relationships between servicequality parameters, customer satisfaction and customer loyalty. The studyargues that service quality parameters lead to customer satisfaction,which in turn affects customer loyalty.
2. Conceptual Framework and Hypotheses
2.1 Service Quality Parameters
Serv ice qual i ty i s a cus tomer ’ s judgement about a product ’ soverall excellence or superiority (Zeithaml, 1988) and is similar to anattitude (Zeithaml, 1988; Parasuraman et al., 1985). Parasuraman,Zeithaml, & Berryin their exploratory research in 1985 on service qualityidentified ten dimensions in assessing the service quality. In 1988,these leading scholars further identified common themes in the tendimensions and condensed the dimensions down to main five as givenin Table 1.
Table 1: Five Main Parameters of Service Quality
S.No. Dimension Definition
1 Tangibles The physical facilities, equipment and appearance of a firm’semployees.
2 Reliability The ability of service firms to perform the promised servicedependably and accurately.
3 Responsiveness Willingness to help customers and provide quick service.
4 Assurance The knowledge and courtesy of a firm’s employees and theirability to inspire trust and confidence.
5 Empathy Caring and personalized attention provided by the service firm.
Source: Parasuraman et al. (1988).
Service Quality Indirectly Influences Customer Loyalty via Customer Satisfaction: Results from a Literature Survey
Rajagiri Management Journal 65
Based upon their findings, they developed an instrument known asSERVQUAL scale (Kim, 2000), which consists of 22 questions measuringexpectations and 22 questions measuring perceptions. Many researchershave studied the measurement of service quality. The most well-knowninstrument for measuring service quality is SERVQUAL, which was introducedby (Parasuraman et al., 1988). Since its introduction, SERVQUAL has beenwidely applied in various fields and provided meaningful information(Heung, Wong, & Qu, 2000). SERVQUAL has been widely acknowledgedand applied in various service settings (Gilbert & Wong, 2003; Saleh & Ryan,1991; and Vandamme & Leunis, 1993). Subsequent work widely utilisedSERVQUAL instrument in different sectors of the service industry (Avkiran,1994; Babakus & Boller, 1992; Buttle, 1996; Cronin & Taylor, 1992; Fick &Ritchie, 1991; Newman, 2001; and Smith, 1995) and despite concerns aboutthe number and composition of service quality dimensions (Brown, Churchill& Peter, 1993; Carman, 1990; and Cronin & Taylor, 1992), the SERVQUALframework is still considered a useful tool for measuring service quality(Bottle, 1996; Bloemer, de Ruyter, & Wetzels, 1999; and Wong & Sohal,2003) as the five dimensions capture the general domain of service qualityfairly well (Parasuraman, Zeithaml, & Berry, 2005).
Within the services marketing literature, overall service quality is normallynot viewed as a separate construct but treated as an aggregate constructwhereby the individual dimensions are summed to obtain an estimate ofoverall service quality (Dabholkar, Shepherd, & Thorpe, 2000; Sachdev &Verma, 2004; and Zhou, 2004). Previous research studies have also utiliseddirect measures of overall service quality using either a single item or multipleitem statements (Dabholkar, et al., 2000). The service literature views servicequality as an overall assessment of product or service attributes(Parasuraman et al., 1988), of which the SERVQUAL metric is a measuringdevice.
2.2 Service Quality and Customer Satisfaction
Customer satisfaction has been widely accepted among researchers as astrong predictor for behavioural variables (Liljander & Strandvik, 1995; andRavald & Gronroos, 1996). Satisfaction in a relationship is centred on theroles assumed and performed by the individual parties (Crosby, Evans, &Cowles, 1990; Murstein, Cerreto, & MacDonald, 1977; and Storbacka,
Sameer Sharma, Divya Mittal and Shiv Ratan Agrawal
Rajagiri Management Journal66

Strandvik, & Gronroos,1994) defined customer satisfaction as a customer’scognitive and affective evaluation based on his or her personal experiencesacross all service episodes within the relationship.
Some researchers consider the concepts of service quality and customersatisfaction to be synonymous, as a high degree of correlation has been foundbetween them (Oliva,, Oliver, & MacMillan,1992). Others have found notabledistinctions between customer satisfaction and service quality(Sureshchander, Rajendran, & Anatharaman, 2002; and Bitner & Hubbert,1994). Different opinions have also been expressed about the antecedentsof service quality and customer satisfaction. Kotler and Levy (1969) reportedthat customer satisfaction is connected primarily with the concept of valueand price, while service quality is related to customer needs and expectations.In addition, Cronin and Taylor (1994) specified service quality as impactingon long-term attitudes and customer satisfaction as the result of customerevaluating a specific experience (transaction with the firm).
However, more recent research has considered a somewhat different positionthat service quality leads to customer satisfaction. In this case, service qualityis regarded as the independent variable and customer satisfaction as thedependent variable (Jamal & Naser, 2002; Ting, 2004; and Parker & Mathews,2001). Although, for many years, arguments focussed on the causalrelationship between service quality and customer satisfaction, recentapproaches argue for merging the two elements into one (Gronroos, 2001)stating that service quality dimensions should be measured alongsidecustomer satisfaction. Quality, as such, should not be measured, becauseresearch indicates that the technical and functional features directlyinfluence perceived customer satisfaction. These arguments confirm thesignificance of different dimensions of service quality to a varying degreeand highlight the need for the research reported here. Hence, we posit thefollowing hypotheses:
H1. Service quality parameters are positively and directly associated withcustomer satisfaction. In particular:
H1.a. Tangibles of service delivery are positively and directly associated withcustomer satisfaction.
H1.b. Reliability of service delivery is positively and directly associated withcustomer satisfaction.
Service Quality Indirectly Influences Customer Loyalty via Customer Satisfaction: Results from a Literature Survey
Rajagiri Management Journal 67
H1.c. Responsiveness of service delivery is positively and directly associatedwith customer satisfaction.
H1.d. Assurance of service delivery is positively and directly associated withcustomer satisfaction.
H1.e. Empathy of service delivery is positively and directly associated withcustomer satisfaction.
2.3 Service Quality and Customer Loyalty via CustomerSatisfaction
Customers who feel they have obtained value from a product or service maydevelop loyalty. Loyalty, in turn, breeds retention which translates into highercorporate profits. Customer loyalty can be explained in three things (Oliver,1999). First, loyalty is shown by customers’ behaviour in doing repeatpurchase. Second, loyalty is indicated by customers’ attitude toward thecompany. This includes preference and commitment towards brand andrecommending it to others. Third, it is the combination of customers’behaviour and attitude towards the company. That is, besides activelyrepeating purchase, the customers also give positive appraisal of the brandand share the company’s positive value to others. Reichheld and Sasser (1990)concluded that customer defections had a stronger impact on the financialperformance of an organization than other factors, as it pertained to gainingcompetitive advantage. Since there is a learning curve that both the companyand customer must travel, research suggests the longer a company keeps acustomer, the more profitable that customer becomes. Customer loyalty isan important theoretical as well as practical issue for most marketers andcustomer researchers (Aaker, 1992; and Reichheld, 1996). In the context ofservices, a number of scholars have highlighted the significance of loyalty(Asuncion et al., 2004; Bloemer et al., 1999; and Caruana, 2002). Greaterloyalty can lead to lower marketing costs (Aaker, 1991), enhancedopportunities for brand extensions and increased market shares (Buzzell,Gale, & Sultan, 1975; and Buzzell & Gale, 1987). It can also encouragefavourable word of mouth and greater resistance among loyal customers tocompetitive strategies (Dick & Basu, 1994) and can lead to lower levels ofprice sensitivity among customers (Keller, 1993; and Rundle-Thiele & Mackay,2001). Customer loyalty is also an important antecedent to brand equity,which in turn is significantly important in creating differentiation andcompetitive advantage (Aaker, 1991; and de Chernatony & McDonald, 1998).
Sameer Sharma, Divya Mittal and Shiv Ratan Agrawal
Rajagiri Management Journal68
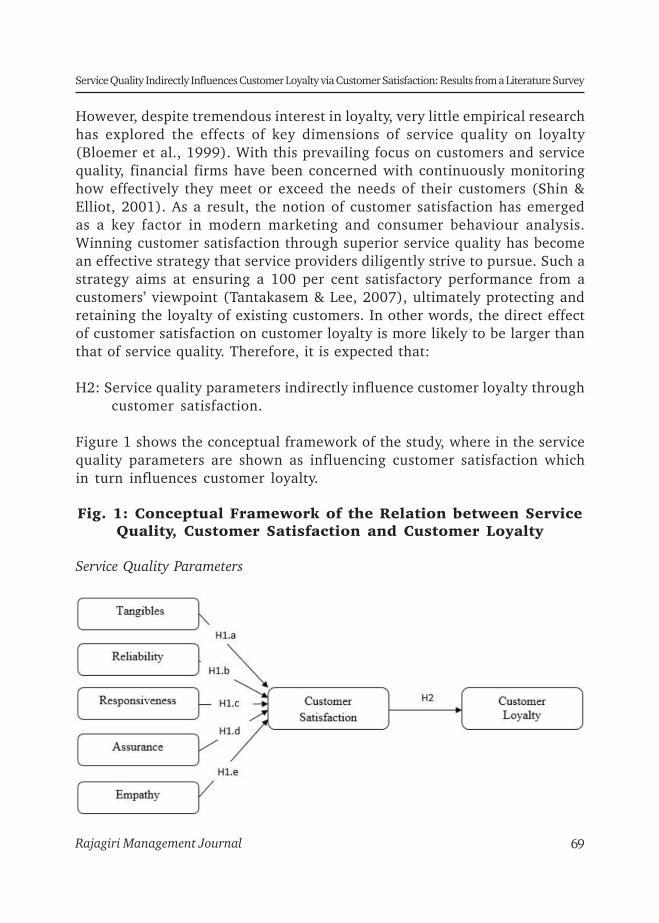
However, despite tremendous interest in loyalty, very little empirical researchhas explored the effects of key dimensions of service quality on loyalty(Bloemer et al., 1999). With this prevailing focus on customers and servicequality, financial firms have been concerned with continuously monitoringhow effectively they meet or exceed the needs of their customers (Shin &Elliot, 2001). As a result, the notion of customer satisfaction has emergedas a key factor in modern marketing and consumer behaviour analysis.Winning customer satisfaction through superior service quality has becomean effective strategy that service providers diligently strive to pursue. Such astrategy aims at ensuring a 100 per cent satisfactory performance from acustomers’ viewpoint (Tantakasem & Lee, 2007), ultimately protecting andretaining the loyalty of existing customers. In other words, the direct effectof customer satisfaction on customer loyalty is more likely to be larger thanthat of service quality. Therefore, it is expected that:
H2: Service quality parameters indirectly influence customer loyalty throughcustomer satisfaction.
Figure 1 shows the conceptual framework of the study, where in the servicequality parameters are shown as influencing customer satisfaction whichin turn influences customer loyalty.
Fig. 1: Conceptual Framework of the Relation between ServiceQuality, Customer Satisfaction and Customer Loyalty
Service Quality Parameters
Service Quality Indirectly Influences Customer Loyalty via Customer Satisfaction: Results from a Literature Survey
Rajagiri Management Journal 69

3. Methodology
The present study, through a review of existing studies, aims to explore theinterrelationships between service quality parameters, customer satisfactionand customer loyalty. Specifically, the study uses SERVQUAL dimensions aspredictors of customer satisfaction and customer behaviour intentions(Gronroos, 1990). The study is an attempt to answer how to acquire, develop,and retain loyal and profitable customers in the service industry. Literaturewas reviewed to clarify the constructs of service quality scale and to developthe interrelationships between customer satisfaction and customer loyalty.The service quality dimensions, customer satisfaction and customer loyaltyin this study have been adopted from previous studies. For service qualityvariable, the researchers have adopted from Bloemer et al.(1999) and Wongand Sohal (2003); for customer satisfaction based on the service qualityparameters have been adopted from Spreng & MacKoy (1996); andStorbacka, Strandvik, & Grönroos (1994) and for customer loyalty fromAnderson & Mittal (2000); and Athanassopoulos, & Gounaris (2001).
4. Results and Discussion
4.1 Accessing Service Quality Parameters
The identification of different dimensions of service quality (SEVRQUAL) indifferent surveys has been confirmed by a number of researchers. Babakusand Boller (1992) argue that the number and nature of dimensions dependon the type of service setting. During the last decades competition hasintensified and firms have encountered difficulties in selling their goods orservices, and also in keeping their market share (Bazini, Elmazi, & Sinana,2012). As a result, a phrase that has been commonly used in recent times isto keep the “customer in focus”. This represents a threat and, at the sametime, an opportunity to firms, as it opens up the possibilities of offeringcustomers a more integrated range of services. The search for competitiveadvantage has increasingly tended to focus on the service quality and theprocess of service delivery rather than the service itself. This is particularlysignificant in the context of complex services (such as stock broking,insurance, mutual funds, banking, mortgages, etc.). Evidence from previousstudies suggests that the five principal dimensions which customers use inevaluating service quality are also important tools of service quality scale
Sameer Sharma, Divya Mittal and Shiv Ratan Agrawal
Rajagiri Management Journal70

for measuring customer satisfaction, customer retention and customerloyalty. Subsequent works have widely utilised service quality instruments.
Table 2 shows the different service quality dimensions cited for research inservices.
Table 2: Service Quality Dimensions
S.No. Dimension Author and Year
1 Tangibles Bitner (1990); Parasuraman, Zeithaml, & Berry (1991); Bitner(1992); Yavas, Bilgin, & Shemwell (1997); Wakefield & Blodgett(1999); Bahia & Nantel (2000); Sureshchandar et al. (2002);and Arasli et al. (2005)
2 Reliability Crosby et al. (1990); Parasuraman et al. (1991); Zhou (2004);Arasli et al. (2005); and Baumann, Burton, Elliot, & Kehr (2007)
3 Responsiveness Parasuraman et al. (1985); Parasuraman et al. (1991); Yavas etal. (1997); Yang & Jun (2002); and Baumann et al. (2007)
4 Assurance Parasuraman et al. (1991); (Zhou, 2004); Arasli et al. (2005);and Baumann et al. (2007)
5 Empathy Parasuraman et al. (1985); Parasuraman et al. (1991);Mouawad & Kleiner (1996); Yavas et al. (1997); and Baumannet al. (2007)
Reimer and Kuehn (2005) took into consideration that physical quality is adirectly observable variable by the customers. Physical quality indicates thattangibles have a significant influence on intangible dimensions of servicequality. Customers make inferences about the service quality on the basis oftangibles such as buildings, equipment, physical layout, communicationmaterials, etc. that surround the service environment (Bitner, 1990). Bateson(1995) expressed a different opinion arguing that the physical elements ofan organisation form behaviours on the path to the service encounter.According to Nguyen (2006), service-scape should consider two types ofneeds: operational and marketing. Operations are important to improvingemployee performance (responsiveness and empathy), while marketingpositively influences customer beliefs (reliability and assurance). Hence, theservice environment (assurance) affects the interactive service features intwo ways: it supports employees by providing better and promised serviceswith speed and influences customers by creating expectations of reliability
Service Quality Indirectly Influences Customer Loyalty via Customer Satisfaction: Results from a Literature Survey
Rajagiri Management Journal 71
of services. Parasuraman et al. (1991) argued that reliability was mainlyconcerned with the outcome of service whereas tangibles, responsiveness,assurance and empathy were concerned with the service delivery process.In other words, customers not only judge the accuracy and dependability(i.e. reliability) of the service delivery but they also judge the other dimensionsas the service is being delivered (Parasuraman et al., 1991; and Levesque &McDougall, 1996). Therefore, the role of service quality parameters incustomer evaluations of the service delivery, the service outcome and theoverall corporate image of the firm cannot be underestimated. Hence,designing a simple and seamless service delivery process helps serviceproviders to shorten the necessary time of delivery of the service products(Al-Hawari, Ward, & Newby, 2009).
4.2 Relationship between Service Quality Parameters andCustomer Satisfaction
Customer satisfaction is the full meeting of one’s expectations (Oliver, 1980)and can be described as the feeling or attitude of a customer towards aproduct or service after it has been used (Evans, Jamal & Foxall, 2006). Asubstantial amount of research has reported a causal link between servicequality and customer satisfaction (e.g. Anderson & Sullivan, 1993; Bolton& Drew, 1991; Cronin & Taylor, 1992; and Woodside, Lisa & Robert, 1989).A few studies have investigated the link between each of the service qualityparameters and satisfaction and have reported some mixed results as belowin Table 3.
These results from existing studies clearly show that the service qualityparameters are directly associated with customer satisfaction. Customersperceive service based on the attributes of the service personnel and those ofa service firm. The customer-oriented attributes of the service personnel arecalled human aspects of service quality. These are reliability, responsiveness,assurance, and empathy, and reflect the soft quality attributes of serviceproviders. Favourable interpersonal interactions between customers andemployees based on these attributes can improve customer satisfaction(Hartline et al., 2000; and Parasuraman et al., 1985).The attributes of theservice firm are called the hard quality. These are the technology and tangibleaspects of service quality. Tangible elements include the exterior facilities ofthe firm like parking, interior décor, furniture and equipment used. Customerslook at these tangible elements and make inferences about the firm and its
Sameer Sharma, Divya Mittal and Shiv Ratan Agrawal
Rajagiri Management Journal72
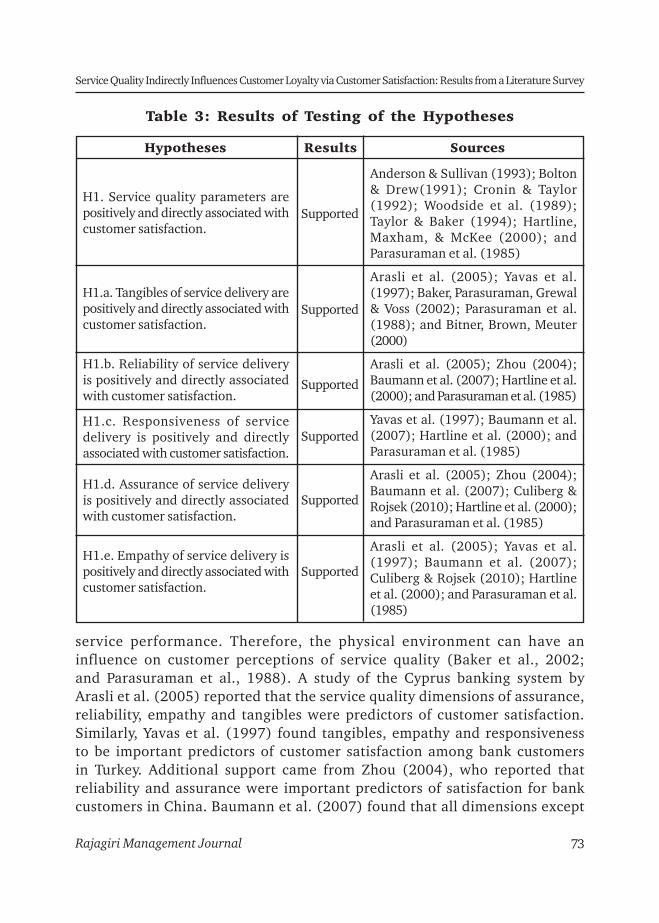
Table 3: Results of Testing of the Hypotheses
Hypotheses Results Sources
H1. Service quality parameters arepositively and directly associated withcustomer satisfaction.
H1.a. Tangibles of service delivery arepositively and directly associated withcustomer satisfaction.
H1.b. Reliability of service deliveryis positively and directly associatedwith customer satisfaction.
H1.c. Responsiveness of servicedelivery is positively and directlyassociated with customer satisfaction.
H1.d. Assurance of service deliveryis positively and directly associatedwith customer satisfaction.
H1.e. Empathy of service delivery ispositively and directly associated withcustomer satisfaction.
Supported
Supported
Supported
Supported
Supported
Supported
Anderson & Sullivan (1993); Bolton& Drew(1991); Cronin & Taylor(1992); Woodside et al. (1989);Taylor & Baker (1994); Hartline,Maxham, & McKee (2000); andParasuraman et al. (1985)
Arasli et al. (2005); Yavas et al.(1997); Baker, Parasuraman, Grewal& Voss (2002); Parasuraman et al.(1988); and Bitner, Brown, Meuter(2000)
Arasli et al. (2005); Zhou (2004);Baumann et al. (2007); Hartline et al.(2000); and Parasuraman et al. (1985)
Yavas et al. (1997); Baumann et al.(2007); Hartline et al. (2000); andParasuraman et al. (1985)
Arasli et al. (2005); Zhou (2004);Baumann et al. (2007); Culiberg &Rojsek (2010); Hartline et al. (2000);and Parasuraman et al. (1985)
Arasli et al. (2005); Yavas et al.(1997); Baumann et al. (2007);Culiberg & Rojsek (2010); Hartlineet al. (2000); and Parasuraman et al.(1985)
service performance. Therefore, the physical environment can have aninfluence on customer perceptions of service quality (Baker et al., 2002;and Parasuraman et al., 1988). A study of the Cyprus banking system byArasli et al. (2005) reported that the service quality dimensions of assurance,reliability, empathy and tangibles were predictors of customer satisfaction.Similarly, Yavas et al. (1997) found tangibles, empathy and responsivenessto be important predictors of customer satisfaction among bank customersin Turkey. Additional support came from Zhou (2004), who reported thatreliability and assurance were important predictors of satisfaction for bankcustomers in China. Baumann et al. (2007) found that all dimensions except
Service Quality Indirectly Influences Customer Loyalty via Customer Satisfaction: Results from a Literature Survey
Rajagiri Management Journal 73
tangibility impacted the customer satisfaction of Australian bankingcustomers. Culiberg and Rojsek (2010) found a positive relation betweenservice quality dimensions and overall customer satisfaction, especially withthe assurance and empathy aspects of service quality. Accordingly, it isconcluded that the better the human, technical and tangible aspects ofservices, the better the satisfaction of customers. Service quality is themanagerial delivery of the service, whereas satisfaction is customers’experiences with the service. Improved service quality will result in morecustomer satisfaction (Bitner et al., 1994). It is evident from the above thatservice quality parameters, both overall and individually, are positively anddirectly associated with customer satisfaction.
4.3 Relationship between Service Quality Parameters andCustomer Loyalty via Customer Satisfaction
A vast stream of literature has revealed that customer satisfaction has positivelinks with customer loyalty and retention (Fornell, 1992; Levesque &McDougall, 1996; Lovelock, Patterson, & Walker, 2001; Oliver, 1980; andSharma & Patterson, 2000), commitment (Burnham et al., 2003; and Morgan& Hunt, 1994), service quality (Athanassopoulos, 2000; Parasuraman et al.,1988; and Sureshchandar et al., 2002) and behavioural intentions(Olorunniwo, Hsu, & Udo, 2006; and Zeithaml, 2000). The commonpresumption in such studies is that the prosperity and growth of a servicefirm depends to a large extent on its ability to build a base of loyal customersand to differentiate itself via superior service quality that results in satisfiedcustomers. In spite of the fact that academics have reached some sort of anagreement that customer satisfaction and service quality are two distinctbut intertwined constructs, the evidence documented in the literatureconcerning the causal sequence of their relationship has been conflicting(Olorunniwo et al., 2006). This issue is of immense significance to serviceproviders in the sense that it provides them with information about whetherthey need to aim at satisfying their customers or delivering superior servicequality and which of those two constructs has greater potential to predictre-purchase intention (Cronin and Taylor, 1992).
A flurry of research has identified customer satisfaction as a salientantecedent to customer loyalty, customer retention, behavioural intention,market share and profitability (Anderson & Mittal, 2000; Athanassopouloset al., 2001; Beerli, Martin, & Quintana, 2004; Heskett, Sasser, &
Sameer Sharma, Divya Mittal and Shiv Ratan Agrawal
Rajagiri Management Journal74
Schlesinger,1997; Levesque & McDougall, 1996; Muffato & Panizzolo, 1995;and Wood, 2008). Increased customer satisfaction is presumed to lead togreater customer retention and loyalty, eventually maximising profitability.A satisfied customer is expected to be more likely to form future purchaseintention, engage in positive word-of-mouth advertising (Jamal & Naser,2002) and be more tolerant of price increases (Anderson, Fornell, &Lehmann, 1994). Olorunniwo et al. (2006) pointed out that satisfiedcustomers who maintain a long-term relationship with a service providertend to impact profitability through their repeat business, shrinkingexpenditures on advertising, promotion and start-up activities, and spreadingpositive word-of-mouth.
Most researchers agree that customer satisfaction and service quality acttogether on customer loyalty. Several studies have identified customersatisfaction as a mediator between service quality and behavioural intentionsor customer loyalty (Cronin, Brady, & Hult, 2000; Dabholkar, Shepherd, &Thorpe, 2000; and Olorunniwo et al., 2006). Olorunniwo et al. (2006) founda statistically significant but relatively small direct effect of service qualityon customer loyalty. Nonetheless, the direct effect of customer satisfactionon behavioural intentions or customer loyalty was found to beoverwhelmingly larger than that of service quality. While a substantialamount of research has reported that overall service quality perceptions actas antecedents of customer satisfaction (Anderson & Sullivan, 1993; Cronin& Taylor, 1992; Oliver, 1997; Taylor & Baker, 1994; and Woodside et al.,1989) and of loyalty (Zeithaml, Berry, & Parasuraman, 1996) via customersatisfaction. Despite the apparent absence of an empirical direct link betweenservice quality and customer loyalty, several studies show that customersatisfaction affects customer loyalty directly (Bolton, 1998; and Bolton,Kannan, & Bramlett, 2000). A substantial amount of research has concludedthat satisfaction is an important determinant of customer loyalty (Beardenand Teel, 1983; Cronin & Taylor, 1992; Caruana, 2002; Dick & Basu, 1994;Oliva, Oliver, & MacMillan, 1992; and Selnes, 1993). It is concluded, therefore,that the service quality parameters indirectly influence and associate withcustomer loyalty via customer satisfaction. Hence, H2 is supported.
5. Conclusion and Managerial Implications
The present study aims to understand the interrelationships among servicequality parameters, customer satisfaction and customer loyalty. Existingstudies have investigated the link between each of the service quality
Service Quality Indirectly Influences Customer Loyalty via Customer Satisfaction: Results from a Literature Survey
Rajagiri Management Journal 75

dimensions and customer satisfaction. Very limited research has, however,investigated the effects of service quality dimensions on customer loyalty.The paper seeks to investigate the effects of service quality dimensions oncustomer loyalty via customer satisfaction.
It is evident from the extensive literature survey that service qualityparameters, both as a whole and individually, are positively and directlyassociated with customer satisfaction. The study also revealed the fact thatthe direct effect of customer satisfaction on customer loyalty was found tobe overwhelmingly larger than that of service quality. It means that servicequality parameters indirectly influence customer loyalty through customersatisfaction.
The findings suggest that for predictive purposes, managers can focus ondimensions of service quality with a view to measuring, controlling andimproving the satisfaction and loyalty levels of their customers (Johnston,1995). Measures of tangibility, reliability, empathy and satisfaction canprovide better feedback to managers regarding the overall levels experiencedby their customers. Given the significance of tangibility, managing theevidence and the use of physical environment can be treated as powerfulmarketing tools (Baker et al., 1994; Bitner, 1990; and LeBlanc & Nguyen,1988). As many of the mainstream services firms still depend upon a highdegree of contact between the firm and the customers, special attentionneeds to be placed on managing the physical evidence carefully. This couldbe done by making sure that the physical surroundings are visually pleasing,the contact personnel dress neatly and the overall atmospherics reinforcethe firm’s positioning statement. Managers can still improve the levels ofcustomer satisfaction and loyalty by improving the overall feel and qualityof the environmental factors.
6. Limitations and Future Research
The study has some limitations that must be considered. The study focusedonly on five main service quality dimensions. There could be some otherservice quality parameters that influence customer satisfaction and customerloyalty. These open many opportunities for future researchers. It would beadvisable to examine the interrelationships between service qualityparameters, customer satisfaction, and customer loyalty in services-marketing firms based on primary data collection and analysis. Another
Sameer Sharma, Divya Mittal and Shiv Ratan Agrawal
Rajagiri Management Journal76
possible area for future research is to replicate the present study in specificservice industries such as insurance, banking, and stockbroking, loanfinancing etc.
References
Aaker, D.A. (1991). Managing brand equity. Free Press, New York.
Aaker, D.A. (1992). Strategic market management, Wiley, New York.
Al-Hawari, M., Ward, T.,& Newby, L. (2009). The relationship between service qualityand retention within the automated and traditional contexts of retail banking. Journalof Service Management, Vol. 20, No. 4, pp. 455-72.
Anderson, E. A., & Sullivan, M. W. (1993). The antecedents and consequences of customersatisfaction for firms. Marketing Science, Vol. 12, pp. 125-44.
Anderson, E.W., Fornell, C., & Lehmann, D. R. (1994). Customer satisfaction, marketshare, and profitability: Findings from Sweden. Journal of Marketing, Vol. 56, pp.53-66.
Anderson, E.,& Mittal, V. (2000). Strengthening the satisfaction-profit chain. Journalof Service Research, Vol. 3, No. 2, pp. 107-20.
Arasli, H., & Mehtap-Smadi, S. & Katircioglu, S. T. (2005). Customer service quality inthe Greek-Cypriot banking industry. Managing Service Quality, Vol. 15, No. 1, pp.41-7.
Asuncion, B., & Martin, D. J. & Quintana, A. (2004). Model of customer loyalty in theretail banking market. European Journal of Marketing, Vol. 38, No. 1, pp. 253-75.
Athanassopoulos, A. (2000). Customer satisfaction cues to support market segmentationand explain switching behaviour. Journal of Business Research, Vol. 47, No. 3, pp.191-207.
Athanassopoulos, A., & Gounaris, S. (2001). Behavioural responses to customersatisfaction: An empirical study. European Journal of Marketing, Vol. 35, No 5/6,pp. 687-707.
Avkiran, N. K. (1994). Developing an instrument to measure customer service qualityin branch banking. International Journal of Bank Marketing, Vol. 12, No. 6, pp. 10-18.
Service Quality Indirectly Influences Customer Loyalty via Customer Satisfaction: Results from a Literature Survey
Rajagiri Management Journal 77
Babakus, E., & Boller, G. W. (1992). An empirical assessment of the SERVQUAL scale.Journal of Business Research, Vol. 24, pp. 253-68.
Bahia, K., & Nantel, J. (2000). A reliable and valid measurement scale for the perceivedservice quality of banks. The International Journal of Bank Marketing, Vol. 18, No.2, pp. 84-91.
Baker, J., Grewal, D., & Parasuraman, A. (1994). The influence of store environmenton quality inferences and store image. Journal of the Academy of Marketing Science,Vol. 22, No. 4, pp. 328-39.
Baker, J., Parasuraman, A., Grewal, D., & Voss, G. B. (2002). The influence of multiplestoreenvironment cues on perceived merchandise value and patronage intentions.Journal of Marketing, Vol. 66, No. 2, pp. 120–l41.
Bateson, J. E. G. (1995). Managing services marketing. Dryden, Fort Worth, TX.
Baumann, C., Burton, S., Elliot, G., & Kehr, H. M. (2007). Prediction of attitude andbehavioural intentions in retail banking. The International Journal of Bank Marketing,Vol. 25, No. 2, pp. 102.
Bazini, E., Elmazi, L., & Sinana, S. (2012). Importance of relationship marketingmanagement in the insurance business in Albania. Procedia- Social and BehavioralSciences, Vol. 44, pp. 155-162.
Bearden, W.O., & Teel, E. J. (1983). Selected determinants of consumer satisfactionand complaint reports. Journal of Marketing Research, Vol. 20, No. 1, pp. 21-28.
Beerli, A., Martin, J. D., & Quintana, A.(2004). A model of customer loyalty in theretail banking market. European Journal of Marketing, Vol. 38, No. 1/2, pp. 253-75.
Bitner, M. J. (1990). Evaluating service encounters: The effects of physical surroundingsand employee responses. Journal of Marketing, Vol. 54, No. 2, pp. 69-83.
Bitner, M. J. (1992). Servicescapes: The impact of physical surroundings on customersand employees. Journal of Marketing, Vol. 56, pp. 57-71.
Bitner, M. J., Booms, B. H., & Mohr, L. A. (1994). Critical service encounters: Theemployee’s viewpoint. Journal of Marketing, Vol. 58, No. 4, pp. 95–106.
Bitner, M.J., & Brown, S.W., Meuter, M. L. (2000). Technology infusion in serviceencounters. Journal of the Academy of Marketing Science, Vol. 28, No. 1, pp. 138–149.
Sameer Sharma, Divya Mittal and Shiv Ratan Agrawal
Rajagiri Management Journal78
Bitner, M., & Hubbert, A. (1994). Encounter satisfaction versus overall satisfactionversus quality. In Rust, R.T. and Oliver, R.L. (Eds.) Service Quality, Sage Publications,London, pp. 72-94.
Bloemer, Josee, de Ruyter, Ko, & Wetzels, Martin (1999). Linking perceived servicequality and service loyalty: A multi-dimensional perspective. European Journal ofMarketing, Vol. 33, No. 11/12, pp. 1082-95.
Bolton, Ruth N., Kannan, P. K., & Bramlett, Matthew D. (2000). Implications of loyaltyprogram membership and service experiences for customer retention and value.Journal of the Academy of Marketing Science, Vol. 28, pp. 95-108.
Bolton, R. (1998). A dynamic model of the duration of the customer’s relationship witha continuous service provider. Marketing Science, Vol. 17, pp. 45-65.
Bolton, R. N., & Drew, J. H. (1991). A multistage model of customers’ assessmentsservice quality and value. Journal of Consumer Research, Vol. 17, March, pp. 375-84.
Brown, T. J., Churchill, G. A., & Peter, J. P. (1993). Research note: Improving themeasurement of service quality. Journal of Retailing, Vol. 69, No. 1, pp. 127-39.
Burnham, T.A., Frels, J.K. & Mahajan, V. (2003). Consumer switching costs: A typology,antecedents and consequences. Journal of the Academy of Marketing Science, Vol.31, pp. 109-26.
Buttle, F. (1996). SERVQUAL: Review, critique, research agenda. European Journal ofMarketing, Vol. 30, No. 1, pp. 8-32.
Buzzell, R.D., & Gale, T. B. (1987). The PIMS principles. Free Press, New York.
Buzzell, R. D., Gale, B. T. & Sultan, R. G. M., (1975). Market share – A key toprofitability. Harvard Business Review, Vol. 53, No. 1, pp. 97-106.
Carman, J. M. (1990). Consumer perceptions of service quality: an assessment of theSERVQUAL dimensions. Journal of Retailing, Vol. 66, pp. 35-55.
Caruana, A. (2002). Service loyalty: The effects of service quality and the mediatingrole of customer satisfaction. European Journal of Marketing, Vol. 36, No. 7/8, pp.811-28.
Cronin, J. J., & Taylor, A. S. (1992). Measuring service quality: A re-examination andextension. Journal of Marketing, Vol. 56, pp. 55-68.
Service Quality Indirectly Influences Customer Loyalty via Customer Satisfaction: Results from a Literature Survey
Rajagiri Management Journal 79
Cronin, J. J., & Taylor, S. A. (1994). SERVPERF versus SERVQUAL: Reconcilingperformance based and perception based – minus – expectation measurements ofservice quality. Journal of Marketing, Vol. 58, No. 1, pp. 125-31.
Cronin, J. J., Brady, M. K., & Hult, G. T. M. (2000). Assessing the effects of quality,value, and customer satisfaction on consumer behavioural intentions in serviceenvironments. Journal of Retailing, Vol. 7, pp. 193-218.
Crosby, L. A., Evans, K. R., & Cowles, D. (1990). Relationship quality in services selling—An interpersonal influence perspective. The Journal of Marketing, Vol. 52, pp. 21–34.
Culiber, B., & Rojsek, Ica (2010). Identifying service quality dimensions as antecedentsto customer satisfaction in retail banking. Economic and Business Review, Vol. 12,No. 3, pp. 151-166.
Dabholkar, P. A., Shepherd, C. D., & Thorpe, D. I. (2000). A comprehensive frameworkfor service quality: An investigation of critical conceptual and measurement issuesthrough a longitudinal study. Journal of Retailing, Vol. 76, No. 2, pp. 139-73.
DeChernatony, L., & McDonald, M. (1998). Creating powerful brands in consumer,services and industrial markets. Butterworth-Heinemann, Oxford.
Dick, A., & Basu, K. (1994). Customer loyalty towards an integrated framework. Journalof theAcademy of Marketing Science, Vol. 22, No. 2, pp. 99-113.
Dukart, J. R. (1998). Quality: Do you measure up? Utility Business, Vol. 1, No. 4, pp.32-38.
Evans, M., & Jamal, A. & Foxall, G. (2006). Consumer behaviour. Wiley, London.
Fick, G. R., & Ritchie, J. R. B. (1991). Measuring service quality in the travel andtourism industry. Journal of Travel Research, Vol. 30, No. 2, pp. 2-9.
Fornell, C. (1992). A national customer satisfaction barometer: The Swedish experience.Journalof Marketing, Vol. 56, pp. 6-21.
Gilbert, D., & Wong, R. (2003). Passenger expectations and airline services: A HongKong based study. Tourism Management, Vol. 24, pp. 519-32.
Gronroos, C. (2001). The perceived service quality concept – A mistake? ManagingService Quality, Vol. 11, No. 3, pp. 150-2.
Sameer Sharma, Divya Mittal and Shiv Ratan Agrawal
Rajagiri Management Journal80

Gruca, T. S., & Rego, R. L. (2005). Customer satisfaction, cash flow, and shareholdervalue. Journal of Marketing, Vol. 69, No. 3, pp. 115-130.
Hartline, M. D.,Maxham, J.G., & McKee,D. O. (2000). Corridors of influence in thedissemination of customer-oriented strategy to customer contact service employees.Journal of Marketing, Vol. 64, No. 2, pp. 35–50.
Heskett, J. L., Sasser, W. E. Jr., & Schlesinger, L. A. (1997). Service profit chain. FreePress, New York.
Heung, V.C.S., Wong, M.Y., & Qu, H. (2000). Airport restaurant service quality inHong Kong: An application of SERVQUAL. Cornell Hotel and RestaurantAdministration Quarterly, Vol. 41, No. 3, pp. 86-97.
Homburg, C., Koschate, N., & Hoyer, W. D. (2005). Do satisfied customers really paymore? A study of the relationship between satisfaction and willingness to pay. Journalof Marketing, Vol. 69, No. 2, pp. 84-96.
Jamal, A., & Naser, K. (2002). Customer satisfaction and retail banking: an assessmentof some of the key antecedents of customer satisfaction in retail banking. InternationalJournal of Bank Marketing, Vol. 20, No. 4, pp. 146-60.
Jamieson, D. (1994). Customer retention: Focus or failure. The TQM Magazine, Vol. 6,No. 5, pp. 11-13.
Johnston, R. (1995). The determinants of service quality: Satisfiers and dissatisfiers.International. Journal of Service Industry Management, Vol. 6, No. 5, pp. 53-71.
Keller, K. L. (1993). Conceptualizing, measuring, and managing customer-based brandequity. Journal of Marketing, Vol. 57, No. 1, pp. 1-22.
Kim, H. J. (2000). Impact of employee service orientation on service quality in therestaurant business. Published doctoral dissertation, Kansas State University.
Kotler, P., & Levy, S. J. (1969). Broadening the concept of marketing. Journal ofMarketing, Vol. 33, No. 1, pp. 10-5.
Ladhari, R. (2009). A review of twenty years of SERVQUAL research. InternationalJournal of Quality and Service Sciences, Vol. 1, No. 2, pp. 172-98.
Leal, R. P., & Pereira, Z. L. (2003). Service recovery at a financial institution.International Journal of Quality and Reliability Management, Vol. 20, No. 6, pp.646-663.
Service Quality Indirectly Influences Customer Loyalty via Customer Satisfaction: Results from a Literature Survey
Rajagiri Management Journal 81
LeBlanc, G., & Nguyen, N. (1988). Customers’ perceptions of service quality in financialinstitutions. The International Journal of Bank Marketing, Vol. 6, No. 4, pp. 7-18.
Levesque, T., & McDougall, G. (1996). Determinants of customer satisfaction in retailbanking. The International Journal of Bank Marketing, Vol. 14, No. 7, pp. 12-20.
Liljander, V., &Strandvik, T. (1995). The nature of customer relationships in services. InT. A. Swartz, D. E. Bowen, & S. W. Brown (Eds.), Advances in services marketingand management, pp. 141–167, London: JAI Press.
Lovelock, C., Patterson, P., & Walker, R. (2001). Services marketing: An Asia-Pacificperspective, 2nd ed., Prentice-Hall, Englewood Cliffs, NewJersey.
Morgan, R., & Hunt, S. (1994). The commitment-trust theory of relationship marketing.Journal of Marketing, Vol. 58, No. 3, pp. 20-38.
Mouawad, M., & Kleiner, B. (1996). New developments in customer service training.Managing Service Quality, Vol. 6, No. 2, pp. 49-56.
Muffato, M., & Panizzolo, R. (1995). A process-based view for customer satisfaction.International Journal of Quality & Reliability Management, Vol. 12, No. 9, pp. 154-69.
Murstein, B. I., Cerreto, M., & MacDonald, M. G. (1977). A theory and investigation ofthe effect of exchange orientation on marriage and friendship. Journal of Marriageand the Family, Vol. 39, pp. 543–548.
Newman, K. (2001). Interrogating SERVQUAL: A critical assessment of service qualitymeasurement in a high street retail bank. International Journal of Bank Marketing,Vol. 19, No. 3, pp. 126-39.
Nguyen, N. (2006). The collective impact of service workers and servicescape on thecorporate image formation. International Journal of Hospitality Management, Vol.25, No. 2, pp. 227-44.
Oliva, T.A., Oliver, R.L., & MacMillan, I.C. (1992). A catastrophe model for developingservice satisfaction strategies. Journal of Marketing, Vol. 56, No. 3, pp. 83-95.
Oliver, R. L. (1980). Cognitive model of the antecedents and consequences of satisfactiondecisions. Journal of Marketing Research, Vol. 17, pp. 460-9.
Oliver, R. L. (1997). Satisfaction: A behavioural perspective on the consumer, McGraw-Hill, New York.
Sameer Sharma, Divya Mittal and Shiv Ratan Agrawal
Rajagiri Management Journal82

Oliver, R. L. (1999). Whence consumer loyalty? Journal of Marketing, Vol. 63, pp.33-34.
Olorunniwo, F., Hsu, M.K., & Udo, G.J. (2006). Service quality, customer satisfaction,and behavioural intentions in the service factory. The Journal of Service Marketing,Vol. 20, No. 1, pp. 59-73.
Parasuraman, A. (1997). Reflections on gaining competitive advantage through customervalue. Journal of the Academy of Marketing Science, Vol. 25, No. 2, pp. 154-61.
Parasuraman, A., Zeithaml, & Berry, L. L. (1985). A conceptual model of service qualityand its implications for future research. Journal of Marketing, Vol. 49, No. 4, pp.41-50.
Parasuraman, A., Zeithaml, V. A., & Berry, L. L. (1988). SERVQUAL: A multiple itemscale for measuring consumer perceptions of service quality. Journal of Retailing,Vol. 64, No. 1, pp. 12-40.
Parasuraman, A., Zeithaml, V. A.,& Berry, L. L. (1991). Refinement and reassessmentof the SERVQUAL scale. Journal of Retailing, Vol. 67, pp. 420-50.
Parasuraman, A., Zeithaml, V. A., & Berry, L. L. (2005). E-S-Qual: A multiple itemscale of assessing electronic service quality. Journal of Service Research, Vol. 7, No.3, pp. 213-33.
Parker, C., & Mathews, B. P. (2001). Customer satisfaction: Contrasting academic andcustomers’ interpretations. Marketing Intelligence & Planning, Vol. 19, No. 1, pp.38-44.
Ravald, A., & Gronroos, C. (1996). The value concept and relationship marketing.European Journal of Marketing, Vol. 30, No. 2, pp. 19–30.
Reichheld, F., & Sasser, W. E. (1990). Zero defections: Quality comes to services. HarvardBusiness Review, Vol. 68, pp. 105-11.
Reichheld, F.F. (1996). The loyalty effect: The hidden force behind growth, profits, andlasting value. Harvard Business School Press, Boston, MA.
Reimer, A., & Kuehn, R. (2005). The impact of servicescape on quality perception.European Journal of Marketing, Vol. 39, No. 7/8, pp. 786-808.
Rundle-Thiele, S., & Mackay, M. M. (2001). Assessing the performance of brand loyaltymeasures. The Journal of Services Marketing, Vol. 15, No. 6/7, pp. 529-46.
Service Quality Indirectly Influences Customer Loyalty via Customer Satisfaction: Results from a Literature Survey
Rajagiri Management Journal 83
Sachdev, S. B., & Verma, H. V. (2004). Relative importance of service quality dimensions:A multi-sectoral study. Journal of Services Research, Vol. 4, No. 1, pp. 93-117.
Saleh, F., & Ryan, C. (1991). Analyzing service quality in the hospitality industry usingthe SERVQUAL model. The Service Industries Journal, Vol. 11, No. 3, pp. 324-43.
Saunders, J. & Watters, R. (1993). Branding financial services. The International Journalof Bank Marketing, Vol. 11, No. 6, pp. 32-9.
Segoro, W. (2013). The influence of perceived service quality, mooring factor, andrelationship quality on customer satisfaction and loyalty. Procedia-Social andBehavioral Sciences, Vol. 81, pp. 306-310.
Selnes, F. (1993). An examination of the effect of product performance on brandreputation, satisfaction and loyalty. European Journal of Marketing, Vol. 27, No. 9,pp. 19-35.
Sharma, N., & Patterson, P. (2000). Switching costs, alternative attractiveness andexperienceas moderators of relationship commitment in professional consumerservices. International Journal of Service Industry Management, Vol. 11, No. 5, pp.470-90.
Shin, D. & Elliott, K. (2001). Measuring customers’ overall satisfaction: A multi-attributesassessment. Services Marketing Quarterly, Vol. 22, No. 1, pp. 3-20.
Smith, A. (1995). Measuring service quality: Is SERVQUAL now redundant? Journal ofMarketing Management, Vol. 11, pp. 257-76.
Spreng, Richard A. & MacKoy, Robert D. (1996). An empirical examination of a modelof perceived service quality and satisfaction. Journal of Retailing, Vol. 72, No. 2,201-214.
Storbacka, K., Strandvik, T. & Grönroos, C. (1994). Managing customer relationshipfor profit: The dynamics of relationship quality. International Journal of ServiceIndustry Management, Vol. 5, No. 5, pp. 21–38.
Sureshchander, G.S., Rajendran, C., & Anatharaman, R.N. (2002), The relationshipbetween service quality and customer satisfaction– A factor specific approach. Journalof Services Marketing, Vol. 16, No. 4, pp. 363-79.
Tantakasem, P., & Lee, S. (2007). Service quality and the customer satisfaction chain inthe Thai banking industry. www.bu.ac.th/knowledgecenter/epaper/jan_june2008/Piti.pdf (accessed October 4, 2008).
Sameer Sharma, Divya Mittal and Shiv Ratan Agrawal
Rajagiri Management Journal84

Taylor, S. A., & Baker, T. L. (1994). An assessment of the relationship between servicequality and customer satisfaction in the formation of consumers’ purchase intentions.Journal of Retailing, Vol. 70, No. 2, pp. 163-78.
Ting, D. H. (2004). Service quality and satisfaction perceptions: Curvilinear andinteraction effect. The International Journal of Bank Marketing, Vol. 22, No. 6, pp.407-20.
Umbrell, C. (2003). Gold star service. American-Gas, Vol. 85, No. 4, pp. 14-16.
Vandamme, P., & Leunis, J. (1993). Development of a multiple-item scale for measuringhospital service quality. International Journal of Service Industry Management, Vol.4, No. 3, pp. 30-49.
Wakefield, K. L., & Blodgett, J. G. (1999). Customer response to intangible and tangibleservice factors. Psychology & Marketing, Vol. 16, No. 1, pp. 51-68.
Wang, Y., Lo, H.P. and Yang, Y. (2004). An integrated framework for service quality,customer value, satisfaction: Evidence from china’s telecommunication industry.Information Systems Frontiers, Vol. 6, No. 4, pp. 325-40.
Wetzels, M. & Wiele, T. V. (2002). Empirical evidence for the relationship betweencustomer satisfaction and business performance. Managing Service Quality, Vol. 12,No. 3, pp 184-193.
Wong, A., & Sohal, A. (2003). Service quality and customer loyalty perspectives on twolevels of retail relationships. Journal of Services Marketing, Vol. 17, No. 5, pp. 495-513.
Wood, J. (2008). The effect of buyers’ perceptions of environmental uncertainty ofsatisfaction and loyalty. Journal of Marketing Theory and Practice, Vol. 16, No. 4,pp. 309-20.
Woodside. A.G., Lisa. L.F., & Robert. T.D. (1989). Linking service quality, customersatisfaction, and behavioural intentions. Journal of Health Care Marketing, Vol. 9,pp. 5-17.
Yang, Z., & Jun, M. (2002). Consumer perception of e-service quality: From internetpurchase and non-purchase perspectives. Journal of Business Strategies, Vol. 19,No. 1, pp. 19-41.
Yavas, U., Bilgin, Z., & Shemwell, D. J. (1997). Service quality in the banking sectorin an emerging economy: A consumer survey. International Journal of Bank Marketing,Vol. 15, No. 6, pp. 217-23.
Service Quality Indirectly Influences Customer Loyalty via Customer Satisfaction: Results from a Literature Survey
Rajagiri Management Journal 85
Zeithaml, V. (2000). Service quality, profitability, and economic worth of customers:What weknow and what we need to learn. Journal of the Academy of MarketingScience, Vol. 28, No. 1, pp. 67-85.
Zeithaml, V. A. (1988). Consumer perceptions of price, quality and value: A means-endmodel and synthesis of evidence. Journal of Marketing, Vol. 52, pp. 2-22.
Zeithaml, V. A., Berry, L. L., & Parasuraman, A. (1996).The behavioural consequencesof service quality. Journal of Marketing, Vol. 52, pp. 2-22.
Zhou, L. (2004). A dimension-specific analysis ofperformance-only measurement ofservice quality and satisfaction in China’s retail banking. The Journal of ServicesMarketing, Vol. 18, No. 6/7, p. 534.
Sameer Sharma, Divya Mittal and Shiv Ratan Agrawal
Rajagiri Management Journal86
Rajagiri Management JournalVolume 9, Issue 1, June 2015
Book Review
The Big Data-Driven Business: How to Use Big Data to WinCustomers, Beat Competitors and Boost Profits, Russel Glass andSean Callahan, John Wiley & Sons, New Jersey, 2015, 224 pages, $21.78.
The author Russell Glass is the head of B2B marketing products for LinkedIn.He is a seasoned technology entrepreneur who founded and then served aspresident and CEO of Bizo, a B2B audience marketing and data platform,which was acquired for $175 million by LinkedIn in 2014. The co-authorSean Callahan is the senior manager (content marketing) at LinkedIn.Formerly he was the marketing director at Bizo.
The book contains 13 chapters and it starts with the “big benefits” of “bigdata”, traces the evolution of data-driven business, discusses the rise ofmarketing department and ends with the future of big data.
Big benefits of big data
The early humans collected and analyzed data using their brains. They useddata to go beyond the surface impressions that senses gave them.Eratosthenes used data to prove that the earth was round and determinedits circumference. Copernicus used data to prove that the earth revolvesaround the sun. The advent of computers has allowed data to grow at a rateof 2.5 quintillion bytes of data every day. The sheer amount of data and ourgrowing ability to process it has led to the coining of the term,“big data”.Big data has impacted everything from sports to politics. Nate Silver, a bigdata practioner in baseball before he moved on to politics, predicted anObama victory in 2008 and 2012. Dan Siroker, now the CEO of Optimizely,used data to make Obama victories actually happen.
Evolution of data-driven business and the buyer’s journey
The two 19th century entrepreneurs, viz., Marshal Field and John Wanamakerestablished department stores built on the philosophy of serving the customer.Sears, Roebuck & Company was established to serve customers in thefarmlands. Today’s companies like Dell, Google and Amazon are data savvyand customer focused.

In the pre-internet days, sales people formed relationships and built trustwith the buyers by having lunch and sharing a drink with them. The buyers’journey changed with the advent of internet. Nowadays, the marketingdepartment traces the digital body language of the buyer.
The rise of the marketing department
The integration of technologies like marketing automation software, businessintelligence databases, CRM systems, data-management platforms andanalytics tools is called the marketing technology stack which enablesmarketers to read the digital body language of the buyers. In this era theCMO needs to work hand-in-hand with the IT department. The relationshipbetween marketing and sales changed from being rocky to that of greateralignment. Companies such as DocuSign and Bizo used technology to createa greater harmony between sales and marketing.
Earlier, the CMOs and the entire marketing department were right-brainedpeople. But, as data-driven digital marketing gained prominence, themarketing department acquired the left-brained talent as well. This changehas helped various CMOs to occupy the CEO positions.
Using data for online advertising to understand customers andpursue prospects
The novelty of banner ads and the increased level of click-through ratescontributed to the rise of internet advertising. The other advances that onlineadvertising offered to marketers were ad networks, audience platforms,online advertising exchanges, retargeted display ads and social mediaadvertising.
Companies like Google, Netflix and Pandora Media (internet radio service)have attained success by collecting and leveraging data to serve customersand create great products. The software as a service (SaaS) business modeland the predictive lead-modelling companies have helped in understandingcustomers and pursuing prospects.
Implementing a big data plan
A large corporation such as Tellabs.com embraced big data. It is easier forsmaller companies and start-ups to implement data-driven marketing
Bejoy John Thomas
Rajagiri Management Journal88
principles. There are eleven principles for bringing big data into thebusiness.
The data has the ability to influence website design, measure PR performance,study the power of display ads and test market-creative campaigns. The dataalso attributes the contribution made by each and every one of a company’smarketing tactics to leads and to revenue. The three basic attribution modelsare last-click attribution, rules-based attribution and algorithmic attribution.
Data can be a matter of corporate life and death
The RDBMS (relational database management system) market controlledby Oracle, IBM and Microsoft was disrupted by a data-driven and customer-focused start-up, Splice Machine. Ignoring of data led to the downfall ofcompanies like DEC, Tower Records and Borders Books & Music. Also, themistake of not embracing data has led to the near death experience ofBlackberry, Culture Clash of New York Times and the missed opportunity ofGeneral Electric.
Corporations need to act responsibly because there are increasing incidentsof corporations crossing the line to know far too much about consumers.The companies need to embrace complete transparency to address the privacyconcerns raised by online advertising and retargeting. The corporations needto own the responsibility of protecting their customers’ privacy.
Big data’s big future
Some of the key trends defining big data’s future are personalization ofwebsite using analytics software, integrating data silos and platforms toget a 360-degree view of the customer, measuring the impact of marketingprogrammes, checking whether the website is navigable in a smartphone,creation of internet-enabled machines that generate their own data, privacysecurity issues, product development and social media generated data. Thebig data is set to transform every industry including healthcare, governmentand the education sector.
The authors have done justice by unraveling the hidden secrets of bigdata.This book is a must read for marketers because the book beautifullytraces the changes that are happening in the marketing department due tothe availability of “big data”. This book will help marketers to rethink on
Book Review
Rajagiri Management Journal 89

certain concepts of marketing. The book provides an interesting experienceto its readers with examples of companies ignoring “big data” and paying aheavy price.
Bejoy John ThomasAssociate Professor
Rajagiri Centre for Business StudiesKakkanad
Kochi – 682039Kerala, India
E-mail: [email protected]
Bejoy John Thomas
Rajagiri Management Journal90

Guidelines for Authors
Contributions to the Rajagiri Management Journal are invited from researchers, practitioners andacademics. Theoretically based and empirically supported well - written articles on managementissues may be submitted as MS-Word file to [email protected] and [email protected]. Along with the manuscript, the authors should provide the undertaking that(i) the article contains the original work of the author(s); (ii) it is neither published earlier nor beingconsidered for publication elsewhere; and (iii) there are no copyright violations with regard to thematerial used in the article.
The cover page of the manuscript should contain the article title, the name and affiliations ofauthors along with their postal address, phone and fax numbers and e-mail address. The secondpage should contain the title of the article, the abstract (100-150 words), and keywords (up to 5words). Acknowledgements, if any, must be mentioned below the keywords.
The length of the article should be 3000-6000 words (inclusive of tables and figures) with about 1inch left, right, and top and bottom margins each. It must have sections and subsections whichare named and numbered as appropriate. The material should be formatted in Times New Roman,font size 12 and double spaced. All tables and figures are to be serially numbered (in Arabicnumerals) and sequentially placed after references in the text. The source should be indicated atthe bottom of tables and figures, wherever necessary. It has to be noted that all tables and figuresare to be also given in a separate word file with the file mentioning the paper to which theybelong. Also, all tables and figures should be in black and white and not in colour.
Rajagiri Journal follows British spelling (e.g. organization, programme, colour and labour) exceptin case of direct quotations.
For citations, references and endnotes/footnotes, guidelines specified in the Publication Manualof the American Psychological Association (APA) must be followed.
Subscription
Rajagiri Management Journal is published twice a year. Annual subscription for each volume oftwo issues (print edition) is Rs.600. Please send cheque or DD in favour of Principal, RajagiriCollege of Social Sciences payable in Kochi to Librarian, Rajagiri Centre for Business Studies,Rajagiri Valley, P.O. Kakkanad, Kochi - 682039, Kerala. E-mail: [email protected].