Embed Size (px)
Citation preview
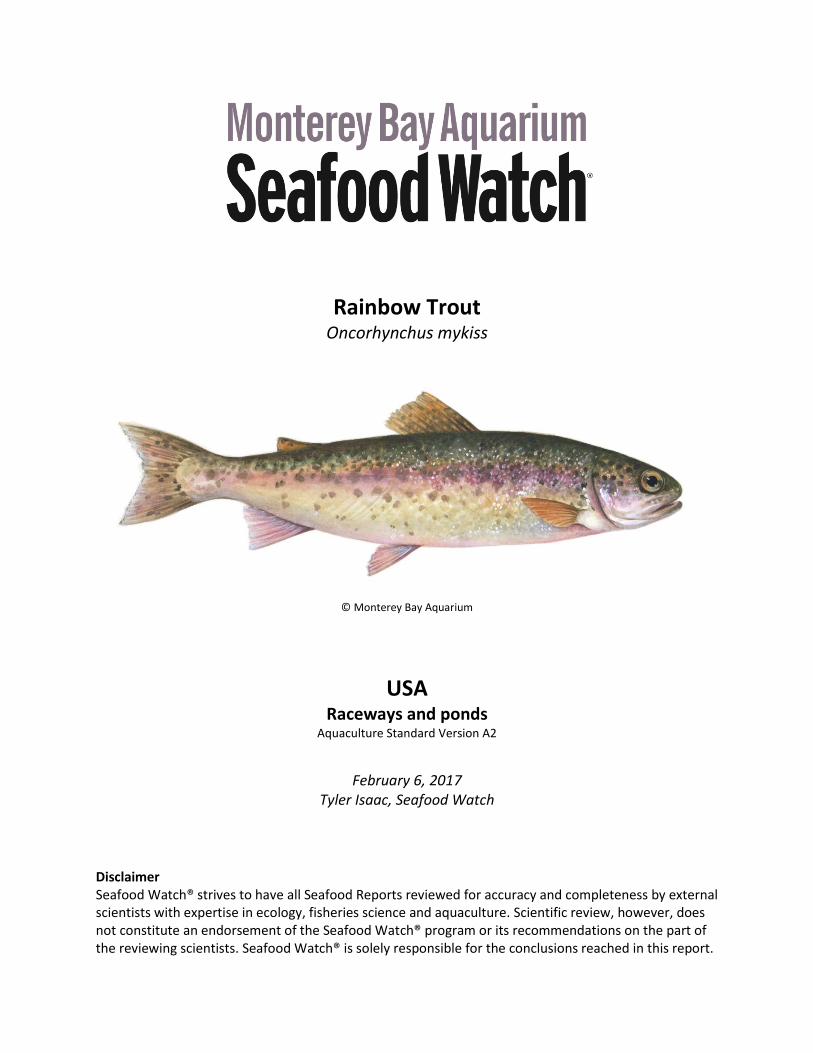
Rainbow Trout Oncorhynchus mykiss
© Monterey Bay Aquarium
USA Raceways and ponds
Aquaculture Standard Version A2
February 6, 2017
Tyler Isaac, Seafood Watch
Disclaimer Seafood Watch® strives to have all Seafood Reports reviewed for accuracy and completeness by external scientists with expertise in ecology, fisheries science and aquaculture. Scientific review, however, does not constitute an endorsement of the Seafood Watch® program or its recommendations on the part of the reviewing scientists. Seafood Watch® is solely responsible for the conclusions reached in this report.
2
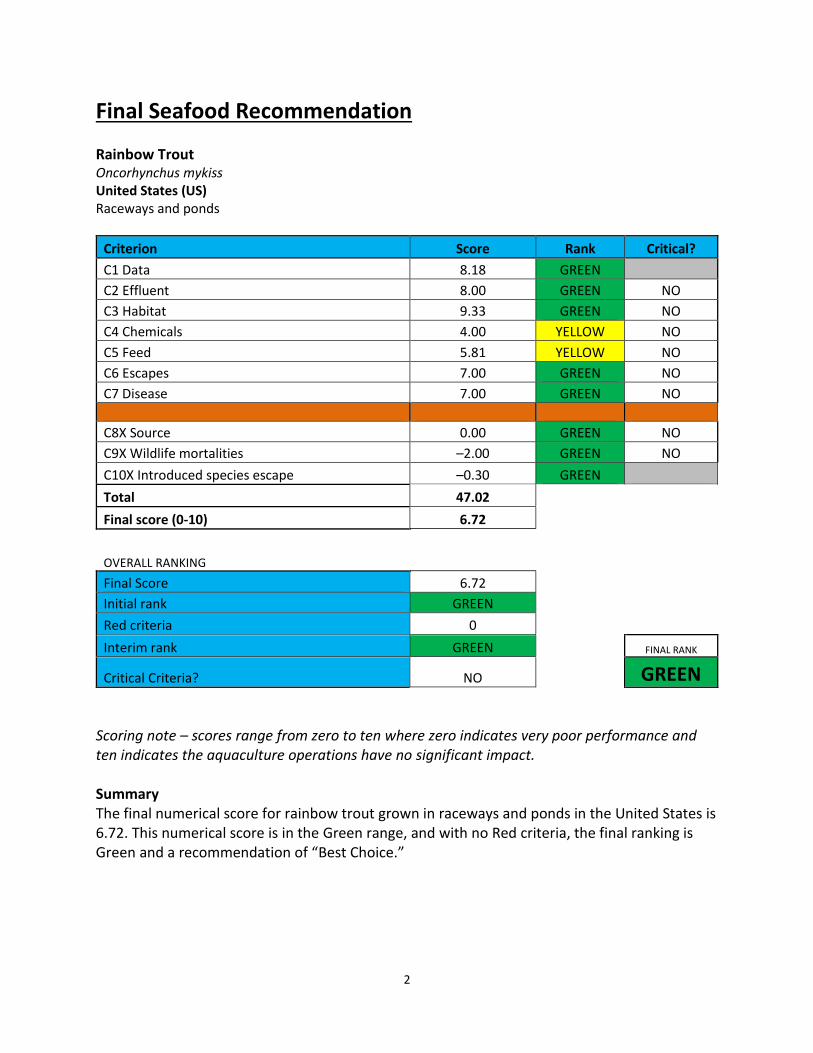
Final Seafood Recommendation Rainbow Trout Oncorhynchus mykiss United States (US) Raceways and ponds
Criterion Score Rank Critical?
C1 Data 8.18 GREEN
C2 Effluent 8.00 GREEN NO
C3 Habitat 9.33 GREEN NO
C4 Chemicals 4.00 YELLOW NO
C5 Feed 5.81 YELLOW NO
C6 Escapes 7.00 GREEN NO
C7 Disease 7.00 GREEN NO
C8X Source 0.00 GREEN NO
C9X Wildlife mortalities –2.00 GREEN NO
C10X Introduced species escape –0.30 GREEN
Total 47.02
Final score (0-10) 6.72
OVERALL RANKING
Final Score 6.72
Initial rank GREEN
Red criteria 0
Interim rank GREEN FINAL RANK
Critical Criteria? NO GREEN
Scoring note – scores range from zero to ten where zero indicates very poor performance and ten indicates the aquaculture operations have no significant impact.
Summary The final numerical score for rainbow trout grown in raceways and ponds in the United States is 6.72. This numerical score is in the Green range, and with no Red criteria, the final ranking is Green and a recommendation of “Best Choice.”

3
Executive Summary Rainbow trout is native to many North American rivers and lakes that drain into the Pacific Ocean. It has also been introduced throughout much of North America (and the world) to establish sport fisheries. The United States produces over 20,000 metric tons (MT) of rainbow trout in freshwater systems annually, making it the eighth-largest producer worldwide, yet it is still a significant net importer of the species: the U.S. exported approximately $4 million worth (≈616 MT) of rainbow trout in 2015, but imported over $104 million worth (≈12,000 MT). The majority of production in the U.S. occurs in flow-through (i.e., single-pass) concrete raceways, though pond production does occur. Data. There is a large body of scientific literature on the rainbow trout industry in the U.S.
Published data on such topics such as feed, source of stock, and habitats were more readily
available than information on chemical use, escapes, and interactions with predators and
wildlife. Direct communications with academics and farm managers provided valuable data to
supplement the primary literature; the final score for Criterion 1 – Data is 8.18 out of 10.
Effluent. Although flow-through production systems inherently result in the discharge of
effluent, this has been an active area of research for over 20 years, with many improvements.
Waste production in trout farms can be significant, but the data show that flow-through
freshwater rainbow trout farm effluent discharges do not cause or contribute to cumulative
environmental impacts, beyond the well-regulated and enforced ecologically acceptable
impacts set by federal and state assessments. Thus, the effluent concern associated with flow-
through freshwater rainbow trout production is considered low, and the final score for Criterion
2 – Effluent is 8 out of 10.
Habitat. Though the immediate terrestrial farm footprint of raceway and pond rainbow trout
farms is altered, the broader environment in which farms are sited is shown to maintain habitat
functionality with minor impacts. Regulation and enforcement ensures that the continued
operation of the farms, including the adjacent water bodies, does not result in unacceptable
habitat impacts. Overall, raceways and ponds in the U.S. are scored 9.33 out of 10.
Chemical Use. Chemicals are used in trout aquaculture to control bacterial and fungal diseases,
but available information suggests that the amounts used are small. Because of the lack of any
industry or national reporting mechanism, there is uncertainty regarding the actual amount of
chemicals used. Beginning on January 1, 2017, any medicated feed must be administered under
veterinary prescription and oversight. Any chemicals that are used may be discharged into
downstream environments, and potentially include antibiotics that are highly important for
human medicine (these are permitted for use in U.S. aquaculture). A precautionary approach is
4
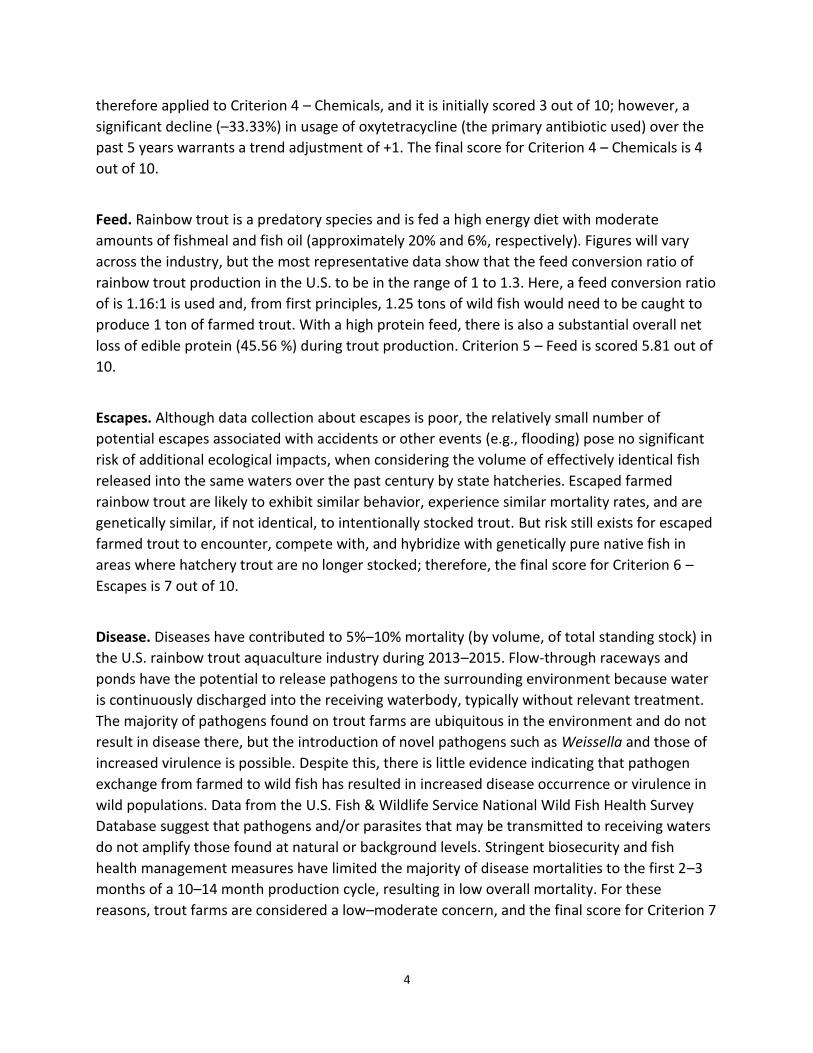
therefore applied to Criterion 4 – Chemicals, and it is initially scored 3 out of 10; however, a
significant decline (–33.33%) in usage of oxytetracycline (the primary antibiotic used) over the
past 5 years warrants a trend adjustment of +1. The final score for Criterion 4 – Chemicals is 4
out of 10.
Feed. Rainbow trout is a predatory species and is fed a high energy diet with moderate
amounts of fishmeal and fish oil (approximately 20% and 6%, respectively). Figures will vary
across the industry, but the most representative data show that the feed conversion ratio of
rainbow trout production in the U.S. to be in the range of 1 to 1.3. Here, a feed conversion ratio
of is 1.16:1 is used and, from first principles, 1.25 tons of wild fish would need to be caught to
produce 1 ton of farmed trout. With a high protein feed, there is also a substantial overall net
loss of edible protein (45.56 %) during trout production. Criterion 5 – Feed is scored 5.81 out of
10.
Escapes. Although data collection about escapes is poor, the relatively small number of
potential escapes associated with accidents or other events (e.g., flooding) pose no significant
risk of additional ecological impacts, when considering the volume of effectively identical fish
released into the same waters over the past century by state hatcheries. Escaped farmed
rainbow trout are likely to exhibit similar behavior, experience similar mortality rates, and are
genetically similar, if not identical, to intentionally stocked trout. But risk still exists for escaped
farmed trout to encounter, compete with, and hybridize with genetically pure native fish in
areas where hatchery trout are no longer stocked; therefore, the final score for Criterion 6 –
Escapes is 7 out of 10.
Disease. Diseases have contributed to 5%–10% mortality (by volume, of total standing stock) in
the U.S. rainbow trout aquaculture industry during 2013–2015. Flow-through raceways and
ponds have the potential to release pathogens to the surrounding environment because water
is continuously discharged into the receiving waterbody, typically without relevant treatment.
The majority of pathogens found on trout farms are ubiquitous in the environment and do not
result in disease there, but the introduction of novel pathogens such as Weissella and those of
increased virulence is possible. Despite this, there is little evidence indicating that pathogen
exchange from farmed to wild fish has resulted in increased disease occurrence or virulence in
wild populations. Data from the U.S. Fish & Wildlife Service National Wild Fish Health Survey
Database suggest that pathogens and/or parasites that may be transmitted to receiving waters
do not amplify those found at natural or background levels. Stringent biosecurity and fish
health management measures have limited the majority of disease mortalities to the first 2–3
months of a 10–14 month production cycle, resulting in low overall mortality. For these
reasons, trout farms are considered a low–moderate concern, and the final score for Criterion 7

5
– Disease is 7 out of 10.
Source of Stock. Rainbow trout are sourced from fully domesticated broodstock. No harvesting
or collection of wild animals is required. Criterion 8X – Source of Stock is scored –0 out of –10.
Predator and Wildlife Mortalities. Non-lethal and exclusionary techniques are the primary
methods used to manage interactions with predators and wildlife on trout farms. When
necessary, lethal means can be used with appropriate permits and are managed by the U.S. Fish
and Wildlife Service. Wildlife mortalities are known to occur at a low level and are generally
limited to exceptional cases. Lethal control of predatory birds is prohibited without a permit
with few exceptions, and populations of predatory birds and mammals are not significantly
affected by aquaculture predation control. For these reasons, the final score for Criterion 9X –
Predator and Wildlife Mortalities is –2 out of –10.
Unintentional Species Introductions. Trout hatcheries are located across the country and, in
general, there is no need to transport animals internationally or across water bodies (> 90%); in
some cases, eggs are shipped from facilities in the western U.S. to farms throughout the U.S., as
well as occasionally imported from Denmark. The biosecurity of egg production facilities is high,
and eggs are often certified disease-free. Thus, there is low risk of unintentionally introducing
non-native species (i.e., species other than the cultured trout) during animal shipments. The
scoring deduction for Criterion 10X – Escape of Unintentionally Introduced Species is –0.30 out
of –10.
Summary Overall, rainbow trout aquaculture in the U.S. receives a numerical score of 6.72 (in the Green or “Best Choice” range), and there are no Red scores. Therefore, the final recommendation for rainbow trout farmed in raceways and ponds in the United States is Green and “Best Choice.”
6
Table of Contents Final Seafood Recommendation .................................................................................................................. 2
Executive Summary ...................................................................................................................................... 3
About Seafood Watch® ................................................................................................................................ 7
Guiding Principles ......................................................................................................................................... 8
Introduction ................................................................................................................................................ 10
Scope of the analysis and ensuing recommendation ........................................................................... 10
Analysis ....................................................................................................................................................... 13
Scoring guide ........................................................................................................................................... 13
Criterion 1: Data quality and availability ................................................................................................ 14
Criterion 2: Effluent ................................................................................................................................ 18
Criterion 3: Habitat ................................................................................................................................. 24
Criterion 4: Evidence or Risk of Chemical Use ........................................................................................ 28
Criterion 5: Feed ..................................................................................................................................... 35
Criterion 6: Escapes ................................................................................................................................. 43
Criterion 7. Disease; pathogen and parasite interactions ...................................................................... 48
Criterion 8X. Source of Stock – independence from wild fish stocks ..................................................... 54
Criterion 9X: Wildlife and predator mortalities ...................................................................................... 55
Criterion 10X: Escape of unintentionally introduced species ................................................................. 58
Overall Recommendation .......................................................................................................................... 60
Acknowledgements .................................................................................................................................... 61
References .................................................................................................................................................. 62
Data points and all scoring calculations .................................................................................................... 76
7
About Seafood Watch® Monterey Bay Aquarium’s Seafood Watch® program evaluates the ecological sustainability of wild-caught and farmed seafood commonly found in the United States marketplace. Seafood Watch® defines sustainable seafood as originating from sources, whether wild-caught or farmed, which can maintain or increase production in the long-term without jeopardizing the structure or function of affected ecosystems. Seafood Watch® makes its science-based recommendations available to the public in the form of regional pocket guides that can be downloaded from www.seafoodwatch.org. The program’s goals are to raise awareness of important ocean conservation issues and empower seafood consumers and businesses to make choices for healthy oceans. Each sustainability recommendation on the regional pocket guides is supported by a Seafood Report. Each report synthesizes and analyzes the most current ecological, fisheries and ecosystem science on a species, then evaluates this information against the program’s conservation ethic to arrive at a recommendation of “Best Choices”, “Good Alternatives” or “Avoid”. The detailed evaluation methodology is available upon request. In producing the Seafood Reports, Seafood Watch® seeks out research published in academic, peer-reviewed journals whenever possible. Other sources of information include government technical publications, fishery management plans and supporting documents, and other scientific reviews of ecological sustainability. Seafood Watch® Research Analysts also communicate regularly with ecologists, fisheries and aquaculture scientists, and members of industry and conservation organizations when evaluating fisheries and aquaculture practices. Capture fisheries and aquaculture practices are highly dynamic; as the scientific information on each species changes, Seafood Watch®’s sustainability recommendations and the underlying Seafood Reports will be updated to reflect these changes. Parties interested in capture fisheries, aquaculture practices and the sustainability of ocean ecosystems are welcome to use Seafood Reports in any way they find useful. For more information about Seafood Watch® and Seafood Reports, please contact the Seafood Watch® program at Monterey Bay Aquarium by calling 1-877-229-9990. Disclaimer Seafood Watch® strives to have all Seafood Reports reviewed for accuracy and completeness by external scientists with expertise in ecology, fisheries science and aquaculture. Scientific review, however, does not constitute an endorsement of the Seafood Watch® program or its recommendations on the part of the reviewing scientists. Seafood Watch® is solely responsible for the conclusions reached in this report. Seafood Watch® and Seafood Reports are made possible through a grant from the David and Lucile Packard Foundation.

8
Guiding Principles Seafood Watch® defines sustainable seafood as originating from sources, whether fished1 or farmed, that can maintain or increase production in the long-term without jeopardizing the structure or function of affected ecosystems. The following guiding principles illustrate the qualities that aquaculture must possess to be considered sustainable by the Seafood Watch program: Seafood Watch will:
Support data transparency and therefore aquaculture producers or industries that make
information and data on production practices and their impacts available to relevant
stakeholders.
Promote aquaculture production that minimizes or avoids the discharge of wastes at the
farm level in combination with an effective management or regulatory system to control
the location, scale and cumulative impacts of the industry’s waste discharges beyond the
immediate vicinity of the farm.
Promote aquaculture production at locations, scales and intensities that cumulatively
maintain the functionality of ecologically valuable habitats without unreasonably penalizing
historic habitat damage.
Promote aquaculture production that by design, management or regulation avoids the use
and discharge of chemicals toxic to aquatic life, and/or effectively controls the frequency,
risk of environmental impact and risk to human health of their use
Within the typically limited data availability, use understandable quantitative and relative
indicators to recognize the global impacts of feed production and the efficiency of
conversion of feed ingredients to farmed seafood.
Promote aquaculture operations that pose no substantial risk of deleterious effects to wild
fish or shellfish populations through competition, habitat damage, genetic introgression,
hybridization, spawning disruption, changes in trophic structure or other impacts associated
with the escape of farmed fish or other unintentionally introduced species.
Promote aquaculture operations that pose no substantial risk of deleterious effects to wild
populations through the amplification and retransmission of pathogens or parasites.
promote the use of eggs, larvae, or juvenile fish produced in hatcheries using domesticated
broodstocks thereby avoiding the need for wild capture
1 “Fish” is used throughout this document to refer to finfish, shellfish and other invertebrates.

9
recognize that energy use varies greatly among different production systems and can be a
major impact category for some aquaculture operations, and also recognize that improving
practices for some criteria may lead to more energy intensive production systems (e.g.
promoting more energy-intensive closed recirculation systems)
Once a score and rank has been assigned to each criterion, an overall seafood recommendation is developed on additional evaluation guidelines. Criteria ranks and the overall recommendation are color-coded to correspond to the categories on the Seafood Watch pocket guide: Best Choices/Green: Are well managed and caught or farmed in environmentally friendly ways. Good Alternatives/Yellow: Buy, but be aware there are concerns with how they’re caught or farmed. Avoid/Red: Take a pass on these. These items are overfished or caught or farmed in ways that harm other marine life or the environment.
10
Introduction
Scope of the analysis and ensuing recommendation Species: Rainbow trout (Oncorhynchus mykiss) Geographic coverage: United States of America Production Methods: Raceways and ponds
Species Overview Rainbow trout (Oncorhynchus mykiss) is a salmonid fish native to the streams, rivers, and lakes that drain to the Pacific Ocean; it ranges from Alaska to Mexico and belongs to the genus Oncorhynchus, which includes the closely related Pacific salmon and many Pacific trout species. Some rainbow trout, known as steelhead, are anadromous, meaning that they begin their life in freshwater, travel to the ocean for their adult development, and return to freshwater to spawn (Behnke 2002). As many as seven distinct sub-species of rainbow trout have been identified, but there is no clear agreement by taxonomists. These include coastal rainbow trout, several sub-species of redband trout, and those trout native to the Gulf of California (Behnke 2002). Rainbow trout is a fast growing, coldwater fish that typically grows to sizes of 1–3 kg, with larger sea-run steelhead often reaching 10 kg, although sizes of up to 25 kg have been reported (Behnke 2002). It has a speckled body with a darker dorsal surface and silvery sides that have a pink-to-red band. This band is often iridescent, resembling a rainbow, which gives the fish its common name. Its diet in the wild is varied and includes many insects, crustaceans, other small fish, and eggs. Because of its popularity as a sport and food fish, rainbow trout has been intentionally introduced all over the world and currently inhabits all continents except Antarctica (FAO 2016a). In North America, breeding populations of rainbow trout are established throughout most of the United States and Canada (NatureServe 2016). The rearing of rainbow trout began in the United States in the 1800s and was undertaken principally for stocking purposes. This stocking continues to this day, albeit in a more controlled manner to avoid negative ecological consequences of introduction into new habitats. Rainbow trout aquaculture for the purpose of food-fish market production began in earnest in the 1960s. It has since grown amid innovations in management and feed that have resulted in more efficient and less impactful production techniques. As mentioned, some rainbow trout have a marine component to their life cycle; these fish are known as steelhead or steelhead trout. Although steelhead trout are farmed in many parts of the world, the farm sites assessed in this report are freshwater-only systems. Therefore, the ensuing recommendation covers only O. mykiss farmed in freshwater systems, known as rainbow trout.

11
Production system The farm sites assessed in this report are freshwater-only systems. In the U.S., rainbow trout is most commonly grown in raceways (over 90% of production); these flow-through tanks are usually concrete, although earth and other materials are also used (Fornshell and Hinshaw 2008). When multiple tanks are used, raceways can be arranged in series and/or in parallel with water flowing along a downhill gradient. The scale of a farm’s production is limited by the amount of freshwater available, and the source of water depends on the geography of the farm site; in Idaho (the largest producer state, responsible for approximately 67% of production (USDA 2016a)), groundwater is used, while in North Carolina (the second-largest producer, responsible for approximately 6% of production (USDA 2016a)) surface water is diverted from nearby water bodies (Fornshell and Hinshaw 2008). Groundwater sources typically provide stable temperatures and a low risk of pathogen introduction, but they may be lower in dissolved oxygen and higher in gasses deleterious to fish (e.g., carbon dioxide, nitrogen, hydrogen sulfide) compared to surface water (Hinshaw et al. 2004). Regardless of the water source, the flow-through nature of raceway systems necessitates that water exchange and turnover rates are high in order to maintain water quality, and range from four to nine system volume turnovers per hour (Fornshell et al. 2012). Waste discharged from raceways includes high volumes of effluent containing low concentrations of dissolved metabolites, and includes suspended particulate wastes (fecal matter and unconsumed feeds) (Fornshell and Hinshaw 2008) (Fornshell et al. 2012). The majority of wastes in effluent are dissolved metabolites, such as ammonia, nitrite, nitrate, and phosphate, and discharged directly into receiving waterbodies; however, 7%–32% of total N (TN) and 30%–84% total P (TP) are bound as particulate waste and captured through solids removal (Sindilariu 2007). The most common system to capture and remove solids from concrete raceways in the U.S. is a combination of quiescent (fish-free) zones and off-line settling basins, which effectively separate the majority of solids wastes from effluent discharges (Fornshell et al. 2012) (Hinshaw et al. 2004). The second most common method used for the cultivation of rainbow trout is earthen ponds. These are either created by using soil to build embankments (i.e., dikes) for holding water, by damming low-lying areas, or some combination of the two (Tucker et al. 2008b). Although at one time this was the predominant form of trout aquaculture, it has become much less frequent because raceways are able to produce more fish with the same amount of water (Fornshell 2002). The source of water for ponds is highly variable and includes stream water, groundwater, surface runoff from precipitation, and diverted water from watersheds (Tucker et al. 2008b). In ponds, conditions are subject to the natural processes of the environment and water turnover rate is low (between one to four volume turnovers per hour) (Westers 2000). Because of this, ponds often act as settling basins and solids settle, resuspend, and resettle frequently; the result is a buildup of heavier, large particles, but an estimated 80% end up as fine (5–20 um) particles that remain suspended in relatively low
12
concentrations (< 10 mg/L) (Westers 2000). It is therefore difficult to manage effluent discharges from ponds, because settling ponds and micro-screening are not effective in removing low concentrations of small particles (Westers 2000). In both ponds and raceway flow-through production systems, water is discharged back into the waterbody from which it was sourced (Fornshell et al. 2012) (Fornshell and Hinshaw 2008) (Hinshaw et al. 2004). Production Statistics In 2014, the culture of rainbow trout in freshwater systems worldwide reached a total of 576,902 MT (FAO 2016b). Global annual production had consistently increased from 2004 to 2013, and peaked at 580,066 MT in 2013 before falling to 2014 levels. This production occurs in over 70 countries but is dominated by a few large producers; in 2014, the top three—Iran, Turkey, and Italy—produced 126,515, 107,533, and 34,400 MT, respectively, accounting for approximately 47% of global production. In that same year, the U.S. produced 21,979 MT, or just under 4% of global production, making it the eighth-largest producer of rainbow trout in freshwater systems (FAO 2016b). In 2015, American production of trout (mostly rainbow trout but including other trout species) was approximately 26,300 MT for a total value of USD 94.4 million (USDA 2016a). The culture of trout occurs in more than 16 states but about 67% (by volume) of this occurs in Idaho, concentrated in the Snake River region (USDA 2016a) (Hardy et al. 2000) (pers. comm., Gary Fornshell, University of Idaho, July 2016). Other prominent producer states include North Carolina, California, and Pennsylvania (USDA 2016a). Import and export sources and statistics Exports of fresh and frozen rainbow trout in the United States are small, because most of the production is sold and consumed domestically. After reaching a value of $5.9 million (807.2 MT) in 2012, exports declined to roughly $4.4 million (616.1 MT) in 2015 (USDA 2016b). Exports in 2016 appear to be aligned with those in 2015, reaching a value of $2.1 million (446.8 MT) as of July 2016 (USDA 2016b). Overwhelmingly, these exports are bound for Canada, which accounted for $4.2 million of exports in 2015 (nearly 97%) (USDA 2016b). Imports of trout are much more significant than exports and have been increasing steadily, reaching a value of over $104 million in 2015, surpassing the value of domestic production ($96.4 million). The majority of these imports are from Chile, and secondarily from Norway, accounting for USD 65.2 and 19.4 million, respectively, in 2015 (more than 80% of total combined) (NOAA 2016). Common and market names Rainbow trout (USFDA, 2016a). Commonly sold as steelhead or steelhead trout, but as described above, this report’s recommendation covers only freshwater-grown rainbow trout.
13
Product forms Rainbow trout is commonly sold either whole or as fillets. These can be fresh, frozen, smoked or other value-added products (e.g., breaded, ready-made).
Analysis
Scoring guide With the exception of the exceptional Criterion (8X, 9X, and 10X), all scores result in a zero
to ten final score for the criterion and the overall final rank. A zero score indicates poor performance, while a score of ten indicates high performance. In contrast, the two exceptional factors result in negative scores from zero to minus ten, and in these cases zero indicates no negative impact.
The full Seafood Watch Aquaculture Criteria that the following scores relate to are available here http://www.seafoodwatch.org/cr/cr_seafoodwatch/content/media/mba_seafoodwatch_aquaculturecriteramethodology.pdf
The full data values and scoring calculations are available in Annex 1
14
Criterion 1: Data quality and availability
Impact, unit of sustainability and principle
Impact: poor data quality and availability limits the ability to assess and understand the impacts of aquaculture production. It also does not enable informed choices for seafood purchasers, nor enable businesses to be held accountable for their impacts.
Sustainability unit: the ability to make a robust sustainability assessment Principle: robust and up-to-date information on production practices and their impacts is available to
relevant stakeholders.
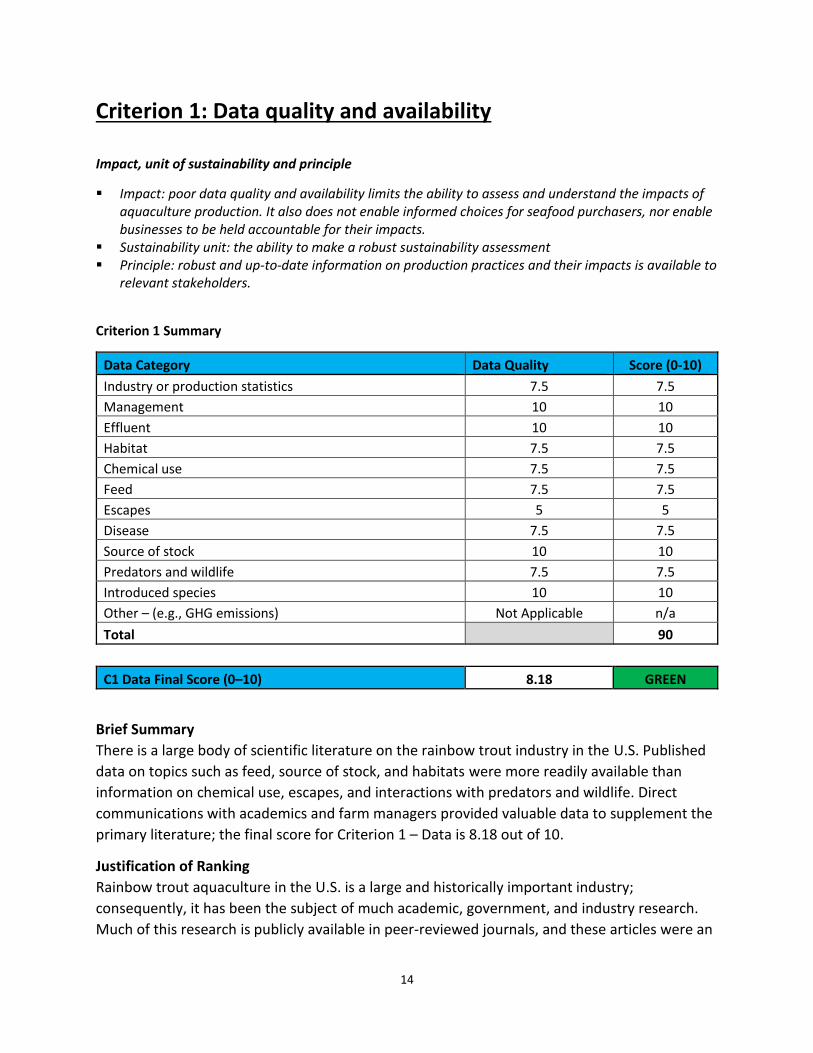
Criterion 1 Summary
Data Category Data Quality Score (0-10)
Industry or production statistics 7.5 7.5
Management 10 10
Effluent 10 10
Habitat 7.5 7.5
Chemical use 7.5 7.5
Feed 7.5 7.5
Escapes 5 5
Disease 7.5 7.5
Source of stock 10 10
Predators and wildlife 7.5 7.5
Introduced species 10 10
Other – (e.g., GHG emissions) Not Applicable n/a
Total 90
C1 Data Final Score (0–10) 8.18 GREEN
Brief Summary
There is a large body of scientific literature on the rainbow trout industry in the U.S. Published
data on topics such as feed, source of stock, and habitats were more readily available than
information on chemical use, escapes, and interactions with predators and wildlife. Direct
communications with academics and farm managers provided valuable data to supplement the
primary literature; the final score for Criterion 1 – Data is 8.18 out of 10.
Justification of Ranking
Rainbow trout aquaculture in the U.S. is a large and historically important industry;
consequently, it has been the subject of much academic, government, and industry research.
Much of this research is publicly available in peer-reviewed journals, and these articles were an
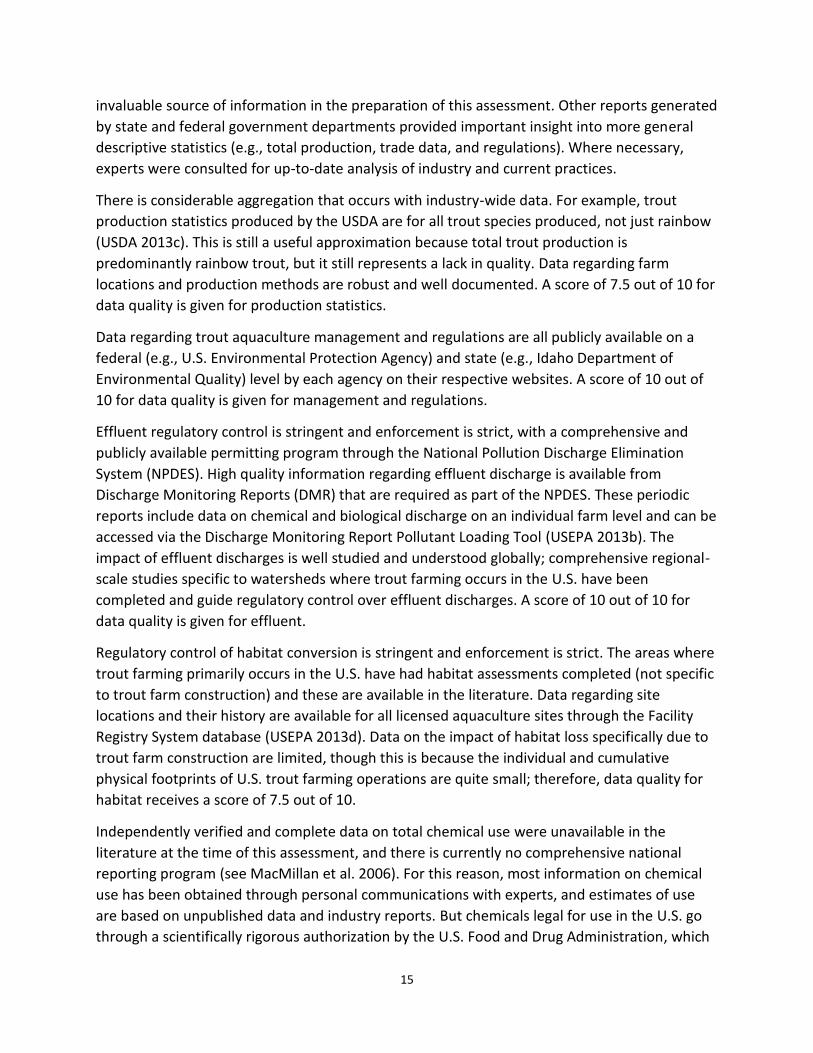
15
invaluable source of information in the preparation of this assessment. Other reports generated
by state and federal government departments provided important insight into more general
descriptive statistics (e.g., total production, trade data, and regulations). Where necessary,
experts were consulted for up-to-date analysis of industry and current practices.
There is considerable aggregation that occurs with industry-wide data. For example, trout
production statistics produced by the USDA are for all trout species produced, not just rainbow
(USDA 2013c). This is still a useful approximation because total trout production is
predominantly rainbow trout, but it still represents a lack in quality. Data regarding farm
locations and production methods are robust and well documented. A score of 7.5 out of 10 for
data quality is given for production statistics.
Data regarding trout aquaculture management and regulations are all publicly available on a
federal (e.g., U.S. Environmental Protection Agency) and state (e.g., Idaho Department of
Environmental Quality) level by each agency on their respective websites. A score of 10 out of
10 for data quality is given for management and regulations.
Effluent regulatory control is stringent and enforcement is strict, with a comprehensive and
publicly available permitting program through the National Pollution Discharge Elimination
System (NPDES). High quality information regarding effluent discharge is available from
Discharge Monitoring Reports (DMR) that are required as part of the NPDES. These periodic
reports include data on chemical and biological discharge on an individual farm level and can be
accessed via the Discharge Monitoring Report Pollutant Loading Tool (USEPA 2013b). The
impact of effluent discharges is well studied and understood globally; comprehensive regional-
scale studies specific to watersheds where trout farming occurs in the U.S. have been
completed and guide regulatory control over effluent discharges. A score of 10 out of 10 for
data quality is given for effluent.
Regulatory control of habitat conversion is stringent and enforcement is strict. The areas where
trout farming primarily occurs in the U.S. have had habitat assessments completed (not specific
to trout farm construction) and these are available in the literature. Data regarding site
locations and their history are available for all licensed aquaculture sites through the Facility
Registry System database (USEPA 2013d). Data on the impact of habitat loss specifically due to
trout farm construction are limited, though this is because the individual and cumulative
physical footprints of U.S. trout farming operations are quite small; therefore, data quality for
habitat receives a score of 7.5 out of 10.
Independently verified and complete data on total chemical use were unavailable in the
literature at the time of this assessment, and there is currently no comprehensive national
reporting program (see MacMillan et al. 2006). For this reason, most information on chemical
use has been obtained through personal communications with experts, and estimates of use
are based on unpublished data and industry reports. But chemicals legal for use in the U.S. go
through a scientifically rigorous authorization by the U.S. Food and Drug Administration, which
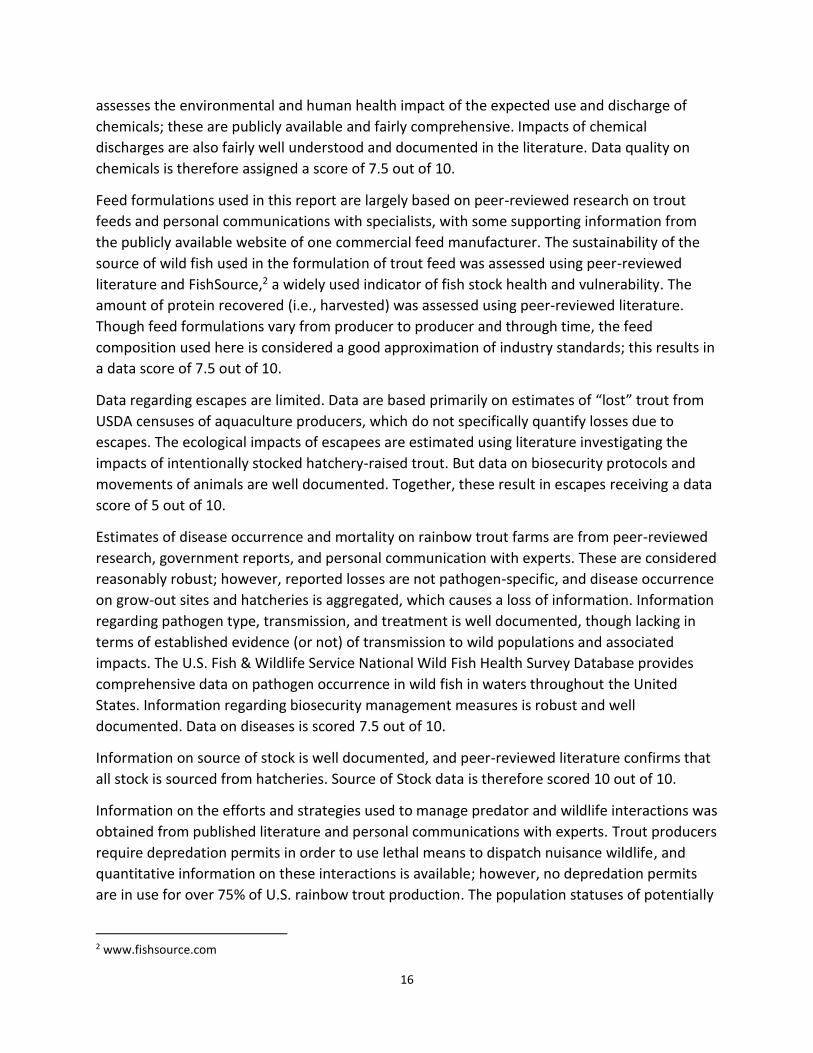
16
assesses the environmental and human health impact of the expected use and discharge of
chemicals; these are publicly available and fairly comprehensive. Impacts of chemical
discharges are also fairly well understood and documented in the literature. Data quality on
chemicals is therefore assigned a score of 7.5 out of 10.
Feed formulations used in this report are largely based on peer-reviewed research on trout
feeds and personal communications with specialists, with some supporting information from
the publicly available website of one commercial feed manufacturer. The sustainability of the
source of wild fish used in the formulation of trout feed was assessed using peer-reviewed
literature and FishSource,2 a widely used indicator of fish stock health and vulnerability. The
amount of protein recovered (i.e., harvested) was assessed using peer-reviewed literature.
Though feed formulations vary from producer to producer and through time, the feed
composition used here is considered a good approximation of industry standards; this results in
a data score of 7.5 out of 10.
Data regarding escapes are limited. Data are based primarily on estimates of “lost” trout from
USDA censuses of aquaculture producers, which do not specifically quantify losses due to
escapes. The ecological impacts of escapees are estimated using literature investigating the
impacts of intentionally stocked hatchery-raised trout. But data on biosecurity protocols and
movements of animals are well documented. Together, these result in escapes receiving a data
score of 5 out of 10.
Estimates of disease occurrence and mortality on rainbow trout farms are from peer-reviewed
research, government reports, and personal communication with experts. These are considered
reasonably robust; however, reported losses are not pathogen-specific, and disease occurrence
on grow-out sites and hatcheries is aggregated, which causes a loss of information. Information
regarding pathogen type, transmission, and treatment is well documented, though lacking in
terms of established evidence (or not) of transmission to wild populations and associated
impacts. The U.S. Fish & Wildlife Service National Wild Fish Health Survey Database provides
comprehensive data on pathogen occurrence in wild fish in waters throughout the United
States. Information regarding biosecurity management measures is robust and well
documented. Data on diseases is scored 7.5 out of 10.
Information on source of stock is well documented, and peer-reviewed literature confirms that
all stock is sourced from hatcheries. Source of Stock data is therefore scored 10 out of 10.
Information on the efforts and strategies used to manage predator and wildlife interactions was
obtained from published literature and personal communications with experts. Trout producers
require depredation permits in order to use lethal means to dispatch nuisance wildlife, and
quantitative information on these interactions is available; however, no depredation permits
are in use for over 75% of U.S. rainbow trout production. The population statuses of potentially
2 www.fishsource.com

17
affected species are well documented and monitored/managed. A data quality score of 7.5 out
of 10 is given.
The overall score for data quality and availability is 8.18 out of 10.
18
Criterion 2: Effluent
Impact, unit of sustainability and principle
Impact: aquaculture species, production systems and management methods vary in the amount of waste produced and discharged per unit of production. The combined discharge of farms, groups of farms or industries contributes to local and regional nutrient loads.
Sustainability unit: the carrying or assimilative capacity of the local and regional receiving waters beyond the farm or its allowable zone of effect.
Principle: aquaculture operations minimize or avoid the production and discharge of wastes at the farm level in combination with an effective management or regulatory system to control the location, scale and cumulative impacts of the industry’s waste discharges beyond the immediate vicinity of the farm.
Criterion 2 Summary Effluent Evidence-Based Assessment
C2 Effluent Final Score (0–10) 8 GREEN
Brief Summary
Although flow-through production systems inherently result in the discharge of effluent, this
has been an active area of research for over 20 years, with many improvements. Waste
production in trout farms can be significant, but the data show that flow-through freshwater
rainbow trout farm effluent discharges do not cause or contribute to cumulative environmental
impacts, particularly beyond the well-regulated and enforced ecologically acceptable impacts
set by federal and state assessments. Thus, the effluent concern associated with flow-through
freshwater rainbow trout production is considered low, and the final score for Criterion 2 –
Effluent is 8 out of 10.
Justification of Ranking
The discharge of effluents containing particulate and dissolved wastes remains one of the most
persistent environmental concerns associated with aquaculture worldwide, especially for
salmonid species reared in freshwater environments, such as rainbow trout (Bureau and Hua
2010) (Tello et al. 2010). This is of particular concern for flow-through (i.e., single-pass) trout
aquaculture systems (Hinshaw and Fornshell 2002) because they represent a continuous
nutrient input into receiving waterbodies. The nutrients ultimately contained in the effluent
first enter the water as aquafeeds. As they pass through the aquaculture system, they can be
divided into three fractions: the first fraction are those nutrients that are digested and retained
in the body of the fish (e.g., rainbow trout body composition contains 15.7% of nitrogen; see
(Dumas et al. 2007)); the second fraction is passed through the body of the fish and released as
solid and dissolved wastes; and the final fraction is in uneaten feed (typically about 5% or less;
see (Aubin et al. 2011) (Hinshaw and Fornshell 2002). It is the last two fractions (wastes and

19
uneaten feed) that flow into downstream environments as effluent if they are not captured and
removed.
Nutrient-rich effluents can impact the receiving ecosystem because they are a source of
nutrients that may otherwise be limiting (nitrogen in seawater and phosphorus in freshwater),
or may be discharged at a rate that does not allow for adequate assimilation, and can lead to
increases in phytoplankton growth, biological oxygen demand, and total suspended solids
(Tucker et al. 2008a). The consequences of these changes may alter the structure and function
of downstream ecosystems by contributing to eutrophication, hypoxia, changes in species
composition, water turbidity, the accumulation of sediments on the benthos, and direct toxic
effects (Sindilariu 2007).
The quality of data and information regarding the effluent management mechanisms governing
the rainbow trout industry in the United States is robust. Similarly, there is a large body of
literature that characterizes the ecological impact of flow-through trout farm effluent on
receiving waterbodies globally (Camargo et al. 2011) (Viadero et al. 2005) (Boaventura et al.
1997) (Loch et al. 1996). But in the United States, trout farms are often sited in already
degraded watersheds that have multiple user groups, such as agriculture and hydroelectric
power generation, which contribute to nutrient loading in the receiving waterbody (Hurley
2002). Thus, data characterizing the impact of effluent contributions by aquaculture (relative to
other contributing groups) in places like the Snake River Basin (where ≈67% of U.S. trout
production occurs) and North Carolina (6.4% of production) are relatively limited. Still, the
overall ecological impacts in these areas are well documented; in combination with
comprehensive effluent limits and management, data regarding U.S. trout farm effluent and its
impacts are considered available and robust, and the Evidence-Based Assessment method is
used.
Globally, flow-through trout farm effluents are similar in nature, with high volumes of dilute
dissolved and particulate wastes, although ensuing discharge into the environment varies based
on treatment methodology. The majority of waste is soluble and will be discharged as effluent
to the receiving environment without relevant chemical and/or biological treatment (Sindilariu
2007). The particulate (i.e., solid) wastes, which may include 30%–84% of total phosphorus and
7%–32% of total nitrogen wastes, can be partly captured and removed before discharging the
effluent from aquaculture facilities (Sindilariu 2007) (True et al. 2004). This solids filtration is
done using various technologies, including microscreens, separators, flocculation, mobile
screen (e.g., drum, belt) filters, and media (e.g., sand, bead) filters (Fornshell and Hinshaw,
2008) (Sindilariu 2007). Because of the higher economic cost of many of these technologies, the
most common treatment used at rainbow trout farms in the U.S. is sedimentation of solids in a
settling basin situated downstream of production raceways or ponds (Engle et al. 2005)
(Fornshell and Hinshaw 2008) (Hinshaw and Fornshell 2002). Some smaller production systems
often employ filtration alongside sedimentation, but the majority of operations (approximately
95%) use sedimentation only (pers. comm., Gary Fornshell, March 2013). Solids filtration is
20
utilized in order to ensure compliance with federal and state laws that govern effluent
discharges and protect water quality.
In the U.S., effluent discharge from aquaculture operations is regulated at the federal level by
the Environmental Protection Agency (EPA) through the Clean Water Act (CWA) (Jensen and
Zajicek 2008). The CWA mandates that a state designate specific uses of its waterbodies, such
as aquatic life, fishing, and swimming, and assign site-specific water quality standards that will
maintain those uses (CWA Section 303). If the water quality of a given waterbody is not meeting
quality standards, the waterbody must be designated as “water quality limited,” and specific
total maximum daily loads (TMDL) are put in place in order to restore water quality to a level
that achieves state water quality standards (CWA Section 303(d)). TMDLs are plans that provide
a calculation of the maximum amount of a pollutant that a water body can receive, such as
nitrogen or phosphorus, without exceeding state water quality standards (IDEQ 1998).
Maximum pollutant levels are established, and major water user industries, such as
aquaculture, are given allocations that specify how much pollutant each source may discharge
to the waterbody (IDEQ 1998). The specific agency or government department responsible for
regulating and enforcing TMDLs varies by state. In Idaho, for example, regulation is carried out
by the Idaho Department of Environmental Quality’s Water Quality Division, and all aquaculture
development must conform to the TMDL limits that are in place (IDEQ 2016).
The EPA enforces aquaculture discharges via permitting through the National Pollutant
Discharge Elimination System (NPDES) (CWA Section 402). Trout farms that discharge water
more than 30 days per year must have an NPDES permit, unless they produce less than 9,090 kg
of trout per year and use less than 2,272 kg of feed per month. These permits regulate
discharges with either technology-based (TBEL) or water quality-based (WQBEL) effluent
limitations, which are required where TMDLs are in place. TBELs require a “minimum level of
treatment of pollutants for point source discharges based on available treatment technologies,”
such as filters, whereas WQBELs are set based on the water quality standards of the receiving
water and are often included in NPDES permits when TMDLs are not in place, as is the case in
North Carolina (USEPA 2016a). It must be noted that state-specific variations exist with stricter
standards, because NPDES permits are written state by state; for example, Idaho has stricter
standards than West Virginia (Viadero et al. 2005).
Compliance with these regulations must occur throughout production, including times of peak
biomass (pers. comm., Gary Fornshell, March 2013). The EPA actively enforces effluent
restrictions in cooperation with various state-level departments. In instances where farms are
in violation of their NPDES permit, they are first subject to an informal “Notice of Violation,”
which provides instruction for coming into compliance before any penalties are put in place
(Boyd et al. 2008). But penalties have been and are implemented. These can be quite severe;
the EPA has the authority to administer civil penalties of up to $27,500 per day per violation
(CWA Section 309(d)). Information on infractions and penalties is readily available through the
Enforcement and Compliance History Online (ECHO) database (USEPA 2016c). Because of the

21
gravity of the potential penalties, compliance with NPDES permits is almost 100%; there has
only been one formal enforcement action related to exceeding effluent limitations in the past 5
years, a fine of $25,000 taken against a trout farm in Idaho, and none in North Carolina (USEPA
2016c).
In Idaho, the majority (> 90%) of trout farming occurs along a 92-mile stretch of the Snake River
from Milner Dam to King Hill, known as the Upper Snake Rock/Middle Snake River (pers.
comm., Gary Fornshell, June 2016). This segment of the Snake River has been considered
“water-quality limited” and TMDLs were written for total phosphorus (TP) and total suspended
solids (TSS) in the Mid-Snake Watershed Management Plan (WMP) in 1999; a TMDL was not
written for nitrogen because data did not show that nitrogen was exceeding water quality
standards or impacting beneficial uses, though data are under continuous review by the Idaho
DEQ (IDEQ 2016a) (IDEQ 1998).
The goal of the WMP is “to improve water quality in the Middle Snake River by reducing
pollution loadings from all sources including tributaries and agricultural returns, so as to restore
the beneficial uses” over the course of 10 years (IDEQ 1998). The Snake River receives pollution
from a number of industries in addition to aquaculture, including irrigated crop production,
rangeland, animal holding areas and feedlots, hydropower, and urban runoff (IDEQ 2016a)
Reduction targets for TP and TSS were set to achieve instream water quality goals (which were
linked to the attainment of state water quality standards for support of cold-water biota such
as native trout) by year 10. State water quality standards are based on ecological factors (such
as aquatic habitat and biological parameters in each waterbody) through a comprehensive
monitoring and assessment process and are reviewed every 3 years (IDEQ 2016a). Therefore,
TP and TSS loadings allocated through NPDES permits are considered to be ecologically
appropriate, in that they do not contribute to cumulative degradation of the waterbody.
Preliminary aquaculture wasteload allocations (WLAs) for TP and TSS were set in 1999 for the
13 largest facilities, and to be reevaluated and set after 3 years for all facilities; the preliminary
WLA for the aquaculture industry required a 40% reduction from measured 1991 TP loadings
(IDEQ 1998). Data were collected and reviewed over 3 years, and overall WLAs were
subsequently modified to include aquaculture WLAs, set to the 40% reduction, in 2004–2005
(IDEQ 2016a).
The required 5-year review, conducted in 2010, revealed that the aquaculture industry reduced
TP loadings by 62% relative to 1991 levels, exceeding their required reduction levels and
discharging less TP than maximally allowed by NPDES permits (IDEQ 2010). Aquaculture was
allocated 987.9 lbs/day TP out of a total 7,464.3 lbs/day (13.2%), yet only contributed 616.7
lbs/day, which was 8.26% of the total TP loading (including all other industries) into the Snake
River. The review also indicated that overall water quality in every segment of the Middle Snake
River is improving in regard to both TP and TSS relative to pre-2000 levels (IDEQ 2010). Data
show that >99% of the Middle Snake River has met the 10-year TSS target of < 52.0 mg/L, while
22
29.2% of the Middle Snake River is currently meeting the 10-year TP target of 0.075 mg/L (IDEQ
2010).
The data show that aquaculture in Idaho is outperforming the required effluent limitations.
These limitations were put in place to improve water quality standards and maintain and
restore beneficial uses, including aquatic life, in the Snake River. There is no evidence that trout
aquaculture effluent discharges cause or contribute to cumulative impacts, particularly beyond
the well-regulated and enforced acceptable impacts occurring in the Snake River.
In North Carolina, trout farming occurs in the western part of the state in the Appalachian
Mountains, primarily in the French Broad River Basin. Unlike the Snake River in Idaho, the
French Broad River Basin is not considered water-quality limited with respect to nutrient levels
by the EPA, so no TMDLs for nutrient-loading pollutants (particularly TSS and TP) are in place
(USEPA 2016b). For example, normal ambient TP levels in the French Broad River are < 0.05
mg/L, and surrounding reservoirs frequently exhibit TP levels of < 0.02 mg/L; neither TP or TSS
are considered to be parameters of concern (pers. comm., Jeff Hinshaw, July 2016) (NC DEQ
2016) (NC DEQ 2013). Water quality is consistently monitored with monthly measurements in
watersheds throughout the state via the Ambient Monitoring System (NC DEQ 2016).
All of the 35 trout farms actively operating in North Carolina are permitted through an NPDES
general permit or individual permit administered by the North Carolina Department of
Environmental Quality (DEQ); individual permit holders are not covered by the general permit
because they do not meet the general requirements (due to size or location) and receive
individual permits to operate and discharge (pers. comm., Jeff Hinshaw, July 2016).
The content of the general permit includes water-quality based effluent limitations for TSS,
settleable solids (SS), and dissolved oxygen (DO); these limitations are not exclusive to
aquaculture and are found in other industries’ NPDES throughout the state (pers. comm., Jeff
Hinshaw, July 2016). These limits were set after long-term monitoring and data collection in the
1990s; they are protective of the water quality standards of the receiving waters and provide
the NCDEQ regulatory authority to manage trout farm effluents, if the water quality of the
receiving waters begins to degrade (USEPA 2016a) (pers. comm., Jeff Hinshaw, July 2016). The
general permit only requires annual TSS monitoring, but because of constant ambient
watershed monitoring, management of state water quality standards is functional and complies
with EPA regulation (pers. comm., Jeff Hinshaw, July 2016). Enforcement of water quality
standards is strict; although no monetary penalties have been applied, in at least one instance a
farm was issued a notice to develop a plan to reduce effluent loads after the macrobiotic
community in the receiving waterbody began to indicate eutrophication (USEPA 2016c) (pers.
comm., Jeff Hinshaw, July 2016). Although official water quality standards were never
exceeded, the farm complied and, combined with several other factors such as increased flow
rates due to drought cessation, the ecological status of the receiving waterbody was restored
(pers. comm., Jeff Hinshaw, July 2016).
23
Conclusions and Final Score
Overall, the data show flow-through freshwater rainbow trout farm effluent discharges do not
cause or contribute to cumulative environmental impacts, particularly beyond the well-
regulated and enforced ecologically acceptable impacts set by federal and state-level
assessments. Thus, the effluent concern associated with flow-through freshwater rainbow trout
production is considered low, and the final score for Criterion 2 – Effluent is 8 out of 10.
24
Criterion 3: Habitat Impact, unit of sustainability and principle Impact: Aquaculture farms can be located in a wide variety of aquatic and terrestrial habitat types
and have greatly varying levels of impact to both pristine and previously modified habitats and to the critical “ecosystem services” they provide.
Sustainability unit: The ability to maintain the critical ecosystem services relevant to the habitat type. Principle: aquaculture operations are located at sites, scales and intensities that cumulatively
maintain the functionality of ecologically valuable habitats.
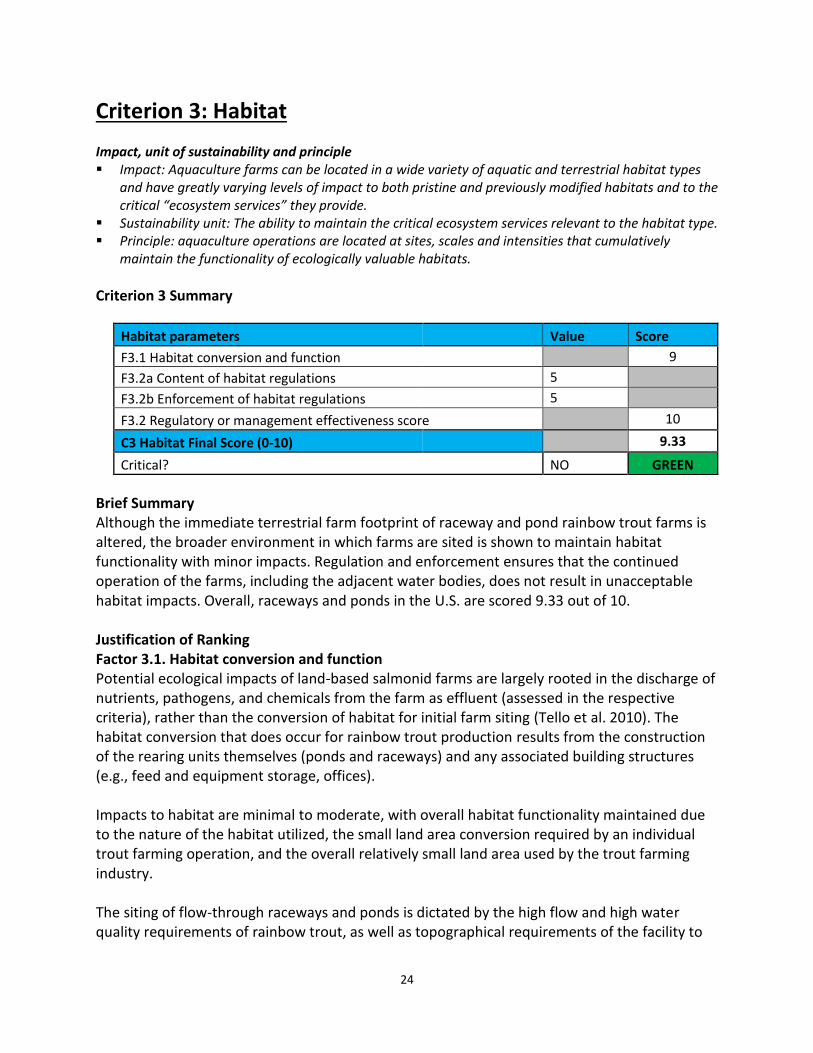
Criterion 3 Summary
Habitat parameters Value Score
F3.1 Habitat conversion and function 9
F3.2a Content of habitat regulations 5
F3.2b Enforcement of habitat regulations 5
F3.2 Regulatory or management effectiveness score 10
C3 Habitat Final Score (0-10) 9.33
Critical? NO GREEN
Brief Summary Although the immediate terrestrial farm footprint of raceway and pond rainbow trout farms is altered, the broader environment in which farms are sited is shown to maintain habitat functionality with minor impacts. Regulation and enforcement ensures that the continued operation of the farms, including the adjacent water bodies, does not result in unacceptable habitat impacts. Overall, raceways and ponds in the U.S. are scored 9.33 out of 10. Justification of Ranking Factor 3.1. Habitat conversion and function Potential ecological impacts of land-based salmonid farms are largely rooted in the discharge of nutrients, pathogens, and chemicals from the farm as effluent (assessed in the respective criteria), rather than the conversion of habitat for initial farm siting (Tello et al. 2010). The habitat conversion that does occur for rainbow trout production results from the construction of the rearing units themselves (ponds and raceways) and any associated building structures (e.g., feed and equipment storage, offices). Impacts to habitat are minimal to moderate, with overall habitat functionality maintained due to the nature of the habitat utilized, the small land area conversion required by an individual trout farming operation, and the overall relatively small land area used by the trout farming industry. The siting of flow-through raceways and ponds is dictated by the high flow and high water quality requirements of rainbow trout, as well as topographical requirements of the facility to

25
enable water to flow via gravity (Fornshell 2002). This limits rainbow trout production to areas where sufficient quantities of high quality water are available, though these locations are increasingly rare and “expansion of the industry will not come from additional water resources” but from increased intensity and efficiency (Fornshell 2002). The habitats where trout farming is already occurring—primarily the Magic Valley region of the Snake River in Idaho, and the Blue Ridge Mountain region in North Carolina—have maintained ecosystem function despite historic and continued alteration from a multitude of industries, including aquaculture (TNC 2014) (USEPA 2001) (WWF 2016). In Idaho, the Magic Valley region (Ecoregion 12i) naturally features grasslands of sagebrush and bunchgrass that have minimal ecosystem service value; in addition, over 90% of the land in this region is currently in use, for irrigated and dryland agriculture (48.3%) and livestock grazing on natural rangeland (42.54%) (IDFG 2016) (USEPA 2002a). The Snake River flows through this region, walled by the rocky slopes of a large, 500-ft deep and 1,300-ft wide canyon. Trout farms are either sited in these agriculture areas or along the canyon floor (pers. comm., Gary Fornshell, June 2016). Impacts include land clearing and diversion of natural springs, with outflows returning to the Snake River. In North Carolina, trout farms are sited in the Appalachian Mountains along the western part of the state in three ecoregions (66d/g/j) (USEPA 2002b). These areas, which are dense forests on public and private lands, are currently in use primarily for timber production and mineral extraction; forests in North Carolina are considered to be healthy, with the main concerns being invasive insects, disease, and drought (NCFS 2014). Again, aquaculture impacts include land clearing and diversion of surface water (in some cases up to 90%, though all water is returned) (Fornshell and Hinshaw 2008). In general, a trout farm requires little land conversion as a result of the intensive production achievable in flow-through raceways and ponds. The most common structure used to rear trout—a 30-m long x 10-m wide x 1-m deep concrete raceway—typically produces nearly 20,000 lbs (9 MT) of trout per year, roughly equal to 300 MT/hectare/year (Boyd et al. 2005). Even large farms producing 1,000 MT annually would only need roughly 3.33 ha of raceways, as well as space for support buildings (Boyd et al. 2005). Therefore, it is estimated that production in Idaho and North Carolina in 2015 required roughly 60 ha and 6 ha of culture area, respectively, totaling less than 1 square mile (USDA 2016a). Trout farms in Idaho divert water from natural springs by tapping into groundwater aquifers; no fish and few small animals live in groundwater, and the impact of diverting this water has minimal effect on natural habitat (pers. comm., Gary Fornshell, October 2013). In North Carolina, because of the non-consumptive water use nature of flow-through raceways and ponds, even operations that divert up to 90% of streamflow are considered to have minimal impact: the diversion occurs on a scale of several tens to several hundred feet and all water is returned to the stream (Fornshell and Hinshaw 2008).
26
Thus, the minimal habitat impacts that occur as a result of trout farming, combined with the maintenance of overall habitat functionality, result in a score of 9 out of 10 for Factor 3.1. Factor 3.2a. Content of habitat regulations Site selection is important in trout production, both to ensure that appropriate conditions exist for maintaining optimum fish health and to reduce environmental impacts (Fornshell and Hinshaw 2008). The construction of an aquaculture site is strongly regulated in the United States through multiple federal, state, and local agencies. The major federal permit required for freshwater rainbow trout aquaculture farm siting is issued by the U.S. Army Corps of Engineers. In Idaho and North Carolina, additional permits governing siting are issued by each state’s Department of Environmental Quality and Department of Agriculture. The U.S. Army Corps of Engineers (Corps) regulates compliance with the Clean Water Act (CWA) by issuing Section 404 permits, thus ensuring that dredge and fill activities that result in the discharge of pollutants to the navigable waters of the United States (such as the construction of an aquaculture facility) will not violate applicable state water quality standards (CWA, Section 401). State water quality standards are enforced through the NPDES program, as detailed in the Effluent criterion. Additionally, the Corps may regulate trout farm construction via the issuance of Nationwide Permit #7 (NWP), which ensures that outfall structures and associated intake structures comply with the NPDES program. Section 404 permits do not apply in Idaho, where trout facility construction does not require dredging because water is received from springs and not diverted surface waters; instead, a “stream channel alteration permit” is required and is administered by the Department of Environmental Quality (DEQ) (pers. comm., Gary Fornshell, June 2016). In North Carolina, a Section 404 permit is required for construction of the water intake structure (NCDACS 2001). On the state level, both the Department of Environmental Quality and Department of Agriculture in Idaho and North Carolina ensure that all facilities are constructed and operating according to state code by licensing and permitting elements of the construction and operation (e.g., intake structure specifications and waste disposal methods) (Idaho Statutes 2016) (NCGS 2016a). Both state codes include conditions based on maintenance of habitat functionality, specifically stating that the construction of facilities and the water diversions to supply said facilities shall not impede fish passage or damage natural habitat (Idaho Statutes 2016) (NCGS 2016a). These laws represent an area-based, cumulative management system that considers the impact of aquaculture farm siting alongside other industries with the goal of maintaining ecosystem functionality of affected habitats. Thus, Factor 3.2a “Content of habitat management measures” is scored 5 out of 5. Factor 3.2b. Enforcement of habitat regulations Enforcement of these laws is strict; operators who construct and operate an aquaculture facility without the proper permits are subject to significant fines and penalties, including possible imprisonment (USEPA 2016d). For example: the EPA, which is tasked with enforcing the Clean

27
Water Act (which operators are required to comply with through the permits detailed above), has the authority to charge a maximum of $27,500 per day in civil penalties for violation of a Section 404 permit (CWA, Section 309(d)). Likewise, at the state level, penalties for noncompliance with the state code range from civil penalties to criminal offenses, based on the degree of noncompliance; in both Idaho and North Carolina, the administrator also has the authority to suspend or revoke an aquaculture license in lieu of or in addition to any penalties levied (Idaho Statutes 2016) (NCGS 2016a). For the most part, penalties for noncompliance are rare because noncompliance is rare. If an operator is found to be out of compliance, the EPA will generally issue a civil administrative action (notice of violation or order to come into compliance) before taking judicial action (lawsuits), with criminal actions being sought for only the most egregious violations (USEPA 2016d). The same course of action is taken on the state level, with civil administrative action being the preferred method of enforcing compliance. There are no records of action taken against trout farms for violating site construction permits in either Idaho or North Carolina (likely because all farms are compliant), but there is evidence of formal action from the EPA for violations of the CWA against two commercial aquaculture operations (tilapia, catfish) in Idaho in the last 5 years that resulted in fines of $15,000 and $25,000 and an order to become compliant (USEPA 2016c). This demonstrates both the efficacy of enforcement and the strong performance of the trout industry. Because of the strict area-based, transparent permitting or licensing process and evidence of penalties for infringement, Factor 3.2b “Enforcement of habitat management measures” is scored 5 out of 5. Conclusions and Final Score In both Idaho and North Carolina, the primary environmental impacts associated with trout farming are related to effluent discharges into the receiving waterbody, as covered in the Effluent criterion. The regulatory landscape surrounding trout aquaculture is primarily focused on mitigating risk of effluent into aquatic environments, because of the low risk and small scale of aquatic and terrestrial impacts associated with farm construction. The regulations governing site selection and construction that do exist are robust and well enforced, and have resulted in an overall maintained functionality of the habitats where trout farms are sited. Thus, Factor 3.2 Siting management is given a score of 10 out of 10. The minimal terrestrial impacts scored Factor 3.1 as 9 out of 10, so the combined final Habitat criterion is scored 9.33 out of 10.
28
Criterion 4: Evidence or Risk of Chemical Use Impact, unit of sustainability and principle Impact: Improper use of chemical treatments impacts non-target organisms and leads to production
losses and human health concerns due to the development of chemical-resistant organisms. Sustainability unit: non-target organisms in the local or regional environment, presence of pathogens
or parasites resistant to important treatments Principle: aquaculture operations by design, management or regulation avoid the discharge of
chemicals toxic to aquatic life, and/or effectively control the frequency, risk of environmental impact and risk to human health of their use
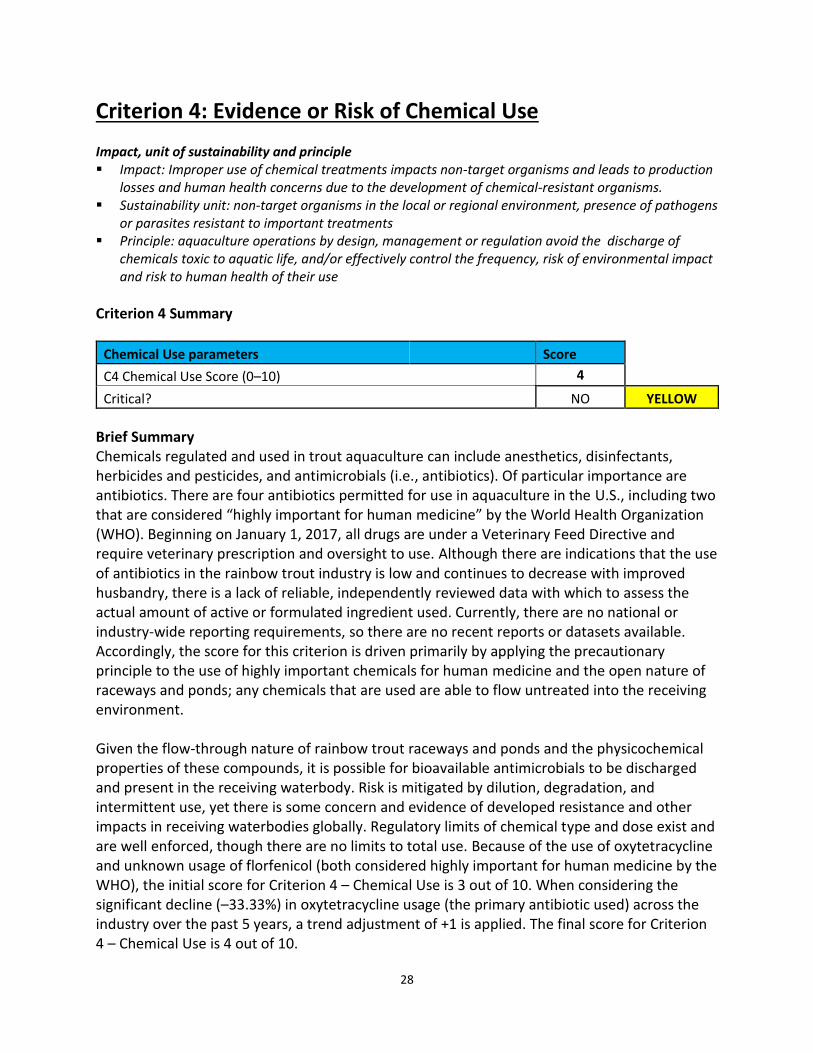
Criterion 4 Summary
Chemical Use parameters Score
C4 Chemical Use Score (0–10) 4
Critical? NO YELLOW
Brief Summary Chemicals regulated and used in trout aquaculture can include anesthetics, disinfectants, herbicides and pesticides, and antimicrobials (i.e., antibiotics). Of particular importance are antibiotics. There are four antibiotics permitted for use in aquaculture in the U.S., including two that are considered “highly important for human medicine” by the World Health Organization (WHO). Beginning on January 1, 2017, all drugs are under a Veterinary Feed Directive and require veterinary prescription and oversight to use. Although there are indications that the use of antibiotics in the rainbow trout industry is low and continues to decrease with improved husbandry, there is a lack of reliable, independently reviewed data with which to assess the actual amount of active or formulated ingredient used. Currently, there are no national or industry-wide reporting requirements, so there are no recent reports or datasets available. Accordingly, the score for this criterion is driven primarily by applying the precautionary principle to the use of highly important chemicals for human medicine and the open nature of raceways and ponds; any chemicals that are used are able to flow untreated into the receiving environment. Given the flow-through nature of rainbow trout raceways and ponds and the physicochemical properties of these compounds, it is possible for bioavailable antimicrobials to be discharged and present in the receiving waterbody. Risk is mitigated by dilution, degradation, and intermittent use, yet there is some concern and evidence of developed resistance and other impacts in receiving waterbodies globally. Regulatory limits of chemical type and dose exist and are well enforced, though there are no limits to total use. Because of the use of oxytetracycline and unknown usage of florfenicol (both considered highly important for human medicine by the WHO), the initial score for Criterion 4 – Chemical Use is 3 out of 10. When considering the significant decline (–33.33%) in oxytetracycline usage (the primary antibiotic used) across the industry over the past 5 years, a trend adjustment of +1 is applied. The final score for Criterion 4 – Chemical Use is 4 out of 10.
29
Justification of Ranking In U.S. rainbow trout aquaculture, the primary chemicals of concern are antibiotics. To be used legally, antibiotics must be approved by the FDA; once approved, as of January 1, 2017, all medicated feeds for trout may only be used under a licensed veterinary prescription called a Veterinary Feed Directive (VFD 2015) (MacMillan et al. 2006) (Table 1). These antibiotics require careful management due to the potential for them to create resistance in pathogenic bacteria, impact downstream organisms, and accumulate in the tissues of exposed organisms (Rodgers and Furones 2009) (Tucker et al. 2008a). In addition, oxytetracycline (a common antibiotic used) and florfenicol (an approved drug with minimal use) are listed by the World Health Organization as being “highly important” for human medicine (WHO 2011). Multiple antibiotics are FDA-approved for use in flow-through salmonid systems; rainbow trout are primarily treated with medicated feeds, such as Terramycin® 200 for Fish (oxytetracycline dihydrate), Aquaflor® (florenicol), and Romet® 30 (sulfadimethoxine/ormetoprim). Table 1 details what they commonly treat and when they were approved by the FDA.
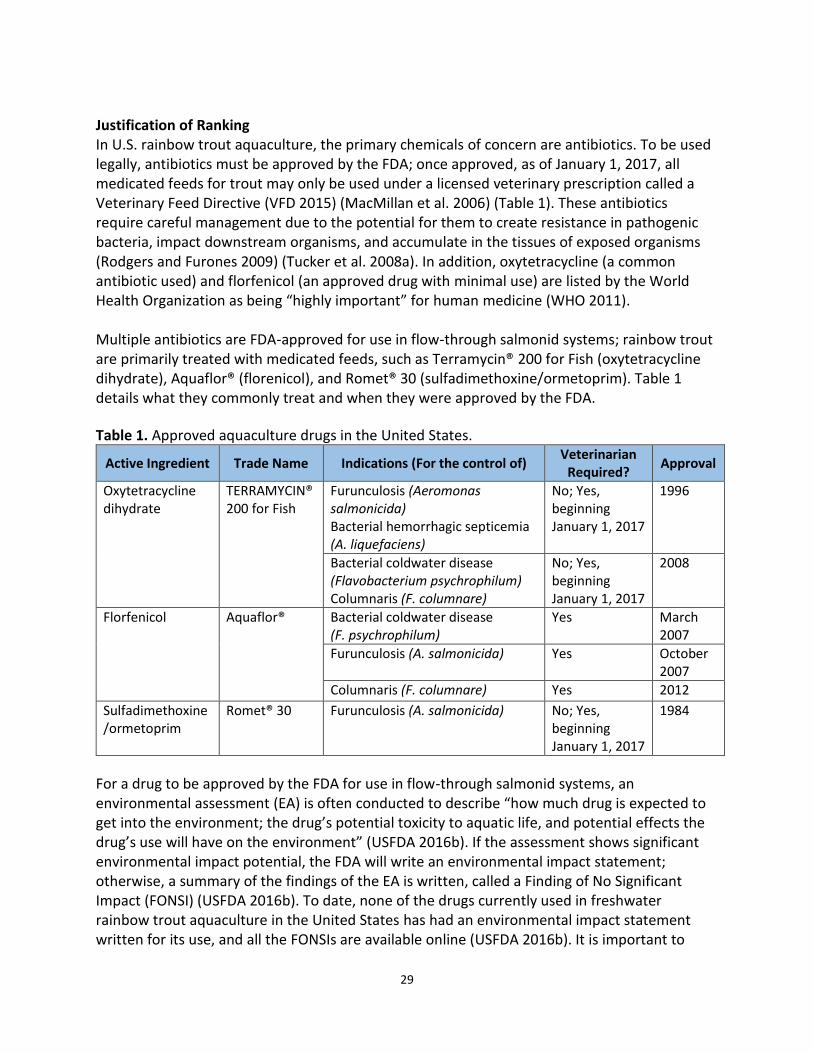
Table 1. Approved aquaculture drugs in the United States.
Active Ingredient Trade Name Indications (For the control of) Veterinarian
Required? Approval
Oxytetracycline dihydrate
TERRAMYCIN® 200 for Fish
Furunculosis (Aeromonas salmonicida) Bacterial hemorrhagic septicemia (A. liquefaciens)
No; Yes, beginning January 1, 2017
1996
Bacterial coldwater disease (Flavobacterium psychrophilum) Columnaris (F. columnare)
No; Yes, beginning January 1, 2017
2008
Florfenicol Aquaflor® Bacterial coldwater disease (F. psychrophilum)
Yes March 2007
Furunculosis (A. salmonicida) Yes October 2007
Columnaris (F. columnare) Yes 2012
Sulfadimethoxine/ormetoprim
Romet® 30 Furunculosis (A. salmonicida) No; Yes, beginning January 1, 2017
1984
For a drug to be approved by the FDA for use in flow-through salmonid systems, an environmental assessment (EA) is often conducted to describe “how much drug is expected to get into the environment; the drug’s potential toxicity to aquatic life, and potential effects the drug’s use will have on the environment” (USFDA 2016b). If the assessment shows significant environmental impact potential, the FDA will write an environmental impact statement; otherwise, a summary of the findings of the EA is written, called a Finding of No Significant Impact (FONSI) (USFDA 2016b). To date, none of the drugs currently used in freshwater rainbow trout aquaculture in the United States has had an environmental impact statement written for its use, and all the FONSIs are available online (USFDA 2016b). It is important to
30
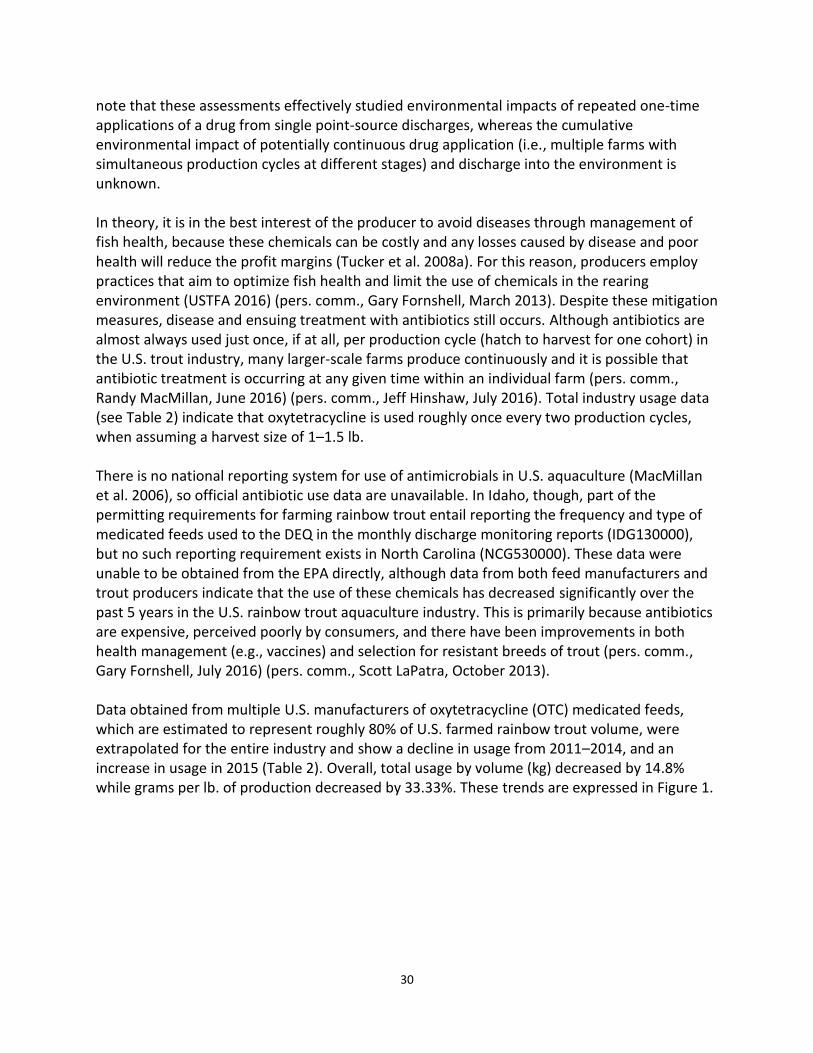
note that these assessments effectively studied environmental impacts of repeated one-time applications of a drug from single point-source discharges, whereas the cumulative environmental impact of potentially continuous drug application (i.e., multiple farms with simultaneous production cycles at different stages) and discharge into the environment is unknown. In theory, it is in the best interest of the producer to avoid diseases through management of fish health, because these chemicals can be costly and any losses caused by disease and poor health will reduce the profit margins (Tucker et al. 2008a). For this reason, producers employ practices that aim to optimize fish health and limit the use of chemicals in the rearing environment (USTFA 2016) (pers. comm., Gary Fornshell, March 2013). Despite these mitigation measures, disease and ensuing treatment with antibiotics still occurs. Although antibiotics are almost always used just once, if at all, per production cycle (hatch to harvest for one cohort) in the U.S. trout industry, many larger-scale farms produce continuously and it is possible that antibiotic treatment is occurring at any given time within an individual farm (pers. comm., Randy MacMillan, June 2016) (pers. comm., Jeff Hinshaw, July 2016). Total industry usage data (see Table 2) indicate that oxytetracycline is used roughly once every two production cycles, when assuming a harvest size of 1–1.5 lb. There is no national reporting system for use of antimicrobials in U.S. aquaculture (MacMillan et al. 2006), so official antibiotic use data are unavailable. In Idaho, though, part of the permitting requirements for farming rainbow trout entail reporting the frequency and type of medicated feeds used to the DEQ in the monthly discharge monitoring reports (IDG130000), but no such reporting requirement exists in North Carolina (NCG530000). These data were unable to be obtained from the EPA directly, although data from both feed manufacturers and trout producers indicate that the use of these chemicals has decreased significantly over the past 5 years in the U.S. rainbow trout aquaculture industry. This is primarily because antibiotics are expensive, perceived poorly by consumers, and there have been improvements in both health management (e.g., vaccines) and selection for resistant breeds of trout (pers. comm., Gary Fornshell, July 2016) (pers. comm., Scott LaPatra, October 2013). Data obtained from multiple U.S. manufacturers of oxytetracycline (OTC) medicated feeds, which are estimated to represent roughly 80% of U.S. farmed rainbow trout volume, were extrapolated for the entire industry and show a decline in usage from 2011–2014, and an increase in usage in 2015 (Table 2). Overall, total usage by volume (kg) decreased by 14.8% while grams per lb. of production decreased by 33.33%. These trends are expressed in Figure 1.
31
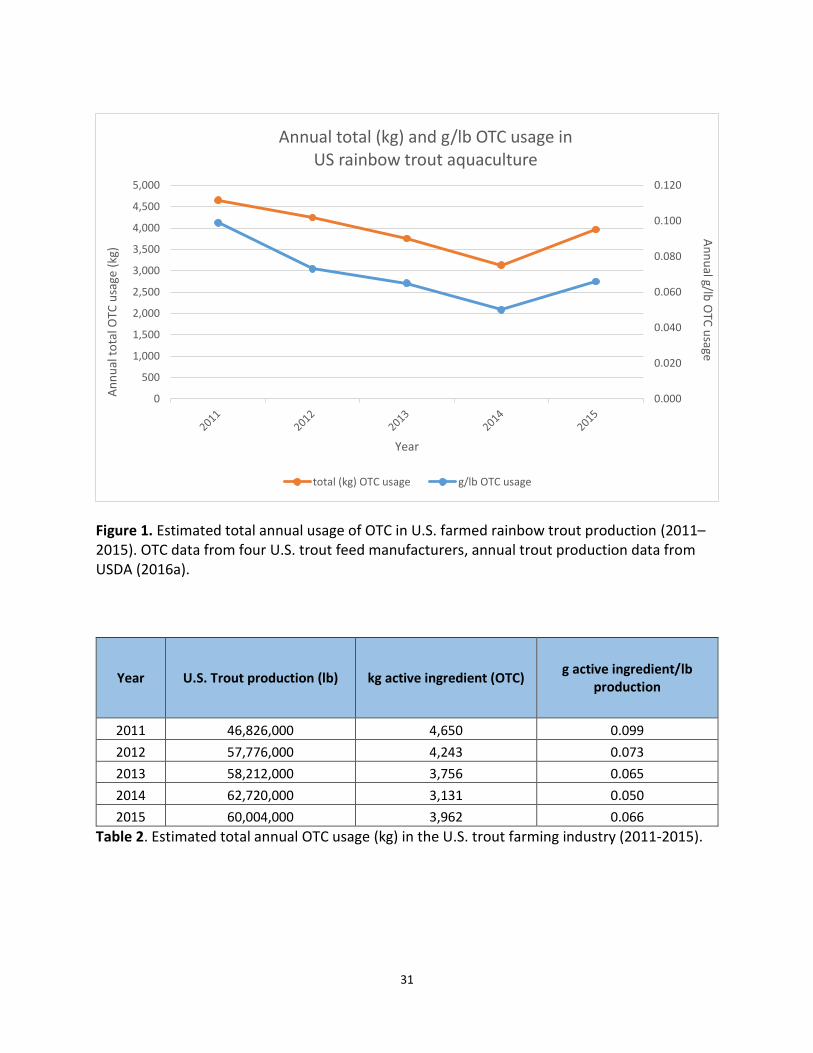
Figure 1. Estimated total annual usage of OTC in U.S. farmed rainbow trout production (2011–2015). OTC data from four U.S. trout feed manufacturers, annual trout production data from USDA (2016a).
Year U.S. Trout production (lb) kg active ingredient (OTC) g active ingredient/lb
production
2011 46,826,000 4,650 0.099
2012 57,776,000 4,243 0.073
2013 58,212,000 3,756 0.065
2014 62,720,000 3,131 0.050
2015 60,004,000 3,962 0.066
Table 2. Estimated total annual OTC usage (kg) in the U.S. trout farming industry (2011-2015).
0.000
0.020
0.040
0.060
0.080
0.100
0.120
0
500
1,000
1,500
2,000
2,500
3,000
3,500
4,000
4,500
5,000
An
nu
al g/lb O
TC u
sageA
nn
ual
to
tal O
TC u
sage
(kg
)
Year
Annual total (kg) and g/lb OTC usage in US rainbow trout aquaculture
total (kg) OTC usage g/lb OTC usage
32
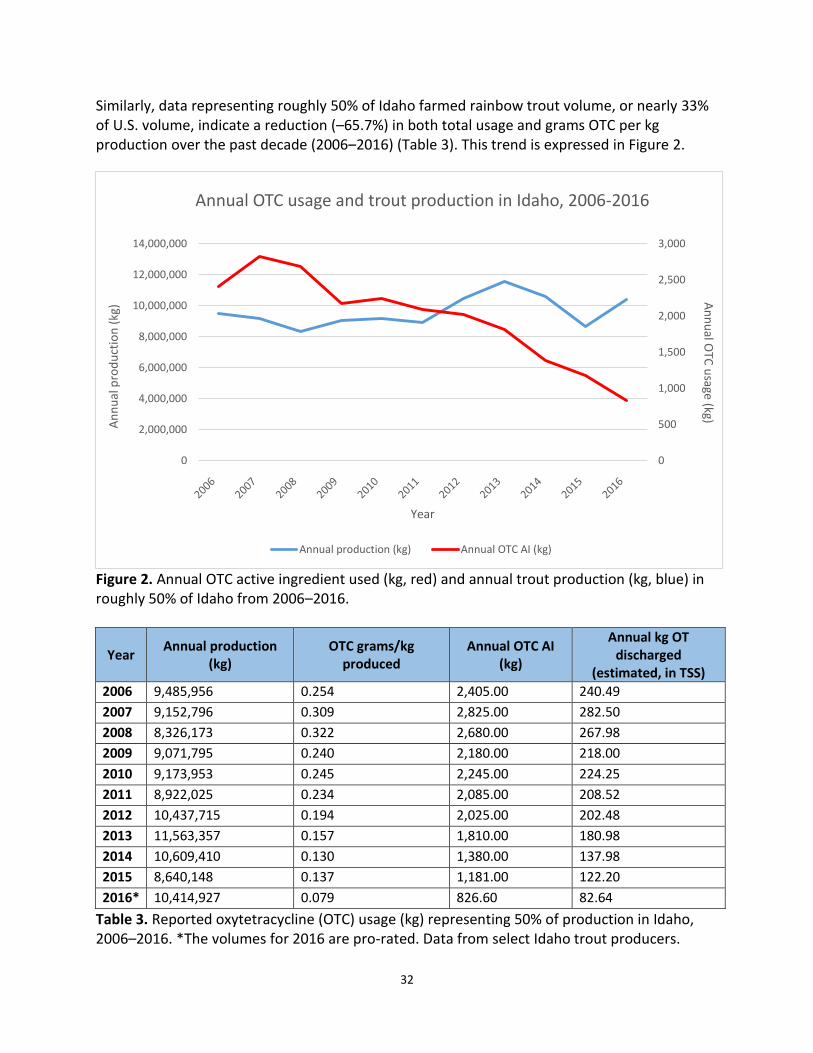
Similarly, data representing roughly 50% of Idaho farmed rainbow trout volume, or nearly 33% of U.S. volume, indicate a reduction (–65.7%) in both total usage and grams OTC per kg production over the past decade (2006–2016) (Table 3). This trend is expressed in Figure 2.
Figure 2. Annual OTC active ingredient used (kg, red) and annual trout production (kg, blue) in roughly 50% of Idaho from 2006–2016.
Year Annual production
(kg) OTC grams/kg
produced Annual OTC AI
(kg)
Annual kg OT discharged
(estimated, in TSS)
2006 9,485,956 0.254 2,405.00 240.49
2007 9,152,796 0.309 2,825.00 282.50
2008 8,326,173 0.322 2,680.00 267.98
2009 9,071,795 0.240 2,180.00 218.00
2010 9,173,953 0.245 2,245.00 224.25
2011 8,922,025 0.234 2,085.00 208.52
2012 10,437,715 0.194 2,025.00 202.48
2013 11,563,357 0.157 1,810.00 180.98
2014 10,609,410 0.130 1,380.00 137.98
2015 8,640,148 0.137 1,181.00 122.20
2016* 10,414,927 0.079 826.60 82.64
Table 3. Reported oxytetracycline (OTC) usage (kg) representing 50% of production in Idaho, 2006–2016. *The volumes for 2016 are pro-rated. Data from select Idaho trout producers.
0
500
1,000
1,500
2,000
2,500
3,000
0
2,000,000
4,000,000
6,000,000
8,000,000
10,000,000
12,000,000
14,000,000
An
nu
al OTC
usage (kg)
An
nu
al p
rod
uct
ion
(kg
)
Year
Annual OTC usage and trout production in Idaho, 2006-2016
Annual production (kg) Annual OTC AI (kg)

33
Data regarding the total use of florfenicol and sulfadimethoxine/ormetoprim were not able to be obtained, though their use is not common or widespread in either Idaho or North Carolina (pers. comm., Randy MacMillan, July 2016) (pers. comm., Gary Fornshell, July 2016) (pers. comm. Jeff Hinshaw, July 2016). But because it is a chemical highly important for human medicine, the unknown amount of florfenicol usage is of significant concern. The environmental impact of the current usage of antibiotics is difficult to assess. It has been estimated that as much as 75% of administered antibiotics are not taken up by fish and enter the water column, either by excretion or leaching from uneaten feed (Rico et al. 2012) (Romero et al. 2012). Flow-through raceways and ponds continuously discharge into receiving waterbodies, and the majority of trout farms (≈95%) do not utilize any filtration beyond sedimentation basins (pers. comm., Gary Fornshell, March 2013); thus, it is expected that the majority of applied antibiotics will enter the receiving waterbody unless they bind with sediments/organic solids and are removed. Although the environmental assessments conducted for all three approved drugs (oxytetracycline, florfenicol, and sulfdimethoxine/ormetoprim) concluded that there was no significant risk of impact to the ecosystems that receive them, the assessments’ experimental designs did not account for continuous discharge or cumulative impacts, which are possible with multiple farms with staggered simultaneous production cycles discharging into the same water body (i.e., the Middle Snake River in Idaho). The environmental fate and persistence of oxytetracycline and florenicol are both well documented and understood (USFDA 2007) (Schmidt et al. 2007). Oxytetracycline (OTC) is known to sorb to dissolved organic matter and biosolids, such as suspended aquaculture solids (i.e., uneaten fish feed and excrement), and become largely biologically unavailable (Schmidt et al. 2007). Given the requirement of trout farms to limit their discharge of suspended solids and the widespread use of settling ponds, the majority of applied OTC (> 80%) is expected to be captured and properly disposed of (applied as fertilizer, composted, or buried in compliance with state law) prior to discharge into the receiving waterbody (Schmidt et al. 2007). OTC that is discharged, both in solution and bound to sediments, is then subject to dilution as well as biotic and abiotic degradation in the receiving waterbody, further mitigating its impact (Schmidt et al. 2007). There is some evidence of OTC desorbing from sediments into a bioavailable form, though this is negligible at the assessed dosage and application rate (Schmidt et al. 2007). It is worth noting that the environmental assessment of OTC was based on a total release of 19 kg OTC over 8 years, whereas industry data suggests total release of over 100 kg annually, roughly 4,000% more than that considered in the environmental assessment (Table 2) (Rose and Pederson 2005); these volumes may result in higher quantities of bioavailable OTC in the environment than the values stated. It is therefore unlikely, but possible, for concentrations of bioavailable OTC in the receiving waterbody to reach known lethal concentrations to bacteria and algae under anything but absolute worst case scenarios (< 5% of all operations).
34
Florfenicol, on the other hand, is much more likely to persist in the water column, with roughly 20%–30% of aqueous florfenicol partitioning to solids and/or sediment (USFDA 2007). Thus, a larger percentage of florfenicol released in raceways (≈75%) is likely to be discharged, relative to oxytetracycline. The compound is bioavailable in the water column and, though dilution and degradation mitigate environmental risk, “short-term inhibitory effects on sensitive algae and bacteria downstream of a very small percentage (< 5%) of locations where [florfenicol] is used” are possible (USFDA 2007). The environmental impacts of sulfadimethoxine/ormetoprim are much less clear; the 1984 environmental assessment that approved this drug states, “there appears to be no information available for predicting the effects [of Romet-30] on sediment (or soil) bacteria, protozoans, fungi, benthic crustaceans, worms, clams, snails or rooted aquatic macrophytic plants” (USFDA 1984). Still today, there is little information available for reliably predicting the effects of Romet-30® on bacterial and algal communities, though the literature is in congruence that the majority of Romet-30 discharged is mobile and bioavailable (Bakal 2001) (Sanders 2007). The original assessment concludes that any impacts to benthic fauna and microbial communities are likely to be short term and intermittent (USFDA 1984). Short-term inhibitory effects will result in the repopulation of unaffected bacteria and algae, possibly including those that carry resistant/resistance genes. The occurrence of antibiotic resistance to all three of these drugs in nearby water and sediments has been well documented in net pen marine aquaculture in various locations globally, and evidence of resistance is becoming more robust for freshwater systems (Cabello et al. 2013) (Gildemeister 2012) (Miranda 2012) (Sanders 2007) (Schmidt et al. 2000) (Stamm 1989). Currently, there is no evidence that the discharge of antibiotics or their residues from rainbow trout farms in the U.S. has resulted in the development of antibiotic-resistant bacteria or mobile resistant genes. Conclusions and Final Score Given the flow-through nature of rainbow trout raceways and ponds and the physicochemical properties of these compounds, it is possible for bioavailable antimicrobials to be discharged and present in the receiving waterbody. Risk is mitigated by dilution, degradation, and intermittent judicious use with veterinary oversight; although there is some concern and evidence of developed resistance in receiving waterbodies globally, there is no evidence that antibiotic use on U.S. trout farms has resulted in or contributed to resistance. Regulatory limits of chemical type and dose exist and are well enforced, though there are no legislated limits to total use. Because of the use of oxytetracycline and unknown usage of florfenicol (both considered highly important for human medicine by the WHO), the initial score for Criterion 4 – Chemical Use is 3 out of 10. When considering the significant decline (–33.33%) in oxytetracycline usage (the primary antibiotic used) across the industry over the past 5 years, a trend adjustment of +1 is applied. The final score for Criterion 4 – Chemical Use is 4 out of 10.
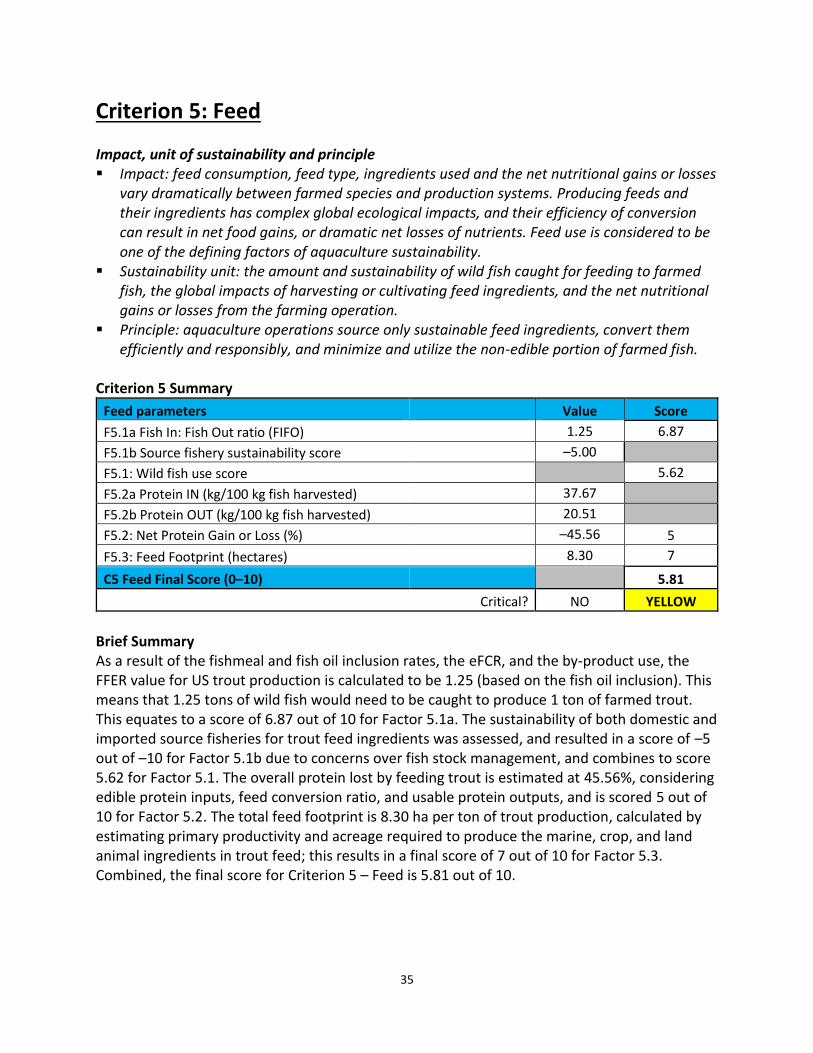
35
Criterion 5: Feed Impact, unit of sustainability and principle Impact: feed consumption, feed type, ingredients used and the net nutritional gains or losses
vary dramatically between farmed species and production systems. Producing feeds and their ingredients has complex global ecological impacts, and their efficiency of conversion can result in net food gains, or dramatic net losses of nutrients. Feed use is considered to be one of the defining factors of aquaculture sustainability.
Sustainability unit: the amount and sustainability of wild fish caught for feeding to farmed fish, the global impacts of harvesting or cultivating feed ingredients, and the net nutritional gains or losses from the farming operation.
Principle: aquaculture operations source only sustainable feed ingredients, convert them efficiently and responsibly, and minimize and utilize the non-edible portion of farmed fish.
Criterion 5 Summary
Feed parameters Value Score
F5.1a Fish In: Fish Out ratio (FIFO) 1.25 6.87
F5.1b Source fishery sustainability score –5.00
F5.1: Wild fish use score 5.62
F5.2a Protein IN (kg/100 kg fish harvested) 37.67
F5.2b Protein OUT (kg/100 kg fish harvested) 20.51
F5.2: Net Protein Gain or Loss (%) –45.56 5
F5.3: Feed Footprint (hectares) 8.30 7
C5 Feed Final Score (0–10) 5.81
Critical? NO YELLOW
Brief Summary As a result of the fishmeal and fish oil inclusion rates, the eFCR, and the by-product use, the FFER value for US trout production is calculated to be 1.25 (based on the fish oil inclusion). This means that 1.25 tons of wild fish would need to be caught to produce 1 ton of farmed trout. This equates to a score of 6.87 out of 10 for Factor 5.1a. The sustainability of both domestic and imported source fisheries for trout feed ingredients was assessed, and resulted in a score of –5 out of –10 for Factor 5.1b due to concerns over fish stock management, and combines to score 5.62 for Factor 5.1. The overall protein lost by feeding trout is estimated at 45.56%, considering edible protein inputs, feed conversion ratio, and usable protein outputs, and is scored 5 out of 10 for Factor 5.2. The total feed footprint is 8.30 ha per ton of trout production, calculated by estimating primary productivity and acreage required to produce the marine, crop, and land animal ingredients in trout feed; this results in a final score of 7 out of 10 for Factor 5.3. Combined, the final score for Criterion 5 – Feed is 5.81 out of 10.

36
Justification of Ranking Factor 5.1. Wild Fish Use 5.1a Feed Fish Efficiency Ratio (FFER) The Feed Fish Efficiency Ratio (FFER) ratio for aquaculture systems is driven by the feed conversion ratio (FCR), the amount of fish used in feeds, and the source of the marine ingredients (i.e., does the fishmeal and fish oil come from processing by-products or whole fish targeted by wild capture fisheries?). FCR is the ratio of feed given to an animal per weight gained, measured in mass (e.g., FCR of 1.4:1 means that 1.4 kg of feed is required to produce 1 kg of fish). It can be reported as either biological FCR, which is the straightforward comparison of feed given to weight gained, or economic FCR (eFCR), which is the amount of feed given per weight harvested (i.e., accounting for mortalities, escapes, and other losses of otherwise-gained harvestable fish). The use of a single FCR value to represent an entire industry is challenging. The difficulty is rooted in the differences in fish genetics, feed formulations, farm practices, occurrence of disease, and more. Trout production globally has historically seen eFCRs in the range of 0.7–2.0, with the United States falling at the global average of 1.3 (Tacon and Metian 2008). There is a growing body of recent literature showing laboratory-raised trout with FCRs below 1:1, although only highly efficient commercial operations or those using very high fish oil content approach or exceed 1:1 (Bullerwell et al. 2016) (Craft et al. 2016) (Cho 1992) (Fornshell and Hinshaw 2008). The most representative data available come from yield studies done by Tuomikoski and Hinshaw (unpublished data, in Fornshell and Hinshaw 2008), in which they found an average FCR of 1.16 in 12 flow-through trout farms from 2004–2005. Based on the feed formulations used in the report (see below) and conversations with industry experts, this is currently the best approximation of the eFCR that can be expected for the culture of rainbow trout in the U.S. (pers. comm., Gary Fornshell July 2016). Considerable variation in trout feed composition is demonstrated by differences in published reports; Pierce et al. (2008) described “traditional” diets with 63.14% fishmeal and 10.10% fish oil, Azevedo et al. (2004) tested four trout diets ranging from 23%–34% fishmeal and 14%–22% fish oil, and Barrows et al. (2007) compared experimental diets containing 0%–59.24% fishmeal and 7.3%–16.79% fish oil to a commercial diet with 46% total protein content and 16% lipid (though unspecified fishmeal and fish oil inclusion). On average, trout feeds in the U.S. have historically included fish meal and oil at approximately 24% and 8%, respectively, representing large portions of the total protein and lipid contents (Tacon and Metien 2008). It is important to note that industry and academia are currently working together to develop feeds that are primarily plant-based by sourcing their protein and lipids from ingredients such as soy concentrates and algae oils, although fishmeal and fish oil are still almost always used in commercial trout feeds (Bullerwell et al. 2016) (Craft et al. 2016) (Fry et al. 2016) (Tacon et al. 2011). For the purpose of this report, a trout feed containing 20% fishmeal and 6% fish oil is used, which is consistent with literature and industry trends to reduce fishmeal and fish oil inclusions in trout feeds (pers. comm., Ronald Hardy, August 2016)
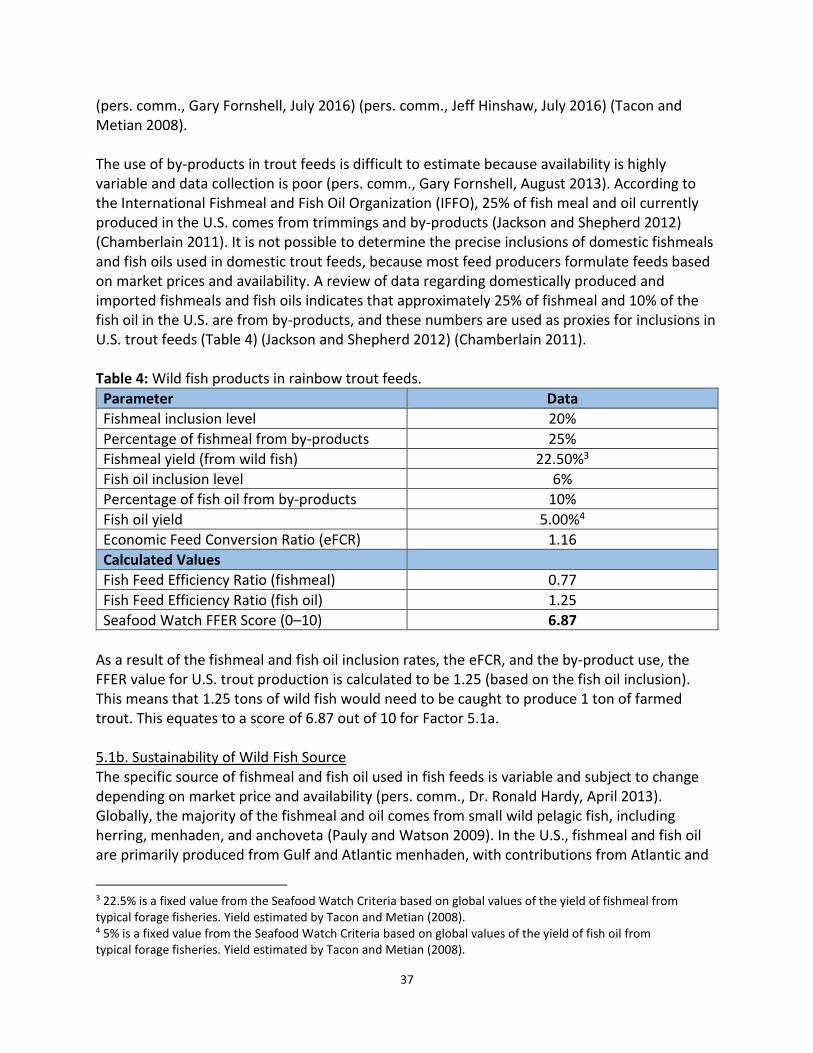
37
(pers. comm., Gary Fornshell, July 2016) (pers. comm., Jeff Hinshaw, July 2016) (Tacon and Metian 2008). The use of by-products in trout feeds is difficult to estimate because availability is highly variable and data collection is poor (pers. comm., Gary Fornshell, August 2013). According to the International Fishmeal and Fish Oil Organization (IFFO), 25% of fish meal and oil currently produced in the U.S. comes from trimmings and by-products (Jackson and Shepherd 2012) (Chamberlain 2011). It is not possible to determine the precise inclusions of domestic fishmeals and fish oils used in domestic trout feeds, because most feed producers formulate feeds based on market prices and availability. A review of data regarding domestically produced and imported fishmeals and fish oils indicates that approximately 25% of fishmeal and 10% of the fish oil in the U.S. are from by-products, and these numbers are used as proxies for inclusions in U.S. trout feeds (Table 4) (Jackson and Shepherd 2012) (Chamberlain 2011). Table 4: Wild fish products in rainbow trout feeds.
Parameter Data
Fishmeal inclusion level 20%
Percentage of fishmeal from by-products 25%
Fishmeal yield (from wild fish) 22.50%3
Fish oil inclusion level 6%
Percentage of fish oil from by-products 10%
Fish oil yield 5.00%4
Economic Feed Conversion Ratio (eFCR) 1.16
Calculated Values
Fish Feed Efficiency Ratio (fishmeal) 0.77
Fish Feed Efficiency Ratio (fish oil) 1.25
Seafood Watch FFER Score (0–10) 6.87
As a result of the fishmeal and fish oil inclusion rates, the eFCR, and the by-product use, the FFER value for U.S. trout production is calculated to be 1.25 (based on the fish oil inclusion). This means that 1.25 tons of wild fish would need to be caught to produce 1 ton of farmed trout. This equates to a score of 6.87 out of 10 for Factor 5.1a. 5.1b. Sustainability of Wild Fish Source The specific source of fishmeal and fish oil used in fish feeds is variable and subject to change depending on market price and availability (pers. comm., Dr. Ronald Hardy, April 2013). Globally, the majority of the fishmeal and oil comes from small wild pelagic fish, including herring, menhaden, and anchoveta (Pauly and Watson 2009). In the U.S., fishmeal and fish oil are primarily produced from Gulf and Atlantic menhaden, with contributions from Atlantic and
3 22.5% is a fixed value from the Seafood Watch Criteria based on global values of the yield of fishmeal from typical forage fisheries. Yield estimated by Tacon and Metian (2008). 4 5% is a fixed value from the Seafood Watch Criteria based on global values of the yield of fish oil from typical forage fisheries. Yield estimated by Tacon and Metian (2008).
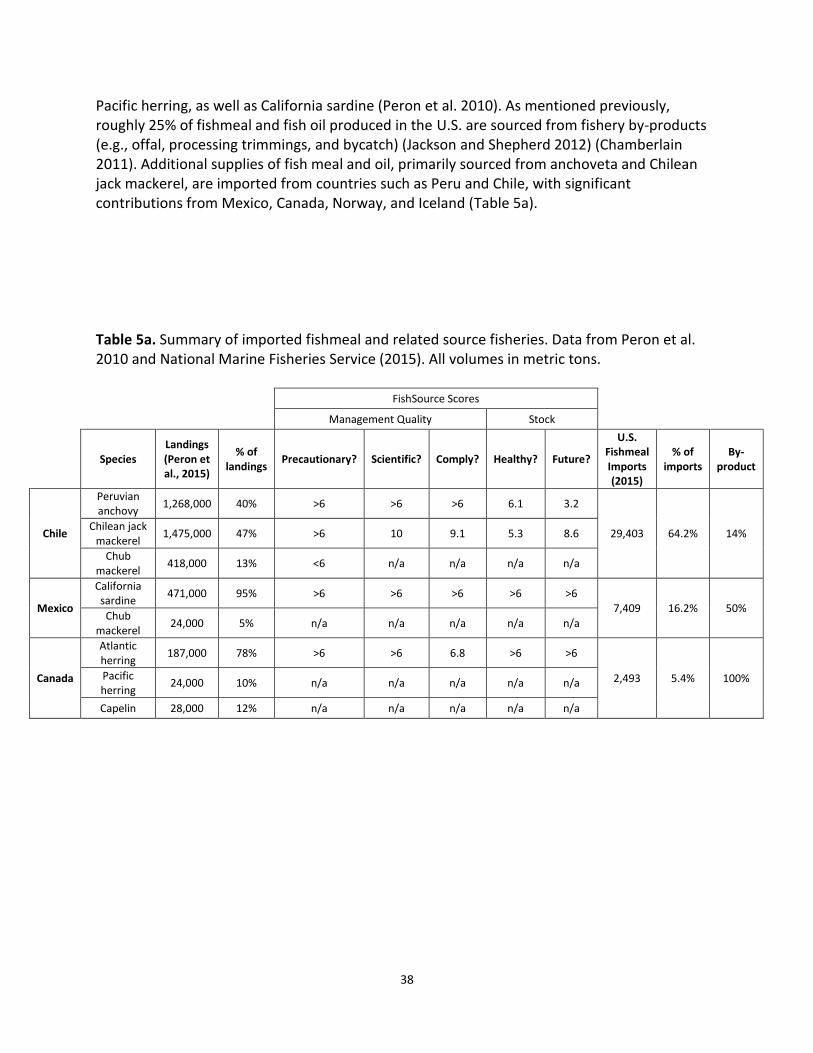
38
Pacific herring, as well as California sardine (Peron et al. 2010). As mentioned previously, roughly 25% of fishmeal and fish oil produced in the U.S. are sourced from fishery by-products (e.g., offal, processing trimmings, and bycatch) (Jackson and Shepherd 2012) (Chamberlain 2011). Additional supplies of fish meal and oil, primarily sourced from anchoveta and Chilean jack mackerel, are imported from countries such as Peru and Chile, with significant contributions from Mexico, Canada, Norway, and Iceland (Table 5a). Table 5a. Summary of imported fishmeal and related source fisheries. Data from Peron et al. 2010 and National Marine Fisheries Service (2015). All volumes in metric tons.
FishSource Scores
Management Quality Stock
Species Landings (Peron et al., 2015)
% of landings
Precautionary? Scientific? Comply? Healthy? Future?
U.S. Fishmeal Imports (2015)
% of imports
By-product
Chile
Peruvian anchovy
1,268,000 40% >6 >6 >6 6.1 3.2
29,403 64.2% 14% Chilean jack
mackerel 1,475,000 47% >6 10 9.1 5.3 8.6
Chub mackerel
418,000 13% <6 n/a n/a n/a n/a
Mexico
California sardine
471,000 95% >6 >6 >6 >6 >6 7,409 16.2% 50%
Chub mackerel
24,000 5% n/a n/a n/a n/a n/a
Canada
Atlantic herring
187,000 78% >6 >6 6.8 >6 >6
2,493 5.4% 100% Pacific herring
24,000 10% n/a n/a n/a n/a n/a
Capelin 28,000 12% n/a n/a n/a n/a n/a
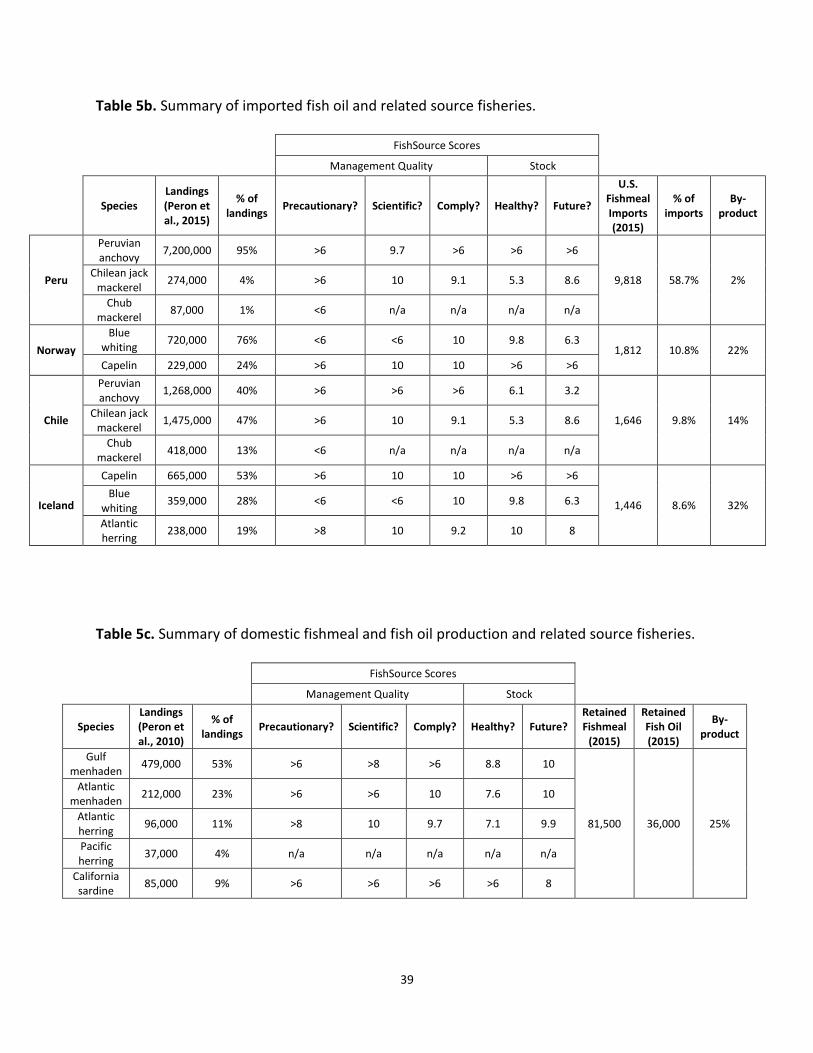
39
Table 5b. Summary of imported fish oil and related source fisheries.
FishSource Scores
Management Quality Stock
Species Landings (Peron et al., 2015)
% of landings
Precautionary? Scientific? Comply? Healthy? Future?
U.S. Fishmeal Imports (2015)
% of imports
By-product
Peru
Peruvian anchovy
7,200,000 95% >6 9.7 >6 >6 >6
9,818 58.7% 2% Chilean jack
mackerel 274,000 4% >6 10 9.1 5.3 8.6
Chub mackerel
87,000 1% <6 n/a n/a n/a n/a
Norway
Blue whiting
720,000 76% <6 <6 10 9.8 6.3 1,812 10.8% 22%
Capelin 229,000 24% >6 10 10 >6 >6
Chile
Peruvian anchovy
1,268,000 40% >6 >6 >6 6.1 3.2
1,646 9.8% 14% Chilean jack
mackerel 1,475,000 47% >6 10 9.1 5.3 8.6
Chub mackerel
418,000 13% <6 n/a n/a n/a n/a
Iceland
Capelin 665,000 53% >6 10 10 >6 >6
1,446 8.6% 32% Blue
whiting 359,000 28% <6 <6 10 9.8 6.3
Atlantic herring
238,000 19% >8 10 9.2 10 8
Table 5c. Summary of domestic fishmeal and fish oil production and related source fisheries. FishSource Scores
Management Quality Stock
Species Landings (Peron et al., 2010)
% of landings
Precautionary? Scientific? Comply? Healthy? Future? Retained Fishmeal
(2015)
Retained Fish Oil (2015)
By-product
Gulf menhaden
479,000 53% >6 >8 >6 8.8 10
81,500 36,000 25%
Atlantic menhaden
212,000 23% >6 >6 10 7.6 10
Atlantic herring
96,000 11% >8 10 9.7 7.1 9.9
Pacific herring
37,000 4% n/a n/a n/a n/a n/a
California sardine
85,000 9% >6 >6 >6 >6 8
40
In 2015, these imports totaled approximately 49,500 t and 17,000 t for fishmeal and fish oil, respectively (NMFS 2015). When compared with the estimated total retained (i.e., produced minus exported) domestic production of fish meal and oil of 81,500 t and 36,000 t, respectively (FAO 2016b) (NMFS 2015), it is clear that domestic fishmeal and fish oil products are much more significant than imports in the U.S. For the purposes of this assessment, the sustainability of both domestic and imported source fisheries for trout feed ingredients was assessed. To aid in the assessment of sustainability of wild fish sources, the FishSource5 database was used. According to FishSource, the U.S. Gulf menhaden fishery scores over 6 in all management categories, with current stock health and future stock health scoring 8.8 and 10, respectively (Table 5c). Recent reports claim that the U.S. Atlantic menhaden fishery is not considered overfished, and the fishery is of an acceptable size (SEDAR 2015). The U.S. Atlantic menhaden fishery currently scores over 6 in all management categories, with current stock health and future stock health scoring 7.6 and 10, respectively (Table 5c). Imported fishmeals are primarily from Chile, Mexico, and Canada, with multiple species sourced. Each fishery from Chile has one FishSource score < 6, and the remainder of source fisheries all score > 6 (Table 5a). Imported fish oils are primarily from Peru, Chile, Iceland, and Norway; two fisheries from Peru have one FishSource score < 6, while fisheries from Norway and Iceland, representing < 10% of fish oil imports, have two scores < 6 (Table 5b). Together, source fisheries of domestic and imported fishmeals and fish oil result in a score of –5 for Factor 5.1.b – Source Fishery Sustainability. When Factor 5.1a and Factor 5.1b are combined, the final score for Factor 5.1 – Wild Fish Use is 5.62 out of 10. Factor 5.2. Net Protein Gain or Loss In commercial aquaculture, there is potential for a net protein loss when aquaculture systems produce less protein then they consume (Naylor et al. 2000). This is determined by the amount of protein fed to the farmed fish and the amount of protein harvested in the final fish product. Protein contents in trout feeds are typically in the range of 35%–50% (Barrows et al. 2007) (McIntosh et al. 2004) (Sindilariu 2007), and recent industry trends show movement toward diets containing 40%–45% protein while utilizing higher quality and more digestible protein ingredients as the norm (Bullerwell et al. 2016) (Craft et al. 2016) (pers. comm., Gary Fornshell, July 2016) (pers. comm., Ronald Hardy, August 2016); this protein consists of fishmeal (from both whole fish and processing by-products) as well as terrestrial animal and crop ingredients. For this assessment, a protein content of 45% is used, based on 45% protein in high quality commercial production feeds from Rangen6 (a U.S.-based trout feed manufacturer) and 46% protein reported for commercial diets in literature (Barrows et al. 2007) (Bullerwell et al. 2016) (Craft et al. 2016).
5 www.fishsource.org 6 Available at www.rangen.com/trout.pdf
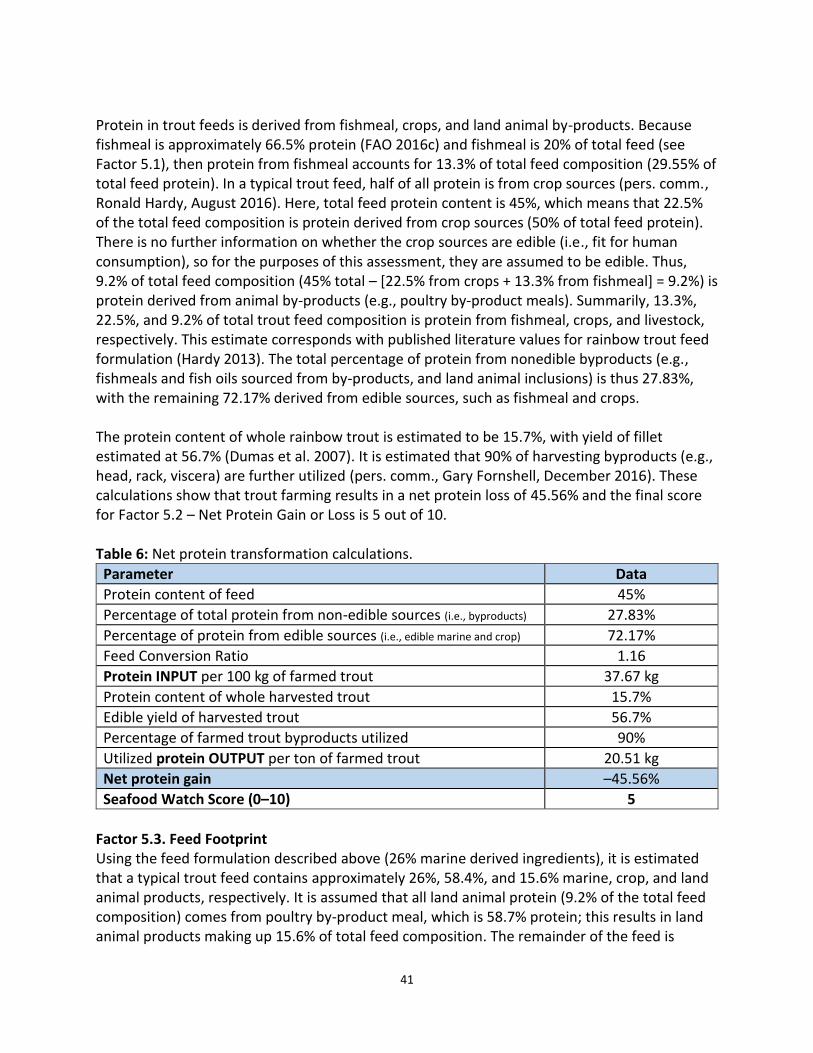
41
Protein in trout feeds is derived from fishmeal, crops, and land animal by-products. Because fishmeal is approximately 66.5% protein (FAO 2016c) and fishmeal is 20% of total feed (see Factor 5.1), then protein from fishmeal accounts for 13.3% of total feed composition (29.55% of total feed protein). In a typical trout feed, half of all protein is from crop sources (pers. comm., Ronald Hardy, August 2016). Here, total feed protein content is 45%, which means that 22.5% of the total feed composition is protein derived from crop sources (50% of total feed protein). There is no further information on whether the crop sources are edible (i.e., fit for human consumption), so for the purposes of this assessment, they are assumed to be edible. Thus, 9.2% of total feed composition (45% total – [22.5% from crops + 13.3% from fishmeal] = 9.2%) is protein derived from animal by-products (e.g., poultry by-product meals). Summarily, 13.3%, 22.5%, and 9.2% of total trout feed composition is protein from fishmeal, crops, and livestock, respectively. This estimate corresponds with published literature values for rainbow trout feed formulation (Hardy 2013). The total percentage of protein from nonedible byproducts (e.g., fishmeals and fish oils sourced from by-products, and land animal inclusions) is thus 27.83%, with the remaining 72.17% derived from edible sources, such as fishmeal and crops. The protein content of whole rainbow trout is estimated to be 15.7%, with yield of fillet estimated at 56.7% (Dumas et al. 2007). It is estimated that 90% of harvesting byproducts (e.g., head, rack, viscera) are further utilized (pers. comm., Gary Fornshell, December 2016). These calculations show that trout farming results in a net protein loss of 45.56% and the final score for Factor 5.2 – Net Protein Gain or Loss is 5 out of 10. Table 6: Net protein transformation calculations.
Parameter Data
Protein content of feed 45%
Percentage of total protein from non-edible sources (i.e., byproducts) 27.83%
Percentage of protein from edible sources (i.e., edible marine and crop) 72.17%
Feed Conversion Ratio 1.16
Protein INPUT per 100 kg of farmed trout 37.67 kg
Protein content of whole harvested trout 15.7%
Edible yield of harvested trout 56.7%
Percentage of farmed trout byproducts utilized 90%
Utilized protein OUTPUT per ton of farmed trout 20.51 kg
Net protein gain –45.56%
Seafood Watch Score (0–10) 5
Factor 5.3. Feed Footprint Using the feed formulation described above (26% marine derived ingredients), it is estimated that a typical trout feed contains approximately 26%, 58.4%, and 15.6% marine, crop, and land animal products, respectively. It is assumed that all land animal protein (9.2% of the total feed composition) comes from poultry by-product meal, which is 58.7% protein; this results in land animal products making up 15.6% of total feed composition. The remainder of the feed is
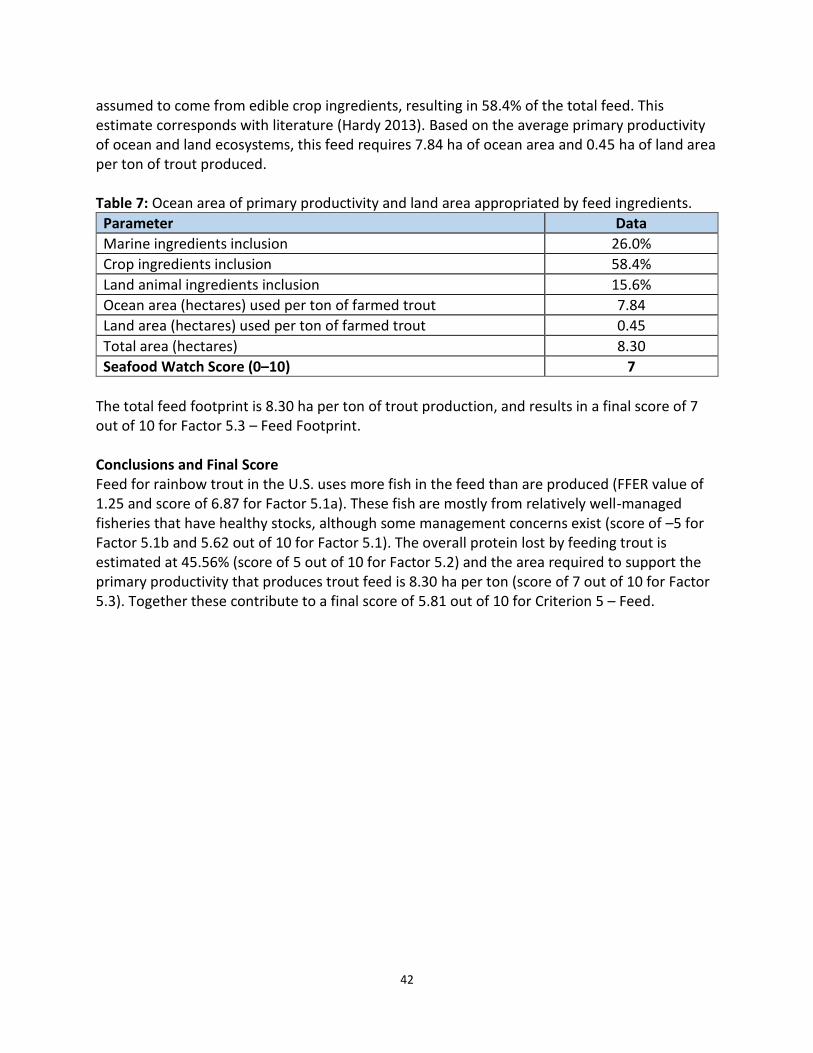
42
assumed to come from edible crop ingredients, resulting in 58.4% of the total feed. This estimate corresponds with literature (Hardy 2013). Based on the average primary productivity of ocean and land ecosystems, this feed requires 7.84 ha of ocean area and 0.45 ha of land area per ton of trout produced. Table 7: Ocean area of primary productivity and land area appropriated by feed ingredients.
Parameter Data
Marine ingredients inclusion 26.0%
Crop ingredients inclusion 58.4%
Land animal ingredients inclusion 15.6%
Ocean area (hectares) used per ton of farmed trout 7.84
Land area (hectares) used per ton of farmed trout 0.45
Total area (hectares) 8.30
Seafood Watch Score (0–10) 7
The total feed footprint is 8.30 ha per ton of trout production, and results in a final score of 7 out of 10 for Factor 5.3 – Feed Footprint. Conclusions and Final Score Feed for rainbow trout in the U.S. uses more fish in the feed than are produced (FFER value of 1.25 and score of 6.87 for Factor 5.1a). These fish are mostly from relatively well-managed fisheries that have healthy stocks, although some management concerns exist (score of –5 for Factor 5.1b and 5.62 out of 10 for Factor 5.1). The overall protein lost by feeding trout is estimated at 45.56% (score of 5 out of 10 for Factor 5.2) and the area required to support the primary productivity that produces trout feed is 8.30 ha per ton (score of 7 out of 10 for Factor 5.3). Together these contribute to a final score of 5.81 out of 10 for Criterion 5 – Feed.

43
Criterion 6: Escapes Impact, unit of sustainability and principle Impact: competition, genetic loss, predation, habitat damage , spawning disruption, and
other impacts on wild fish and ecosystems resulting from the escape of native, non-native and/or genetically distinct fish or other unintended species from aquaculture operations
Sustainability unit: affected ecosystems and/or associated wild populations. Principle: aquaculture operations pose no substantial risk of deleterious effects to wild
populations associated with the escape of farmed fish or other unintentionally introduced species.
Criterion 6 Summary
Escape parameters Value Score
F6.1 System escape risk 6
F6.1 Recapture adjustment 0
F6.1 Final escape risk score 6
F6.2 Competitive and Genetic Interactions 9
C6 Escape Final Score (0-10) 7
Critical? NO GREEN
Brief Summary Flow-through raceways and ponds are typically separated from nearby waters with multiple barriers and screens; often, the only way to escape is through these guarded discharge pipes. Though data collection of escapes is poor, the number of potential escapes associated with accidents or other events (e.g., flooding) pose no significant risk of additional ecological impacts when considering the volume of effectively identical fish intentionally released into the same waters over the past century by state hatcheries. Escaped farmed rainbow trout are likely to exhibit similar behavior, experience similar mortality rates, and are genetically similar (if not identical) to intentionally stocked trout. But risk still exists for escaped farmed trout to encounter, compete with, and hybridize with genetically pure native fish in areas where hatchery trout are no longer stocked; therefore, the final score for Criterion 6 – Escapes is 7 out of 10. Justification of Ranking Factor 6.1. Escape risk In the absence of extreme external forces (e.g., flooding), ponds and raceways have a low inherent risk of escapement because they are separated from natural water bodies by barriers and screens (Fornshell and Hinshaw 2008). This contrasts with other forms of aquaculture, such as net pens, where any damage to the nets caused by predators, weather, or other accidents can allow cultured fish a direct route of escape into the nearby environment (Belle and Nash 2008). As can be seen in Figure 3, an aerial image of a large trout farm in Idaho, the entire

44
production system is separated from the receiving waterbody by concrete; the only way for a fish to escape and survive is through the discharge.
Figure 3. Aerial image of a large trout farm in the Hagerman Valley, Idaho. Note the discharges
(whitewater) into the Snake River, while the raceways are surrounded by concrete. Reporting on the actual number of escapes is not currently available for rainbow trout; however, a rough worst-case estimate can be made based on reported production losses from the USDA. In 2015, trout farmers reported a total loss of 203,000 and 388,000 fish from “flooding” and “other” causes, respectively (USDA 2016). Because of limitations in the available data, the ultimate fate of these fish and the precise number of escapes is unknown. In instances of losses due to flood, it is possible that individuals survive and find their way into nearby waterbodies, while the “other” losses may include some unknown proportion of escapes. Anecdotally, flooding losses occur rarely in Idaho, where roughly 65% of U.S. production takes place; though major producers have not seen catastrophic escape losses in over 25 years, some farms in the state had their lowest raceways inundated during a historic 100-year flood event in 1997 (pers. comm., Gary Fornshell August 2016) (pers. comm., Randy MacMillan, August 2016).

45
Based on these numbers, a worst-case total of 591,000 individuals may have escaped from aquaculture facilities, representing a potential 0.68% escape rate of the total 86,975,000 trout that were intended for sale in 2013 (58,720,000 sold + 28,255,000 trout lost to all causes) (USDA 2016). In all likelihood, many of these escaped fish will not survive, and a significant proportion of “other” losses are actually due to other losses, such as dam failure (pers. comm., Gary Fornshell, August 2016). Additionally, because of difficulty in estimating actual stocking rates, it is possible that the number of fish is overestimated at the time of stocking; therefore, the number of true losses is smaller than what is reported and is known as “disappearing inventory" (pers. comm., Gary Fornshell, August 2016). For these reasons, the actual percentage of escape is likely a great deal less than 0.68%. Based on the typical system design of raceways (i.e., single-pass flow-through) and the possibility of escape from pond and raceway systems associated with flooding and other events, rainbow trout farms are considered to be moderate risk systems. Water discharged from farms typically passes through multiple screens and grates (at the beginning and end of every raceway and settlement basin); in Idaho (≈65% of U.S. production), every raceway is fully covered in bird netting (Fornshell and Hinshaw 2008) (pers. comm., Gary Fornshell, August 2016) (pers. comm., Randy MacMillan, August 2016). Additionally, all settlement basins in Idaho are required to be fish-free by the EPA, so these are generally fenced in addition to having grates at the influent to prevent fish from entering, and these are regularly monitored (USEPA 2007) (pers. comm., Randy MacMillan, August 2016). These escape prevention methods significantly mitigate the risk of escape, resulting in the low escape percentages detailed above; however, the absolute volume of likely escapes (those lost to “flooding”) is still over 200,000 fish annually. Because of the characteristics of the receiving waterbodies (historic alteration by intentional stocking of tens of millions of hatchery trout), this number of potential farmed escapes is considered insufficient to produce population level impacts to wild species. Thus, the score for Factor 6.1 – Escape Risk is 6 out of 10. Factor 6.2. Competitive and Genetic Interactions When fish escape from aquaculture sites into the environment, they can have both ecological and genetic impacts on resident con- and heterospecific organisms. Ecological impacts are rooted in competition for resources, such as food and space. Genetic impacts result from hybridization and the introgression of farm-fish genotypes into those of their wild counterparts. This introgression may in turn have further ecological impacts, because hybrid offspring, including trout (Muhlfeld et al. 2009), are often associated with lower overall fitness and may cause a wide variety of ecological impacts, including negatively affecting wild conspecifics, reducing local species abundance and biodiversity, and habitat alteration (Cucherousset and Olden 2011) (Muhlfeld et al. 2009) (Myrick 2002). Rainbow trout is considered a native species for the purposes of this report; the majority of U.S. trout production occurs in states where it is native, such as Idaho and California. Also, rainbow trout has been purposefully (and successfully) introduced all over the world (FAO 2016a) (Okumus 2002), and is now fully ecologically established and/or maintained by stocking throughout much of the U.S. (Fuller, Larson, and Fusar 2013). In fact, nearly half of all trout
46
operations in the U.S. (323 out of 682) are actually public or tribal operations producing eggs (hatcheries) and live trout for the purpose of distribution (i.e., conservation, stocking, and recreation); the total number of trout distributed in 2015 totaled 133,020,000 (USDA 2016), dwarfing the maximum possible number of escape from commercial food-fish trout farms (the worst-case scenario of escapes represent roughly 0.44% of total trout distributed). Thus, it is crucial to consider the risk of ecological impact within the scope of impacts already caused by intentionally released hatchery fish. Typically, hatchery fish are “more aggressive, use less energetically profitable holding and feeding positions, consume less food, and are less wary of predators” due to selective factors in captive environments (Meyer et al. 2012). These factors are likely to put hatchery trout at a competitive disadvantage relative to wild trout; multiple studies have shown hatchery trout survival to be low, with up to 85% mortality within 30 days and near 95% mortality within 1 year (High and Meyer, 2011). Escapees from commercial operations are raised in effectively identical conditions and are likely to experience similar mortality in receiving waters. Historically, stocked rainbow trout have been fertile, diploid fish; relatively recently (e.g., late 1990s), state programs in Idaho and North Carolina began stocking only sterile, triploid adult fish into waterbodies, to mitigate the potential genetic impacts of fertile hatchery fish interbreeding with wild populations (IDFG 2013) (NCWRC 2013). California, the third-largest producer of farmed rainbow trout, only began stocking triploid rainbow trout for recreation in 2013 (CDFG 2016). Many states still stock fertile rainbow trout, including younger trout (< 10") in Idaho when “no genetic risk to native trout” is determined (IDFG 2013) (WDFW 2016) (ODFW 2016). These historic stocking practices have resulting in widespread introgression of hatchery rainbow trout genetics into wild populations via inter- and intra-specific breeding (McKelvey et al. 2016) (Meyer et al. 2014) (Kozfkay et al. 2011). In their efforts to stock only sterile fish, state hatcheries often produce triploid eggs from in-house broodstock, but they will also purchase triploid eggs from the same suppliers that supply commercial food-fish producers (IDFG 2013) (NCWRC 2013) (pers. comm., Gary Fornshell, August 2016) (pers. comm., Jeff Hinshaw, August 2016). There is little, if any, genetic difference between eggs purchased from private suppliers by commercial producers and state hatcheries; for example, Idaho has historically stocked strains identical to those used in commercial production and currently purchases private triploid eggs based on availability, regardless of genetic strain (Kozfkay et al. 2011) (pers. comm., Gary Fornshell, August 2016) (pers. comm., Jeff Dillon, August 2016). It is important to note that inducing triploidy, either by heat or pressure treatment, is not 100% effective; often, resulting triploid rates fall between 95% to > 99% (IDFG 2013). The number of worst-case fertile escapes (591,000 in 2015, 0.44% of total distributed trout) falls within this range, so it is possible or even likely that distribution programs are already releasing an equal or higher volume of fertile trout. Additionally, private commercial farms in Idaho have donated fertile fingerlings to state stocking programs (pers. comm., Randy MacMillan, August 2016). It is clear that fertile rainbow trout of similar genetics are being released into watersheds in the U.S. in potentially larger volumes than escaped farmed rainbow trout.
47
All the compiled evidence suggests that the number of potential escapes from flow-through rainbow trout production facilities poses no significant risk of additional ecological impacts when considering the volume of effectively identical fish released into the same waters over the past century by state hatcheries. Escaped farmed rainbow trout are likely to exhibit similar behavior, experience similar mortality rates, and are genetically similar (if not identical) to intentionally stocked trout. But there are still many genetically pure populations of native trout strains, such as the redband trout in Idaho and Southern Appalachian brook trout in North Carolina, in watersheds where large volumes of rainbow trout production take place and hatchery fish are no longer stocked (Meyer et al. 2014) (NCWRC 2013). It is known that escapes from aquaculture facilities can and do happen; although unlikely, these fish are capable of competing and hybridizing with wild populations. Because of this risk, Factor 6.2 – Competitive and Genetic Interactions is scored 9 out of 10. The final numerical score for Criterion 6 – Escapes is 7 out of 10.
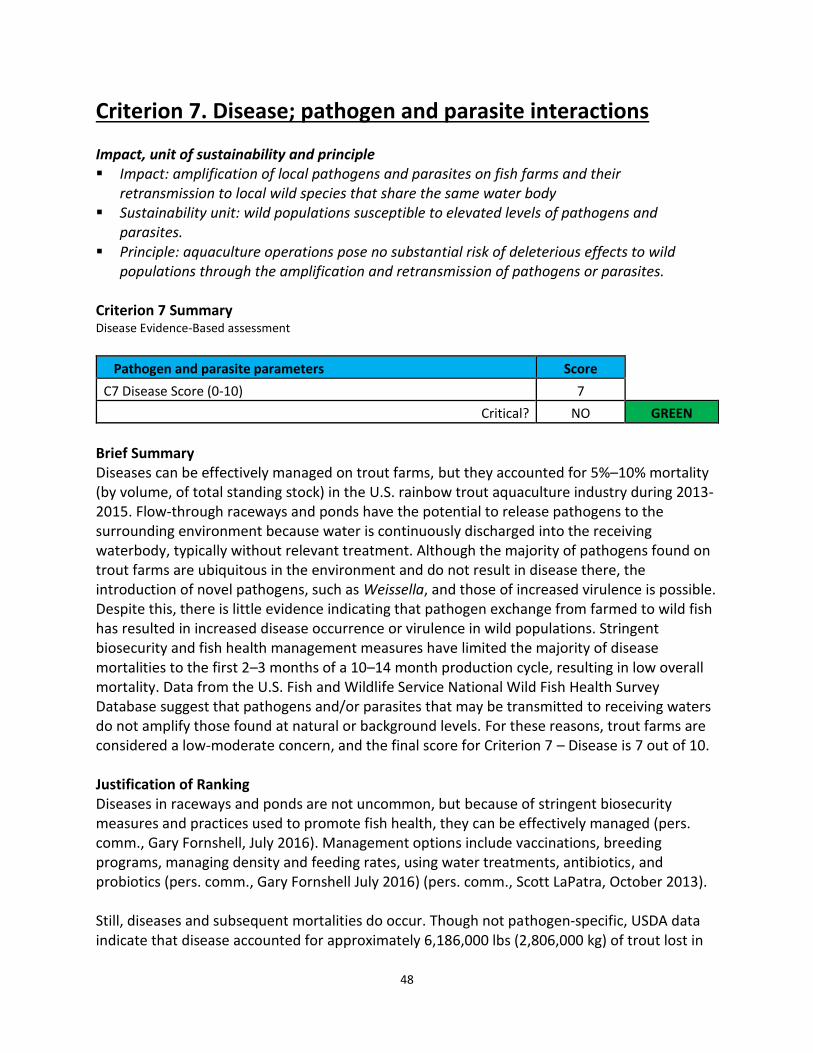
48
Criterion 7. Disease; pathogen and parasite interactions Impact, unit of sustainability and principle Impact: amplification of local pathogens and parasites on fish farms and their
retransmission to local wild species that share the same water body Sustainability unit: wild populations susceptible to elevated levels of pathogens and
parasites. Principle: aquaculture operations pose no substantial risk of deleterious effects to wild
populations through the amplification and retransmission of pathogens or parasites. Criterion 7 Summary Disease Evidence-Based assessment
Pathogen and parasite parameters Score
C7 Disease Score (0-10) 7
Critical? NO GREEN
Brief Summary Diseases can be effectively managed on trout farms, but they accounted for 5%–10% mortality (by volume, of total standing stock) in the U.S. rainbow trout aquaculture industry during 2013-2015. Flow-through raceways and ponds have the potential to release pathogens to the surrounding environment because water is continuously discharged into the receiving waterbody, typically without relevant treatment. Although the majority of pathogens found on trout farms are ubiquitous in the environment and do not result in disease there, the introduction of novel pathogens, such as Weissella, and those of increased virulence is possible. Despite this, there is little evidence indicating that pathogen exchange from farmed to wild fish has resulted in increased disease occurrence or virulence in wild populations. Stringent biosecurity and fish health management measures have limited the majority of disease mortalities to the first 2–3 months of a 10–14 month production cycle, resulting in low overall mortality. Data from the U.S. Fish and Wildlife Service National Wild Fish Health Survey Database suggest that pathogens and/or parasites that may be transmitted to receiving waters do not amplify those found at natural or background levels. For these reasons, trout farms are considered a low-moderate concern, and the final score for Criterion 7 – Disease is 7 out of 10. Justification of Ranking Diseases in raceways and ponds are not uncommon, but because of stringent biosecurity measures and practices used to promote fish health, they can be effectively managed (pers. comm., Gary Fornshell, July 2016). Management options include vaccinations, breeding programs, managing density and feeding rates, using water treatments, antibiotics, and probiotics (pers. comm., Gary Fornshell July 2016) (pers. comm., Scott LaPatra, October 2013). Still, diseases and subsequent mortalities do occur. Though not pathogen-specific, USDA data indicate that disease accounted for approximately 6,186,000 lbs (2,806,000 kg) of trout lost in

49
2015, up from 5,172,000 lbs (2,346,000 kg) in 2014 and 3,109,000 lbs (1,410,000 kg) in 2013 (USDA 2016). Overall, this represents 5%–10% of total anticipated harvest (harvest + loss) volume by weight. Across all stages of production (i.e., hatchery and growout), losses from disease represent roughly 90% of total production losses (USDA 2016). The exact proportion of these losses that occur at the growout site versus the hatchery is unknown but, as with most other aquaculture industries, diseases are much more significant in the hatchery during the early stages of the trout’s life cycle (pers. comm., Gary Fornshell, April 2013). Mortalities are disposed of in many ways, but the most common method is burial (Fornshell and Hinshaw 2008). Both Idaho and North Carolina (75% of U.S. rainbow trout production) are affected by bacterial coldwater disease (Flavobacterium psychrophilum), enteric redmouth disease (Yersinia ruckeri), Aeromonas infections (Aeromonas spp.), and columnaris (F. columnare) (Starliper 2010) (Kumar et al. 2015) (Austin and Austin 2012) (Evenhuis et al. 2014) (pers. comm., Gary Fornshell, July 2016) (pers. comm., Jeff Hinshaw, July 2016) (pers. comm., Randy MacMillan, August 2016). Bacterial coldwater disease (BCWD) is the most significant in terms of occurrence in both states, though it rarely occurs in fish larger than 10 grams (around which size fish are stocked into growout raceways) and is effectively treated with Terramycin® 200 (oxytetracycline) and Aquaflor® (florfenicol) (see Criterion 4 – Chemicals for details regarding the usage of these drugs). Because of the common co-occurrence of BCWD with another disease in Idaho, infectious hematopoietic necrosis virus (IHNV), the use of Aquaflor® to treat BCWD is uncommon because of the high cost and likely loss of fish to IHNV despite treatment for BCWD (pers. comm., Gary Fornshell, July 2016). Columnaris is of emerging concern in Idaho but quite rare in North Carolina, where outbreaks are generally limited to the summer season when surface water temperatures rise; this disease is also readily treated with Terramycin® 200 (Evenhuis et al. 2014) (Evenhuis et al. 2015) (Evenhuis et al. 2016) (pers. comm., Gary Fornshell, July 2016) (pers. comm., Jeff Hinshaw, July 2016). Neither columnaris nor BCWD (both Flavobacterium diseases) has a commercially available vaccine to treat them with in the U.S. Enteric redmouth (ERM) is effectively managed in Idaho with immersion vaccines, while in North Carolina it is managed with either an immersion or a bivalent injection vaccine (though outbreaks do rarely occur); in both states, the vaccine is administered when fish are young (< 10 grams) and can contribute to resistance to ERM later in life (pers. comm., Jeff Hinshaw, July 2016) (Evenhuis et al. 2013). Aeromonas infections—furunculosis (A. salmonicida) in Idaho and motile aeromonas septicemia (MAS, A. sobria and/or A. hydrophila) in North Carolina—are rarely seen in both states (on the order of several farms less than annually), though outbreaks do occur (pers. comm., Gary Fornshell, July 2016) (pers. comm., Jeff Hinshaw, July 2016). Furunculosis is readily treated in Idaho with Terramycin® 200 and vaccines are available, though rarely used; MAS is treated in North Carolina with Romet®-30 (pers. comm., Gary Fornshell, July 2016) (pers. comm., Jeff Hinshaw, July 2016). Several diseases that regularly occur in Idaho are not seen in North Carolina; notably, infectious hematopoietic necrosis virus (IHNV) and bacterial gill disease (BGD, F. branchiophilum). BGD is managed by treatment with antibiotics, but IHNV is an emerging viral pathogen that was introduced to Idaho from the Pacific Northwest in the 1970s and still has no known
50
commercially available treatment in the U.S. (only one vaccine has been approved for use, in Canada) (ADFG 2016) (Gudding et al. 2014) (pers. comm., Gary Fornshell, July 2016). Literature reports that IHNV has been detected in wild salmonid populations but infected wild fish “rarely display clinical disease” (Dixon et al. 2016). The disease is transmitted horizontally from fish-to-fish via waterborne virus, as well as vertically (through eggs), although all eggs used in production are certified IHNV-free (pers. comm., Gary Fornshell, July 2016) (Troyer and Kurath 2003). The mechanisms by which IHNV enters rainbow trout farms in Idaho are still unknown; there is strong evidence that IHN is present in open water sources, like the Snake River (IHN has been shown to survive without a host in freshwater for at least one month in cooler water, and longer if organic material is present). But farms generally source water from fishless underground springs (that may not be enclosed) and the disease has manifested in hatcheries with enclosed pipes directly from the source spring, implying that other transmission vectors, such as birds or aerosols (e.g., mist) may be involved (OIE 2016) (pers. comm., Gary Fornshell, July 2016) (Breyta et al. 2016) (Troyer and Kurath 2003). Although mortality from IHNV is high (up to 90% in some cases), it primarily affects young fish, with mortality decreasing with age/weight. Clinical disease is uncommon in adults; however, there is a significant lack of data regarding impacts in near-to-market size fish, and subclinical infection is generally not considered in completed studies (Dixon et al. 2016) (Breyta et al. 2016). Management of IHNV in U.S. rainbow trout aquaculture is limited to the delay of “ponding,” or stocking, into outdoor raceways from relatively more biosecure hatcheries, or factoring in expected mortality into production projections (pers. comm., Gary Fornshell, July 2016) (Breyta et al. 2016). DNA vaccines have been developed, though these are currently only approved for commercial use in Canada as of the date of this publication (pers. comm., Gary Fornshell, July 2016) (Lorenzen and LaPatra 2005). Autogenous (site-specific) vaccines have also been developed and used at larger farms that can afford to create them (pers. comm., Gary Fornshell, July 2016). North Carolina recently experienced an outbreak of Weissellosis, a bacterial disease previously undetected in the U.S. (Welch and Good 2013). Weissellosis is caused by the bacteria Weissella ceti and was detected at two farms in North Carolina in 2011–2012 (Welch and Good 2013). Clinical signs include darkening of the skin, lethargic swimming, and internal hemorrhaging, and outbreaks on rainbow trout farms in China and Brazil have caused severe mortality events. The source of this disease in the U.S. and its relation to Brazilian and Chinese outbreaks is unknown (Welch and Good 2013). To date, there is no indication that it has been found in wild species, although continued research and monitoring is imperative. Since the original outbreak, Weissellosis was re-detected at one of the two farms in the U.S. in 2013 (pers. comm., Tim Welch, October 2013) (pers. comm., Jeff Hinshaw, July 2016). A bivalent injection vaccine (effective against Weissella and the bacteria that causes ERM) was rapidly developed and has been applied at almost all farms in North Carolina since 2014; since then, Weissellosis has not been detected and vaccinations continue as a precautionary measure (pers. comm., Jeff Hinshaw, July 2016). All of these pathogens, except for Weissella, are naturally occurring in the waterbodies where trout farms are sited; some are seen exclusively or primarily in salmonid hosts (IHN, BGD, Weissellosis); some are more ubiquitous and found amongst freshwater and/or marine fish of
51
various genera (BCWD, ERM, Aeromonad infections) (Austin and Austin 2012) (Dixon et al. 2016) (OIE 2016). But the presence of pathogens in influent water and wild populations does not necessarily cause disease on a farm; often, outbreaks occur due to immunosuppressive conditions within the farm, such as high stocking density, poor water quality, and/or insufficient nutrition, rendering farmed fish more susceptible to the present pathogen(s) (LaPatra and MacMillan 2008) (pers. comm., Gary Fornshell, July 2016) (pers. comm., Jeff Hinshaw, July 2016). Similarly, healthy farmed and wild fish may act as pathogen reservoirs and show no symptoms of disease, and can transmit the pathogen to susceptible fish (LaPatra and MacMillan 2008) (pers. comm., Gary Fornshell, July 2016) (pers. comm., Jeff Hinshaw, July 2016). Literature suggests that even though bacteria and viruses are present in wild fish populations, almost all clinical disease related to these agents occurs in the farm environment (Loch and Faisal 2015) (Austin and Austin 2012) (Kunttu 2010) (Starliper 2010). To date, there is no literature demonstrating that rainbow trout farming in the U.S. has caused any amplification or increased virulence of these pathogens in the receiving waterbody, though literature does demonstrate on-farm increases in virulence of diseases such as columnaris and IHNV, sometimes as a result of management practices such as vaccination (Kurath and Winton 2011) (Sundberg et al. 2016) (Kennedy et al. 2015). Untreated effluent during disease outbreaks can contain amplified levels of shed viruses or bacteria, and is a primary vector by which diseases are transmitted from flow-through facilities into the receiving waterbody; however, there are few documented cases of pathogen transmission from freshwater flow-through rainbow trout farms to wild fish resulting in disease outbreaks in Europe (Kurath and Winton 2011) (LaPatra and MacMillan 2008). The lack of information regarding wild disease outbreaks and aquaculture’s contribution to them is largely due to uncertainties in biological, pathogenic, geographic, and anthropogenic factors (Kurath and Winton 2011) (LaPatra and MacMillan 2008). But “uncertain risk of disease transmission is never an argument against developing and employing risk-reduction measures,” and strong biosecurity measures are implemented throughout the U.S. farmed rainbow trout industry (LaPatra and MacMillan 2008). In addition, a review of over 21,000 samples and pathogen tests conducted by the U.S. Fish & Wildlife Service National Wild Fish Health Survey (NWFHS) over a 20-year period suggests that pathogens and/or parasites that may be transmitted from trout farms to receiving waters do not amplify those found at natural or background levels (USFWS 2016). For tested pathogens (see Table 8), the NWFHS data revealed an overall positive detection rate of 3.12% ± 2.08% in Idaho and North Carolina combined, from 21,331 samples taken from 2004–2014. In Idaho, the overall positive detection rate was 3.64% ± 2.10% with 17,882 samples taken from 1997–2014; the Snake River was sampled 164 times during the same time period and revealed a positive test rate of 2.21% ± 2.57%, essentially less prevalent than that in state-wide sampling. If trout farms were transmitting pathogens and/or parasites on an ecologically relevant or harmful scale, the rate of positive pathogen tests would be expected to be significantly higher where trout farms are concentrated (the Snake River) relative to Idaho as a whole. Furthermore, of the pathogens tested for, the two most frequently detected were Renibacterium salmoninarum and Myxobolus cerebralis, which cause bacterial kidney disease (BKD) and Whirling disease, respectively (Table 8); neither of these is considered a significant
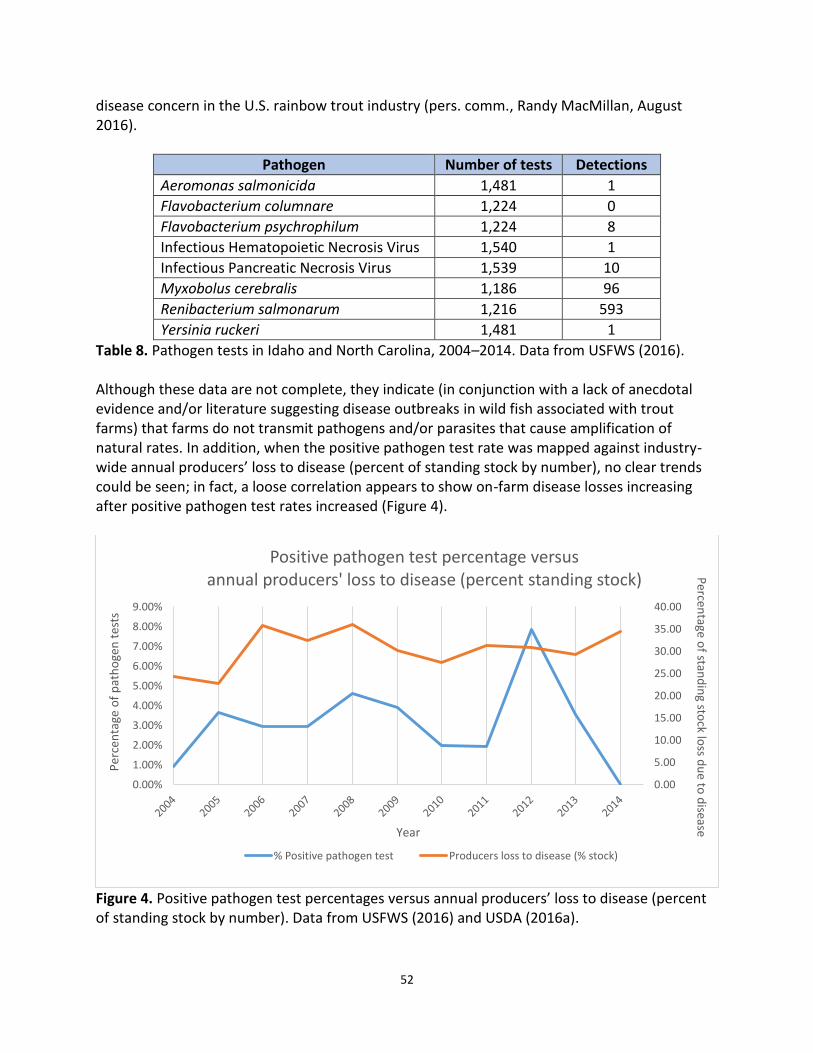
52
disease concern in the U.S. rainbow trout industry (pers. comm., Randy MacMillan, August 2016).
Pathogen Number of tests Detections
Aeromonas salmonicida 1,481 1
Flavobacterium columnare 1,224 0
Flavobacterium psychrophilum 1,224 8
Infectious Hematopoietic Necrosis Virus 1,540 1
Infectious Pancreatic Necrosis Virus 1,539 10
Myxobolus cerebralis 1,186 96
Renibacterium salmonarum 1,216 593
Yersinia ruckeri 1,481 1
Table 8. Pathogen tests in Idaho and North Carolina, 2004–2014. Data from USFWS (2016). Although these data are not complete, they indicate (in conjunction with a lack of anecdotal evidence and/or literature suggesting disease outbreaks in wild fish associated with trout farms) that farms do not transmit pathogens and/or parasites that cause amplification of natural rates. In addition, when the positive pathogen test rate was mapped against industry-wide annual producers’ loss to disease (percent of standing stock by number), no clear trends could be seen; in fact, a loose correlation appears to show on-farm disease losses increasing after positive pathogen test rates increased (Figure 4).
Figure 4. Positive pathogen test percentages versus annual producers’ loss to disease (percent of standing stock by number). Data from USFWS (2016) and USDA (2016a).
0.00
5.00
10.00
15.00
20.00
25.00
30.00
35.00
40.00
0.00%
1.00%
2.00%
3.00%
4.00%
5.00%
6.00%
7.00%
8.00%
9.00%
Percen
tage of stan
din
g stock lo
ss du
e to d
iseaseP
erce
nta
ge o
f p
ath
oge
n t
ests
Year
Positive pathogen test percentage versus annual producers' loss to disease (percent standing stock)
% Positive pathogen test Producers loss to disease (% stock)

53
It is in the best interest of aquaculturists to prevent disease from occurring, because treatment and potential losses are both costly. A primary method of mitigating disease is to manage the facility to reduce disease incidence in the first place; avoiding overcrowding, maintaining high water quality, limiting transport/handling, and properly feeding high-quality diets are all measures taken to mitigate stress and disease susceptibility in farmed trout (pers. comm., Gary Fornshell, July 2016) (pers. comm., Jeff Hinshaw, July 2016) (LaPatra and MacMillan 2008). In order to minimize the importation and spread of pathogens within a facility, strong biosecurity measures are implemented: all farms source certified disease-free eggs/fingerlings, limit traffic of people and animals, and maintain good hygiene and sanitation practices throughout the facility (pers. comm., Gary Fornshell, July 2016) (pers. comm., Jeff Hinshaw, July 2016) (LaPatra and MacMillan 2008). Hatcheries use enclosed water sources, piping directly from either fishless wells or springs (pers. comm., Gary Fornshell, July 2016) (pers. comm., Jeff Hinshaw, July 2016). In Idaho, all outdoor production (growout) is covered with bird netting, though this is less common in North Carolina due to a lack of necessity (pers. comm., Gary Fornshell, July 2016) (pers. comm., Randy MacMillan, August 2016) (pers. comm., Jeff Hinshaw, July 2016). Although it is impossible to have completely biosecure facilities, effective biosecurity planning and management has resulted in low overall disease mortality in the U.S. farmed rainbow trout industry: 5%–10% by volume of total standing stock in the last 5 years (2011–2015) (USDA 2016). It is important to note that literature, data, and industry experts suggest that disease losses primarily occur in the hatchery, where fish are younger and more susceptible (pers. comm., Gary Fornshell, July 2016) (pers. comm., Jeff Hinshaw, July 2016); the mean size lost to disease from 2011–2015 was 93 grams (fish are usually stocked at around 10 grams and harvested around 450–500 grams), and median size is likely smaller when considering the large actual number of fish lost to disease (≈32%) relative to the total standing stock, indicating that the majority of the production cycle is disease-free (USDA, 2016). Conclusions and Final Score In summary, though diseases can be effectively managed on trout farms, they have contributed to 5%–10% mortality (by volume, of total standing stock) in the U.S. rainbow trout aquaculture industry during 2013–2015 (USDA 2016). Flow-through raceways and ponds have the potential to release pathogens to the surrounding environment because water is continuously discharged into the receiving waterbody, typically without relevant treatment. Although the majority of pathogens found on trout farms are ubiquitous in the environment and do not result in disease there, the introduction of novel pathogens, such as Weissella, and those of increased virulence is possible. Despite this, there is little evidence indicating that pathogen exchange from farmed to wild fish has resulted in increased disease occurrence or virulence in wild populations. Stringent biosecurity and fish health management measures have limited the majority of disease mortalities to the first 2–3 months of a 10–14 month production cycle, resulting in low overall mortality. Data from the U.S. Fish & Wildlife Service National Wild Fish Health Survey Database suggest that pathogens and/or parasites that may be transmitted to receiving waters do not amplify those found at natural or background levels. For these reasons, trout farms are considered a low–moderate concern, and the final score for Criterion 7 – Disease is 7 out of 10.
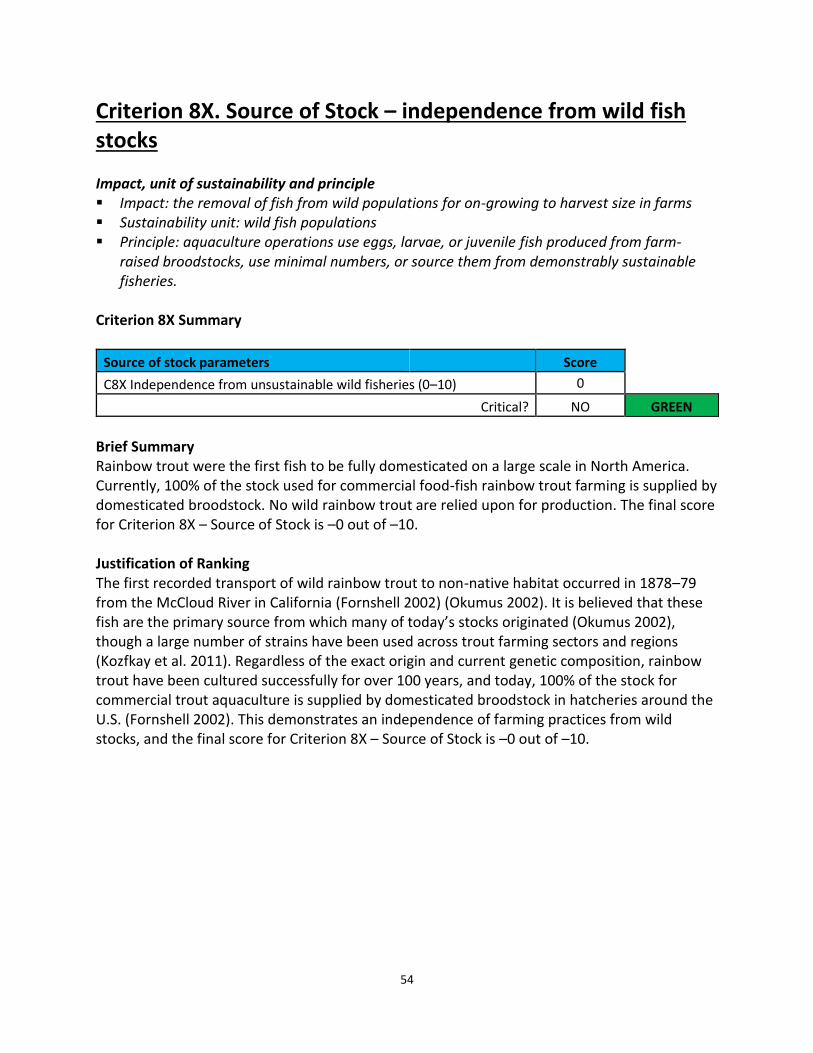
54
Criterion 8X. Source of Stock – independence from wild fish stocks Impact, unit of sustainability and principle Impact: the removal of fish from wild populations for on-growing to harvest size in farms Sustainability unit: wild fish populations Principle: aquaculture operations use eggs, larvae, or juvenile fish produced from farm-
raised broodstocks, use minimal numbers, or source them from demonstrably sustainable fisheries.
Criterion 8X Summary
Source of stock parameters Score
C8X Independence from unsustainable wild fisheries (0–10) 0
Critical? NO GREEN
Brief Summary Rainbow trout were the first fish to be fully domesticated on a large scale in North America. Currently, 100% of the stock used for commercial food-fish rainbow trout farming is supplied by domesticated broodstock. No wild rainbow trout are relied upon for production. The final score for Criterion 8X – Source of Stock is –0 out of –10. Justification of Ranking The first recorded transport of wild rainbow trout to non-native habitat occurred in 1878–79 from the McCloud River in California (Fornshell 2002) (Okumus 2002). It is believed that these fish are the primary source from which many of today’s stocks originated (Okumus 2002), though a large number of strains have been used across trout farming sectors and regions (Kozfkay et al. 2011). Regardless of the exact origin and current genetic composition, rainbow trout have been cultured successfully for over 100 years, and today, 100% of the stock for commercial trout aquaculture is supplied by domesticated broodstock in hatcheries around the U.S. (Fornshell 2002). This demonstrates an independence of farming practices from wild stocks, and the final score for Criterion 8X – Source of Stock is –0 out of –10.
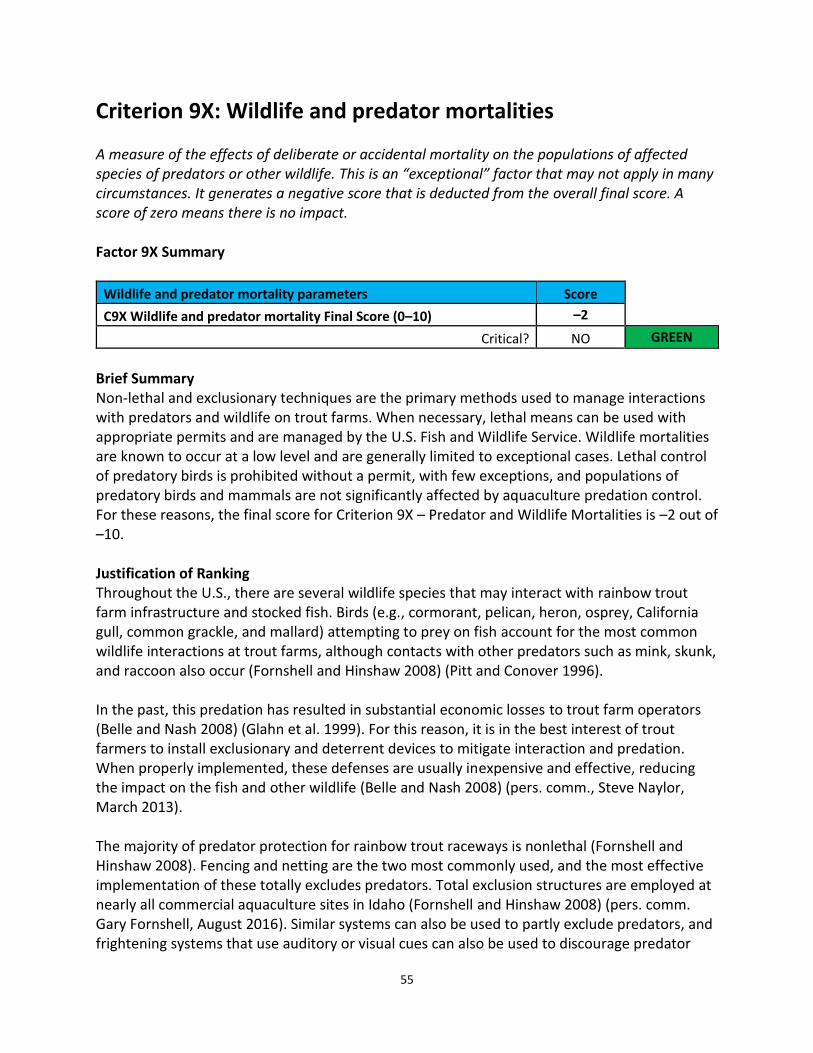
55
Criterion 9X: Wildlife and predator mortalities A measure of the effects of deliberate or accidental mortality on the populations of affected species of predators or other wildlife. This is an “exceptional” factor that may not apply in many circumstances. It generates a negative score that is deducted from the overall final score. A score of zero means there is no impact. Factor 9X Summary
Wildlife and predator mortality parameters Score
C9X Wildlife and predator mortality Final Score (0–10) –2
Critical? NO GREEN
Brief Summary Non-lethal and exclusionary techniques are the primary methods used to manage interactions with predators and wildlife on trout farms. When necessary, lethal means can be used with appropriate permits and are managed by the U.S. Fish and Wildlife Service. Wildlife mortalities are known to occur at a low level and are generally limited to exceptional cases. Lethal control of predatory birds is prohibited without a permit, with few exceptions, and populations of predatory birds and mammals are not significantly affected by aquaculture predation control. For these reasons, the final score for Criterion 9X – Predator and Wildlife Mortalities is –2 out of –10. Justification of Ranking Throughout the U.S., there are several wildlife species that may interact with rainbow trout farm infrastructure and stocked fish. Birds (e.g., cormorant, pelican, heron, osprey, California gull, common grackle, and mallard) attempting to prey on fish account for the most common wildlife interactions at trout farms, although contacts with other predators such as mink, skunk, and raccoon also occur (Fornshell and Hinshaw 2008) (Pitt and Conover 1996). In the past, this predation has resulted in substantial economic losses to trout farm operators (Belle and Nash 2008) (Glahn et al. 1999). For this reason, it is in the best interest of trout farmers to install exclusionary and deterrent devices to mitigate interaction and predation. When properly implemented, these defenses are usually inexpensive and effective, reducing the impact on the fish and other wildlife (Belle and Nash 2008) (pers. comm., Steve Naylor, March 2013). The majority of predator protection for rainbow trout raceways is nonlethal (Fornshell and Hinshaw 2008). Fencing and netting are the two most commonly used, and the most effective implementation of these totally excludes predators. Total exclusion structures are employed at nearly all commercial aquaculture sites in Idaho (Fornshell and Hinshaw 2008) (pers. comm. Gary Fornshell, August 2016). Similar systems can also be used to partly exclude predators, and frightening systems that use auditory or visual cues can also be used to discourage predator
56
activity. These can be effective, but require regular modification to prevent habituation. In instances where nonlethal methods are insufficient, regulated lethal methods are used and result in wildlife mortalities. For example, guns may be used to dispatch predators as a last resort (Fornshell and Hinshaw 2008). Almost all birds (including all those implicated in trout farm predation) are protected by the Migratory Bird Treaty Act (MBTA), and the killing of such birds is prohibited by federal law without a “Federal Migratory Bird Depredation Permit,” which is issued by the U.S. Fish and Wildlife Service (USFWS 2014). Depredation orders have been instituted, and allow the take of specific species of birds in certain locations for specific purposes, such as protection of aquaculture interests, without a permit; this is the case for double-crested cormorants in several states, including North Carolina but excluding Idaho and California (USFWS 2014). In both legal conditions, the use of lethal force is only authorized in conjunction with enacted nonlethal measures. Any legal lethal control is required to be recorded and submitted to the regional Fish and Wildlife Service office annually. Because of the efficacy of total exclusion structures in Idaho, there have been no depredation permits issued; similarly, there are no depredation permits in use in North Carolina (pers. comm., Gary Fornshell, August 2016) (pers. comm., Jeff Hinshaw, August 2016). There are no indications that endangered or protected species are experiencing mortality, especially considering the lack of interaction among endangered species and fish farms (pers. comm., Gary Fornshell, October 2013). Small predatory mammals such as minks, skunks, and raccoons can be legally killed without a permit in most places where commercial trout aquaculture occurs, like Idaho and North Carolina (NCGS 2016) (IDAC 2016). But the interaction with these animals is quite rare, because they often only attempt to prey on diseased or moribund fish and have little impact on production (Fornshell and Hinshaw 2008) (Pitt and Conover 1996). Exclusionary structures, such as fencing, are highly effective in limiting predator access, and small predatory mammals are generally not of concern, especially compared to birds (Fornshell and Hinshaw 2008) (pers. comm., Randy MacMillan, August 2016). There are dated studies that have shown that lethal control of common piscivorous birds such as herons, cormorants, gulls, and egrets on trout and catfish farms (a significantly larger industry with significantly more predator interactions (Dorr et al. 2012)) has had negligible effects on migratory and resident populations (Blackwell et al. 2000) (Belant et al. 2000). More recent studies have shown that populations of American white pelicans and double-breasted cormorants have dramatically increased since the early 1990s throughout the United States (Meyer et al. 2016) (Adkins et al. 2014). Other common predators, such as mink, skunk, and raccoon, are all listed as “Species of Least Concern” by the IUCN, have stable or increasing populations, and are actively hunted year-round in areas where trout farming regularly occurs (IUCN 2016). Regardless of the number of wildlife mortalities due to lethal predator control at U.S. rainbow trout farms, the impact at the population level is insignificant.
57
Conclusions and Final Score Ultimately, wildlife mortalities are known to occur at a low level and are generally limited to exceptional cases. Lethal control of predatory birds is prohibited without a permit, with few exceptions, and populations of predatory birds and mammals are not significantly affected by aquaculture predation control. For these reasons, the final score for Criterion 9X – Predator and Wildlife Mortalities is –2 out of –10.
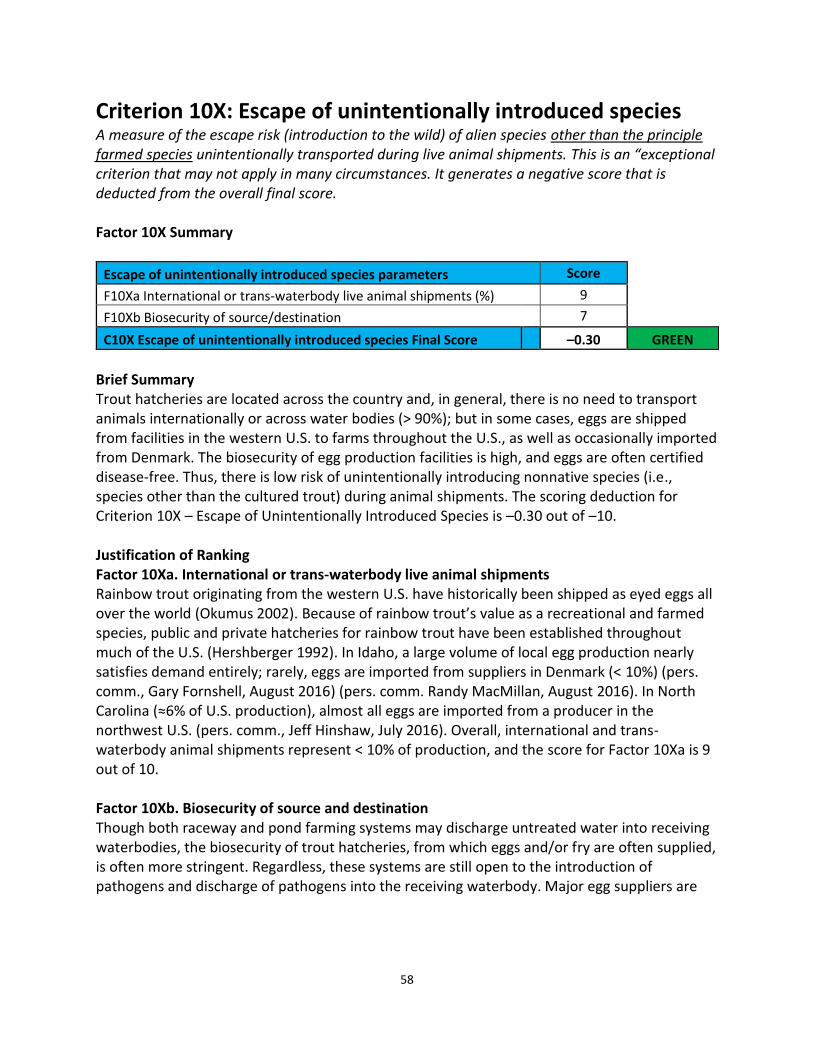
58
Criterion 10X: Escape of unintentionally introduced species A measure of the escape risk (introduction to the wild) of alien species other than the principle farmed species unintentionally transported during live animal shipments. This is an “exceptional criterion that may not apply in many circumstances. It generates a negative score that is deducted from the overall final score. Factor 10X Summary
Escape of unintentionally introduced species parameters Score
F10Xa International or trans-waterbody live animal shipments (%) 9
F10Xb Biosecurity of source/destination 7
C10X Escape of unintentionally introduced species Final Score –0.30 GREEN
Brief Summary Trout hatcheries are located across the country and, in general, there is no need to transport animals internationally or across water bodies (> 90%); but in some cases, eggs are shipped from facilities in the western U.S. to farms throughout the U.S., as well as occasionally imported from Denmark. The biosecurity of egg production facilities is high, and eggs are often certified disease-free. Thus, there is low risk of unintentionally introducing nonnative species (i.e., species other than the cultured trout) during animal shipments. The scoring deduction for Criterion 10X – Escape of Unintentionally Introduced Species is –0.30 out of –10. Justification of Ranking Factor 10Xa. International or trans-waterbody live animal shipments Rainbow trout originating from the western U.S. have historically been shipped as eyed eggs all over the world (Okumus 2002). Because of rainbow trout’s value as a recreational and farmed species, public and private hatcheries for rainbow trout have been established throughout much of the U.S. (Hershberger 1992). In Idaho, a large volume of local egg production nearly satisfies demand entirely; rarely, eggs are imported from suppliers in Denmark (< 10%) (pers. comm., Gary Fornshell, August 2016) (pers. comm. Randy MacMillan, August 2016). In North Carolina (≈6% of U.S. production), almost all eggs are imported from a producer in the northwest U.S. (pers. comm., Jeff Hinshaw, July 2016). Overall, international and trans-waterbody animal shipments represent < 10% of production, and the score for Factor 10Xa is 9 out of 10. Factor 10Xb. Biosecurity of source and destination Though both raceway and pond farming systems may discharge untreated water into receiving waterbodies, the biosecurity of trout hatcheries, from which eggs and/or fry are often supplied, is often more stringent. Regardless, these systems are still open to the introduction of pathogens and discharge of pathogens into the receiving waterbody. Major egg suppliers are
59
almost always certified disease-free by facility,7 though many smaller facilities are not. The score for factor 10Xb is 7 out of 10. Final Score The final deductive score for Criterion 10X – Escape of Unintentionally Introduced Species is –0.30 out of –10.
7 Major certified disease-free suppliers include Trout Lodge, Inc. (USA, www.troutlodge.com), Troutex (Denmark, www.troutex.dk), AquaSearch (Denmark, www.aquasearch.dk)

60
Overall Recommendation
The overall recommendation is as follows: GREEN
The overall final score is the average of the individual criterion scores (after the two exceptional scores have been deducted from the total). The overall ranking is decided according to the final score, the number of red criteria, and the number of critical scores as follows:
– Best Choice = Final score ≥6.6 AND no individual criteria are Red (i.e. <3.3)– Good Alternative = Final score ≥3.3 AND <6.6, OR Final score ≥ 6.6 and there is one individual “Red”
criterion.– Red = Final score <3.3, OR there is more than one individual Red criterion, OR there is one or more
Critical score.
Rainbow Trout Oncorhynchus mykiss United States (US) Raceways and Ponds
Criterion Score Rank Critical?
C1 Data 8.18 GREEN
C2 Effluent 8.00 GREEN NO
C3 Habitat 9.33 GREEN NO
C4 Chemicals 4.00 YELLOW NO
C5 Feed 5.81 YELLOW NO
C6 Escapes 7.00 GREEN NO
C7 Disease 7.00 GREEN NO
C8X Source 0.00 GREEN NO
C9X Wildlife mortalities –2.00 GREEN NO
C10X Introduced species escape –0.30 GREEN
Total 47.02
Final score (0–10) 6.72
OVERALL RANKING
Final Score 6.72
Initial rank GREEN
Red criteria 0
Interim rank GREEN FINAL RANK
Critical Criteria? NO GREEN
61
Acknowledgements Scientific review does not constitute an endorsement of the Seafood Watch® program, or its seafood recommendations, on the part of the reviewing scientists. Seafood Watch® is solely responsible for the conclusions reached in this report. Seafood Watch would like to thank the author of this report, Tyler Isaac – Seafood Watch Aquaculture Scientist, as well as acknowledge Gary Fornshell, Dr. Jeff Hinshaw, and Dr. Randy MacMillan for the contributions to and review of this assessment.
62
References Adkins, J. Y., Roby, D. D., Lyons, D. E., Courtot, K. N., Collis, K., Carter, H. R., … Capitolo, P. J.
(2014). Recent population size, trends, and limiting factors for the double-crested cormorant in western North America: Double-Crested Cormorant Population Trends. The Journal of Wildlife Management, 78(7), 1131–1142. http://doi.org/10.1002/jwmg.737
Alaska Department of Fish and Game (ADFG) (2016). Parasites and Diseases in Alaska. Retrieved
August 19, 2016, from http://www.adfg.alaska.gov/index.cfm?adfg=disease.diseaselist Aubin, J., Tocqueville, A., & Kaushik, S. J. (2011). Characterisation of waste output from flow-
through trout farms in France: comparison of nutrient mass-balance modelling and hydrological methods. Aquatic Living Resources, 24(1), 63–70. doi:10.1051/alr/2011008
Austin, B., & Austin, D. A. (2012). Bacterial Fish Pathogens. Dordrecht: Springer Netherlands.
Retrieved August 19, 2016, from http://link.springer.com/10.1007/978-94-007-4884-2 Azevedo, P. a., Leeson, S., Cho, C. Y., & Bureau, D. P. (2004). Growth, nitrogen and energy
utilization of juveniles from four salmonid species: diet, species and size effects. Aquaculture, 234(1-4), 393–414. doi:10.1016/j.aquaculture.2004.01.004
Bakal, Robert S., and Michael K. Stoskopf (2001). “In Vitro Studies of the Fate of
Sulfadimethoxine and Ormetoprim in the Aquatic Environment.” Aquaculture 195.1: 95–102.
Barrows, F. T., Gaylord, T. G., Sealey, W. M., Porter, L., & Smith, C. E. (2008). The effect of
vitamin premix in extruded plant-based and fish meal based diets on growth efficiency and health of rainbow trout, Oncorhynchus mykiss. Aquaculture, 283(1-4), 148–155. doi:10.1016/j.aquaculture.2008.07.014
Barrows, F. T., Gaylord, T. G., Stone, D. J., & Smith, C. E. (2007). Effect of protein source and
nutrient density on growth efficiency, histology and plasma amino acid concentration of rainbow trout (Oncorhynchus mykiss Walbaum). Aquaculture Research, 071119223248002–??? doi:10.1111/j.1365-2109.2007.01854.x
Behnke, R. J. (2002). Trout and Salmon of North America (p. 384). New York: The Free Press. Belant, J. L., Tyson, L. A., & Mastrangelo, P. A. (2000). Effects of lethal control at aquaculture
facilities on populations of piscivorous birds. Wildlife Society Bulletin, 379–384.
63
Belle, S. M., & Nash, C. E. (2008). Better Management Practices for Net-Pen Aquaculture. In C. S. Tucker & J. A. Hargreaves (Eds.), Environmental Best Practices for Aquaculture (pp. 261–330). Ames, Iowa: Blackwell Publishing.
Belle, S. M., & Nash, C. E. (2008). Better Management Practices for Net-Pen Aquaculture. In C.
S. Tucker & J. A. Hargreaves (Eds.), Environmental Best Practices for Aquaculture (pp. 261–330). Ames, Iowa: Blackwell Publishing.
Blackwell, B. F., Dolbeer, R. A., & Tyson, L. A. (2000). Lethal control of piscivorous birds at
aquaculture facilities in the northeast United States: effects on populations. North American Journal of Aquaculture, 62(4), 300–307.
Boaventura, R., Pedro, A.M., Coimbra, J., Lencastre, E. (1997). Trout farm effluents:
characterisation and impact on the receiving streams. Environmental Pollution 95, 379–387.
Boyd, C. E., McNevin, A. A., Clay, J., & Johnson, H. M. (2005). Certification Issues for Some
Common Aquaculture Species. Reviews in Fisheries Science, 13(4), 231–279. http://doi.org/10.1080/10641260500326867
Boyd, C. E., Zajicek, P. W., Hargreaves, J. A., & Jensen, G. L. (2008). Development,
Implementation, and Verification of Better Management Practices for Aquaculture. In C. S. Tucker & J. A. Hargreaves (Eds.), Environmental Best Practices for Aquaculture (pp. 129–149). Ames, Iowa: Blackwell Publishing.
Breyta, R., Samson, C., Blair, M., Black, A., & Kurath, G. (2016). Successful mitigation of viral
disease based on a delayed exposure rearing strategy at a large-scale steelhead trout conservation hatchery. Aquaculture, 450, 213–224. http://doi.org/10.1016/j.aquaculture.2015.07.014
Bullerwell, Christina N. et al. (2016). “Growth Performance, Proximate and Histological Analysis of Rainbow Trout Fed Diets Containing Camelina Sativa Seeds, Meal (High-Oil and Solvent-Extracted) and Oil.” Aquaculture 452: 342–350.
Bureau, D. P., & Hua, K. (2010). Towards effective nutritional management of waste outputs in
aquaculture, with particular reference to salmonid aquaculture operations. Aquaculture Research, 41(5), 777–792. doi:10.1111/j.1365-2109.2009.02431.x
Cabello, Felipe C. et al. (2013). “Antimicrobial Use in Aquaculture Re-Examined: Its Relevance to
Antimicrobial Resistance and to Animal and Human Health: Aquacultural Antimicrobial Use and Antimicrobial Resistance.” Environmental Microbiology 15.7: 1917–1942.
California Fish and Game Code (CDFG), Division 2 § 1729(e), (2016).

64
Camargo, J. A., Gonzalo, C., & Alonso, Á. (2011). Assessing trout farm pollution by biological metrics and indices based on aquatic macrophytes and benthic macroinvertebrates: A case study. Ecological Indicators, 11(3), 911–917. http://doi.org/10.1016/j.ecolind.2010.10.001
Chamberlain, A. (2011). Fishmeal and Fish Oil – The Facts , Figures , Trends , and IFFO’s
Responsible Supply Standard. IFFO. Retrieved August 19, 2016, from http://www.iffo.net/downloads/Datasheets Publications SP/FMFOF2011.pdf
Cho, C. Y. (1992). Feeding systems for rainbow trout and other salmonids with reference to
current estimates of energy and protein requirements. Aquaculture, 100(1-3), 107–123. Craft, Christopher D. et al. (2016). “Growth, Proximate Composition, and Sensory
Characteristics of Rainbow Trout Oncorhynchus Mykiss Consuming Alternative Proteins.” Aquaculture 459: 223–231.
Cucherousset, J., & Olden, J. D. (2011). Ecological Impacts of Non-native Freshwater Fishes.
Fisheries, 36(5), 215–230. Dixon, P., Paley, R., Alegria-Moran, R., & Oidtmann, B. (2016). Epidemiological characteristics of
infectious hematopoietic necrosis virus (IHNV): a review. Veterinary Research, 47(1). http://doi.org/10.1186/s13567-016-0341-1
Dorr, B. S., Burger, L. W. Jr., Barras, S., & Casscles-Godwin, K. (2012). Economic Impact of
Double-Crested Cormorant, Phalacrocorax auritus, Depredation on Channel Catfish, Ictalurus punctatus, Aquaculture in Mississippi, USA. USDA National Wildlife Research Center - Staff Publications. Paper 1124.
Dumas, A., de Lange, C. F. M., France, J., & Bureau, D. P. (2007). Quantitative description of
body composition and rates of nutrient deposition in rainbow trout (Oncorhynchus mykiss). Aquaculture, 273(1), 165–181. doi:10.1016/j.aquaculture.2007.09.026
Dumas, A., de Lange, C. F. M., France, J., & Bureau, D. P. (2007). Quantitative description of
body composition and rates of nutrient deposition in rainbow trout (Oncorhynchus mykiss). Aquaculture, 273(1), 165–181. doi:10.1016/j.aquaculture.2007.09.026
Engle, C. R., Pomerleau, S., Fornshell, G., Hinshaw, J. M., Sloan, D., & Thompson, S. (2005). The
economic impact of proposed effluent treatment options for production of trout Oncorhynchus mykiss in flow-through systems. Aquacultural Engineering, 32(2), 303–323. doi:10.1016/j.aquaeng.2004.07.001
Evenhuis, J. P., LaPatra, S. E., & Marancik, D. (2014). Early life stage rainbow trout
(Oncorhynchus mykiss) mortalities due to Flavobacterium columnare in Idaho, USA. Aquaculture, 418–419, 126–131. http://doi.org/10.1016/j.aquaculture.2013.09.044
65
Evenhuis, J. P., Mohammed, H., LaPatra, S. E., Welch, T. J., & Arias, C. R. (2016). Virulence and
molecular variation of Flavobacterium columnare affecting rainbow trout in Idaho, USA. Aquaculture, 464, 106–110. http://doi.org/10.1016/j.aquaculture.2016.06.017
Evenhuis, J. P., Wiens, G. D., Wheeler, P., Welch, T. J., LaPatra, S. E., & Thorgaard, G. H. (2014a).
Transfer of serum and cells from Yersinia ruckeri vaccinated doubled-haploid hot creek rainbow trout into outcross F1 progeny elucidates mechanisms of vaccine-induced protection. Developmental & Comparative Immunology, 44(1), 145–151. http://doi.org/10.1016/j.dci.2013.12.004
Food and Agriculture Organization of the United Nations (FAO) (2016a). Cultured Aquatic
Species Information Program: Onchorhynkiss mykiss. Retrieved August 19, 2016, from http://www.fao.org/fishery/culturedspecies/Oncorhynchus_mykiss/en
Food and Agriculture Organization of the United Nations (FAO) (2016b). Fishery and
Aquaculture Statistics. Global commodities production and trade 1976-2013. FishStatJ. Food and Agriculture Organization of the United Nations (FAO) (2016c). Fishmeal. FAO
corporate document repository. FAO. Retrieved August 19, 2016, from http://www.fao.org/wairdocs/tan/x5926e/x5926e01.htm
Federal Water Pollution Control Act (“Clean Water Act”, CWA). 33 USC. §§1251-1387. Fishsource. (2016). Fish Source. Retrieved August 19, 2016, from http://www.fishsource.com/ Fornshell, G. (2002). Rainbow Trout — Challenges and Solutions Rainbow Trout — Challenges
and Solutions. Reviews in Fisheries Science, 10(3-4), 545–557. Fornshell, G., & Hinshaw, J. M. (2008). Better Management Practices for Flow-Through
Aquaculture Systems. In C. S. Tucker & J. A. Hargreaves (Eds.), Environmental Best Practices for Aquaculture (pp. 331–388). Ames, Iowa: Blackwell Publishing.
Fornshell, G., Hinshaw, J. M., & Tidwell, J. H. (2012). Flow-through Raceways. In J. H. Tidwell
(Ed.), Aquaculture Production Systems (pp. 173-190). John Wiley & Sons, Inc. Fry, J. P., Love, D. C., MacDonald, G. K., West, P. C., Engstrom, P. M., Nachman, K. E., &
Lawrence, R. S. (2016). Environmental health impacts of feeding crops to farmed fish. Environment International, 91, 201–214. http://doi.org/10.1016/j.envint.2016.02.022
Fuller, P., Larson, J., & Fusar, A. (2013). Oncorhynchus mykiss. USGS Nonindifenous Aquatic
Species Database. Retrieved March 26, 2013, from http://nas.er.usgs.gov/queries/factsheet.aspx?SpeciesID=910 Revision Date: 3/7/2012

66
Gildemeister, Alfredo Tello (2012).“A Study into the Effects and Environmental Risk of Antibiotics Used in Freshwater Aquaculture on Environmental Bacteria.” University of Stirling.
Glahn, J. F., Rasmussen, E. S., Tomsa, T., & Preusser, K. J. (1999). Distribution and Relative
Impact of Avian Predators at Aquaculture Facilities in the Northeastern United States Aquaculture Facilities in the Northeastern United States. North American Journal of Aquaculture, 61(4), 340–348.
Gudding, R., Lillehaug, A., & Evensen, Ø. (Eds.). (2014). Fish vaccination. Chichester, West
Sussex, UK ; Hoboken, NJ: Wiley Blackwell. Hardy, R.W. (2013). Species profile: rainbow trout (Oncorhynchus mykiss Walbaum, 1792). In
Aquaculture Feed and Fertilizer Resources Information System (www.fao.org/fishery/affris/en/org/fishery/affris/en/). Rome, FAO.
Hardy, R. W., Fornshell, G., & Brannon, E. (2000). Rainbow trout culture. In Encyclopedia of
Aquaculture. John Wiley & Sons, Inc. High, B., & Meyer, K. A. (2009). Survival and Dispersal of Hatchery Triploid Rainbow Trout in an
Idaho River. North American Journal of Fisheries Management, 29(6), 1797–1805. http://doi.org/10.1577/M07-220.1
Hinshaw, J. M., & Fornshell, G. (2002). Effluents from raceways. In J. Tomasso (Ed.), Aquaculture
and the Environment in the United States (pp. 77–104). Baton Rouge, Lousiana: United States Aquaculture Society.
Hinshaw, J. M., Fornshell, G., & Kinnunen, R. (2004). A profile of the aquaculture of trout in the
United States. USDA Risk Management Agency, Mississippi State University, Mississippi, USA.
Hurley, Michael (Editor) (2002). Upper Middle Snake River Subbasin Summary. Retrieved
August 19, 2016, from http://cfw.nwcouncil.org/FWProgram/ReviewCycle/fy2003is/workplan/020517UpperMiddleSnake.pdf
Idaho Administrative Code (IDAC) (2016). Idaho Administrative Procedures Act (IDAPA)
13.01.16. Idaho Department of Environmental Quality (IDEQ) (1998). The Middle Snake River Watershed
Management Plan. Retrieved August 19, 2016, from https://www.deq.idaho.gov/media/454006-snake_river_middle_entire.pdf

67
Idaho Department of Environmental Quality (IDEQ) (2010). Upper Snake Rock/Middle Snake TMDLs 5-Year TMDL Review. Retrieved August 19, 2016, from https://www.deq.idaho.gov/media/453716-snake_rock_upper_five_year_review_0409.pdf
Idaho Department of Environmental Quality (IDEQ) (2016a). Snake River (Upper Snake-Rock)
Subbasin. Retrieved August 19, 2016, from http://www.deq.idaho.gov/water-quality/surface-water/tmdls/table-of-sbas-tmdls/snake-river-upper-snake-rock-subbasin/
Idaho Department of Environmental Quality (IDEQ) (2016b). Water Quality Division. Retrieved
August 19, 2016, from http://www.deq.idaho.gov/water-quality.aspx Idaho Department of Fish and Game (IDFG) (2013). Fisheries Management Plan 2013 – 2018.
Retrieved August 19, 2016, from https://fishandgame.idaho.gov/public/fish/planFisheries.pdf.
Idaho Fish and Game (IDFG) (2016). Idaho Hunt Planner, Snake River Zone. Retrieved August 19,
2016, from https://fishandgame.idaho.gov/ifwis/huntplanner/zone.aspx?ID=26 Idaho Statutes (2016). Title 22, Chapter 46. International Union for Conservation of Nature (IUCN). (2016). The IUCN Red List of Threatened
Species 2016. Retrieved August 19, 2016, from www.iucnredlist.org. Jackson, A., & Shepherd, J. (2012). “The Future of Fishmeal and Fish Oil.” Second International
Congress on Seafood Technology on Sustainable, Innovative and Healthy Seafood. 189. Jensen, G. L., & Zajicek, P. W. (2008). Best Management Practice Programs and Initiatives in the
United States. In C. S. Tucker & J. A. Hargreaves (Eds.), Environmental Best Practices for Aquaculture (pp. 91–128). Ames, Iowa: Blackwell Publishing.
Kennedy, D. A., Kurath, G., Brito, I. L., Purcell, M. K., Read, A. F., Winton, J. R., & Wargo, A. R.
(2016). Potential drivers of virulence evolution in aquaculture. Evolutionary Applications, 9(2), 344–354. http://doi.org/10.1111/eva.12342
Kozfkay, C. C., Campbell, M. R., Meyer, K. A., & Schill, D. J. (2011). Influences of Habitat and
Hybridization on the Genetic Structure of Redband Trout in the Upper Snake River Basin, Idaho. Transactions of the American Fisheries Society, 140(2), 282–295. http://doi.org/10.1080/00028487.2011.567837
Kumar, G., Menanteau-Ledouble, S., Saleh, M., & El-Matbouli, M. (2015). Yersinia ruckeri, the
causative agent of enteric redmouth disease in fish. Veterinary Research, 46(1). http://doi.org/10.1186/s13567-015-0238-4

68
Kunttu, Heidi (2010). Characterizing the bacterial fish pathogen Flavobacterium columnare, and
some factors affecting its pathogenicity. Jyvalskyla: University of Jyvaskyla. Kurath, G., & Winton, J. (2011). Complex dynamics at the interface between wild and domestic
viruses of finfish. Current Opinion in Virology, 1(1), 73–80. http://doi.org/10.1016/j.coviro.2011.05.010
LaPatra, S., & MacMillan, J. (2008). Better Management Practices for Flow-Through Aquaculture
Systems. In C. S. Tucker & J. A. Hargreaves (Eds.), Environmental Best Practices for Aquaculture (pp. 487–512). Ames, Iowa: Blackwell Publishing.
Loch, D.D., West, J.L., Perlmutter, D.G. (1996) The effect of trout farm effluent on the taxa
richness of benthic macroinvertebrates. Aquaculture 147:37−55. Loch, T. P., & Faisal, M. (2015). Emerging flavobacterial infections in fish: A review. Journal of
Advanced Research, 6(3), 283–300. http://doi.org/10.1016/j.jare.2014.10.009 Lorenzen, N., & LaPatra, S. E. (2005). DNA vaccines for aquacultured fish. Revue Scientifique Et
Technique-Office International Des Epizooties, 24(1), 201. MacMillan, John R., Rosalie A. Schnick, and Gary Fornshell. (2006)“Stakeholder Position Paper:
Aquaculture Producer.” Preventive Veterinary Medicine 73.2–3: 197–202. CrossRef. Web.
McIntosh, D., Ryder, E., Dickenson, G., & Fitzsimmons, K. (2004). Laboratory Determination of a
Phosphorus Leaching Rate from Trout. Journal of the World Aquaculture Society, 35(4), 506–512.
McKelvey, K. S., Young, M. K., Wilcox, T. M., Bingham, D. M., Pilgrim, K. L., & Schwartz, M. K.
(2016). Patterns of hybridization among cutthroat trout and rainbow trout in northern Rocky Mountain streams. Ecology and Evolution, 6(3), 688–706. http://doi.org/10.1002/ece3.1887
Meyer, K. A., High, B., & Elle, F. S. (2012). Effects of Stocking Catchable-Sized Hatchery Rainbow
Trout on Wild Rainbow Trout Abundance, Survival, Growth, and Recruitment. Transactions of the American Fisheries Society, 141(1), 224–237. http://doi.org/10.1080/00028487.2012.654889
Meyer, K. A., Schill, D. J., Mamer, E. R. J. M., Kozfkay, C. C., & Campbell, M. R. (2014). Status of
Redband Trout in the Upper Snake River Basin of Idaho. North American Journal of Fisheries Management, 34(3), 507–523. http://doi.org/10.1080/02755947.2014.886643
69
Meyer, K. A., Sullivan, C. L., Kennedy, P., Schill, D. J., Teuscher, D. M., Brimmer, A. F., & King, D. T. (2016). Predation by American White Pelicans and Double-Crested Cormorants on Catchable-Sized Hatchery Rainbow Trout in Select Idaho Lentic Waters. North American Journal of Fisheries Management, 36(2), 294–308. http://doi.org/10.1080/02755947.2015.1120835
Miranda, Claudio D. (2012). “Antimicrobial Resistance Associated with Salmonid Farming.”
Antimicrobial resistance in the environment, pages 423–451. Muhlfeld, C. C., Albeke, S. E., Gunckel, S. L., Writer, B. J., Shepard, B. B., & May, B. E. (2015).
Status and Conservation of Interior Redband Trout in the Western United States. North American Journal of Fisheries Management, 35(1), 31–53. http://doi.org/10.1080/02755947.2014.951807
Muhlfeld, C. C., Kalinowski, S. T., McMahon, T. E., Taper, M. L., Painter, S., Leary, R. F., &
Allendorf, F. W. (2009). Hybridization rapidly reduces fitness of a native trout in the wild. Biology Letters, 5(3), 328–31. doi:10.1098/rsbl.2009.0033
Myrick, C. A. (2002). Ecological impacts of escaped organisms. In J. R. Tomasso (Ed.),
Aquaculture and the Environment in the United States (pp. 225–245). Baton Rouge, Lousiana: United States Aquaculture Society.
National Marine Fisheries Service (NMFS) (2015). Fisheries of the United States. US Department
of Commerce, NOAA Current Fishery Statistics No.2014. Available at: https://www.st.nmfs.noaa.gov/commercial-fisheries/ fus/fus14/index
National Oceanic and Atmospheric Administration (NOAA) (2016). Monthly Product by
Country/Association. National Marine Fisheries Service (NMFS): Commercial Fisheries Statistics. Retrieved August 19, 2016, from https://www.st.nmfs.noaa.gov/commercial-fisheries/foreign-trade/applications/monthly-product-by-countryassociation
NatureServe. (2016). NatureServe Explorer. An online encyclopedia of life. Version 7.1.
Retrieved August 19, 2016, from http://www.natureserve.org/explorer Naylor, R., Goldburg, R. J., Primavera, J. H., Kautsky, N., Beveridge, M. C., Clay, J., … Troell, M.
(2000). Effect of aquaculture on world fish supplies. Nature, 405(6790), 1017–24. doi:10.1038/35016500
North Carolina Department of Agriculture and Consumer Services (NCDACS) (2001).
Aquaculture in North Carolina: Rainbow Trout – Inputs, Outputs and Economics. Retrieved August 19, 2016, from http://www.agmrc.org/media/cms/Trout01_31E17F584A9DC.pdf.
70
North Carolina Department of Environmental Quality (NC DEQ) (2013). Lake & Reservoir Assessments: French Broad River Basin. Retrieved August 19, 2016, from https://ncdenr.s3.amazonaws.com/s3fs-public/Water Quality/Environmental Sciences/Reports/2012FBRComplete.pdf
North Carolina Department of Environmental Quality (NC DEQ) (2016): Ambient Monitoring
System. Retrieved August 19, 2016, from https://deq.nc.gov/about/divisions/water-resources/water-resources-data/water-sciences-home-page/ecosystems-branch/ambient-monitoring-system
North Carolina Forest Service (NCFS) (2014). North Carolina Forest Health Highlights. Retrieved
August 19, 2016, from http://www.fs.fed.us/foresthealth/fhm/fhh/fhh_14/NC_FHH_2014.pdf.
North Carolina General Statutes (NCGS) (2016a). G.S.106. North Carolina General Statutes (NCGS) (2016b). G.S.113-291. North Carolina Wildlife Resources Commission (NCWRC) (2013). North Carolina Trout Resources
Management Plan. Retrieved August 19, 2016, from http://ncwildlife.org/Portals/0/Fishing/documents/TroutManagementPlan.pdf
Okumus, I. (2002). Rainbow Trout Broodstock Management and Seed Production in Turkey:
Present Practices, Constraints and the Future. Turkish Journal of Fisheries and Aquatic Sciences, 2, 41–56.
Oregon Department of Fish and Wildlife (ODFW) (2016). Fish Propagation Annual Report for
2015. Retrieved August 19, 2016, from http://www.dfw.state.or.us/fish/hatchery/docs/2015_Fish_Propagtion_Annual_Report.pdf.
Pauly, D., & Watson, R. (2009). Spatial Dynamics of Marine Fisheries. In S. Levin (Ed.), The
Princeton Guide to Ecology (pp. 501–509). Princeton, N.J.: Princeton University Press. Péron, G., François Mittaine, J., & Le Gallic, B. (2010). Where do fishmeal and fish oil products
come from? An analysis of the conversion ratios in the global fishmeal industry. Marine Policy, 34(4), 815–820. doi:10.1016/j.marpol.2010.01.027
Pierce, L. R., Palti, Y., Silverstein, J. T., Barrows, F. T., Hallerman, E. M., & Parsons, J. E. (2008).
Family growth response to fishmeal and plant-based diets shows genotype×diet interaction in rainbow trout (Oncorhynchus mykiss). Aquaculture, 278(1-4), 37–42. doi:10.1016/j.aquaculture.2008.03.017
71
Pitt, W. C., & Conover, M. R. (1996). Predation at Intermountain West Fish Hatcheries. The Journal of Wildlife Management, 60(3), 616–624.
Rasmussen, R. S., & Ostenfeld, T. H. (2000). Effect of growth rate on quality traits and feed
utilisation of rainbow trout (Oncorhynchus mykiss) and brook trout (Salvelinus fontinalis). Aquacultural Engineering, 184, 327–337.
Rico, Andreu et al. (2012). “Use of Chemicals and Biological Products in Asian Aquaculture and
Their Potential Environmental Risks: A Critical Review: Environmental Risks of Asian Aquaculture.” Reviews in Aquaculture 4.2: 75–93.
Rodgers, C. J., & Furones, M. D. (2009). Antimicrobial agents in aquaculture : Practice , needs
and issues. In C. Rogers & B. Bascurco (Eds.), The use of veterinary drugs and vaccines in Mediterranean aquaculture (pp. 41–59). CIHEAM.
Romero, Jaime, Carmen Gloria Feijoó, and Paola Navarrete (2012). Antibiotics in Aquaculture-
Use, Abuse and Alternatives. INTECH Open Access Publisher. Rose, Peter E., and Joel A. Pedersen (2005). “Fate of Oxytetracycline in Streams Receiving
Aquaculture Discharges: Model Simulations.” Environmental toxicology and chemistry 24.1: 40–50.
Sanders, Sarah (2007). “The Fate and Transport of the Antimicrobials Sulfadimethoxine and
Ormetoprim in the Environment.” Auburn University. Schmidt, Anja S. et al. (2000). “Occurrence of Antimicrobial Resistance in Fish-Pathogenic and
Environmental Bacteria Associated with Four Danish Rainbow Trout Farms.” Applied and Environmental Microbiology 66.11: 4908–4915.
Schmidt, L. et al. (2007)“An Environmental Assessment of the Proposed Use of Oxytetracycline-
Medicated Feed in Freshwater Aquaculture.” US Geological Survey, Biological Resources Division.
Sindilariu, P.D. (2007). Reduction in effluent nutrient loads from flow-through facilities for trout
production: a review. Aquaculture Research, 38(10), 1005–1036. doi:10.1111/j.1365-2109.2007.01751.x
Southeast Data, Assessment, and Review (SEDAR) (2015). SEDAR 40 – Atlantic Menhaden Stock
Assessment Report. SEDAR, North Charleston SC. 643 pp. Retrieved August 19, 2016, from http://www.sefsc.noaa.gov/sedar/Sedar_Workshops.jsp?WorkshopNum=40.
Stamm, John M. (1989) “In Vitro Resistance by Fish Pathogens to Aquacultural Antibacterials,
Including the Quinolones Difloxacin (A-56619) and Sarafloxacin (A-56620).” Journal of Aquatic Animal Health 1.2: 135–141.
72
Starliper, C. E. (2010). Bacterial coldwater disease of fishes caused by Flavobacterium psychrophilum. Journal of Advanced Research, 2(2), 97–108. http://doi.org/10.1016/j.jare.2010.04.001
Sundberg, L.-R., Ketola, T., Laanto, E., Kinnula, H., Bamford, J. K. H., Penttinen, R., & Mappes, J.
(2016). Intensive aquaculture selects for increased virulence and interference competition in bacteria. Proceedings of the Royal Society B: Biological Sciences, 283(1826), 20153069. http://doi.org/10.1098/rspb.2015.3069
Tacon, A. G. J., & Metian, M. (2008). Global overview on the use of fish meal and fish oil in
industrially compounded aquafeeds: Trends and future prospects. Aquaculture, 285(1-4), 146–158. doi:10.1016/j.aquaculture.2008.08.015
Tacon, A. G. J., Hasan, M. R., & Metian, M. (2011). Demand and supply of feed ingredients for
farmed fish and crustaceans. Rome: Food and Agriculture Organization of the United Nations.
Tello, a, Corner, R. a, & Telfer, T. C. (2010). How do land-based salmonid farms affect stream
ecology? Environmental Pollution (Barking, Essex : 1987), 158(5), 1147–58. doi:10.1016/j.envpol.2009.11.029
The Nature Conservancy (TNC) (2014). Upper Snake River Basin Water Stewardship Assessment.
Retrieved August 19, 2016, from http://www.nature.org/about-us/working-with-companies/companies-we-work-with/upper-snake-river-basin-water-stewardship-assessment.pdf
Troyer, R. M., & Kurath, G. (2003). Molecular epidemiology of infectious hematopoietic necrosis
virus reveals complex virus traffic and evolution within southern Idaho aquaculture. Diseases of Aquatic Organisms, 55(3), 175–185.
True, B., Johnson, W., & Chen, S. (2004). Reducing phosphorus discharge from flow-through
aquaculture I: facility and effluent characterization. Aquacultural Engineering, 32(1), 129–144. doi:10.1016/j.aquaeng.2004.08.001
Tucker, C. S., Hargreaves, J. A., & Boyd, C. E. (2008a). Aquaculture and the Environment in the
United States. In C. S. Tucker & J. A. Hargreaves (Eds.), Environmental Best Practices for Aquaculture (pp. 3–54). Ames, Iowa: Blackwell Publishing.
Tucker, C. S., Hargreaves, J. A., & Boyd, C. E. (2008b). Better Management Practices for
Freshwater Pond Aquaculture. In C. S. Tucker & J. A. Hargreaves (Eds.), Environmental Best Practices for Aquaculture (pp. 151–226). Ames, Iowa: Blackwell Publishing.
73
United States Department of Agriculture (USDA) (2016a). Trout Production (pp. 1–10). United States Department of Agriculture. Retrieved August 19, 2016, from http://usda.mannlib.cornell.edu/MannUsda/viewDocumentInfo.do?documentID=1172
United States Department of Agriculture (USDA) (2016b). Economic Research Service. Aquaculture Trade tables. Retrieved August 19, 2016, from http://www.ers.usda.gov/data-products/aquaculture-data.aspx
United States Environmental Protection Agency (USEPA) (2001). Ecological risk assessment for the Middle Snake River, Idaho. National Center for Environmental Asssessment, Washington, DC; EPA/600/R-01/017.
United States Environmental Protection Agency (USEPA) (2002a). Ecoregions of Idaho.
Retrieved August 19, 2016, from ftp://newftp.epa.gov/EPADataCommons/ORD/Ecoregions/id/id_eco_lg.pdf.
United States Environmental Protection Agency (USEPA) (2002b). Ecoregions of North Carolina.
Retrieved August 19, 2016, from ftp://newftp.epa.gov/EPADataCommons/ORD/Ecoregions/nc/nc_eco.pdf.
United States Environmental Protection Agency (USEPA) (2007). IDG-130000: Authorization to
Discharge under the National Pollutant Discharge Elimination System – Aquaculture Facilities in Idaho, subject to Wasteload Allocations under Selected Total Maximum Daily Loads. Retrieved August 19, 2016, from https://yosemite.epa.gov/r10/water.nsf/NPDES+Permits/General+NPDES+Permits/$FILE/IDG130000 FP.pdf.
United States Environmental Protection Agency (USEPA) (2016a): NPDES Permit Limits.
Retrieved August 19, 2016, from https://www.epa.gov/npdes/npdes-permit-limits United States Environmental Protection Agency (USEPA) (2016b): Water Quality Assessment
and TMDL Information. Retrieved August 19, 2016, from https://iaspub.epa.gov/waters10/attains_index.home
United States Environmental Protection Agency (USEPA) (2016c): Enforcement and Compliance
History Online. Retrieved August 19, 2016, from https://echo.epa.gov/ United States Environmental Protection Agency (USEPA) (2016d). Enforcement Basic
Information. Retrieved August 19, 2016, from https://www.epa.gov/enforcement/enforcement-basic-information.
United States Fish & Wildlife Service (USFWS) (2014). Form 3-200-13: What You Should Know
About a Federal Migratory Bird Depredation Permit. Retrieved August 19, 2016, from https://www.fws.gov/forms/3-200-13.pdf.
74
United States Fish & Wildlife Service (USFWS) (2016). National Wild Fish Health Survey Database.
Retrieved December 20, 2016, from
http://ecos.fws.gov/wildfishsurvey/database/nwfhs/basicform.
United States Food and Drug Administration (USFDA) (1984). “Finding of No Significant Impact
for Romet®-30 Medicated Premix for Salmonid Fish (Trout and Salmon).” Center for Veterinary Medicine. Retrieved on August 19, 2016, from http://www.fda.gov/AnimalVeterinary/DevelopmentApprovalProcess/Aquaculture/ucm132954.htm.
United States Food and Drug Administration (USFDA) (2007) “Finding of No Significant Impact
for Aquaflor® Type A Medicated Article for Control of Mortality in Freshwater-reared Salmonids Due to Coldwater Disease Associated with Flavobacterium psychrophilum.” Center for Veterinary Medicine. Retrieved on August 19, 2016, from http://www.fda.gov/AnimalVeterinary/DevelopmentApprovalProcess/Aquaculture/ucm132954.htm.
United States Food and Drug Administration (USFDA). (2016a). Regulatory Fish Encyclopedia.
Retrieved from http://www.fda.gov/Food/FoodScienceResearch/RFE/ucm089644.htm United States Food and Drug Administration (USFDA) (2016b). “Animal Health Literacy -
Aquaculture and Aquaculture Drugs Basics.” Center for Veterinary Medicine. Retrieved on August 19, 2016, from http://www.fda.gov/AnimalVeterinary/ResourcesforYou/AnimalHealthLiteracy/ucm213944.htm
United States Trout Farmers Association (USTFA) (2016). “USTFA Policies.” United States Trout
Farmers Association. Retrieved on August 19, 2016, from http://ustfa.org/ustfa-policies/ Veterinary Feed Directive (VFD), 80 Fed. Reg. 106 (June 03, 2015) (to be codified at 21 CFR 514 and 558).
Viadero, R. C., Cunningham, J. H., Semmens, K. J., & Tierney, A. E. (2005). Effluent and
production impacts of flow-through aquaculture operations in West Virginia. Aquacultural Engineering, 33(4), 258–270. doi:10.1016/j.aquaeng.2005.02.004
Washington Department of Fish and Wildlife (WDFW) (2016). Statewide Hatchery Trout &
Kokanee Stocking Plan for Washington’s Lakes and Streams. Retrieved August 19, 2016, from http://wdfw.wa.gov/fishing/plants/statewide/.
Welch, T. J., & Good, C. M. (2013). Mortality associated with Weissellosis (Weissella sp.) in USA
farmed rainbow trout: Potential for control by vaccination. Aquaculture, 388–391, 122–127. http://doi.org/10.1016/j.aquaculture.2013.01.021
75
Westers, H (2000). Best Management Practices for the Trout Industry. Proceedings of the
Aquacultural Waste Management Symposium, Roanoke, VA. World Health Organisation (WHO) (2011). Critically Important Antimicrobials for Human
Medicine (p. 32). Geneva, Switzerland. World Organisation for Animal Health (OIE) (2016). Section 2.3 Diseases of Fish. Manual of
Diagnostic Tests for Aquatic Animals. 6th Edition, 2009. World Wildlife Fund (WWF) (2016). Appalachian-Blue Ridge Forests. Retrieved August 19, 2016,
from http://www.worldwildlife.org/ecoregions/na0403. Živić, I., Marković, Z., Filipović-Rojka, Z. and Živić, M. (2009), Influence of a Trout Farm on Water
Quality and Macrozoobenthos Communities of the Receiving Stream (Trešnjica River, Serbia). International Review of Hydrobiology, 94: 673–687. doi:10.1002/iroh.200811137
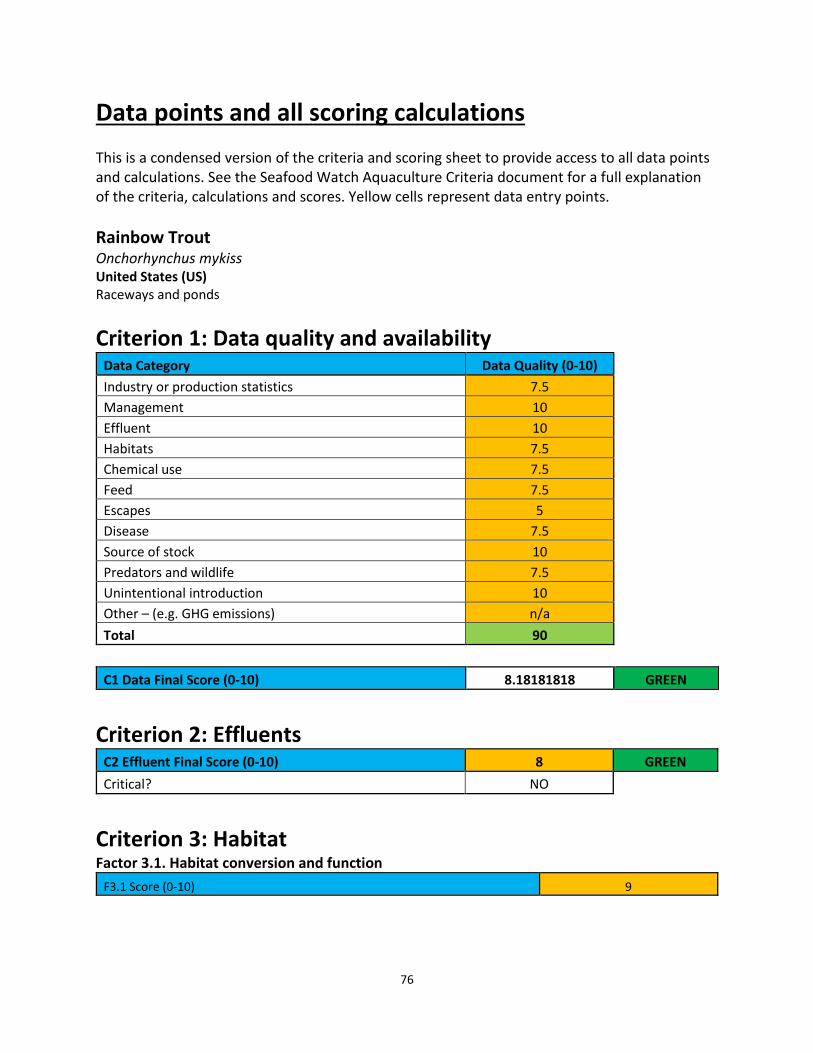
76
Data points and all scoring calculations This is a condensed version of the criteria and scoring sheet to provide access to all data points and calculations. See the Seafood Watch Aquaculture Criteria document for a full explanation of the criteria, calculations and scores. Yellow cells represent data entry points.
Rainbow Trout Onchorhynchus mykiss United States (US) Raceways and ponds
Criterion 1: Data quality and availability Data Category Data Quality (0-10)
Industry or production statistics 7.5
Management 10
Effluent 10
Habitats 7.5
Chemical use 7.5
Feed 7.5
Escapes 5
Disease 7.5
Source of stock 10
Predators and wildlife 7.5
Unintentional introduction 10
Other – (e.g. GHG emissions) n/a
Total 90
C1 Data Final Score (0-10) 8.18181818 GREEN
Criterion 2: Effluents
C2 Effluent Final Score (0-10) 8 GREEN
Critical? NO
Criterion 3: Habitat Factor 3.1. Habitat conversion and function
F3.1 Score (0-10) 9
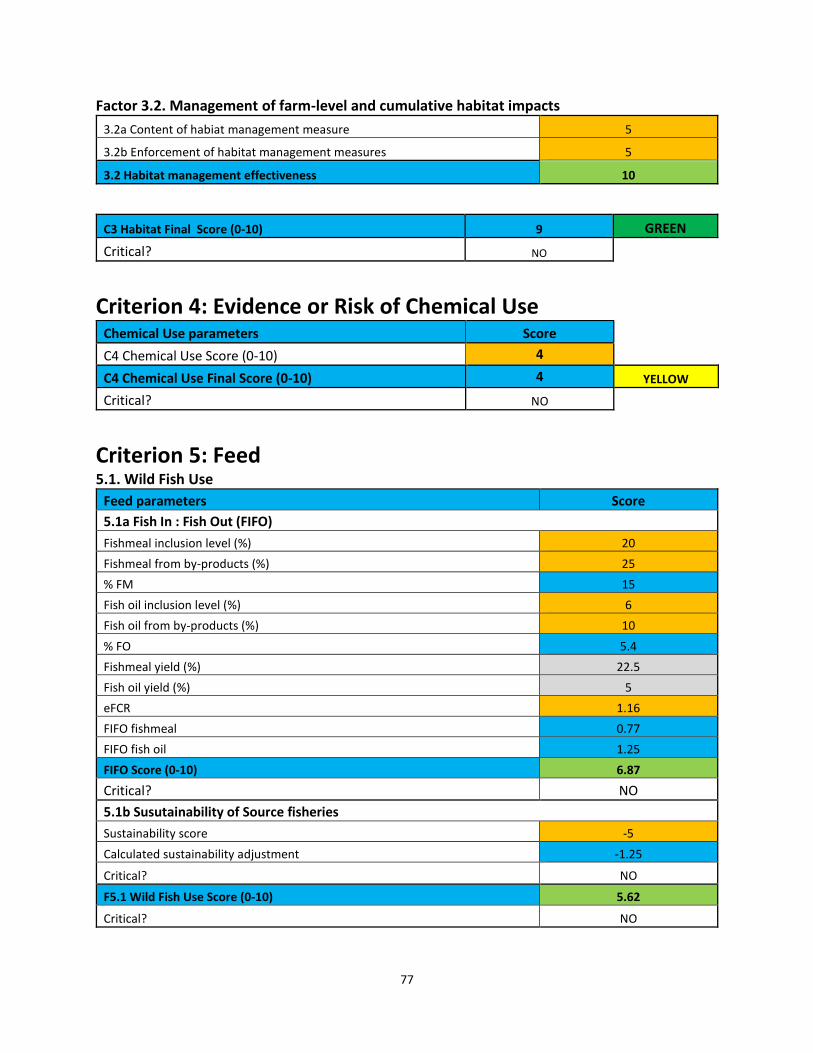
77
Factor 3.2. Management of farm-level and cumulative habitat impacts
3.2a Content of habiat management measure 5
3.2b Enforcement of habitat management measures 5
3.2 Habitat management effectiveness 10
C3 Habitat Final Score (0-10) 9 GREEN
Critical? NO
Criterion 4: Evidence or Risk of Chemical Use
Chemical Use parameters Score
C4 Chemical Use Score (0-10) 4
C4 Chemical Use Final Score (0-10) 4 YELLOW
Critical? NO
Criterion 5: Feed 5.1. Wild Fish Use
Feed parameters Score
5.1a Fish In : Fish Out (FIFO)
Fishmeal inclusion level (%) 20
Fishmeal from by-products (%) 25
% FM 15
Fish oil inclusion level (%) 6
Fish oil from by-products (%) 10
% FO 5.4
Fishmeal yield (%) 22.5
Fish oil yield (%) 5
eFCR 1.16
FIFO fishmeal 0.77
FIFO fish oil 1.25
FIFO Score (0-10) 6.87
Critical? NO
5.1b Susutainability of Source fisheries
Sustainability score -5
Calculated sustainability adjustment -1.25
Critical? NO
F5.1 Wild Fish Use Score (0-10) 5.62
Critical? NO
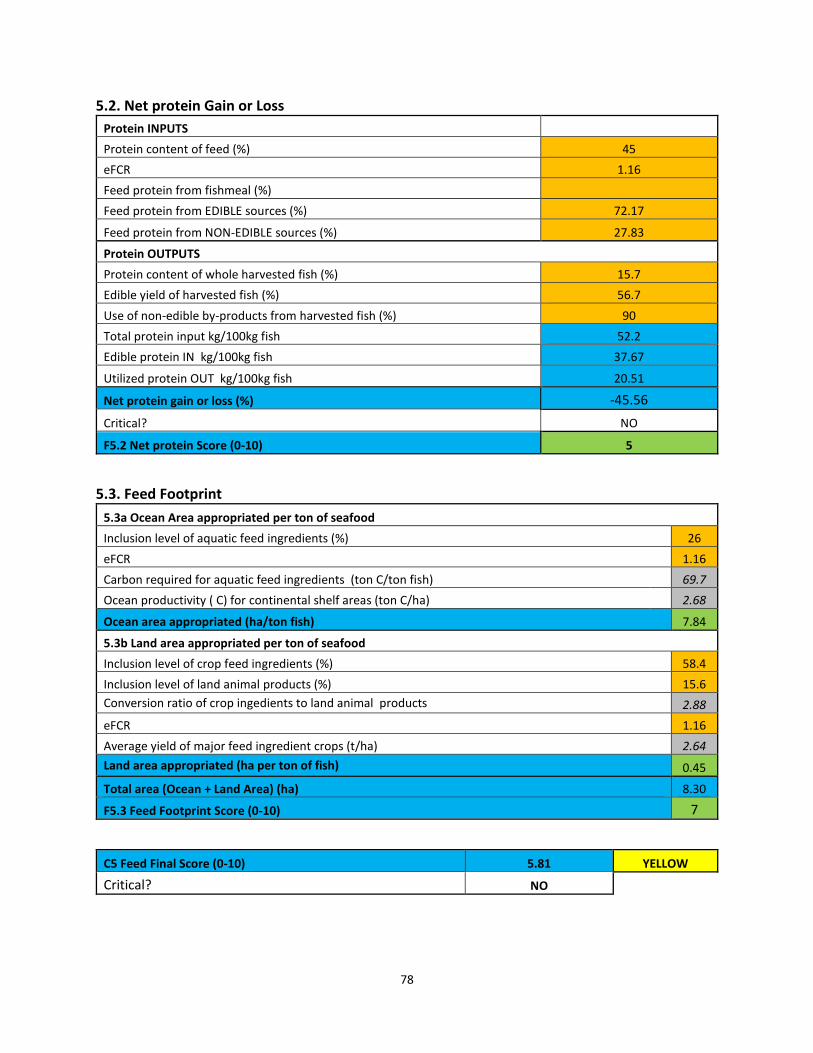
78
5.2. Net protein Gain or Loss
Protein INPUTS
Protein content of feed (%) 45
eFCR 1.16
Feed protein from fishmeal (%)
Feed protein from EDIBLE sources (%) 72.17
Feed protein from NON-EDIBLE sources (%) 27.83
Protein OUTPUTS
Protein content of whole harvested fish (%) 15.7
Edible yield of harvested fish (%) 56.7
Use of non-edible by-products from harvested fish (%) 90
Total protein input kg/100kg fish 52.2
Edible protein IN kg/100kg fish 37.67
Utilized protein OUT kg/100kg fish 20.51
Net protein gain or loss (%) -45.56
Critical? NO
F5.2 Net protein Score (0-10) 5
5.3. Feed Footprint
5.3a Ocean Area appropriated per ton of seafood
Inclusion level of aquatic feed ingredients (%) 26
eFCR 1.16
Carbon required for aquatic feed ingredients (ton C/ton fish) 69.7
Ocean productivity ( C) for continental shelf areas (ton C/ha) 2.68
Ocean area appropriated (ha/ton fish) 7.84
5.3b Land area appropriated per ton of seafood
Inclusion level of crop feed ingredients (%) 58.4
Inclusion level of land animal products (%) 15.6
Conversion ratio of crop ingedients to land animal products 2.88
eFCR 1.16
Average yield of major feed ingredient crops (t/ha) 2.64
Land area appropriated (ha per ton of fish) 0.45
Total area (Ocean + Land Area) (ha) 8.30
F5.3 Feed Footprint Score (0-10) 7
C5 Feed Final Score (0-10) 5.81 YELLOW
Critical? NO

79
Criterion 6: Escapes 6.1a System escape Risk (0-10) 6
6.1a Adjustment for recpatures (0-10) 0
6.1a Escape Risk Score (0-10) 6
6.2. CGI score (0-10) 9
C6 Escapes Final Score (0-10) 7 GREEN
Critical? NO
Criterion 7: Diseases
Disease Evidence-based assessment (0-10) 7
Disease Risk-based assessment (0-10)
C7 Disease Final Score (0-10) 7 GREEN
Critical? NO
Criterion 8X: Source of Stock
C8X Source of stock score (0-10) 0
C8 Source of stock Final Score (0-10) 0 GREEN
Critical? NO
Criterion 9X: Wildlife and predator mortalities
C9X Wildlife and Predator Score (0-10) -2
C9X Wildlife and Predator Final Score (0-10) -2 GREEN
Critical? NO
Criterion 10X: Escape of unintentionally introduced species
F10Xa live animal shipments score (0-10) 9.00
F10Xb Biosecurity of source/destination score (0-10) 7.00
C10X Escape of unintentionally introduced species Final Score (0-10) -0.30 GREEN
Critical? n/a