Embed Size (px)
Citation preview
Railway operation analysis
Evaluation of quality, infrastructure and timetable on single and double-track lines
with analytical models and simulation
Olov Lindfeldt
Doctoral thesis Division of Traffic and Logistics
Department of Transport and Economics
Stockholm 2010
Akademisk avhandling som med tillstånd av Kungliga Tekniska Högskolan framlägges till offentlig granskning för avläggande av Teknologie Doktorsexamen, fredagen den 28:e maj 2010 kl. 10:00 i sal E1, Lindstedtsvägen 3, Stockholm.
© 2010 Olov Lindfeldt All rights reserved
Printed in Sweden Universitetsservice US-AB Stockholm
TRITA-TEC-PHD 10-001 ISSN 1653-4468 ISBN 13: 978-91-85539-50-5 Cover picture: Mean crossing time (blue) and standard deviation (red) as a function of the location of timetable crossing point for different lengths of partial double-track: 0.75 km (uppermost) and 22.75 km (lowermost); step length: 2 km.
Abstract Railway networks are complex technical systems. Investments in railway infra-structure are expensive and already constructed railway infrastructure is not easily adjusted or changed. Dimensioning and constructing railway lines and networks therefore require extensive knowledge of future operation and demand. However, experience shows that the traffic often develops differently than expected. This means that railway infrastructure has to be designed for flexibility, i.e. for different operational conditions. To achieve such flexibility, a deep knowledge of infra-structure, timetable and perturbation properties, as well as inter-correlations between these, is essential.
This thesis shows the advantages of simple models for analysis of railway operation. It presents two tools for infrastructure and timetable planning. It shows how the infrastructure can be analysed through fictive line designs, how the timetable can be treated as a variable and how delays can be used as performance measures. The thesis also gives examples of analyses of complex traffic situations through simulation experiments. All together, these contributions help to enhance future railway operation and thus increase the competitiveness of the railway even more.
Infrastructure configuration, timetable design and delays play important roles in the competitiveness of railway transportation. This is especially true on single-track lines where the run times and other timetable related parameters are severely restricted by crossings (train meetings). The crossings also make the lines’ operation more sensitive to disturbances. Double-tracks with mixed traffic also show these features. In this case overtakings, where faster trains pass slower ones, imply restrictions on the timetable, cause delay propagation etc.
The crossings are the core feature of single-track operation. The first half of this thesis focuses on the crossing time, i.e. the time loss that occurs in crossing situations. A simplified analytical model, SAMFOST, has been developed to calculate the crossing time as a function of infrastructure configuration, vehicle properties, timetable and delays for two crossing trains. The effect of possible surrounding trains is not taken into account and all kinds of congestion effects are thus excluded from evaluation. SAMFOST has been successfully validated against the simulation tool RailSys, which shows that the model is accurate in non-congested situations.
The thesis proposes three simple measures of timetable flexibility, all based on assigned crossing time requirements. Together, these measures can be used to evaluate how infrastructure configuration, vehicle properties, punctuality etc affect possibilities to alter the timetable.
As an example of its application, SAMFOST has been used to evaluate the effect of shorter inter-station distance, partial double-track and combined crossing and passenger stop. These measures affect the operational properties quite differently. More crossing stations result in a minor decrease in travel time (lower mean crossing time) but significantly higher reliability (lower crossing time variance). These effects are independent of punctuality, which is a valuable property. A partial double-track
results in shorter travel times and in some cases also higher reliability. Both effects are strongly dependent on punctuality and high punctuality is needed to achieve a high effect.
A combined crossing and passenger stop results in a situation similar to that of a partial double-track. In this case it is important to point out that the assignment of time supplements in the timetable should be directly correlated to punctuality in order to achieve good operation.
Double-track lines operated with mixed traffic show properties similar to those of single-tracks. In this case overtakings imply scheduled delays as well as risk of delay propagation. Two different methods are applied for analysis of double-tracks: a combinatorial, mathematical model (TVEM) and simulation experiments.
TVEM, Timetable Variant Evaluation Model, is a generic model that systematically generates and evaluates timetable variants on double-track lines. This method is especially useful for mixed traffic operation where the impact of the timetable is considerable. TVEM may also be used for evaluation of different infrastructure designs. Analyses performed in TVEM show that the impact on capacity from the infrastructure increases with speed differences and frequency of service for the passenger trains, whereas the impact of the timetable is strongest when the speed differences are low and/or the frequency of passenger services is low.
Simulation experiments were performed to take delays and perturbations into account. A simulation model was set up in the micro simulation tool RailSys and calibrated against real operational data. The calibration work clearly shows the importance of run time extensions, i.e. primary delays assigned to the trains within the simulated area, time supplement accessibility (catch-up effects) and dispatching principles.
The calibrated model was used for multi-factor analysis through experiments where infrastructure, timetable and perturbation factors were varied according to an experimental design and evaluated through response surface methods. The additional delay was used as response variable. Timetable factors, such as frequency of high-speed services and freight train speed, turned out to be of great importance for the additional delay, whereas some of the perturbation factors, i.e. entry delays, only showed a minor impact. The infrastructure factor, distance between overtaking stations, showed complex relationships with several interactions, principally with timetable factors.
Preface This doctoral thesis is based on research performed between 2004 and 2009 at the Division of Traffic and Logistics at the Royal Institute of Technology (KTH) in Stockholm.
The thesis consists of two parts: an introductory essay and six papers that form the basis of the thesis:
I. Lindfeldt, O. (2006) “Influences of station length and inter-station distance on delays and delay propagation on single-track lines with regional rail traffic”. In: Allan, J., Brebbia, C.A., Rumsey, A.F., Sciutto, G., Sone, S., Goodman, C.J. (eds.), Computers in Railways X, pp. 511-520, WIT Press, Southampton.
II. Lindfeldt, O. (2007) “SAMFOST – a timetable-free way of analysing single-track railway lines”. In: Hansen, I.A., Radtke, A., Pachl, J.P., Wendler E. (eds.), Proceedings of 2nd International Seminar on Railway Operations Modelling and Analysis, Hannover, Germany.
III. Lindfeldt, O. (2007) “Crossing times on single-track railway lines – dependencies of different infrastructure and traffic factors”. In: Ford, M.C. (ed.), Proceedings of Railway Engineering 9th International Conference and Exhibition, London, Great Britain.
IV. Lindfeldt, O. (2009) “Analysis of capacity on double-track railway lines”. To appear in Transport Planning and Technology.
V. Lindfeldt, O., Sipilä, H. (2009) “Validation of a simulation model for mixed traffic on a Swedish double-track railway line”. In: Ford, M.C. (ed.), Proceedings of Railway Engineering 10th International Conference and Exhibition, London, Great Britain.
VI. Lindfeldt, O. (2010) “Impacts of infrastructure, timetable and perturbations in operation of double-track railway lines with mixed traffic”. Accepted for presentation at 12th World Conference on Transportation Research 2010, Lisbon, Portugal.
Related publications not included in this thesis:
• Lindfeldt, O. (2004) “Train traffic in greater Stockholm. The demand for a new twin track railway through Stockholm”. In: Ford M.C. (ed.), Proceedings of Railway Engineering 7th International Conference and Exhibition, London.
• Lindfeldt, O. (2008) “Evaluation of punctuality on a heavily utilised railway line with mixed traffic”, In: Allan, J., Arias, E., Brebbia, C.A., Goodman, C.J., Rumsey, A.F., Sciutto, G., Tomii, N., (eds.), Computers in Railways XI, pp. 545-553, WIT Press, Southampton.
• Lindfeldt, O., Lundberg A-I. (2010) “Dimensioning of a railway station for unknown operation”, To appear in: Ning, B., Brebbia, C. A., Roberts, C., Rumsey, A.F., Sciutto, G., Tomii, N. (eds.), Computers in Railways XII, WIT Press, Southampton.
Related publications in Swedish:
• Fröidh, O., Lindfeldt, O., Nelldal, B-L. (2005) “Framtida marknad, tågtrafik och kapacitet inom Stockholm Central”, KTH, Stockholm.
• Lindfeldt, O. (2006) “Ytspårsutredningen Citybanan i Stockholm. Påverkan på Stockholms centralstation och omgivande spårområde - Kapacitet och trafikering”, Banverket, Stockholm.
• Lindfeldt, O. (2007) “Effekter av partiella dubbelspår och fler mötesstationer på enkelspår”, KTH, Stockholm. Research report.
• Lindfeldt, O. (2008) “Kapacitet för godståg på Västra och Södra stambanan”, KTH, Stockholm.
• Lindfeldt, O. (2008) “Dalabanan Uppsala–Mora, Trafiksystems- och kapacitetsanalys”, Banverket, Stockholm.
• Fröidh, O., Lindfeldt O. (2008) “Svealandsbanans första 10 år – erfarenheter för framtiden av tågtrafiken och resandet”, KTH, Stockholm.
• Nelldal B-L., Lindfeldt, O., Sipilä, H., Wofmaier, J. (2008) “Förbättrad punktlighet på X2000 – analys med hjälp av simulering”, KTH, Stockholm.
• Lindfeldt, O. (2009) “Kapacitet för godståg på Västra och Södra stambanan efter uppgradering till sth 250 km/h”, KTH, Stockholm.
• Nelldal, B-L., Lindfeldt O., Troche G. (2009) “Godstrafikens utvecklings-möjligheter som följd av en satsning på Europakorridoren”, KTH, Stockholm.


Contents
1 Introduction ......................................................................................1
1.1 BACKGROUND................................................................................................................................. 1
1.2 OBJECTIVES ...................................................................................................................................... 2
1.3 DELIMITATIONS ............................................................................................................................. 3
2 Related research .............................................................................. 5
2.1 ANALYTICAL METHODS.............................................................................................................. 5
2.2 COMBINATORIAL METHODS..................................................................................................... 9
2.3 SIMULATION AND DESIGN OF SIMULATION EXPERIMENTS...................................... 9
2.4 CONCLUDING REMARKS........................................................................................................... 11
3 Methodology...................................................................................13 3.1 SINGLE-TRACK OPERATION ................................................................................................... 14
3.2 DOUBLE-TRACK OPERATION................................................................................................. 15
4 Results.............................................................................................19 4.1 PAPER I ............................................................................................................................................. 19
4.2 PAPER II ........................................................................................................................................... 21
4.3 PAPER III ......................................................................................................................................... 23
4.4 PAPER IV ......................................................................................................................................... 25
4.5 PAPER V ........................................................................................................................................... 27
4.6 PAPER VI ......................................................................................................................................... 30
5 Contributions of the thesis .............................................................33 5.1 SIMPLE MODELS............................................................................................................................ 33
5.2 INFRASTRUCTURE AS A VARIABLE ....................................................................................... 33
5.3 TIMETABLE AS A VARIABLE .................................................................................................... 34
5.4 DELAYS AND PERTURBATIONS ............................................................................................. 35
5.5 SIMULATION EXPERIMENTS ................................................................................................... 35
5.6 TOOLS FOR INFRASTRUCTURE AND TIMETABLE PLANNING .................................. 36
6 Final remarks and future work .......................................................43 7 References.......................................................................................47 Acknowledgements................................................................................51

1
1 Introduction Railway operation is a wide research area. Some important fields are capacity analysis, scheduling, rescheduling, timetable stability analysis, traffic control, simulation and energy consumption. This thesis focuses on capacity and quality. Quality is here defined as deviation from the scheduled timetable, i.e. delays.
1.1 Background
Transportation is a large and important part of the economy and the need for transportation is increasing continuously. Road traffic is today the major form of transportation. However, a combination of investments in railway infrastructure, new, fast and comfortable rail vehicles, increased frequency of service, deregulation of rail freight traffic, and low track charges has led to an extensive expansion of rail traffic.
Administration of the Swedish railway infrastructure was organisationally separated from traffic operation in 1988 and since then demand for passenger and freight transport has been steadily increasing. The introduction of high-speed trains, X2000, on existing lines has also contributed to increased traffic and the deregulation of rail freight traffic, combined with low track charges, has led to a great expansion also in freight traffic. Regional rail traffic has also developed in several areas in Sweden, e.g. in Mälardalen, the Öresund region and Bergslagen, see Fröidh [8] for an example.
Overall, the increase in traffic and the higher speed differences have resulted in capacity shortages and low punctuality on several lines. The situation calls for more investments, but also for more accurate capacity analyses. Banverket (The National Railway Administration) needs better methods for this type of analysis.
Along with increasing environmental awareness and a political desire to reduce emissions, the railway has a good opportunity to increase its market share and contribute to a sustainable society. Such an increase is strongly dependent on competitiveness and so rail services need to be fast, frequent, comfortable, reliable and not too expensive.
These competitive factors, in turn, are dependent on technical properties in the railway system:
• Infrastructure design and operational reliability.
• Vehicle design and operational reliability.
• Timetable.
In order to achieve fast, frequent and reliable services which are worth their price it is necessary to understand the relationships between infrastructure, vehicles, timetable and disturbances (lack of reliability). This thesis deals with some of these relationships on single and double-track lines respectively.
2
Regarding speed, frequency and reliability of services, single-track lines exhibit special properties, most of them tightly connected to crossings. On single-track lines, with only ordinary crossing stations, each crossing implies longer running times. The crossings also imply reduced reliability since delays propagate between crossing trains. The limited crossing possibilities also constrain capacity and thereby also the frequency of services on single-track lines.
Double-track lines being operated with mixed traffic, i.e. both fast and slow trains, have properties similar to single-tracks. In this case the crossings are replaced by overtakings, where the faster trains pass the slower ones. These overtakings imply longer running times (scheduled delays) for the slower trains and decreased reliability through delay propagation.
During the last decades major investments have been made in the Swedish railway transportation system in order to increase its competitiveness. Several new and upgraded line sections have been brought into operation. Most of these investments have been based on detailed assumptions about future timetables and operation. However, the timetables change almost every year due to altered operation principles, vehicle utilisation etc. This means that timetable specific infrastructure investments often fail to fulfil their entire purpose. To avoid this kind of failures infrastructure adjustments have to be evaluated with regard to several timetable designs and principles of operation.
1.2 Objectives
This thesis has several objectives. The overall objective is to clarify the operational properties of single- and double-track railway lines, i.e. how the traffic is affected by infrastructure configuration, timetable and disturbances. This includes examination of some important factors in infrastructure, timetable and vehicles as well as punctuality and how these factors interact.
A methodological objective is to develop simplified, mathematical traffic models and show examples of how such models can be used. This requires assumptions to be made about traffic density, delays, dispatching rules, signalling systems, train movements, etc. Given these assumptions, the models help to give important insights about system properties at a basic level. An important part of the work is to show under which conditions the models are accurate.
A complementary methodological objective is to show how simulation experiments can be used for railway operation analysis. Simulation is a powerful method for operation analysis and enables modelling of several core features in the railway system. A separate calibration study will be performed with the simulation tool RailSys and experimental design will be applied to make use of the calibrated model for analysis of mixed traffic on double-track lines.
Other important objectives are modelling of infrastructure and timetables. Therefore, unlike in many other studies, both the infrastructure and the timetable have to be treated as variables. A further objective is to show how the infrastructure can be treated practically as a variable by fictive model lines that do not exist in reality. Using mathematical models or simulation experiments, such fictive infrastructure
3
configurations, as well as existing configurations with unique properties, may be analysed. A comparison between idealised and “real” cases is also an aim, since such analyses greatly increases understanding of the operational properties.
A more specific objective is a further examination of three infrastructure measures that can be used to decrease the negative effects of crossings on single-track lines. The work aims to show how time for crossing, and its variance, is affected by partial double-track, shorter inter-station distance and crossing combined with passenger stop.
The timetable is essential for railway operation. This work endeavours to show how the timetable affects capacity, run times and sensitivity to disturbances. The three evaluated infrastructure measures on single-track affect the conditions for alternative timetables. In order to take this into account timetable flexibility also has to be studied.
The timetable is also crucial for double-track lines that are operated with mixed traffic. This thesis explicitly shows how different mixes of speed and frequencies affect capacity and delays. Two methods are developed for these evaluations: a combinatorial, mathematical model for infrastructure and timetable analysis, and simulation experiments for infrastructure, timetable and delay analysis.
Delay handling is an important part of railway operation. Both single-track and double-track lines with mixed traffic show great disturbance sensitivity with high risk of delay propagation. A special objective is therefore to emphasise this fact and show how delays can be used as performance measures.
1.3 Delimitations
Two kinds of railway system are analysed in this thesis: single and double-track lines. Different delimitations are applied for these, see below. Commonly used delimitations may be summarised as:
• Only extended single and double-track railway lines are considered. Nodes and all types of network and network effects are excluded. The analysed lines are assumed to be long (> 120 km) and without connections to other lines.
• All fictive model lines are designed to obtain results that are easy to understand. Therefore, one standard station design is used and no gradients are modelled.
• One type of signalling system is used throughout the study: ERTMS, level 2, see Wendler [48]. Continuous updating of driving permissions makes the trains behave in a predictable and deterministic way. This delimitation eliminates the need to model ATC track antennas and their locations.
4
1.3.1 Single-track (papers I-III) Only analytical methods are applied for the single-track analyses. In the methods, several assumptions and simplifications are made. Only situations without congestion effects are treated. This means that capacity utilisation is considered to be moderate and so two following trains are always assumed to be more than approximately two inter-station distances apart. This, in turn, implies an important independence of other trains in each crossing situation.
The modelled timetables contain no running time supplements and hence no recovery from delays is possible within the model. The need for supplements is rather a result of the analysis, since they are necessary for recovery from the delay propagation that occurs in crossing situations. This delimitation is natural since the objective is to model crossings with disturbances.
Varying run times are not modelled. All trains behave according to deterministic vehicle data and follow the same assumptions regarding acceleration courses, use of maximum speed and deceleration courses. Series of crossings are not modelled. Such analyses need modelling of, or more detailed assumptions about, time supplements between the crossings.
The application scenarios are restricted to passenger traffic. Two vehicle types are used: X50, a regional train with high acceleration and X2, a long-distance train with lower acceleration. Both traffic directions have been operated with the same vehicle type and mixed crossings are not analysed.
1.3.2 Double-track (papers IV-VI) Two complementary methods are applied for evaluation of double-tracks; a combinatorial, mathematical model and simulation experiments. The delimitations of these methods are further described in each paper and only some common delimitations are taken up here.
None of the double-track analyses consider opposing traffic to any great extent. The infrastructure is mostly assumed to allow completely independent operation of up-bound and down-bound traffic.
The use of simulation models makes it possible to evaluate congested situations, which are resolved by dispatching algorithms within the applied simulation model. The same holds for varying run times that are efficiently modelled through assignment of random run time extensions during the simulations. The simulation model also handles running time supplements and the utilisation of these, i.e. catch-up effects.
The application scenarios concern mixed traffic and so both passenger and freight services are considered. Swedish circumstances are used as reference for the applications, see Nelldal et al [33] and Lindfeldt [26]. This applies for infrastructure as well as timetable principles, vehicle characteristics, delay levels, etc. One important exception is that only one type of freight train, i.e. acceleration and braking properties, is used to model all kinds of freight trains. In real operations, there is considerable variance among freight trains.
5
2 Related research Most modern research into railway operation concerns double-track systems or entire networks of double-track lines and stations that connect them. The approaches can be divided into analytical, combinatorial and simulation methods.
2.1 Analytical methods
Several types of analytical method are used in railway operation research and several types of models are presented in the literature. Some analytical models explicitly address operation of single-track, whereas other address the issues of capacity, knock-on delays (delay propagation) and rescheduling on isolated lines or entire networks.
2.1.1 Single-track lines Research on single-track systems generally focuses on either infrastructure or timetable. This is a simplification since infrastructure and timetable are closely interconnected. Analyses concerning just one of them therefore imply considerable assumptions as regards the other.
Petersen [35] presents a method to find the best locations of crossing stations for a given timetable and line alignment. The method focuses on frequent small delays that can be managed by longer crossing stations (i.e. partial double-tracks) and time supplements. Longer delays are handled by secondary crossing stations. The study concludes that single-tracks work quite well, as long as infrastructure and timetable are coherent and delays limited.
Higgins et al [15] describe a decomposition procedure that for a given cyclic timetable (day or week) for high-speed trains finds the numbers and positions of crossing stations that minimise both the risk of delays and the delays caused by train conflicts. The timetable is specified only by information about earliest possible departure times. The output from the model is both an optimal infrastructure and an optimal timetable. This combination gives a useful technical solution to the single-track problem.
There are several examples of studies where the infrastructure design is fixed and the timetable is somehow constructed according to infrastructure constraints (and market demand). An early example of this is the mathematical treatment of two-way traffic on a single-track presented by Frank [7]. Using simplified models for train movements he calculates the capacity of a single-track line both for one-way traffic and for certain (fleet) systems of two-way traffic. The results are most applicable on freight or military transport systems but may also serve as a starting point for further studies.
Petersen [34] presents a simple model that can be used to describe the scheduled delay as a function of the traffic intensity. The main timetable assumption, that makes the study general, is that trains’ departure times are independent random variables that are uniformly distributed over the defined time period. Given this randomised timetable, the time costs (delays) for crossings and overtakings are
6
calculated. One conflict at a time is identified and resolved and so the trains are treated pair-wise.
Higgins et al [14] present a model for scheduling of single-track lines. Their model can be used as a decision support tool in dispatching situations as well as a planning tool to evaluate the impact of timetable changes. It is also possible to use the model to evaluate infrastructure changes. The model minimises scheduled (end) delays and operational costs.
Brännlund et al [2] present a similar optimisation approach for scheduling of single-track lines. They model a profit function as sum of the profits of the trains in the schedule and use Lagrangian relaxation to obtain optimality. So far only scheduled delays are taken into account, but a possible development could include also operational delays.
Medanic and Dorfman [30] also address the problem of scheduling trains on single-track lines. Their idea is to use a local, state-dependent, travel-advance strategy instead of non-linear programming. The advance of a train only depends on the position and speed of trains in its vicinity. This strategy results in suboptimal, but time-efficient schedules and has some similarities to the single-track model, SAMFOST, presented in this thesis.
Chen and Harker [5] present a sophisticated model for estimation of mean delays and delay variance for trains that operate on a single-track. In this model, the inter-station distances are assumed to be even and the actual departure time of each train is randomised around a specified timetable time. The conflict resolution is handled through calculation of probabilities of conflict between every pair of trains. The study shows that shorter inter-station distances lead to lower mean delays and delay variances. The number of trains also influences the delays significantly.
Higgins and Kozan [13] address the overall timetable reliability in terms of schedule adherence. They present a model that can be used to prioritise investments designed to improve timetable reliability. Using their model it is possible to compare effects of track, station and rolling stock projects. The study is interesting since it focuses on the entire railway system and not only on one single part.
The literature shows alternative approaches to handle and model the timetable on single-tracks. In some cases a timetable structure is given while in others trains are assigned randomly. A third approach concerns scheduling as an optimisation problem. The single-track model presented in papers I, II and III in this thesis endeavours to show the effect of different timetables, i.e. scheduled delays and knock-on delays, and infrastructure designs in a transparent way. This approach is useful since the timetable on most Swedish railways lines is changed and adjusted every now and then.
2.1.2 Double-track lines and networks Queuing theory and other types of statistical methods, where delay distributions are combined, are used to model interactions between delayed trains analytically. This type of model was first introduced for railway capacity analysis by Schwanhäusser [41]. He makes a general analysis of buffer times based on queuing theory and includes a number of factors such as initial delays, supplements, mix of priority
7
classes, punctuality, headways and overtaking possibilities. The buffer times are either constant or exponentially distributed.
Wendler [47] provides a general introduction to capacity analysis based on queuing theory. He considers both scheduled delays and knock-on delays and emphasises the usefulness of queuing theory for long and medium term studies, where the requested train paths are not known in detail.
Huisman et al [18] use queuing theory to analyse the dependencies and interactions between the individual components in a railway system. Operation is here defined by frequencies of service and no specific timetable is defined. Stations, junctions and line sections are modelled according to their special properties. The model seems to be a good alternative to simulation and the result is, in some sense, mean values of all possible timetables that can be constructed from the frequencies given as input data. In the model, both occupation times and minimal headway times are assumed to follow negative exponential distributions.
Huisman and Boucherie [17] provide a model to forecast knock-on delays due to differences in speed of trains on double-track line sections. These speed differences may be caused by different train services, or by primary delays. Train arrivals are modelled as a stochastic process, requiring train frequencies of each service only. Running time distributions for each train service is then obtained solving a system of linear differential equations. The model seems to be useful for analysis of isolated track sections between overtaking stations and the approach is well suited for long-term planning where no detailed timetable data is available.
Vromans et al [45] introduce two heuristic measures that can be used to evaluate the homogeneity of a timetable. Through simulation experiments they show that traffic reliability increases considerably with homogeneity, due to reduced delay propagation. Carey [3] takes up different measures of reliability. He discusses the advantages and disadvantages of measures based on probabilities (i.e. observed delays) and measures not using probabilities. Almost all measures for prediction of reliability involve headways (time space between two consecutive trains) since longer headways generally reduce knock-on delays. It is clear that there are several advantages to using simple measures that are not based on probabilities, although mathematical methods for more exact calculations are available.
Goverde [10] uses max-plus algebra to analyse the Dutch railway network. This type of heterogeneous traffic that is operated according to an integrated periodic timetable, with high degree of synchronisation, is feasible for linear algebra methods. Several kinds of train interdependencies resulting from the timetable, logistics and infrastructure are taken into account. Goverde analyses stability as well as delay propagation through higher-order max-plus linear systems.
The timetable is also crucial for analysis of double-track lines. Some literature proposes randomised timetables through exponential, distributed buffer times, whereas other analyses propose the use of existing timetables. The contribution of this thesis is a combinatorial approach for analysis of periodic timetables, paper IV. The systematic evaluation of different timetables gives insights in the effect of infrastructure and timetable factors on capacity, scheduled delays etc.
8
2.1.3 Stations and junctions Several studies of routing through existing stations have been performed and alternative methods are proposed in the literature. Hansen [11] gives a clear introduction to the complexity of train routing through stations. He compares analytical approaches based on queuing theory and max-plus algebra respectively. He concludes that these methods give similar results regarding the location of bottlenecks and the occupation of route sections. However, significant differences in the amount of buffer time and the ability of the track network to compensate for delays call for further development of both methods.
Kroon et al [21] and Zwaneveld et al [50] face the computational complexity of the problem of routing trains through railway stations. They show that when the design of a railway station is fixed the amount of computational time is polynomial in the number of trains.
Carey and Carville [4] consider the problem of routing of trains through large, busy stations. They use scheduling heuristics similar to those adopted by train planners using manual methods. Hereby they include rules, costs and preferences used by the expert planners.
Rodriguez [37] presents a constraint programming model for routing and scheduling of trains running through a junction. His model can be integrated into a decision support system for operators who make decisions to change train routes or orders to avoid conflicts and delays. In order to achieve both accuracy and performance, i.e. short computation times, Rodriguez combines simulation and constraint programming.
Yuan and Hansen [49] develop a stochastic model for estimation of delay propagation at stations. Several factors are modelled stochastically and different operational situations are handled through calculations of conditional probabilities. The model can be used to determine the maximal frequency of trains given an accepted level of knock-on delays.
Stations and junctions play important roles in railway operation. At these, the interaction between trains reaches its maximum through commonly used track sections and platform tracks, passenger and crew connections etc. The reviewed literature gives some ideas of methods that are also applicable to the line analysis in focus in this thesis.
2.1.4 Rescheduling and dispatching While the research on knock-on delays concerns small delays that occur with high frequency, the focus in rescheduling is on large delays and disturbances. In a rescheduling problem the aim is to restore the traffic to the timetable in such a way that knock-on delays are minimised. The infrastructure is then a given constant as is the planned timetable. The literature on rescheduling is extensive and only a few examples are mentioned here.
Törnquist [43] and Törnquist and Persson [44] present an optimisation approach to the rescheduling problem. A mathematical formulation which allows an n-tracked
9
network to be modelled is constructed. Alternative objective functions, such as total final delay and total cost associated with delays are used and four rescheduling strategies are tested. The study shows that it is possible to find rescheduling solutions that limit the knock-on delays and/or costs associated with these delays. The most complete rescheduling strategy is sometimes too time-consuming for practical use. However, a more limited optimisation strategy is often good enough.
A special field in rescheduling research concerns connections between trains (most often passenger trains). One example is Schutter et al [40] who examine the possibilities to recover from delays by breaking connections. In the presented model the connections are represented by different kinds of synchronisation constraints. In case of delay the so-called soft constraints may be broken, but at a cost that represents compensation activities and dissatisfaction for passengers. The model is feasible for real-time dispatching since the system uses a moving horizon in which the model is continuously updated.
Hellström [12] examines a decision support tool for train dispatchers. He concludes that this type of tool is especially useful on single-track lines where on-time performance is sensitive to the choice of decision.
Algorithms for rescheduling and dispatching are crucial in detailed models of railway operation, e.g. simulation models. This is also a major concern in paper V in this thesis, which deals with calibration of a simulation model.
2.2 Combinatorial methods
Combinatorial methods are well-suited for analysis of railway systems that are operated with a periodic timetable. Most of the literature on combinatorial methods focuses on synchronisation and optimisation within networks. The main goal is often to minimise resources (rolling stock, staff etc) and waiting times for passengers who need to change trains.
Liebchen and Möhring [23] and Liebchen [22] use PESP (Periodic Event Scheduling Problem) to show that optimisation models can be used to find periodic timetables that need a minimum number of vehicles and give short waiting times for changing passengers. Nachtigall [32] provides an improved branch and bound approach to find a timetable such that the arising changing time is minimal for selected stations.
Paper IV in this thesis makes use of combinatorial methods to produce a large number of timetable variants. The aim is not optimisation, but rather to analyse how the timetable structure and infrastructure design affect capacity.
2.3 Simulation and design of simulation experiments
A major challenge in analytical models is to capture the effect of primary delays, dispatching and interactions between trains, run time variations, etc. Several of these effects are typically disregarded, or handled in a simplified way, in the analytical models. In a simulation model it is, however, possible to capture these effects with high accuracy.
10
Siefer [42] describes the state-of-the-art as regards railway operation simulation, emphasising the main advantages, i.e. to make and evaluate changes in infrastructure, timetable, rolling stock, delays and/or dispatching strategies, along with discussions of important areas of use, such as planning, timetable construction, robustness analysis, operation etc.
Ho et al [16] discuss the difficulties and requirements of effective simulation models for railways. They include several subsystems such as the signalling, power and traction systems and emphasise the advantages of modelling these together in the same simulation tool.
Koutsopoulos and Wang [20] present a framework for the application of rail simulation, including calibration, validation, evaluation methodology and interpretation of results. Their calibration methodology uses track occupation and release data to estimate important model parameters and inputs.
Weits [46] focuses on modelling of traffic control in railway simulation models. He describes the dispatching in detail and five functional levels for planning and operation of railway traffic. He states that most dispatching actions are performed as “short-term reconstruction of the traffic plan without violation of transport and logistic constraints”. Sometimes, however, actions have to be taken at a higher level, i.e. decisions violate actual transport and/or logistic constraints. These kinds of dispatching decision are difficult to replicate in simulation models.
Mattsson [29] proposes a combination of micro-simulation experiments and statistical analyses. By considering the results generated by a simulation model as the actual situation, one can carry out quasi-experiments that can be subjected to statistical analysis. In this way it is easy to control different influencing factors and determine the importance of each one individually.
This type of response surface methodology and use of metamodels is an efficient way of evaluating simulation experiments. Myers and Montgomery [31] describe the method in detail. One advantage of simulation is that the operator can control many factors. Using simulation for multifactor analysis, however, calls for careful planning. Barton [1] and Sanchez [39] provide ideas for how simulation experiments are performed efficiently. Several examples of designs are described and the importance of interaction effects between factors is underlined.
Kleijnen et al [19] point out that simulations are well suited for experiments, but that the experimental designs have to be adjusted for multi-factor analysis. They also discuss the importance of orthogonality, which simplifies computations and makes it easier to determine whether to include a factor in the metamodel or not.
Rudolph [38] develops strategies for an optimised allocation and dimensioning of time supplements in railway timetables. This is an important field since time supplements directly affect operational reliability (delays) as well as travel times. Rudolph makes use of synchronous microsimulation to evaluate different strategies for allocation of supplements. She finds that supplements should be allocated before scheduled arrival time and concentrated at stations with a high demand for
11
punctuality. In some cases this strategy implies shorter overall running times due to better utilisation of allocated supplements.
Lindahl [24] performs simulation experiments to evaluate how capacity can be increased on a double-track railway line with mixed traffic. He tests different speed ratios, overtaking patterns and train lengths.
Papers V and VI use simulation for analysis of mixed railway traffic. Several ideas from Siefer, Koutsopoulos and Wang and Mattsson are used in these studies. Results from Myers and Montgomery, Barton and Sanchez are used for the experiment setups and evaluations.
2.4 Concluding remarks
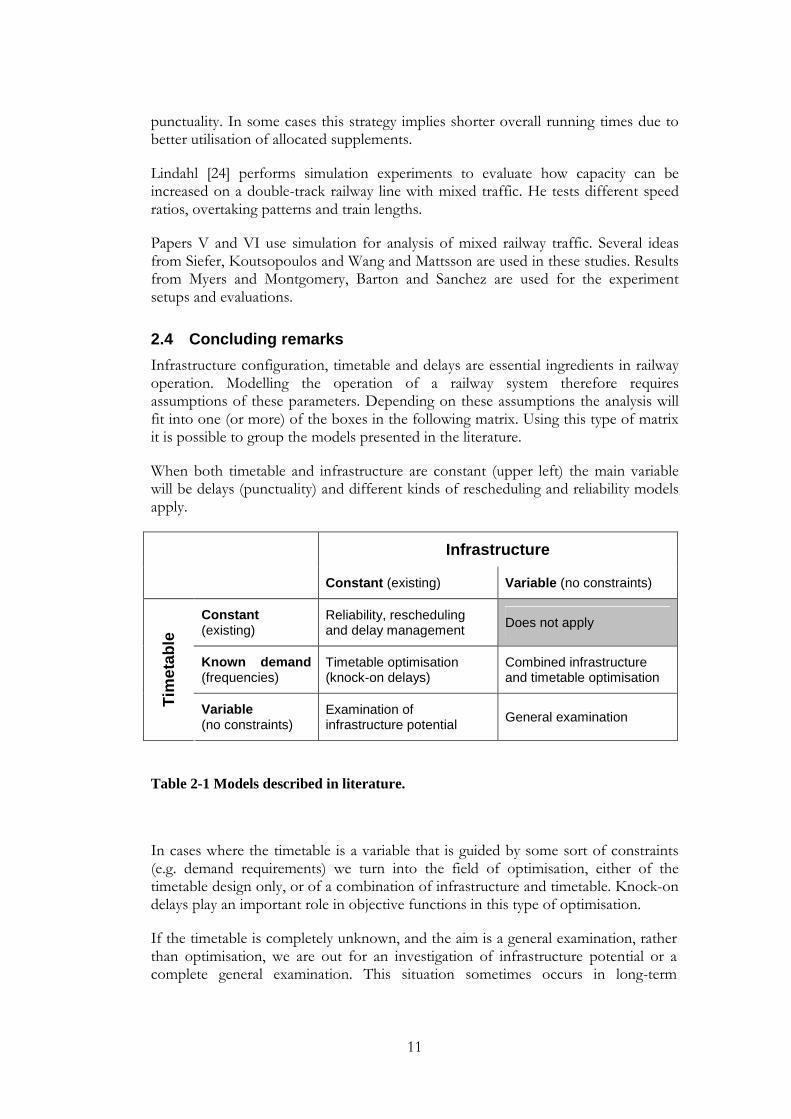
Infrastructure configuration, timetable and delays are essential ingredients in railway operation. Modelling the operation of a railway system therefore requires assumptions of these parameters. Depending on these assumptions the analysis will fit into one (or more) of the boxes in the following matrix. Using this type of matrix it is possible to group the models presented in the literature.
When both timetable and infrastructure are constant (upper left) the main variable will be delays (punctuality) and different kinds of rescheduling and reliability models apply.
Infrastructure
Constant (existing) Variable (no constraints)
Constant (existing)
Reliability, rescheduling and delay management
Does not apply
Known demand (frequencies)
Timetable optimisation (knock-on delays)
Combined infrastructure and timetable optimisation
Tim
etab
le
Variable (no constraints)
Examination of infrastructure potential
General examination
Table 2-1 Models described in literature.
In cases where the timetable is a variable that is guided by some sort of constraints (e.g. demand requirements) we turn into the field of optimisation, either of the timetable design only, or of a combination of infrastructure and timetable. Knock-on delays play an important role in objective functions in this type of optimisation.
If the timetable is completely unknown, and the aim is a general examination, rather than optimisation, we are out for an investigation of infrastructure potential or a complete general examination. This situation sometimes occurs in long-term

12
planning when both the timetable and the future development of demand are unknown.
The main objective of this thesis is to provide some general knowledge about operative properties of single- and double-track lines. Infrastructure, timetable and delays thus appear as variables.
13
3 Methodology Railways are complex technical systems. They are often considered to be static, stiff and inflexible. As long as only constant, non-dynamic parts, such as the infrastructure, are considered, the system is quite easy to understand. Reality is different. The variance in different parameters makes the system difficult. Some examples:
• The infrastructure is adjusted and complemented all the time. Most of the adjustments are minor, but these changes nonetheless imply that important factors for operation vary over time.
• The timetable creates a well defined structure. However, the capacity is utilised differently every day since the actual timetable varies from one day to another due to delays, extra trains and cancelled trains. The planned timetable is also modified once or twice a year. The principles for this capacity allocation also change over time.
• The available capacity, which is an important condition for the timetable, varies over time. Failures, construction works, accidents and delays all make the available capacity vary over time.
• Vehicle properties, relative to those assumed during timetable construction, vary. Important examples are freight trains whose train mass often differs from the timetabled train mass, change of vehicle types without corresponding changes in the timetable, partial vehicle failures, weather conditions that affect adhesion, etc.
• The railway system is used and operated by humans. Human behaviour varies naturally from one time to another. Train crews, dispatchers and passengers all contribute to this variance.
All these variances make the railway system complex and interesting to analyse. Modelling the railway system means modelling all these variables. To find general relations in this noise of superposed variances is not easy. Moreover, strong interactions between factors can be expected, that make the task of analysis even more difficult.
There is no obvious choice of method of analysis. Two alternative methods stand out:
1. Analysis of a specific situation in detail.
2. General analysis given simplifying assumptions and delimitations.
The first method results in deep knowledge of a specific traffic situation. This method is especially suitable when the number of variables is low, e.g. when different timetable variants, or similar ways of operation are to be compared, when detailed disturbance analyses are to be performed, etc. A major weakness with this method is
14
that neither wider perspectives nor guidelines for major changes in one or several variables can be achieved.
The second method gives a broader research perspective and provides knowledge of the main features of the system. This type of analysis requires simplifying assumptions, and so only quite simple traffic situations can be analysed. The main advantage of this approach is that several variables can be handled simultaneously.
This thesis aims to capture fundamental knowledge that is general rather than specific. For this reason, it is natural to start with simple cases, seek simple relations and learn about important principles. It is possible to increase the complexity and perform detailed studies. Simplifying assumptions and delimitations are therefore accepted at this basic level.
3.1 Single-track operation
The operation of single-track lines is well suited for analytical modelling since the traffic is well-defined by the crossings. These crossing situations, where trains travelling in opposite directions meet, are probably the most important part of single-track operation since they cause scheduled delays as well as knock-on delays (through delay propagation). These delay times are hereafter referred to as crossing times.
In order to examine the influence of crossings, a model named SAMFOST has been constructed. The model stands on two fundamental assumptions:
1. Two crossing trains are independent before crossing.
2. Different crossing situations are independent of each other. This implies that following trains are always far enough apart not to interfere with each other when they cross a train in the opposite direction.
These assumptions have high validity in non-congested situations, i.e. when the combination of infrastructure configuration, timetabled frequency of services and punctuality is such that following trains only occasionally come so close that independence is broken.
SAMFOST performs a stepwise analysis where each step means that a new set of parameters has to be assigned:
Step 1: The combination of infrastructure and vehicle data together with passenger stop data gives a timetable-free characteristic of the line.
Step 2: The addition of delay data and a timetabled crossing point gives the full distribution of the crossing time.
15
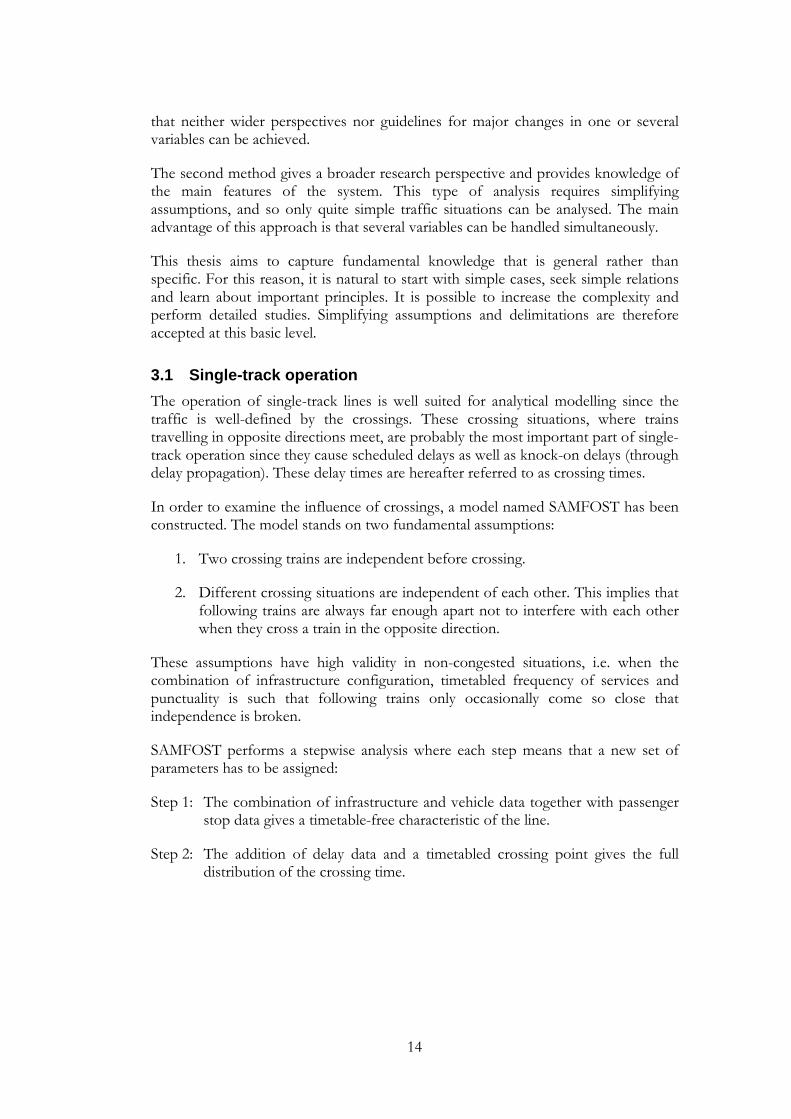
Figure 3-1 The two model steps in SAMFOST. Bold boxes are output data from the model that may be analysed further.
The most important advantage of the two fundamental assumptions is that the first model step becomes independent of further assumptions about timetable and punctuality. This makes it possible to define the so-called crossing time function, which is a timetable- and punctuality-free description of the infrastructure properties. The crossing time function shows the time needed to perform a crossing as a function of the theoretical crossing point that would be realised on a double-track line.
In the second step delays are taken into account and hereby the model clearly shows how these influence the operative result. Using this stepwise modelling a deeper understanding of the combination of infrastructure design, timetable and delays becomes possible.
3.2 Double-track operation
Operation of double-track lines differs from operation of single-track lines since the crossings may take place anywhere and without crossing time. Swedish double-track lines are operated with a mix of high-speed, regional and freight trains. The consequent mix of speeds implies overtakings where faster trains pass slower ones. The overtakings share some features with crossings:
• They increase capacity (for a given traffic mix).
• They have to be carefully planned in the timetable.
• They imply scheduled delays (time losses).
• They mean a risk of delay propagation (knock-on delays).
• They require dispatching actions in disturbed situations.
Infrastructure
Vehicle data Crossing time function
Delay data Crossing time distribution
Timetable crossing point
Passenger stops
16
Two approaches for analysis of double-track operation with mixed traffic are proposed in this thesis:
• A combinatorial model, TVEM.
• Simulation experiments.
Using TVEM it is possible to analyse a great number of timetable variants and infrastructure designs. All kind of disturbance modelling is disregarded in this method and so it is not possible to evaluate different variants with regard to delays. This is however the main idea of simulation experiments and therefore the two methods complement each other well.
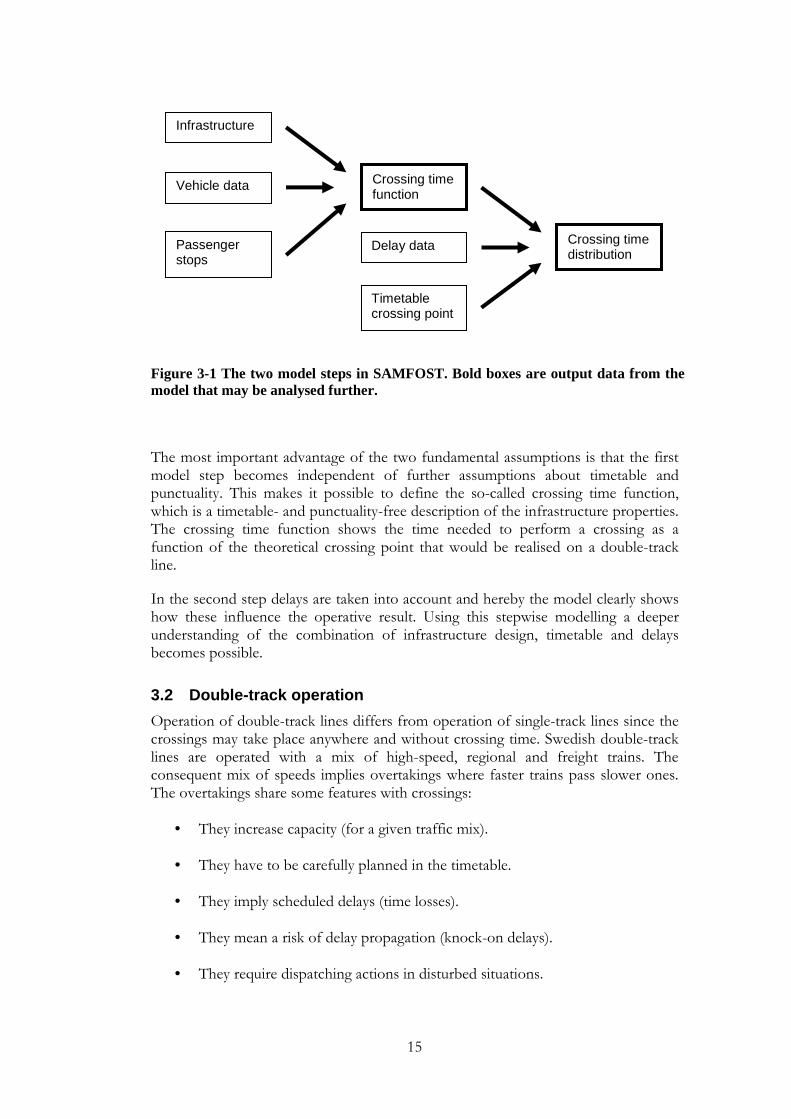
3.2.1 TVEM TVEM, Timetable Variant Evaluation Model, was constructed to evaluate the impact of traffic mix and infrastructure design on line capacity. The model is deterministic and generic. The fact that (most) passenger traffic is operated with periodic timetables is used to generate a large number of timetable variants. The spare capacity between the periodically operated traffic is then evaluated. Other features that might be evaluated are scheduled delays and utilisation of different overtaking stations.
Figure 3-2 Structure of TVEM.
The scheduling algorithm is the heart of the model. Here, the train patterns are systematically scheduled according to their pre-defined (priority) scheduling order. Overtakings are introduced to resolve conflicts.
All results are presented as distributions since different timetable variants result in different capacity, scheduled delays etc. The impact of the timetable design is thus displayed directly. It is also possible to vary the infrastructure design automatically in TVEM, and the impact of distances between overtaking stations can therefore also be evaluated.
Infrastructure
Train patterns Evaluation of results
Scheduling algorithm
Scheduling order
17
Methods like TVEM are especially useful in planning stages where the timetable, i.e. frequency of operation, vehicle characteristics, stopping patterns etc, is unknown and one or several alternative infrastructure designs are to be evaluated.
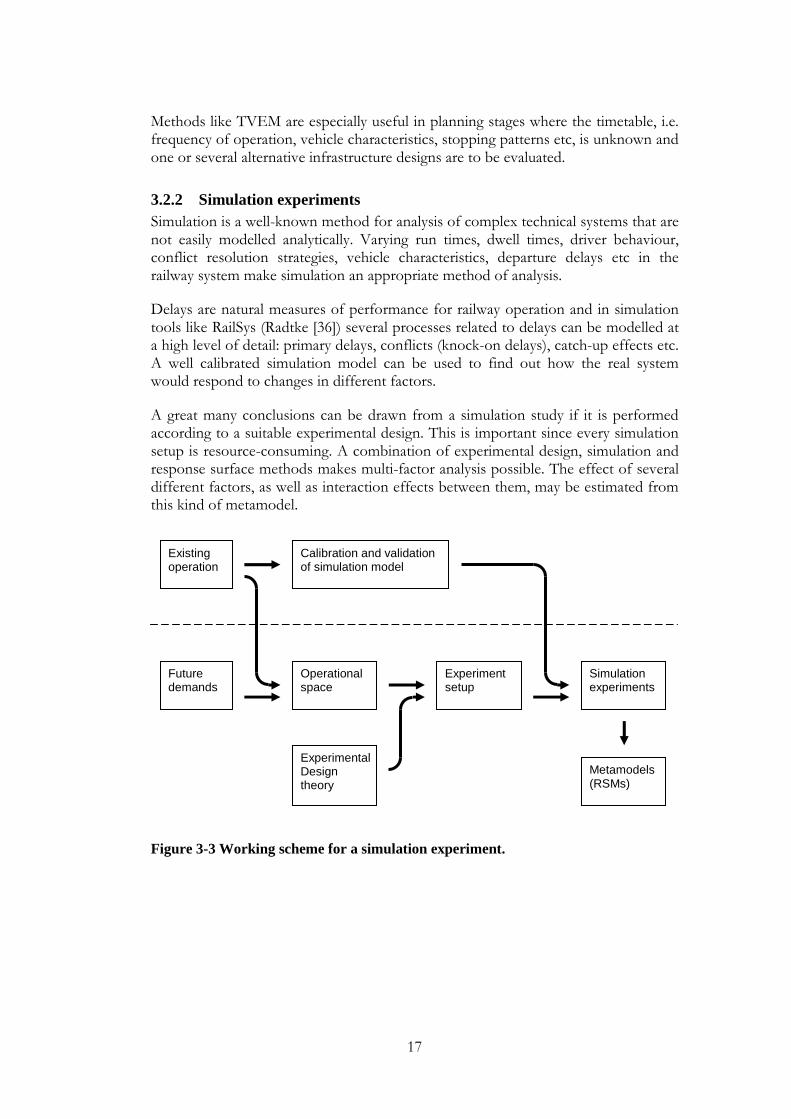
3.2.2 Simulation experiments Simulation is a well-known method for analysis of complex technical systems that are not easily modelled analytically. Varying run times, dwell times, driver behaviour, conflict resolution strategies, vehicle characteristics, departure delays etc in the railway system make simulation an appropriate method of analysis.
Delays are natural measures of performance for railway operation and in simulation tools like RailSys (Radtke [36]) several processes related to delays can be modelled at a high level of detail: primary delays, conflicts (knock-on delays), catch-up effects etc. A well calibrated simulation model can be used to find out how the real system would respond to changes in different factors.
A great many conclusions can be drawn from a simulation study if it is performed according to a suitable experimental design. This is important since every simulation setup is resource-consuming. A combination of experimental design, simulation and response surface methods makes multi-factor analysis possible. The effect of several different factors, as well as interaction effects between them, may be estimated from this kind of metamodel.
Figure 3-3 Working scheme for a simulation experiment.
Existing operation
Calibration and validation of simulation model
Operational space
Experimental Design theory
Experiment setup
Simulation experiments
Metamodels (RSMs)
Future demands

18
19
4 Results The appended papers may be divided into two groups. Papers I-III are closely related and concern single-track operation. These papers present SAMFOST (Simplified Analytical Model for Single-tracks) and some important applications. Infrastructure design, timetable and quality are in focus, rather than capacity.
Paper IV-VI concern double-track operation. These papers are complementary. Paper IV presents TVEM (Timetable Variant Evaluation Model) that is used to analyse how capacity is affected by infrastructure design and timetable design. All kinds of quality measures are disregarded. A number of applications are studied and analysed to show how different infrastructures and traffic mixes affects capacity.
Paper V shows how a simulation model is calibrated to replicate real operation on double-track lines. In paper VI the calibrated model is used for analyses of mixed traffic. Here infrastructure, timetable and quality factors are in focus. Other measures of performance, such as capacity, are not analysed.
4.1 Paper I
This paper shows the advantages of simple analytical models. The crossing time function is introduced and merely by looking at the function the characteristics of a single-track line become clear.
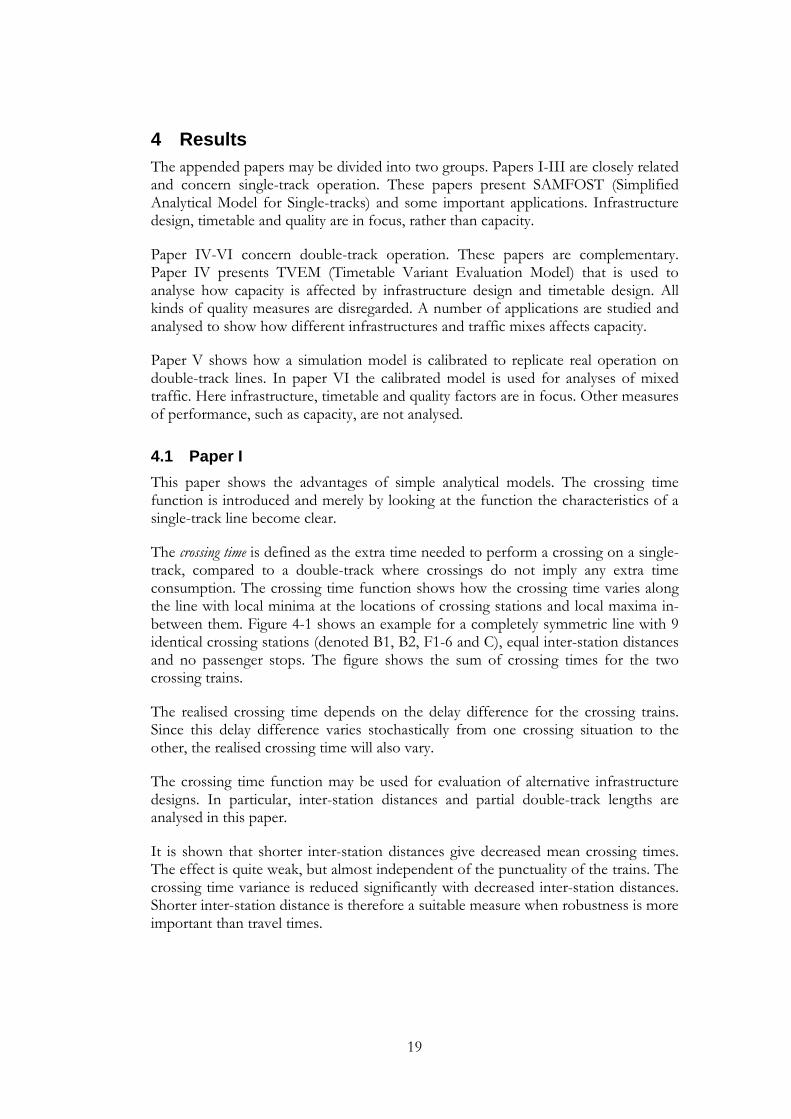
The crossing time is defined as the extra time needed to perform a crossing on a single-track, compared to a double-track where crossings do not imply any extra time consumption. The crossing time function shows how the crossing time varies along the line with local minima at the locations of crossing stations and local maxima in-between them. Figure 4-1 shows an example for a completely symmetric line with 9 identical crossing stations (denoted B1, B2, F1-6 and C), equal inter-station distances and no passenger stops. The figure shows the sum of crossing times for the two crossing trains.
The realised crossing time depends on the delay difference for the crossing trains. Since this delay difference varies stochastically from one crossing situation to the other, the realised crossing time will also vary.
The crossing time function may be used for evaluation of alternative infrastructure designs. In particular, inter-station distances and partial double-track lengths are analysed in this paper.
It is shown that shorter inter-station distances give decreased mean crossing times. The effect is quite weak, but almost independent of the punctuality of the trains. The crossing time variance is reduced significantly with decreased inter-station distances. Shorter inter-station distance is therefore a suitable measure when robustness is more important than travel times.
20
Figure 4-1 Crossing time function for a line with nine equally spaced crossing stations.
This feature is a consequence of the assumption that all stations are identical. If a passenger stop is introduced at one or more of the stations, the symmetry is lost and the system properties are dramatically changed. This is taken up in papers II and III.
When an ordinary crossing station is replaced by a partial double-track, the lowest crossing time decreases. In this case, the resulting lowest level only depends on the speed restriction at the entrance and exit points. An extension of the double-track part also results in a wider time interval having this lowest crossing time. The effect of a partial double-track is thus two-fold: the crossing time is locally reduced and this reduction has a greater extension compared to an ordinary crossing station. Both features are important when the line is operated and the actual delay difference varies stochastically according to some distribution.
Since partial double-tracks only affect the crossing time function locally, the effect becomes highly dependent on the punctuality of the trains. Low punctuality means that the mean crossing time does not decrease as much as for higher punctuality. Even more important, however, is the fact that the crossing time variance is substantially higher when punctuality is low.
The speed restriction at entrance and exit points delimits the effect of partial double-tracks. A less restrictive speed would shorten the mean crossing time, whereas the crossing time variance would increase significantly.
-2500 -2000 -1500 -1000 -500 0 500 1000 1500 2000 25000
50
100
150
200
250
300
350
Delay difference [s]
Cro
ssin
g tim
e [s
]
B2 F6 F4 F2 C F1 F3 F5 B1
21
4.2 Paper II
In paper II the crossing time concept is developed further and implemented in a model named SAMFOST (Simplified Analytical Model for Single-tracks). The model is used for analyses of different infrastructure measures that are intended to shorten the crossing time and reduce its variance.
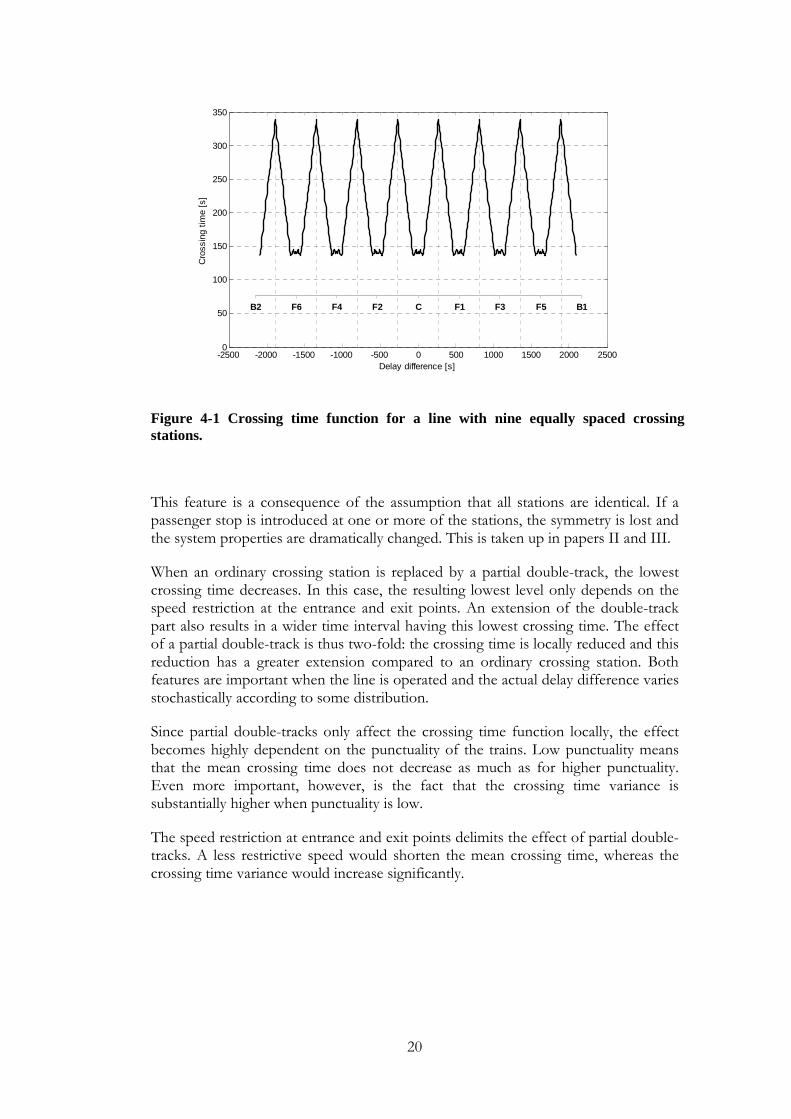
One situation of special importance is the combination of crossing and passenger stop. If a crossing is planned at a station where the trains have a regular passenger stop, the time for deceleration and acceleration, as well as most of the waiting time, is not part of the crossing time. The combination of crossing and passenger stop therefore implies time-efficient crossings. This can be seen in the crossing time function in figure 4-2.
Figure 4-2 Crossing time function (solid) for a line with 9 crossing stations and passenger stop at mid-station. Different locations of timetable crossing point imply different positions of the probability density function for the delay difference (dashed).
Referring to the crossing time function (solid line) in figure 4-2, the effects of a passenger stop may be summarised as follows.
• Time-efficient crossings are enabled due to the stop. A time interval, with low crossing time, occurs, whose length depends on the timetabled dwell time.
• The maxima surrounding the stop station become higher due to accelerations and decelerations that increase the run time on the single-track sections surrounding the stop station.
-2500 -2000 -1500 -1000 -500 0 500 1000 1500 2000 25000
0.5
1
1.5
2x 10
-3
-2500 -2000 -1500 -1000 -500 0 500 1000 1500 2000 25000
50
100
150
200
250
300
350
400
Time distance to mid located crossing point [s]
Cro
ssin
g tim
e [s
]
22
A passenger stop means that the amplitude of the crossing time function increases significantly and the variance and sensitivity of punctuality therefore also increase compared to a line without any passenger stop.
Different types of traffic constraints often make it impossible to obtain the optimal timetable crossing point for every crossing. It is therefore of interest to examine different locations of the timetable crossing point. This means that the probability density function is located at different positions along the crossing time function, as exemplified in figure 4-2.
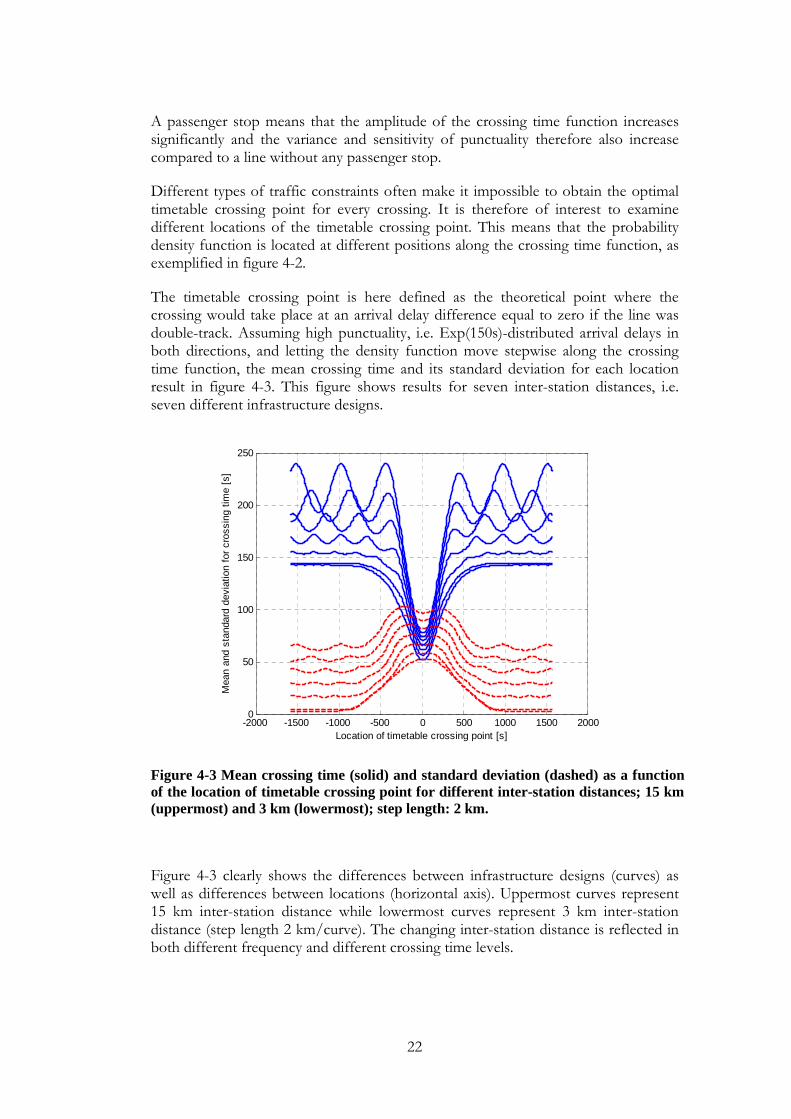
The timetable crossing point is here defined as the theoretical point where the crossing would take place at an arrival delay difference equal to zero if the line was double-track. Assuming high punctuality, i.e. Exp(150s)-distributed arrival delays in both directions, and letting the density function move stepwise along the crossing time function, the mean crossing time and its standard deviation for each location result in figure 4-3. This figure shows results for seven inter-station distances, i.e. seven different infrastructure designs.
-2000 -1500 -1000 -500 0 500 1000 1500 20000
50
100
150
200
250
Location of timetable crossing point [s]
Mea
n an
d st
anda
rd d
evia
tion
for
cros
sing
tim
e [s
]
Figure 4-3 Mean crossing time (solid) and standard deviation (dashed) as a function of the location of timetable crossing point for different inter-station distances; 15 km (uppermost) and 3 km (lowermost); step length: 2 km.
Figure 4-3 clearly shows the differences between infrastructure designs (curves) as well as differences between locations (horizontal axis). Uppermost curves represent 15 km inter-station distance while lowermost curves represent 3 km inter-station distance (step length 2 km/curve). The changing inter-station distance is reflected in both different frequency and different crossing time levels.
23
Every minimum corresponds to a crossing station. At the middle crossing station all trains have a passenger stop which results in an absolute minimum for the mean crossing time.
Looking at the standard deviation, it becomes clear that a shorter inter-station distance gives lower crossing time variance while a passenger stop results in higher crossing time variance compared to stations without passenger stop. This is seen in a increase in standard deviation in the mid section, close to the station with passenger stop.
This type of mean crossing time function and standard deviation curve is also an important methodological result of this research since the method displays the impact of punctuality on crossing time and timetable construction.
4.3 Paper III
Papers I and II describe how the SAMFOST model can be used for analysis of infrastructure, timetable and punctuality on single-track lines. Paper III also makes use of SAMFOST. The concept of timetable flexibility is introduced and three measures are defined. In the second part of the paper the effect of six different factors is evaluated through a factorial experiment.
Figures 4-2 and 4-3 showed how the crossing time function is combined with the distribution for the delay difference to calculate mean and standard deviation for crossing time at different positions along the line.
The location of the timetable crossing point influences the crossing time (distribution, mean and variance) since different locations mean that the distribution of the delay difference is positioned differently relative to the crossing time function (shown in figure 4-2). The resulting mean crossing time function (figure 4-3), that shows the mean crossing time for different locations of the timetable crossing point, is of great importance where timetable flexibility is concerned.
The idea of timetable flexibility is to describe the possibilities for future timetable changes. Such changes could be induced by demand changes in the studied part of the rail network and/or adjacent lines as well as by major changes in adjacent infrastructure or vehicle changes that call for timetable adjustments. The concept of timetable flexibility may also be extended to describe capacity and the dependencies between capacity and punctuality.
Using the mean crossing time function, timetable flexibility may be defined in a straightforward way. This is advantageous since both the properties of the infrastructure and vehicles and punctuality affect the mean crossing time function. Thus, the local influences of passenger stops and partial double-tracks are modelled in a reasonable way. However, the simplest form of timetable flexibility calculations, using a constant tolerance level, as presented in paper III, is probably too simple to be more than a first step in the development of general measures. A more complicated model that also takes into account the crossing time variance could be an alternative.
24
Timetable flexibility, as treated in this paper, requires analysis of a group of points (locations) along a line that are chosen to be possible timetable crossing points. This group may be characterised by different measures. The basic tolerance method was found to give three measures that complement each other. Since both geographical location and crossing time differ between available timetable crossing points, it is necessary to measure spread in location as well as spread in crossing time for the group of accepted timetable crossing points.
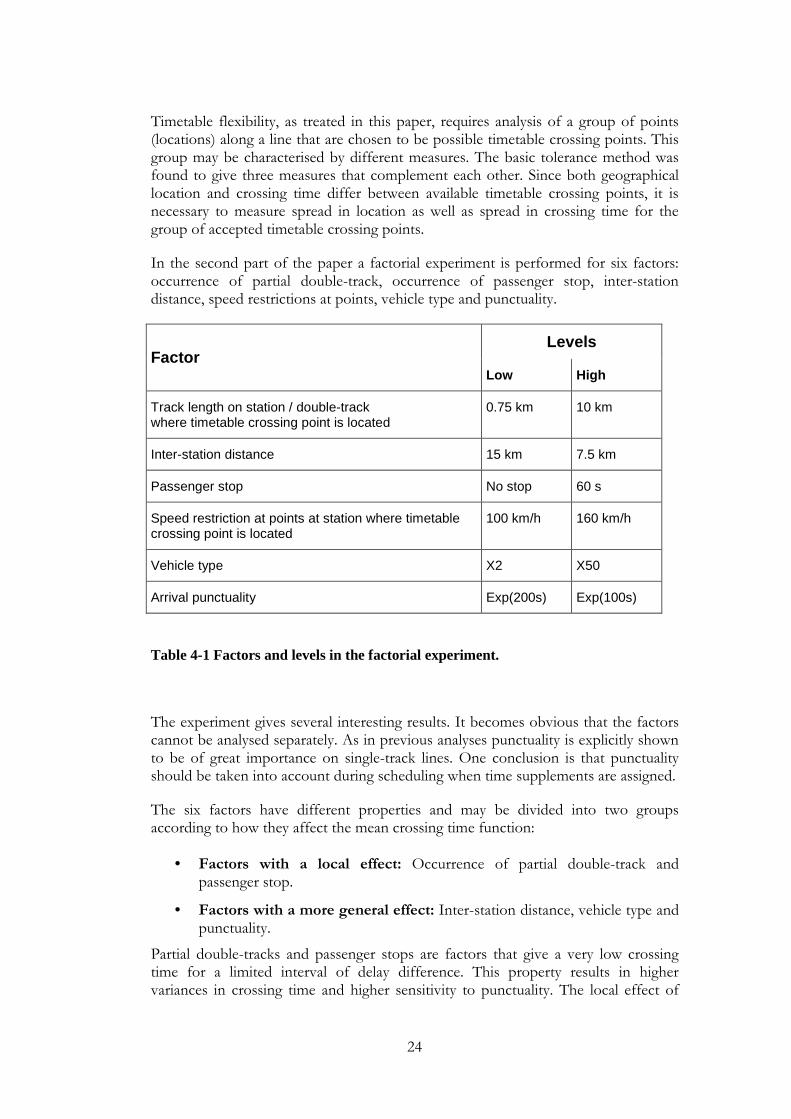
In the second part of the paper a factorial experiment is performed for six factors: occurrence of partial double-track, occurrence of passenger stop, inter-station distance, speed restrictions at points, vehicle type and punctuality.
Levels Factor
Low High
Track length on station / double-track where timetable crossing point is located
0.75 km 10 km
Inter-station distance 15 km 7.5 km
Passenger stop No stop 60 s
Speed restriction at points at station where timetable crossing point is located
100 km/h 160 km/h
Vehicle type X2 X50
Arrival punctuality Exp(200s) Exp(100s)
Table 4-1 Factors and levels in the factorial experiment.
The experiment gives several interesting results. It becomes obvious that the factors cannot be analysed separately. As in previous analyses punctuality is explicitly shown to be of great importance on single-track lines. One conclusion is that punctuality should be taken into account during scheduling when time supplements are assigned.
The six factors have different properties and may be divided into two groups according to how they affect the mean crossing time function:
• Factors with a local effect: Occurrence of partial double-track and passenger stop.
• Factors with a more general effect: Inter-station distance, vehicle type and punctuality.
Partial double-tracks and passenger stops are factors that give a very low crossing time for a limited interval of delay difference. This property results in higher variances in crossing time and higher sensitivity to punctuality. The local effect of
25
each factor is extensive but when a partial double-track is combined with a passenger stop the additional gain is limited, which shows an important interaction between these factors.
Partial double-tracks and passenger stops also affect timetable flexibility in a special way. Due to their great (local) impact on the mean time crossing function, they generate new accepted timetable crossing points that are located in a continuous interval. Timetable flexibility hereby increases when a partial double-track or a passenger stop is introduced.
Inter-station distance, vehicle type and punctuality impact the operations along the entire line. In particular, the inter-station distance strongly affects the crossing time variance, while the mean crossing time is not affected so much. The inter-station distance also affects the timetable flexibility.
The vehicle type has a surprisingly weak influence on the evaluated parameters. In particular when the timetable crossing point is combined with a passenger stop, the vehicle becomes unimportant since the vehicle characteristics are taken into account in the timetable.
The factorial experiment also shows the importance of punctuality. It becomes obvious that high punctuality leads to more time-efficient crossings. The crossing time variance is the response variable that is most sensitive to the punctuality level.
4.4 Paper IV
Railway capacity is affected by several factors, e.g. infrastructure design, timetable design, traffic mix, delays, etc. The dependence of the timetable design makes capacity analysis difficult. This is especially true for mixed traffic where the number of alternative timetables is large. It is difficult to foresee future demands, signalling and train protection systems and operation rules. Therefore, it is important to examine how the timetable affects capacity and other operational features.
Operation of Swedish double-track railway lines is characterised by great speed differences and a passenger traffic that is operated in patterns with periodic timetables. In order to cope with this mix, high-speed passenger traffic is most often prioritised for slower regional and freight traffic during timetable construction.
The combination of periodically operated passenger traffic, with distinct traffic patterns, and a strict priority rule for timetable construction makes it possible to apply a generic model for performance assessment of different timetable designs. Paper IV proposes a simple, deterministic approach for capacity evaluations that explicitly show the effect of mixing trains with great speed differences on long double-track railway lines.
In the presented model, TVEM (Timetable Variant Evaluation Model), the use of infrastructure is modelled with run times between overtaking stations. One set of run times is needed for each train type to be modelled. These sets thus reflect the combination of infrastructure and vehicle properties. In the same way, sets of
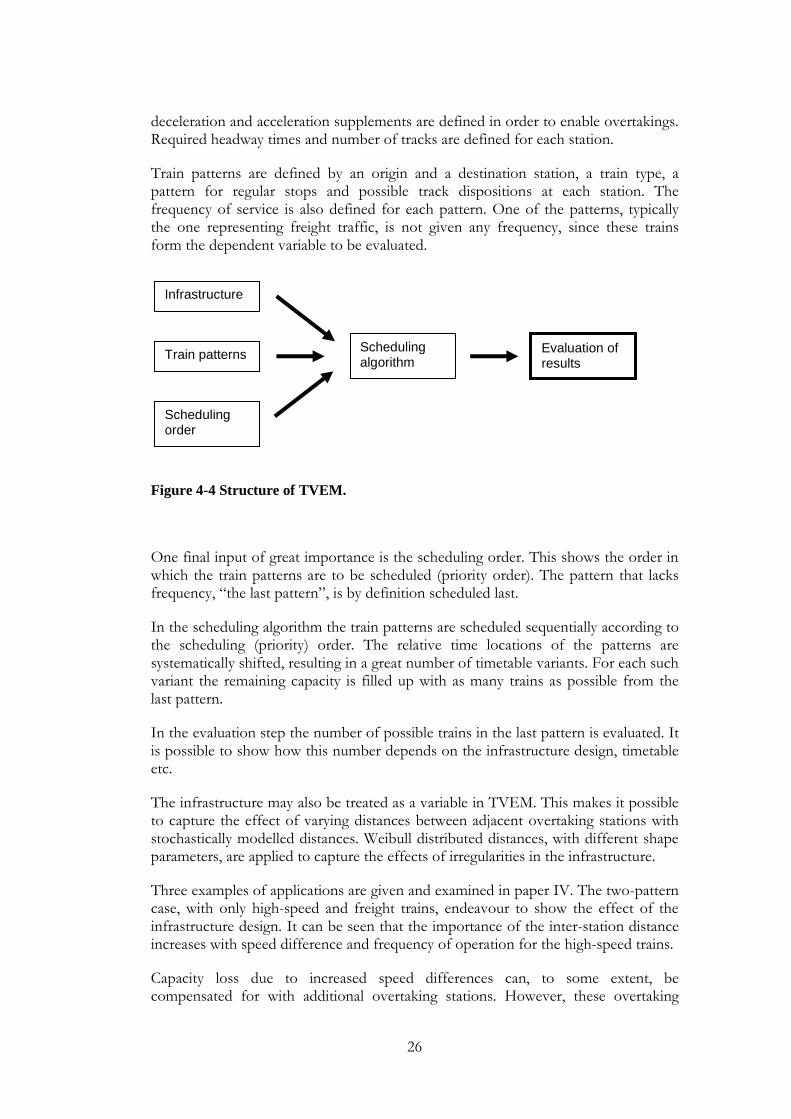
26
deceleration and acceleration supplements are defined in order to enable overtakings. Required headway times and number of tracks are defined for each station.
Train patterns are defined by an origin and a destination station, a train type, a pattern for regular stops and possible track dispositions at each station. The frequency of service is also defined for each pattern. One of the patterns, typically the one representing freight traffic, is not given any frequency, since these trains form the dependent variable to be evaluated.
Figure 4-4 Structure of TVEM.
One final input of great importance is the scheduling order. This shows the order in which the train patterns are to be scheduled (priority order). The pattern that lacks frequency, “the last pattern”, is by definition scheduled last.
In the scheduling algorithm the train patterns are scheduled sequentially according to the scheduling (priority) order. The relative time locations of the patterns are systematically shifted, resulting in a great number of timetable variants. For each such variant the remaining capacity is filled up with as many trains as possible from the last pattern.
In the evaluation step the number of possible trains in the last pattern is evaluated. It is possible to show how this number depends on the infrastructure design, timetable etc.
The infrastructure may also be treated as a variable in TVEM. This makes it possible to capture the effect of varying distances between adjacent overtaking stations with stochastically modelled distances. Weibull distributed distances, with different shape parameters, are applied to capture the effects of irregularities in the infrastructure.
Three examples of applications are given and examined in paper IV. The two-pattern case, with only high-speed and freight trains, endeavour to show the effect of the infrastructure design. It can be seen that the importance of the inter-station distance increases with speed difference and frequency of operation for the high-speed trains.
Capacity loss due to increased speed differences can, to some extent, be compensated for with additional overtaking stations. However, these overtaking
Infrastructure
Train patterns Evaluation of results
Scheduling algorithm
Scheduling order
27
stations do not compensate for the increase in scheduled delays that the slower trains suffer from as a result of an increase in speed difference and/or frequency of operation for the faster trains.
The introduction of a third train pattern, i.e. regional trains at intermediate speed, makes it possible to examine the effect of both the infrastructure design and the timetable. The two patterns of passenger trains allow different timetables with different relative time locations to be chosen.
The two core conclusions from the three-pattern example are that a division of the passenger traffic into two patterns, that are not timetabled with a strict regularity, increases capacity, while the introduction of a third speed level decreases capacity. The net effect on capacity depends on the speed levels and frequencies of service.
More heterogeneous passenger traffic reduces the impact of infrastructure design on capacity, as demonstrated by smaller capacity variances. The exact configuration of the infrastructure is thus more important when traffic is homogenous. The analysis of the three-pattern case also shows that the timetable is of greater importance for the capacity when frequency of passenger trains is low and/or speed differences are low.
All kinds of disturbances and delays are disregarded in TVEM. However, robustness and occurrence of delay propagation is highly dependent on the timetable. It is therefore likely that the sensitivity of timetable variants found by TVEM is dependent on primary delays and result in different amounts of knock-on delay. The calculated maximum capacity assumes high precision in operation since the utilisation of the overtaking stations is high. Despite buffer times included in assumed headways, capacity is still highly dependent on punctuality of operations.
4.5 Paper V
The need to include disturbances in capacity analyses increases with utilisation of a railway network. Simulation is an appropriate method to model and evaluate the effects of disturbances. In the microsimulation tool RailSys, see Radtke [36], infrastructure, timetable, vehicles and disturbances are modelled at a high level of detail. It is hereby possible to model primary delays, interactions between trains, delay propagation that follows on from conflicts, catch up effects through utilisation of time supplements, etc.
Before a simulation model can be used, it has to be calibrated properly in order to make sure that it models the real system accurately. Paper V describes the calibration (and validation) process for a simulation model of a Swedish double-track line with mixed traffic. The calibrated model will later be used for generalised analyses of the impact of infrastructure, timetable and disturbance factors. These analyses are presented in paper VI.
The main input data to a simulation model like RailSys are infrastructure, timetable, vehicle and disturbance data. It is of great importance to show that the simulation model reacts properly to changes in these data. The calibration was performed against real operational data from a previous timetable period and limited to changes
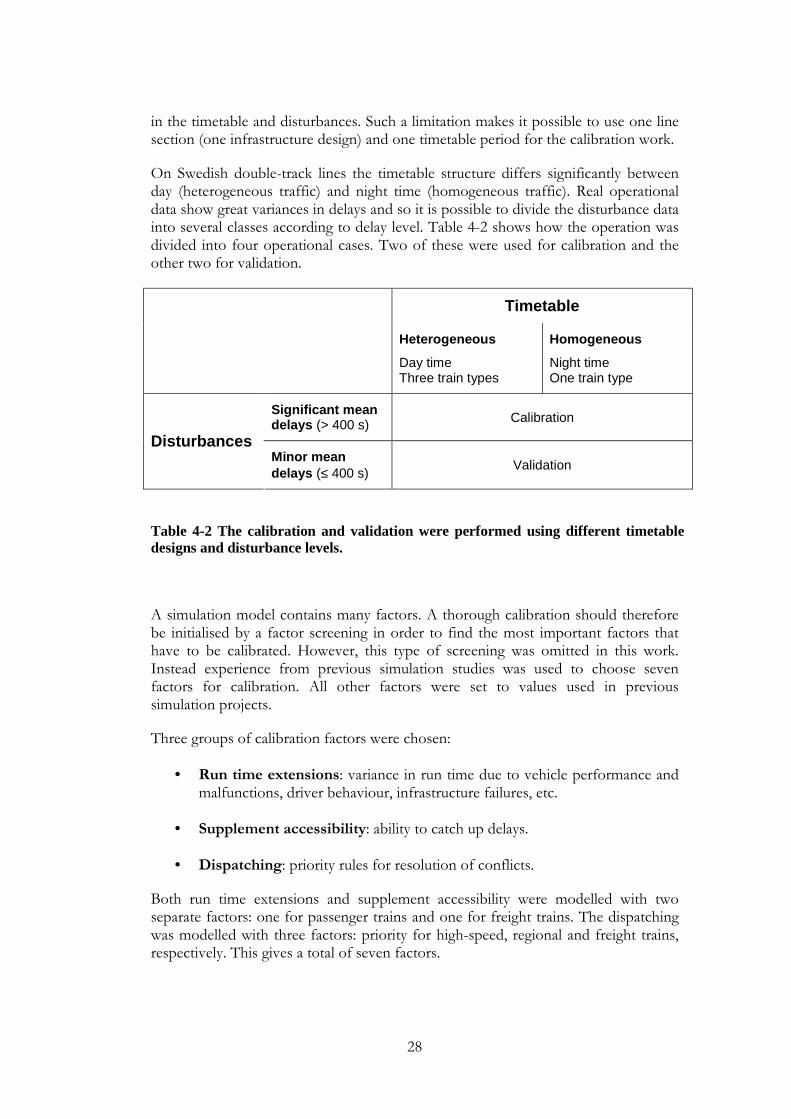
28
in the timetable and disturbances. Such a limitation makes it possible to use one line section (one infrastructure design) and one timetable period for the calibration work.
On Swedish double-track lines the timetable structure differs significantly between day (heterogeneous traffic) and night time (homogeneous traffic). Real operational data show great variances in delays and so it is possible to divide the disturbance data into several classes according to delay level. Table 4-2 shows how the operation was divided into four operational cases. Two of these were used for calibration and the other two for validation.
Timetable
Heterogeneous
Day time Three train types
Homogeneous
Night time One train type
Significant mean delays (> 400 s) Calibration
Disturbances Minor mean delays (≤ 400 s)
Validation
Table 4-2 The calibration and validation were performed using different timetable designs and disturbance levels.
A simulation model contains many factors. A thorough calibration should therefore be initialised by a factor screening in order to find the most important factors that have to be calibrated. However, this type of screening was omitted in this work. Instead experience from previous simulation studies was used to choose seven factors for calibration. All other factors were set to values used in previous simulation projects.
Three groups of calibration factors were chosen:
• Run time extensions: variance in run time due to vehicle performance and malfunctions, driver behaviour, infrastructure failures, etc.
• Supplement accessibility: ability to catch up delays.
• Dispatching: priority rules for resolution of conflicts.
Both run time extensions and supplement accessibility were modelled with two separate factors: one for passenger trains and one for freight trains. The dispatching was modelled with three factors: priority for high-speed, regional and freight trains, respectively. This gives a total of seven factors.
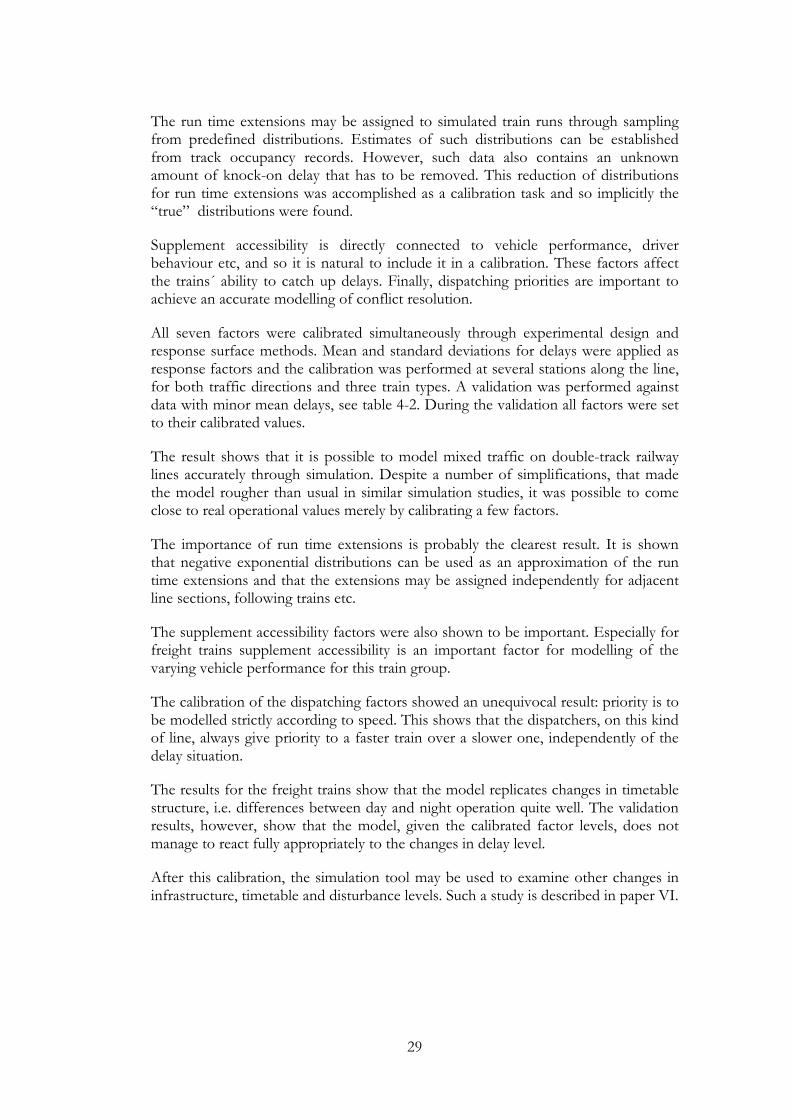
29
The run time extensions may be assigned to simulated train runs through sampling from predefined distributions. Estimates of such distributions can be established from track occupancy records. However, such data also contains an unknown amount of knock-on delay that has to be removed. This reduction of distributions for run time extensions was accomplished as a calibration task and so implicitly the “true” distributions were found.
Supplement accessibility is directly connected to vehicle performance, driver behaviour etc, and so it is natural to include it in a calibration. These factors affect the trains´ ability to catch up delays. Finally, dispatching priorities are important to achieve an accurate modelling of conflict resolution.
All seven factors were calibrated simultaneously through experimental design and response surface methods. Mean and standard deviations for delays were applied as response factors and the calibration was performed at several stations along the line, for both traffic directions and three train types. A validation was performed against data with minor mean delays, see table 4-2. During the validation all factors were set to their calibrated values.
The result shows that it is possible to model mixed traffic on double-track railway lines accurately through simulation. Despite a number of simplifications, that made the model rougher than usual in similar simulation studies, it was possible to come close to real operational values merely by calibrating a few factors.
The importance of run time extensions is probably the clearest result. It is shown that negative exponential distributions can be used as an approximation of the run time extensions and that the extensions may be assigned independently for adjacent line sections, following trains etc.
The supplement accessibility factors were also shown to be important. Especially for freight trains supplement accessibility is an important factor for modelling of the varying vehicle performance for this train group.
The calibration of the dispatching factors showed an unequivocal result: priority is to be modelled strictly according to speed. This shows that the dispatchers, on this kind of line, always give priority to a faster train over a slower one, independently of the delay situation.
The results for the freight trains show that the model replicates changes in timetable structure, i.e. differences between day and night operation quite well. The validation results, however, show that the model, given the calibrated factor levels, does not manage to react fully appropriately to the changes in delay level.
After this calibration, the simulation tool may be used to examine other changes in infrastructure, timetable and disturbance levels. Such a study is described in paper VI.
30
4.6 Paper VI
The railway is a complex system that is difficult to model and analyse analytically. Simulation therefore appears to be an appropriate method for analysis of railway operation. In a simulation tool, like RailSys, it is possible to perform experiments to evaluate the effect of different factors and to model stochastic event and process times such as delays, varying run times etc. The advantages of simulation experiments for full-scale experiments are obvious, since changes in railway systems are expensive and not easily performed.
In paper VI reality is therefore replaced by a simulation model, where nine factors are varied systematically. The experimental design Latin Hypercubes (Kleijnen et al [19] and Cioppa and Lucas [6]) is applied in order to choose variants for simulation and the simulation results are evaluated through response surface methods. This kind of metamodel provides much more information about the underlying system than haphazard investigation of a few variants.
The two main objectives were to find out how infrastructure, timetable and perturbation factors affect the delays that occur along a railway line and to develop a method for such analyses. The additional delay was chosen as response variable, since it is an efficient measure of railway operation’s performance.
It is difficult to define a timetable unequivocally by use of a limited number of factors. Even if strict periodic operation is assumed, a normal mix of 3-4 different train types results in a great many factors for the timetable. The paper therefore focuses on the simplest traffic mix with only two train types; high-speed passenger trains and freight trains. This limitation makes the study transparent, consistent and a good pilot study for development of the method.
Primary delays are essential in railway operation. The perturbations therefore appear as important factors that have to be modelled carefully. Paper V showed that perturbations can be properly modelled by entry delays and run time extensions that are independently assigned from distributions to the simulated trains.
Previous papers focused to a large extent on the infrastructure. In paper VI, where the focus is shifted to the timetable design, the infrastructure is represented by one factor: the distance between overtaking stations. This factor merely serves as a reference factor to the others and makes comparisons of different measures possible.
The analysed factors were:
• Infrastructure: distance between adjacent overtaking stations. (1 factor)
• Timetable: maximum speed and frequency of operation for high-speed and freight trains, respectively. (4 factors)
• Perturbations: entry delays and run time extensions for high-speed and freight trains, respectively. (4 factors)
31
Calibrated values, from paper V, were applied for supplement accessibility and dispatching factors in the simulation model. Mean and standard deviation for additional delay for the two train types were applied as response factors.
The results from the simulations were used to derive response surface metamodels. These are polynomials that provide good local approximations to the real, unknown, response function. The most simple response surfaces contain only first order terms. Such a surface is feasible when the functions are roughly linear over the range of interest. Some of the factors were given wide ranges in the experiment and curved relationships could therefore be expected. To capture this effect, both second order terms and interactions were included in the metamodels.
Relatively high R2 values indicate that the models fit the simulated results well and that they can predict non-simulated points fairly well. Altogether. the methods used in the study, experimental design, simulation and response surface methodology proved to be feasible. The fitted metamodels can be used to estimate the effect of changes in one or several factors. Such estimations are useful in long-term planning, but also when strategies for construction of robust timetables are to be chosen.
In general, the metamodels generally show quite a high degree of robustness, with limited additional delays, for both train types. This fact indicates that the studied traffic mix is not a great challenge for a double-track railway line, as long as only additional delays are considered.
The freight trains do not suffer any additional delays. Instead, they tend to catch up delays in almost every operational case. This is natural since every overtaking means that time supplements are added in the timetable. These supplements increase the possibilities to catch up delays through shorter stops than planned.
The additional delays for high-speed trains are limited to less than 10 s/10 km. The higher values, 7-10 s/10 km, would certainly imply considerable delay problems, whereas the lower values, 2-4 s/10 km, would be regarded as acceptable. This span in additional delay shows that the evaluated factors actually matter for the high-speed traffic.
All nine factors proved to be significant. The entry delays turned out to be the least important factors. This means that this kind of system and operation is quite independent of the delay level. The focus could therefore be shifted to the other factors in future studies.
As expected both speeds and frequencies play important roles for the additional delays. The freight train speed in particular seems to be essential. The frequency of high-speed trains affects the number of overtakings directly and makes this frequency factor important for the additional delay.
The infrastructure factor, the distance between overtaking stations, affects the additional delay in a complicated way, since it interacts with several other factors. The infrastructure seems to be more important for freight trains, probably due to the strict dispatching rule that prioritises high-speed trains.

32
Run time extensions are essential for accurate modelling of railway operation. The two run time extension factors also show a significant impact on the additional delays. It is clear that the railway system should gain from increased reliability in infrastructure and vehicles, more precise and accurate dispatching, less varying driver behaviour etc.
The study gives useful insights into the properties of mixed traffic operation. It shows that timetable factors play important roles, that the importance of the infrastructure design is dependent on the timetable and that it is possible to disregard – at least some of – the perturbation factors.
33
5 Contributions of the thesis This thesis contributes to the understanding of the railway as a technical operational system. It proposes two simplified methods for analysis of single and double-track railway lines respectively, SAMFOST and TVEM. It emphasises the importance of infrastructure and timetable factors and shows how these factors can be handled as variables in different kinds of analyses. Delay measures are used for performance evaluation throughout the thesis.
Simulation is applied for detailed modelling of delays, conflicts, run times and dispatching. A simulation model is set up in the micro-simulation tool RailSys and calibrated against real operational data. The calibrated model is then used for simulation experiments to evaluate the impact of infrastructure, timetable and perturbation factors.
Some of the methods and results developed in the thesis have already been applied in infrastructure planning and resulted in infrastructure adjustments for capacity increase and less disturbance sensitivity; see Fröidh and Lindfeldt [9] for an example.
5.1 Simple models
Two simplified models, SAMFOST and TVEM, for evaluation of railway lines are proposed in the thesis. These models are simple to use and the results are understandable and easy to display. Both models give general and systematic results.
Their ease of use, together with the systematic analysis the models allow, is advantageous in infrastructure planning where the results may be used to design more detailed studies with other techniques. In timetabling the simple models may contribute when standards and rules of thumb are to be decided.
It could be argued that the fundamental assumptions make the models too rough. This is probably true in cases where good predictions of future demand and operation exist. However, this is in fact seldom the case. Instead, reality shows that assumptions used to make predictions during the construction of railway systems often differ from the actual traffic that is operated when the line is in use.
This fact indicates that a more general knowledge of the operation conditions is valuable. By using a less detailed overview perspective it is possible to study how the system will react if operating conditions change.
5.2 Infrastructure as a variable
In most other studies the infrastructure is treated as a constant, or a variable that can take on only a few predefined values, see for instance Higgins et al [14], Brännlund et al [2], Medanic and Dorfman [30], Frank [7] and Chen and Harker [5]. This thesis shows examples of how the infrastructure, in very systematic ways, can be treated as a variable. This means that fictive model lines are examined, instead of existing infrastructure designs that are highly asymmetric and unique. This is an important contribution in itself.
34
In order to learn more about railway operation one has to allow the infrastructure to vary within a rather wide area. In some sense this fact means that a new dimension of the analysis is accepted.
The thesis shows how inter-station distances can be; either sampled from a distribution to achieve randomised infrastructure designs or systematically shifted given an assumption of equal inter-station distances. These methods imply much more information than if just one or a small number of infrastructure designs are examined.
For instance, this kind of analysis makes it possible to draw conclusions about marginal effects of double-track extensions and shortening of inter-station distances. It is also possible to make a clear definition of partial double-track, display patterns that result from station properties that are repeated at every station etc.
Analysis of symmetric infrastructure designs also turned out to be useful. It is a natural first evaluation step that is transparent and easy to understand, since no replicates are required, as is the case when designs are sampled from a distribution.
5.3 Timetable as a variable
The operational features of a railway line are highly dependent on the timetable, i.e. mix and order of different train types. One of the most important contributions of this thesis is that the timetable is systematically treated as a variable. In many cases railway operation analyses are based on some kind of timetable assumption that implies that only one or a few timetable variants are tested.
However, the timetable develops much faster than the infrastructure and sooner or later the system is operated differently than originally planned. There are several Swedish examples of this (see Fröidh and Lindfeldt [9]) and so the necessity to also treat the timetable as a variable in operation analyses is evident. By evaluating several hypothetic timetables the analysis becomes much more general and the knowledge of the system deeper.
Three methods for timetable variation are proposed in the thesis:
• Analytical – SAMFOST
• Combinatorial – TVEM
• Simulation experiments – Response Surface Methods
The concept of timetable flexibility is as a part of the SAMFOST-model. This idea ought to be an important contribution, in particular when asymmetries from a real line are included in the analysis. It is useful to analyse timetable flexibility both during timetable construction and in infrastructure planning. In the latter case it is a way to check sensitivity to timetable changes relative to the dimensioning “planning timetable”.
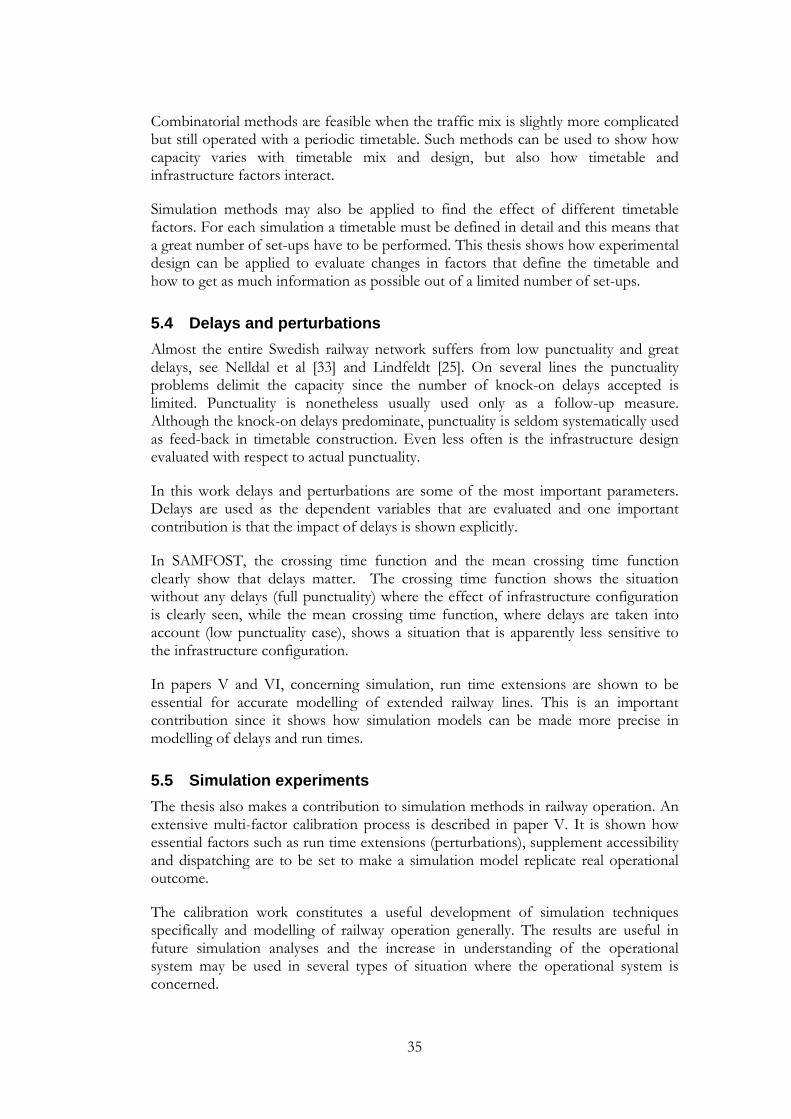
35
Combinatorial methods are feasible when the traffic mix is slightly more complicated but still operated with a periodic timetable. Such methods can be used to show how capacity varies with timetable mix and design, but also how timetable and infrastructure factors interact.
Simulation methods may also be applied to find the effect of different timetable factors. For each simulation a timetable must be defined in detail and this means that a great number of set-ups have to be performed. This thesis shows how experimental design can be applied to evaluate changes in factors that define the timetable and how to get as much information as possible out of a limited number of set-ups.
5.4 Delays and perturbations
Almost the entire Swedish railway network suffers from low punctuality and great delays, see Nelldal et al [33] and Lindfeldt [25]. On several lines the punctuality problems delimit the capacity since the number of knock-on delays accepted is limited. Punctuality is nonetheless usually used only as a follow-up measure. Although the knock-on delays predominate, punctuality is seldom systematically used as feed-back in timetable construction. Even less often is the infrastructure design evaluated with respect to actual punctuality.
In this work delays and perturbations are some of the most important parameters. Delays are used as the dependent variables that are evaluated and one important contribution is that the impact of delays is shown explicitly.
In SAMFOST, the crossing time function and the mean crossing time function clearly show that delays matter. The crossing time function shows the situation without any delays (full punctuality) where the effect of infrastructure configuration is clearly seen, while the mean crossing time function, where delays are taken into account (low punctuality case), shows a situation that is apparently less sensitive to the infrastructure configuration.
In papers V and VI, concerning simulation, run time extensions are shown to be essential for accurate modelling of extended railway lines. This is an important contribution since it shows how simulation models can be made more precise in modelling of delays and run times.
5.5 Simulation experiments
The thesis also makes a contribution to simulation methods in railway operation. An extensive multi-factor calibration process is described in paper V. It is shown how essential factors such as run time extensions (perturbations), supplement accessibility and dispatching are to be set to make a simulation model replicate real operational outcome.
The calibration work constitutes a useful development of simulation techniques specifically and modelling of railway operation generally. The results are useful in future simulation analyses and the increase in understanding of the operational system may be used in several types of situation where the operational system is concerned.
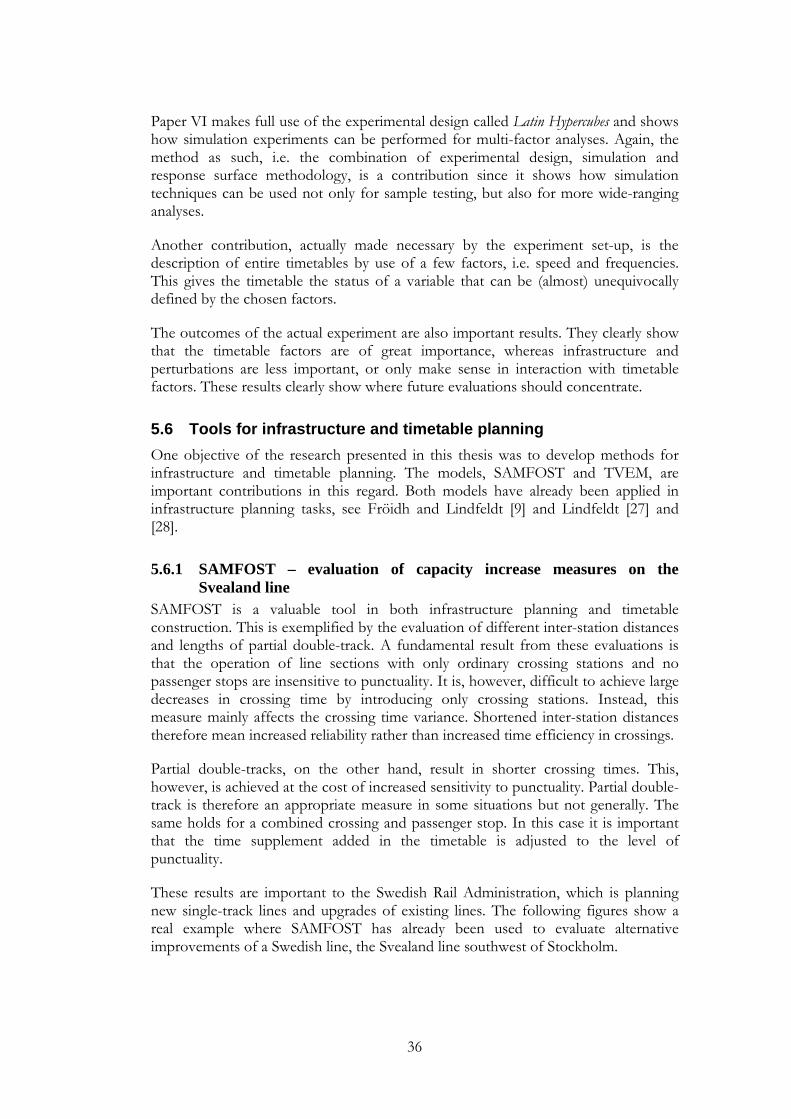
36
Paper VI makes full use of the experimental design called Latin Hypercubes and shows how simulation experiments can be performed for multi-factor analyses. Again, the method as such, i.e. the combination of experimental design, simulation and response surface methodology, is a contribution since it shows how simulation techniques can be used not only for sample testing, but also for more wide-ranging analyses.
Another contribution, actually made necessary by the experiment set-up, is the description of entire timetables by use of a few factors, i.e. speed and frequencies. This gives the timetable the status of a variable that can be (almost) unequivocally defined by the chosen factors.
The outcomes of the actual experiment are also important results. They clearly show that the timetable factors are of great importance, whereas infrastructure and perturbations are less important, or only make sense in interaction with timetable factors. These results clearly show where future evaluations should concentrate.
5.6 Tools for infrastructure and timetable planning
One objective of the research presented in this thesis was to develop methods for infrastructure and timetable planning. The models, SAMFOST and TVEM, are important contributions in this regard. Both models have already been applied in infrastructure planning tasks, see Fröidh and Lindfeldt [9] and Lindfeldt [27] and [28].
5.6.1 SAMFOST – evaluation of capacity increase measures on the Svealand line
SAMFOST is a valuable tool in both infrastructure planning and timetable construction. This is exemplified by the evaluation of different inter-station distances and lengths of partial double-track. A fundamental result from these evaluations is that the operation of line sections with only ordinary crossing stations and no passenger stops are insensitive to punctuality. It is, however, difficult to achieve large decreases in crossing time by introducing only crossing stations. Instead, this measure mainly affects the crossing time variance. Shortened inter-station distances therefore mean increased reliability rather than increased time efficiency in crossings.
Partial double-tracks, on the other hand, result in shorter crossing times. This, however, is achieved at the cost of increased sensitivity to punctuality. Partial double-track is therefore an appropriate measure in some situations but not generally. The same holds for a combined crossing and passenger stop. In this case it is important that the time supplement added in the timetable is adjusted to the level of punctuality.
These results are important to the Swedish Rail Administration, which is planning new single-track lines and upgrades of existing lines. The following figures show a real example where SAMFOST has already been used to evaluate alternative improvements of a Swedish line, the Svealand line southwest of Stockholm.
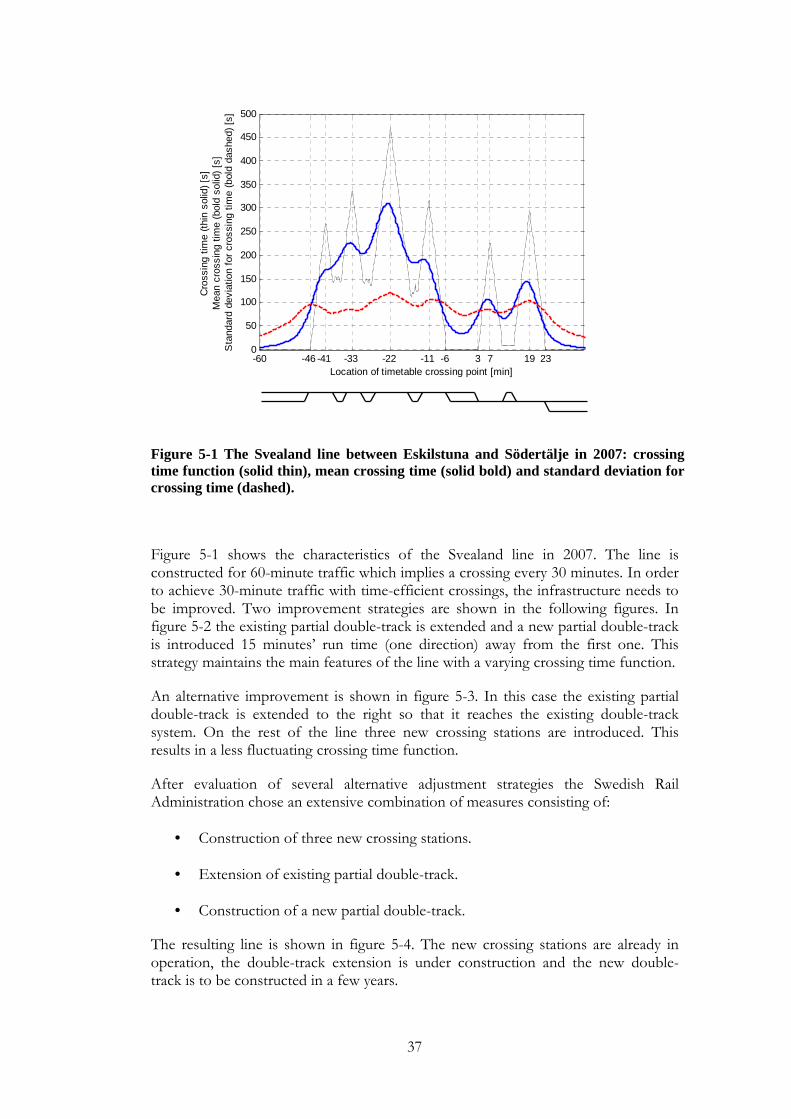
37
Figure 5-1 The Svealand line between Eskilstuna and Södertälje in 2007: crossing time function (solid thin), mean crossing time (solid bold) and standard deviation for crossing time (dashed).
Figure 5-1 shows the characteristics of the Svealand line in 2007. The line is constructed for 60-minute traffic which implies a crossing every 30 minutes. In order to achieve 30-minute traffic with time-efficient crossings, the infrastructure needs to be improved. Two improvement strategies are shown in the following figures. In figure 5-2 the existing partial double-track is extended and a new partial double-track is introduced 15 minutes’ run time (one direction) away from the first one. This strategy maintains the main features of the line with a varying crossing time function.
An alternative improvement is shown in figure 5-3. In this case the existing partial double-track is extended to the right so that it reaches the existing double-track system. On the rest of the line three new crossing stations are introduced. This results in a less fluctuating crossing time function.
After evaluation of several alternative adjustment strategies the Swedish Rail Administration chose an extensive combination of measures consisting of:
• Construction of three new crossing stations.
• Extension of existing partial double-track.
• Construction of a new partial double-track.
The resulting line is shown in figure 5-4. The new crossing stations are already in operation, the double-track extension is under construction and the new double-track is to be constructed in a few years.
-60 -46 -41 -33 -22 -11 -6 3 7 19 230
50
100
150
200
250
300
350
400
450
500
Location of timetable crossing point [min]
Cro
ssin
g tim
e (t
hin
solid
) [s
]M
ean
cros
sing
tim
e (b
old
solid
) [s
]S
tand
ard
devi
atio
n fo
r cr
ossi
ng t
ime
(bol
d da
shed
) [s
]
38
Figure 5-2 Improvement strategy: New and extended partial double-track. Crossing time function (solid thin), mean crossing time (solid bold) and standard deviation for crossing time (dashed).
Figure 5-3 Improvement strategy: New crossing stations and “eliminated” partial double-track. Crossing time function (solid thin), mean crossing time (solid bold) and standard deviation for crossing time (dashed).
-46 -41 -35 -31-26 -20 -16-13 -9 -5 230
50
100
150
200
250
300
350
400
450
500
Location of timetable crossing point [min]
Cro
ssin
g tim
e (t
hin
solid
) [s
]M
ean
cros
sing
tim
e (b
old
solid
) [s
]S
tand
ard
devi
atio
n fo
r cr
ossi
ng t
ime
(bol
d da
shed
) [s
]
-46 -41-37 -27 -22 -15-11 12 16 190
50
100
150
200
250
300
350
400
450
500
Location of timetable crossing point [min]
Cro
ssin
g tim
e (t
hin
solid
) [s
]M
ean
cros
sing
tim
e (b
old
solid
) [s
]S
tand
ard
devi
atio
n fo
r cr
ossi
ng t
ime
(bol
d da
shed
) [s
]
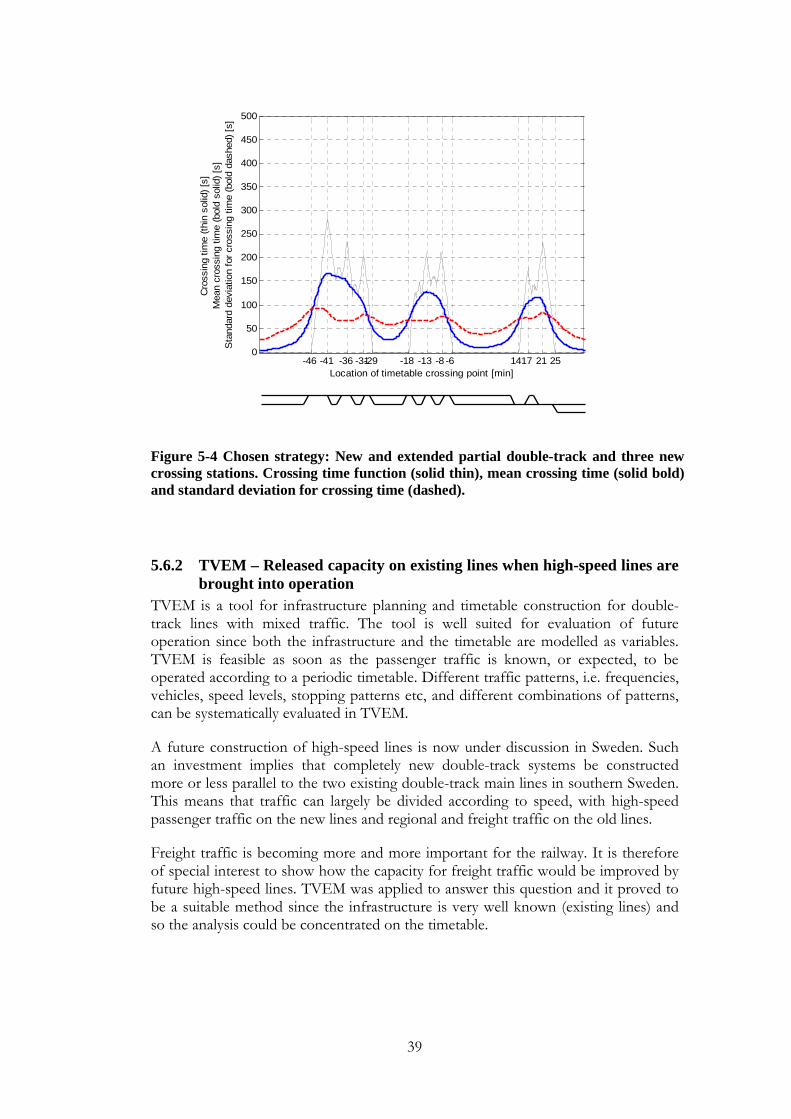
39
Figure 5-4 Chosen strategy: New and extended partial double-track and three new crossing stations. Crossing time function (solid thin), mean crossing time (solid bold) and standard deviation for crossing time (dashed).
5.6.2 TVEM – Released capacity on existing lines when high-speed lines are brought into operation
TVEM is a tool for infrastructure planning and timetable construction for double-track lines with mixed traffic. The tool is well suited for evaluation of future operation since both the infrastructure and the timetable are modelled as variables. TVEM is feasible as soon as the passenger traffic is known, or expected, to be operated according to a periodic timetable. Different traffic patterns, i.e. frequencies, vehicles, speed levels, stopping patterns etc, and different combinations of patterns, can be systematically evaluated in TVEM.
A future construction of high-speed lines is now under discussion in Sweden. Such an investment implies that completely new double-track systems be constructed more or less parallel to the two existing double-track main lines in southern Sweden. This means that traffic can largely be divided according to speed, with high-speed passenger traffic on the new lines and regional and freight traffic on the old lines.
Freight traffic is becoming more and more important for the railway. It is therefore of special interest to show how the capacity for freight traffic would be improved by future high-speed lines. TVEM was applied to answer this question and it proved to be a suitable method since the infrastructure is very well known (existing lines) and so the analysis could be concentrated on the timetable.
-46 -41 -36 -31-29 -18 -13 -8 -6 14 17 2521 0
50
100
150
200
250
300
350
400
450
500
Location of timetable crossing point [min]
Cro
ssin
g tim
e (t
hin
solid
) [s
]M
ean
cros
sing
tim
e (b
old
solid
) [s
]S
tand
ard
devi
atio
n fo
r cr
ossi
ng t
ime
(bol
d da
shed
) [s
]
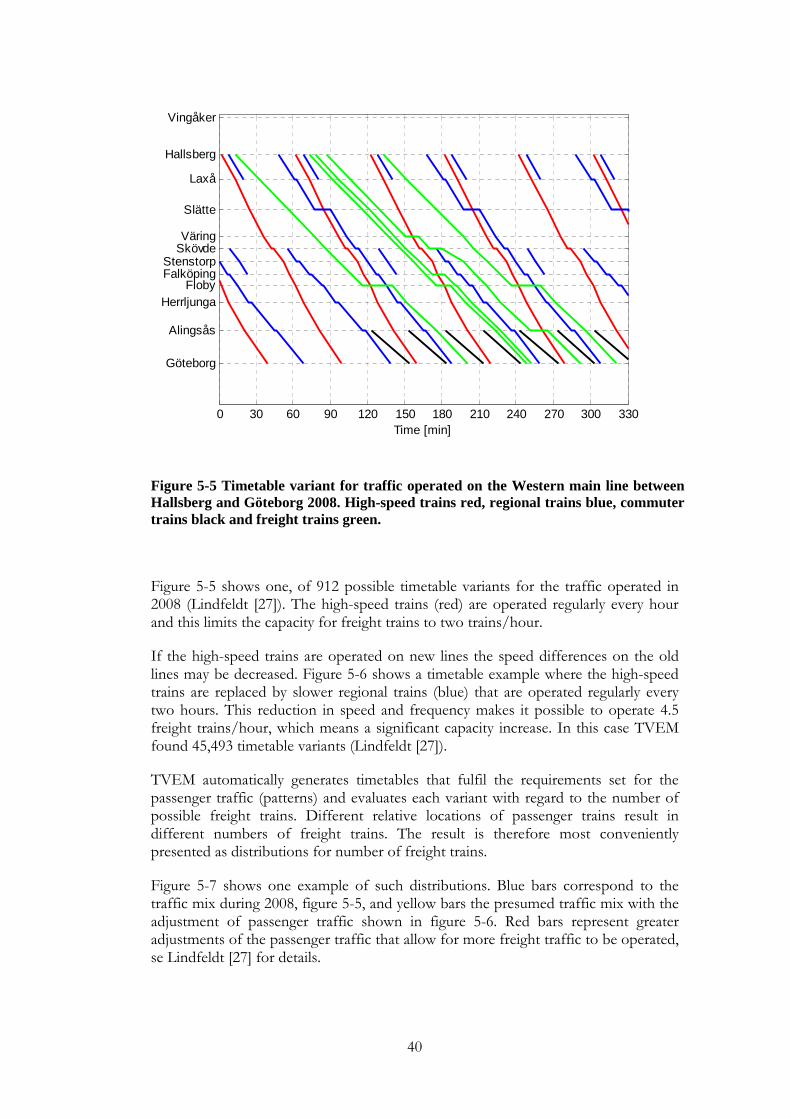
40
Figure 5-5 Timetable variant for traffic operated on the Western main line between Hallsberg and Göteborg 2008. High-speed trains red, regional trains blue, commuter trains black and freight trains green.
Figure 5-5 shows one, of 912 possible timetable variants for the traffic operated in 2008 (Lindfeldt [27]). The high-speed trains (red) are operated regularly every hour and this limits the capacity for freight trains to two trains/hour.
If the high-speed trains are operated on new lines the speed differences on the old lines may be decreased. Figure 5-6 shows a timetable example where the high-speed trains are replaced by slower regional trains (blue) that are operated regularly every two hours. This reduction in speed and frequency makes it possible to operate 4.5 freight trains/hour, which means a significant capacity increase. In this case TVEM found 45,493 timetable variants (Lindfeldt [27]).
TVEM automatically generates timetables that fulfil the requirements set for the passenger traffic (patterns) and evaluates each variant with regard to the number of possible freight trains. Different relative locations of passenger trains result in different numbers of freight trains. The result is therefore most conveniently presented as distributions for number of freight trains.
Figure 5-7 shows one example of such distributions. Blue bars correspond to the traffic mix during 2008, figure 5-5, and yellow bars the presumed traffic mix with the adjustment of passenger traffic shown in figure 5-6. Red bars represent greater adjustments of the passenger traffic that allow for more freight traffic to be operated, se Lindfeldt [27] for details.
0 30 60 90 120 150 180 210 240 270 300 330
Vingåker
Hallsberg
Laxå
Slätte
VäringSkövde
StenstorpFalköping
FlobyHerrljunga
Alingsås
Göteborg
Time [min]
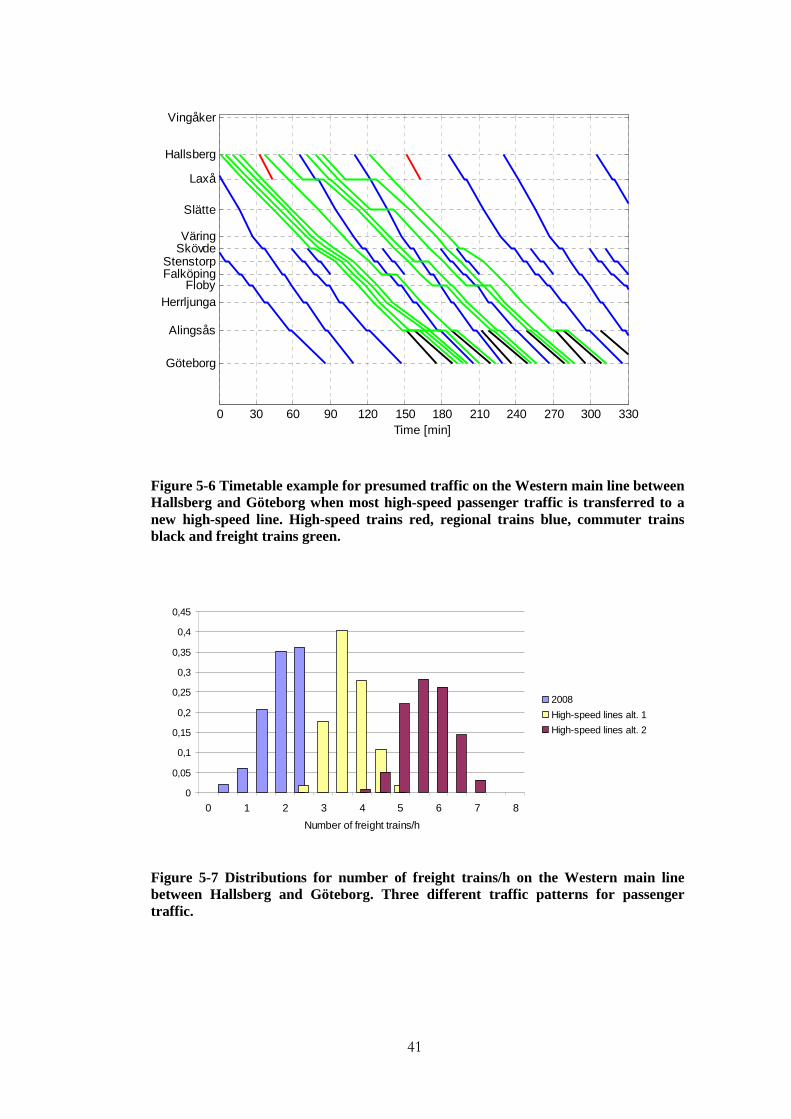
41
Figure 5-6 Timetable example for presumed traffic on the Western main line between Hallsberg and Göteborg when most high-speed passenger traffic is transferred to a new high-speed line. High-speed trains red, regional trains blue, commuter trains black and freight trains green.
0
0,05
0,1
0,15
0,2
0,25
0,3
0,35
0,4
0,45
0 1 2 3 4 5 6 7 8
Number of freight trains/h
2008
High-speed lines alt. 1
High-speed lines alt. 2
Figure 5-7 Distributions for number of freight trai ns/h on the Western main line between Hallsberg and Göteborg. Three different traffic patterns for passenger traffic.
0 30 60 90 120 150 180 210 240 270 300 330
Vingåker
Hallsberg
Laxå
Slätte
VäringSkövde
StenstorpFalköping
FlobyHerrljunga
Alingsås
Göteborg
Time [min]

42
TVEM has also been applied for studies of additional overtaking stations along the old (existing) main lines. This was believed to be an alternative to constructing high-speed lines. However, the analysis clearly showed that a separation of fast and slow trains is the only alternative if both passenger and freight traffic are to be increased in the future, see Lindfeldt [28].
43
6 Final remarks and future work This thesis deals with several fundamental operational properties of single and double-track railway lines. SAMFOST, TVEM, and the simulation experiments performed all contribute to the description of these properties. Having examined only simple operational cases it is natural to go on and also model more complex situations. Both SAMFOST and TVEM can be further developed.
Some complements that would make SAMFOST even more precise and useful are modelling of:
• Series of crossings.
• Internal delay sources, time supplements and catch-up effects.
• Congested situations and dispatching.
• Mixed traffic.
An obvious case of special interest is the effect of series of crossings that interfere. To model such cases it is natural to consider internal sources of disturbance, time supplements and their effects on operation, i.e. varying run times, catch-up effects etc. To do this delays that occur during the modelled train courses; dwell time extensions, driver behaviour etc, have to be included in the model.
Another situation, which is closely related to series of crossings, is operation during congestion. When more than two trains affect a crossing a second order of crossing time, which is caused by the position of other trains, is added. Analysing such situations would probably give valuable knowledge about capacity of single-track lines.
So far SAMFOST has only been used for analyses of homogenous passenger traffic. In reality, single-tracks are most often operated with mixed traffic. A natural continuation would therefore be to examine cases with mixed traffic, freight trains etc.
Another possible continuation is a further development of the timetable flexibility concept. This could be done either on the basis of the existing SAMFOST model, or on a further developed model that includes the features discussed above. Further knowledge of timetable flexibility may be valuable in the work of timetable construction as well as in the infrastructure planning.
Two principles for infrastructure design of single-tracks are examined in this thesis. The analysis of these designs shows that also other infrastructure strategies, e.g. combinations of partial double-track and stations, could be of interest. Therefore, a natural extension of the work is to examine more infrastructure configurations.
44
TVEM might also be enhanced in several ways:
• Modelling of single-tracks.
• Other measures for evaluation and additional constraints on accepted timetables.
• Enhanced algorithm.
• Network analysis.
The combinatorial approach applied in TVEM can also be used for a corresponding analysis of single-track lines. Such an adjustment requires a change in the scheduling algorithm. Since capacity on single-track lines is much lower than on double-track, the computational effort, i.e. number of timetable variants, is probably lower for the single-track case.
The existing TVEM might also be adjusted for evaluation of measures other than pure capacity. Two examples are scheduled delays and patterns for utilisation of overtaking stations. Another idea is to add constraints for accepted timetables and analyse the features of timetable variants that meet these constraints.
TVEM uses complete enumeration of the solution space and this method is not very efficient from a computational point of view. Enhancement of the algorithm would decrease calculation times and make it possible to analyse entire networks of railway lines.
The thesis also shows how simulation can be applied for multi-factor analysis. The calibration work showed that simulation is an accurate method. A natural continuation is to perform further calibrations, i.e. evaluate more factors, other infrastructures (existing lines), other timetables and other perturbation situations, etc. Such an analysis would help develop simulation as a method of analysis further.
Sufficiently calibrated simulation models may be used for further experiments. Examples of special interest are more complicated traffic mixes, operation of station areas, etc. To succeed with this type of analysis one has to develop methods to describe the timetable unequivocally with just a few factors, find the “true” distributions for run time extensions, etc.
The work has explicitly shown the importance of punctual operation. Since delays are a great problem in railway operation, deeper studies of how delays affects timetable flexibility, capacity and infrastructure design are valuable throughout the railway sector.
The infrastructure measures examined in this thesis affect the operation properties quite differently. Construction costs also differ. It is therefore of interest to compare different infrastructure measures. A complete comparison requires evaluation of socioeconomic factors. This includes the cost of construction, operation and maintenance, as well as benefits from increased capacity and reduced delays. The benefits are tightly connected to traffic factors such as travel times, frequency of

45
service etc. This type of comparison is a natural continuation of the evaluation presented in this thesis.
All these possible fields of further study aim to increase knowledge of a complex technical system that is surprisingly difficult to model. Nevertheless, more knowledge of railway operation is essential if the railway is to contribute to the development of society and remain an efficient and sustainable transport system.

46
47
7 References
[1] Barton, R., “Designing simulation experiments”, Proceedings of the 2004 Winter Simulation Conference, 2004.
[2] Brännlund, U., Lindberg, P.O., Nõu, A., Nilsson, J-E., “Railway timetabling using Lagrangian relaxation”, Transportation science, vol. 32, no. 4, pp. 358-369, 1998.
[3] Carey, M., “Ex ante heuristic measures of schedule reliability”, Transportation Research, B 33, pp. 473-494, 1999.
[4] Carey, M., Carville S., “Scheduling and platforming trains at busy complex stations”, Transportation Research, A 37, 195-224, 2003.
[5] Chen, B., Harker, P. T., “Two moments estimation of the delay on single-track rail lines with scheduled traffic”, Transportation Science, vol. 24, pp. 261-275, 1990.
[6] Cioppa, T.M., Lucas, T.W., “Efficient nearly orthogonal and space-filling Latin Hypercubes”, Technometrics, vol. 49, no. 1, pp. 45-55, 2007.
[7] Frank, O., “Two way traffic in single line of railway”, Operations Research, vol. 14, pp. 801-811, 1966.
[8] Fröidh, O., “Market effects of regional high-speed trains on the Svealand line”, Journal of Transport Geography, vol. 13, no. 4, pp. 352-361, 2005.
[9] Fröidh, O., Lindfeldt O., Svealandsbanans första 10 år – erfarenheter för framtiden av tågtrafiken och resandet, KTH, Stockholm, Sweden, 2008. (in Swedish)
[10] Goverde, R.M.P., “Railway timetable stability analysis using max-plus system theory”, Transportation Research, B 41, pp. 179-201, 2007.
[11] Hansen, I.A., “Station capacity and stability of train operations”, In: J. Allan, R.J. Hill, C.A. Brebbia, G. Sciutto & S. Sone, (eds.), Computers in Railways VII, pp. 809-816, WIT Press, Southampton, 2000.
[12] Hellström, P., Analysis and evaluation of systems and algorithms for computer aided train dispatching, Licentiate Thesis, Uppsala University, Sweden, 1998.
[13] Higgins, A., Kozan, E., “Modelling delay risks associated with train schedules”, Transportation planning and Technology, vol. 19, pp. 89-108, 1995.
[14] Higgins, A., Kozan, E., Ferreira, L., “Optimal scheduling of trains on a single line track”, Transportation Research, B 30, pp. 147-161, 1996.
[15] Higgins, A., Kozan, E., Ferreira, L., “Modelling the number and location of sidings on a single line railway”, Computers Operations Research, vol. 24, no. 3, pp. 209-220, 1997.
[16] Ho, T.K., Mao, B.H., Yuan, Z.Z., Liu, H.D., Fung, Y.F., “Computer simulation and modeling in railway applications”, Computer Physics Communications, vol. 143, pp. 1-10, 2002.
[17] Huisman, T., Boucherie, R. J., “Running times on railway sections with heterogeneous train traffic”, Transportation Research, B 35, pp. 271-292, 2001.
48
[18] Huisman, T., Boucherie, R. J., van Dijk, N. M., “A solvable queuing network model for railway networks and its validation and applications for the Netherlands”, European Journal of Operational Research, vol. 142, pp. 30-51, 2002.
[19] Kleijnen, J.P.C., Sanchez, S.M., Lucas, T.W. and Cioppa, T.M., “A user’s guide to the brave new world of simulation experiments”, INFORMS Journal on Computing, vol. 17, no. 3, pp. 263-289, 2005.
[20] Koutsopoulos, H.N., Wang, Z., “Simulation of urban rails operations. Application framework”, Journal of the Transportation Research Board No. 2006, Washington DC, pp 84-91, 2007
[21] Kroon, L.G., Romeijn H.E. & Zwaneveld P.J., “Routing trains through railway stations: complexity issues”, European Journal of Operational Research, vol. 98, pp. 485-498, 1997.
[22] Liebchen, C., “Symmetry for periodic railway timetables”, Electronic Notes In Theoretical Computer Science, vol. 92, pp. 34-51, 2004.
[23] Liebchen, C., Möhring, R.H., “A case study in periodic timetabling”, Electronic Notes In Theoretical Computer Science, vol. 66, pp. 18-31, 2002.
[24] Lindahl, A., Infrastruktur för flexibel tågföring – Kapacitetsanalys av föribgångar på en dubbelspårssträcka, KTH, Stockholm, Sweden, 2002. (in Swedish)
[25] Lindfeldt, A., Kapacitetsanalys av järnvägsnätet i Sverige, delrapport 2, KTH, Stockholm, Sweden, 2009. (in Swedish)
[26] Lindfeldt, O., “Evaluation of punctuality on a heavily utilised railway line with mixed traffic”, In: Allan, J., Arias, E., Brebbia, C.A., Goodman, C.J., Rumsey, A.F., Sciutto, G., Tomii, N., (eds.), Computers in Railways XI, pp. 545-553, WIT Press, Southampton, 2008.
[27] Lindfeldt, O., Kapacitet för godståg på Västra och Södra stambanan, KTH, Stockholm, Sweden, 2008. (in Swedish)
[28] Lindfeldt, O., Kapacitet för godståg på Västra och Södra stambanan efter uppgradering till sth 250 km/h, KTH, Stockholm, Sweden, 2009. (in Swedish)
[29] Mattsson, L-G., “Railway capacity and train delay relationships“, In: Murray, A., Grubesic, T. (eds.), Critical Infrastructure: Reliability and Vulnerability, pp. 129-150, Srpinger-Verlag Berlin Heidelberg, 2007.
[30] Medanic, J., Dorfman, M.J., “Efficient scheduling of traffic on a railway line”, Journal of optimization theory and applications, vol. 115, no. 3, pp. 587-602, 2002.
[31] Myers, R.H., Montgomery, D.C., Response Surface Methodology, John Wiley & Sons, Inc., USA, ISBN 9787-0-471-41255-7, 2002.
[32] Nachtigall, K., “Periodic network optimization with different arc frequencies”, Discrete Applied Mathematics, vol. 69, pp. 1-17, 1996.
[33] Nelldal, B-L., Lindfeldt, O., Sipilä, H., Wolfmaier, J., Förbättrad punktlighet på X2000 – analys med hjälp av simulering, KTH, Stockholm, Sweden, 2008. (in Swedish)
49
[34] Petersen, E. R., “Over-the-road transit time for a single track railway”, Transportation Science, vol. 8, pp. 65-74, 1974.
[35] Petersen, E. R., Taylor, A. J., “Design of a single track rail line for high-speed trains”, Transportation Research, A 21, pp. 47-57, 1987.
[36] Radtke, A., Software tools to model the railway operation, Habilitation at the University of Hannover, 2005.
[37] Rodriguez, J., “A constraint programming model for real-time train scheduling at junctions”, Transportation Research, B 41, pp. 231-245, 2007.
[38] Rudolph, R., Entwicklung von Strategien zur optimierten Anordnung und Dimensionierung von Zeitzuschlägen im Eisenbahnbetrib”. Wissenschaftliche Arbeiten des Instituts für Verkehrswesen, Eisenbahnbau und –betrieb, Universität Hannover, vol. 59, PhD Thesis, Hamburg: Eurailpress, 2004.
[39] Sanchez, S., “Work smarter, not harder: guidelines for designing simulation experiments”, Proceedings of the 2007 Winter Simulation Conference, 2007.
[40] Schutter, B. D., van den Boom, T., Hegyi, A., “A model predictive control approach for recovery from delays in railway systems”, Proceedings of the 81st Annual Meeting of the Transportation Research Board, Washington DC, 2002.
[41] Schwanhäußer, W., “Die Bemessung der Pufferzeiten im Fahrplangefüge der Eisenbahn“. Veröffentlichungen des Verkehrswissenschaftlichen Instituts der RWTH Aachen, vol. 20, PhD Thesis, 1974.
[42] Siefer, T., “Simulation“, In: Hansen, I.A., Pachl, J., eds. Railway timetable and traffic, ch. 9, pp. 155-169, Hamburg: Eurailpress, 2008.
[43] Törnquist, J., “Railway traffic disturbance management – An experimental analysis of disturbance complexity, management objectives and limitations in planning horizon”, Transportation Research, A 41, pp. 249-266, 2007.
[44] Törnquist, J., Persson J. A., “N-tracked railway traffic re-scheduling during disturbances”, Transportation Research, B 41, pp. 342-362, 2007.
[45] Vromans, M.J.C.M., Dekker, R., Kroon, L.G., “Reliability and heterogeneity of railway services”, European Journal of Operational Research, vol. 172, pp. 647-665, 2006.
[46] Weits, E.A.G., “Simulation of railway traffic control”, International Transactions in Operational Research, vol. 5, no. 6, pp. 461-469, 1998.
[47] Wendler, E., “Queuing“, In: Hansen, I.A., Pachl, J., eds. Railway timetable and traffic, ch. 5, pp. 106-117, Hamburg: Eurailpress, 2008.
[48] Wendler, E., “Influences of ETCS on the capacity of lines“, In: Winter, P., ed. Compendium on ERTMS, ch. 8.4, pp. 211-223, Hamburg: Eurailpress, 2009.
[49] Yuan, J., Hansen I.A., “Optimizing capacity utilization of stations by estimating knock-on delays”, Transportation Research, B 41, 202-217, 2007.
[50] Zwaneveld P.J., Kroon, L.G., Romeijn H.E., Salomon, M., Dauzére-Pérès, S., van Hoesel, S.P.M., Ambergen, H.W., “Routing trains through railway stations: model formulation and algorithms”, Transportation Science, vol. 30, 485-498, 1996.

50
51
Acknowledgements The research project behind this thesis, “Future infrastructure and train run quality”, has been funded by the National Rail Administration (Banverket) through the KTH Railway Group and I would like to express my great gratitude to Banverket for the funds they have provided.
Professor Bo-Lennart Nelldal and Professor Lars-Göran Mattson have been my supervisors and my most important supporters. My sincere thanks for all your support, discussions and guidance when the going was difficult. The project has been monitored by a reference group who have met twice a year. My thanks to Magnus Wahlborg, Magdalena Grimm, Hans Dahlberg, Roger Nordefors and Håkan Berell at Banverket, Pelle Andersson at Green Cargo, Sirpa Holmroos and Dan Olofsson at SJ AB, and Bengt Sandblad at Uppsala University for your participation in this group. A special thank-you goes to Magnus, who has acted as Banverket’s contact person and convenor of the group.
Thanks also to Prof. Dr. Ing. Thomas Siefer at the Institute for Transport, Railway Construction and Operation (IVE) at Leibniz Universität Hannover for allowing me to work as guest researcher at the institute during 2009. I would also like to take this opportunity to thank all concerned at IVE. I will always remember my time in Hannover with great pleasure since it provided so much fuel for both my research and myself as a person.
The thesis has been reviewed once or twice by independent examiners during writing. I would like to thank Dr Piotr Lukaszewicz and Dr Nils Olsson for their views on my licentiate thesis and Dr Anders Peterson for his valuable comments on my doctoral thesis. Professor Haris Koutsopoulos has contributed his knowledge of simulation and experiment design.
The foundation for this work was laid early, during my parents’ generation. My mother Britta and her brothers lived close to an important railway junction, Djursholms Ösby on the Roslag Line, when they were growing up in the 1940s. My uncle Ingemar cultivated his interest in railways at the station, while Britta was more interested in social issues, animals and travel. My father Boris grew up in Stockholm’s inner city and developed an interest in the city’s tramways, mathematics and the natural sciences at an early age.
The Roslag Line also left its mark on my own childhood and adolescence. What attracted me most was its reliability, the regularity of the trains and the rich variation among the vehicles. I also wish to thank my brothers, Erik and Anders. You have meant so much to me, both while we were growing up and during the rest of my life.
At school, the scientific subjects quickly became my strongest. However, competent teachers in languages, law and the social sciences managed to awaken an interest also in these subjects. I thank them for their efforts that have enriched my life and contributed to this thesis.
52
I joined the scouts at the age of ten and learned to plan, organise and lead. I also had the opportunity to discover new parts of Sweden. Thanks to all the scout leaders and my fellow scouts for all the companionship and all the experiences, trips and adventures. I would especially like to thank my fellow members of the Fulner rover scout section. Our adventures are always special, whether they be to Lapland, France or just to the scout hut.
After upper secondary school, the Royal Institute of Technology (KTH) was the obvious choice. I studied Engineering and Business Management to be able to combine engineering with economics and leadership. My studies did not present any difficulties and after a year I supplemented my course of study with railway engineering subjects. Evert Andersson’s and Mats Berg’s course in Railway engineering and rolling stock reawakened my interest in the railway. Few courses have been as interesting as that one!
I continued to seek challenges and began to work as a conductor on the Roslag Line in my spare time. It was a time of many early mornings and late nights, pleasant encounters with travellers, delays, out-of-the-ordinary events, and lots of train crossings. My sincere thanks to all colleagues who turned this time into an experience. Their knowledge of railway operation and organisation have been invaluable for my research.
During my fifth year at KTH I wrote my degree thesis for Bo-Lennart Nelldal at the Division of Traffic and Logistics. Its subject was the delay problem complex on the Svealand Line and Bo-Lennart was an excellent supervisor. My research can be considered to be a direct continuation of that degree project. Eva Lejdbrandt at Rail Tarffic Management (Tågtrafikledningen) had originally commissioned the study.
After graduation in 2001, I was employed as a quality administrator at Banverket’s Traffic section. Soon I found myself working as a traffic expert in the Eastern Region’s infrastructure studies and projects. My thanks to all the project managers, planners and engineering experts who taught me how railway projects are planned and conducted. Thanks also for all the creative planning meetings with drawings, profiles, sketches and compromises.
After three years at Banverket I felt that the experience I had gained could be put to use in a research project. Especial thanks to Sven Bårström, Björn Wahlström and Hans Dahlberg for encouraging me.
My scientific findings have been reported at various conferences around Europe. Dr Björn Kufver, whose acquaintance I made during the planning of the City Line, helped me at the first few conferences and has since been a recurring support. A special thank you for your work on my first paper about the City Line (London 2004) that got my research off to a flying start.
The International Association of Railway Operations Research, IAROR, was set up in 2005. The organisation’s conferences in Delft, Hannover and Zürich and the summer school in Timetable Optimisation (Delft 2008) have been important sources of inspiration and contacts in my research.
53
My joy of discovery has also found expression in the trips I have undertaken as a doctoral candidate. All the places I have visited and all the people I have met have really given my research breadth and context. Thanks for all the dialogues, meetings, study visits, excursions, hikes, breakfasts, lunches, coffee breaks, dinners, work-outs and other occasions that you have shared with me.
Alongside my research I have also had the opportunity to apply my findings in the real world through various kinds of special assignments for Banverket. Especial thanks are due to Björn Eklund and others at Banverket for these assignments. SJ AB, Sweden’s largest passenger traffic operator, has also contributed real-world assignments.
Carl Grauers, a SJ AB locomotive driver, has been my “driving instructor” and has given me much valuable experience of railway operation from the driver’s perspective. Thank you for all the hours in the cabs of different kinds of train all round Sweden.
My time as a doctoral candidate has meant development on many planes, both professional and personal. In my research I have managed to combine my theoretical knowledge about and practical experience of railway operation and planning. Innumerable lectures, meetings and seminars have taught me to speak as well as to listen. Supervising degree projects and supporting colleagues have trained me in leadership. I wish to offer my special thanks to all my colleagues at the Division of Traffic and Logistics, who have supported me during my time as a doctoral candidate and contributed to both my thesis and its content and my personal development.
With the support of my supervisors, funding contributors, colleagues, family, friends and others I have been able to combine all my interests and create something that I believe will contribute to the development of the railway. I will remember my time as a doctoral candidate with warmth, happiness and gratitude.
Stockholm March 2010
Olov Lindfeldt


![National Railway Safety Regulator Act [No. 16 of 2002] · associated with the railway operation which may impact on the safety of persons ... ( AUGUST 2002 Act NATIONAL RAILWAY SAFETY](https://img.dokumen.tips/doc/110x75/5acc7e067f8b9a93268c83a5/national-railway-safety-regulator-act-no-16-of-2002-with-the-railway-operation.jpg)