Embed Size (px)
Citation preview
Microwave Radiometer Trial Report Version 1.0 Gaffard & Hewison
1
Technical Report � TR26 Version 1.0 25 July 2003
Met Office Observations Development (OD)
Radiometrics MP3000 Microwave Radiometer
Trial Report
Version 1.0 25 July 2003
Catherine Gaffard Tim Hewison
Met Office Tel: +44 (0) 1344 85 5638 Beaufort Park, Easthampstead Fax: +44 (0) 1344 85 5897 Wokingham, Berkshire E-mail: [email protected] RG40 3DN, UK
Microwave Radiometer Trial Report Version 1.0 Gaffard & Hewison
2
Contents 1. Executive Summary....................................................................................... 3 2. Introduction..................................................................................................... 4 3. Description of Radiometer ........................................................................... 5
Channel Frequencies ...................................................................................................5
Observation Cycle ........................................................................................................6
4. Performance of Neural Network Retrievals .............................................. 7 Results for software v2.14 ..........................................................................................7
Results for software v2.20 ........................................................................................ 11
Conclusion of Neural Network Retrieval Validation ............................................. 11
5. Comparison with GPS Integrated Water Vapour (IWV) ........................ 13 6. Case Studies of Combination with Other Instruments......................... 14
Development of the Convective Boundary Layer Case Study........................... 14
Cloud Evolution Case Study..................................................................................... 17
Clear air situation........................................................................................................ 19
Fog................................................................................................................................. 21
Summary of Case Studies......................................................................................... 23
7. Reliability ....................................................................................................... 24 Performance of Surface Met Sensors ............................................................................ 25
8. Conclusions and Recommendations....................................................... 27 Specific Recommendations for Radiometer Manufacturer ................................ 28
Specific Recommendations for Upper Air Technology Centre.......................... 28
9. References..................................................................................................... 28
Microwave Radiometer Trial Report Version 1.0 Gaffard & Hewison
3
1. Executive Summary A microwave radiometer was procured from Radiometrics Corporation to evaluate its capabilities of providing profiles of temperature, humidity and cloud in the lower troposphere. This is part of the �Automation of Temperature and Humidity Profiles In The Lower Troposphere� Project [File Ref. M/O(OD)2U/8/5]. The radiometer has been operated at Camborne from 20 February 2002 to 18 March 2003. During this period the radiometer has proved to be very reliable, and needed only occasional intervention and calibration every few months by liquid nitrogen. The required interval is under review, but the procedure for these calibrations has now been agreed by Health & Safety. The mounting tripod has been replaced due to concerns about corrosion due to salt water spray. A mirror used by its integral infrared radiometer has also been replaced with an Aluminium alloy one, as the gold plating was found to degrade rapidly. Mechanically, the instrument is now believed to be sufficiently robust for operational use. During the first 11 months of the trial, the radiometer made one measurement every 14 minutes. The atmospheric variability can be significant over this period, and a software modification now allows the observation cycle to be improved to allow 1 retrieval approximately every 2 minutes. Currently, the radiometer samples each channel sequentially, taking 40 s to integrate measurements from all 12 channels. We are still concerned that atmospheric changes during this period may degrade the retrievals in rapidly changing conditions. This will be addressed by a future firmware upgrade. Scattering by large rain drops means the radiometer can not make any useful atmospheric observations during rain. Although a mechanism is incorporated to dry the radiometer after rain, this is found to be inadequate, as comparison with GPS measurements at Camborne show substantial biases can occur for up to 3 hours after rain, which is not flagged by the quality control. It is also desirable for the radiometer to operate in light drizzle and fog. The manufacturer has quoted to upgrade the blower, which is expected to improve the performance in these conditions. The radiometer was supplied with a neural network algorithm to retrieve profiles of temperature, humidity and liquid water density. The temperature and humidity profiles have been validated against radiosondes, and found to be significantly better than a simple retrieval based on surface observations. The r.m.s. error in the temperature profiles increases rapidly from 0.5 K at the surface to 1.5 K at 1 km and more slowly to 1.8 K at 5 km. The humidity profiles are better than the reference model below 4 km. Development is underway of a variational method to assimilate data from the radiometer into Numerical Weather Prediction models. To optimise the use of these data, it is essential to understand the error characteristics of the radiometer, which are discussed in the sister report, �Radiometrics MP3000 Microwave Radiometer: Performance Assessment� [Hewison & Gaffard, 2003]. During the trial, a good working relationship has been established with the manufacturer, which has resulted in a number of improvements already. Further feedback is being supplied to enable the development of a radiometer optimised for operational use.

Microwave Radiometer Trial Report Version 1.0 Gaffard & Hewison
4
2. Introduction A microwave radiometer was procured from Radiometrics Corporation to evaluate its capabilities of providing profiles of temperature, humidity and cloud in the lower troposphere. This is part of the �Automation of Temperature and Humidity Profiles In The Lower Troposphere� Project. The radiometer has been operated at Camborne for more than 1 year since 20 February 2002. This provides a good data set to evaluate its reliability and performance against co-located radiosondes. During this period, there have been 3 intensive observation periods, when radiosondes were launched hourly. These case studies are studied to investigate the potential of this technique to improve the observations of specific events: development of the convective boundary layer, cloud evolution and clear air. A range of other instruments were also operated at Camborne during the trial. In the future we hope to enhance the vertical resolution of the retrievals from ground-based microwave radiometers with co-located active instruments, such as wind profilers and ceilometers. Data from these instruments is also compared for the case studies. On 3 February 2003, after almost 1 year of operating at Camborne, new control software, v2.20 was installed on the radiometer, replacing v2.14. This introduced several improvements to the observation cycle, so data since then will be analysed separately in this report. This report first describes the radiometer and the principles of its operation and calibration. Some case studies are presented in Section 6 to show the radiometer�s ability to improve our understanding of common problems facing in short range weather forecasting. Finally, the radiometer�s reliability is assessed, followed by conclusions and recommendations for future development needed to optimise the use of its data in NWP. A sister report [Hewison & Gaffard, 2003] presents a performance assessment of the radiometer during this trial in terms of random noise and systematic bias of its brightness temperatures.
Figure 1 � Example of Temperature, Humidity and Liquid Water profiles retrieved by neural network from radiometer observations. Data from Camborne 25/4/02 between
passage of Cold Front (00:00) and Warm Front (02:00 following day).

Microwave Radiometer Trial Report Version 1.0 Gaffard & Hewison
5
3. Description of Radiometer The Radiometrics MP3000 is a microwave radiometer designed to retrieve temperature, humidity and cloud profiles in the lower troposphere. It is enclosed in a US style �mailbox�, mounted on a tripod, as shown in Figure 2. The system also include sensors for atmospheric pressure, temperature and humidity, a rain sensor, as well as an infrared radiometer (Heimann KT19.85) to measure the cloud base temperature. This views zenith through a small gold plated mirror on the top of the instrument enclosure.
Figure 2 - Radiometrics MP3000 Microwave Radiometer, mounted on aluminium tripod with polystyrene calibration target filled with Liquid Nitrogen [Courtesy of Mike Exner]
The microwave radiometer nominally views in the zenith direction. Incoming radiation is transmitted through a proprietary microwave dielectric window onto a planar mirror and into a Gaussian Optics Antenna, comprising a dielectric lens, polarising grid (to couple both bands onto a common axis) and two corrugated feedhorns. These feed two independent receiver chains, which are mounted in thermally insulated enclosures.
Channel Frequencies It is nominally a 12 channel instrument, although in practice any combination of channels can be selected within the following bands: 22-30 GHz and 51-59 GHz. Each band is received and detected independently, although all channels use a common frequency synthesiser, which must be switched to observe each channel. In the current hardware configuration, it takes ~2 s to switch frequencies, although this may be reduced substantially in the future. This results in the observations not being coincident in all channels, and taking ~40 s to sample a set of 12 channels. Atmospheric variability during this period can introduce random noise on the observations, discussed in the performance assessment [Hewison & Gaffard, 2003]. Radiometrics have suggested the sampling will be improved with future firmware upgrades to the existing hardware. This will allow much more rapid switching between channels so their integration periods could be multiplexed to reduce the effective time between observations in different channels to ~1 s. This will require a substantial overhaul of the control and
Infrared Radiometer
Liquid Nitrogen Calibration Target
Microwave Window (obscured) Rain sensor
Heater Blower Enclosure Aluminium
Tripod

Microwave Radiometer Trial Report Version 1.0 Gaffard & Hewison
6
processing software. It is anticipated that these changes will be offered to owners of existing radiometers during 2003. The centre frequencies of the channels have remained unchanged during this trial. These values were derived as an optimal set by selecting those frequencies, which produced Eigenvalues with the maximum information content [Solheim et al., 1996]. However, this analysis was based on radiative transfer models run using radiosonde data from Denver, Oklahoma City and West Palm Beach (FL), which may not be applicable to the British climate. Each channel has dual sidebands, with 3dB bandwidths of 150 MHz, centred 115 MHz from the channel centre, which is defined by the 6-stage bandpass filter. So it detects radiation in the band ±(40-190) MHz each side of the centre frequency.
Observation Cycle Originally the radiometer was supplied with control software v2.14. This provided an default observation cycle of ~14 minutes, during which it would view the black body to measure the radiometer�s gain and offset, attempt one tip curve and take one set of zenith brightness temperature measurements and retrieve a profile. If the rain sensor indicated rain, it would skip the tip curve, which reduced the observation cycle to ~7 minutes. A breakdown of the timing is given in Table 1.
Table 1 - Observation Cycle in minutes and seconds
Dry RainyBlack Body 03:39 03:39 Black Body 01:00 Black Body 01:00Tip Curve 06:15 Zenith View 00:40 Zenith View 00:40Zenith View 01:06 01:06 Tip Curve 01:40 Black Body 01:00Miscellaneous 03:06 03:06 Zenith View 00:40 Zenith View 00:40Total 14:06 07:51 Total 04:00 Total 04:00
v2.14 v2.20 4_min.prcNormal
v2.20 4_min.prcAround noon
As a result of feedback from our trial, Radiometrics released a new version of the control software to improve the observation cycle, and reduce the radiometer biases. Since 3 February 2003, the radiometer has been operated using v2.20 of the control software. This allows much greater control of the observation cycle. By default, it integrates each view for 0.5 s, and doesn�t allocate so much time to pre-heating the noise diodes to ensure they are stable, as this was found to make no difference. This greatly speeds up the observing cycle. The impact of reducing the integration time is addressed in Section 4. After some initial experiments, it was configured to observe in a 4 minute cycle: �4_min.prc�. During this time, it views the black body, attempts a tip curve (if it�s not raining) and takes 2 sets of zenith observations, producing a retrieval from each one. The timings used in this report are summarised in Table 1, but may be changed. It is important to maximise the fraction of time the radiometer is observing the sky for many reasons. Ultimately, increasing the integration time improves the signal to noise ratio. Higher sampling rates may allow more realistic representation of small-scale structure in the atmosphere. This is important to understand these features and for real-time neural network retrievals. The observations should be representative of the part of the atmosphere that is to assimilated into the NWP model. This may require several observations to be averaged prior to assimilation.
Microwave Radiometer Trial Report Version 1.0 Gaffard & Hewison
7
4. Performance of Neural Network Retrievals The temperature, water vapour, liquid profiles, integrated water vapour and liquid water are retrieved using a neural network. Radiometrics have defined the neural network to retrieve profile variables at fixed altitudes: 100 m resolution in the first 2 km, 200 m thereafter. This training used a radiative transfer model [Rosenkranz, 1998] with 10 years of operational radiosonde data from Camborne Radiometer measurements have been collocated in time with all the RS80 radiosondes launched at Camborne during the period of the trial. Temperature and humidity data have been extracted from high resolution radiosonde profiles at the levels nearest those of the radiometer�s profiles. Only observations reported without rain were used. Because of the upgrade of the radiometer software (version 2.14 to v2.20) the corresponding sets of data were compared with the radiosondes separately.
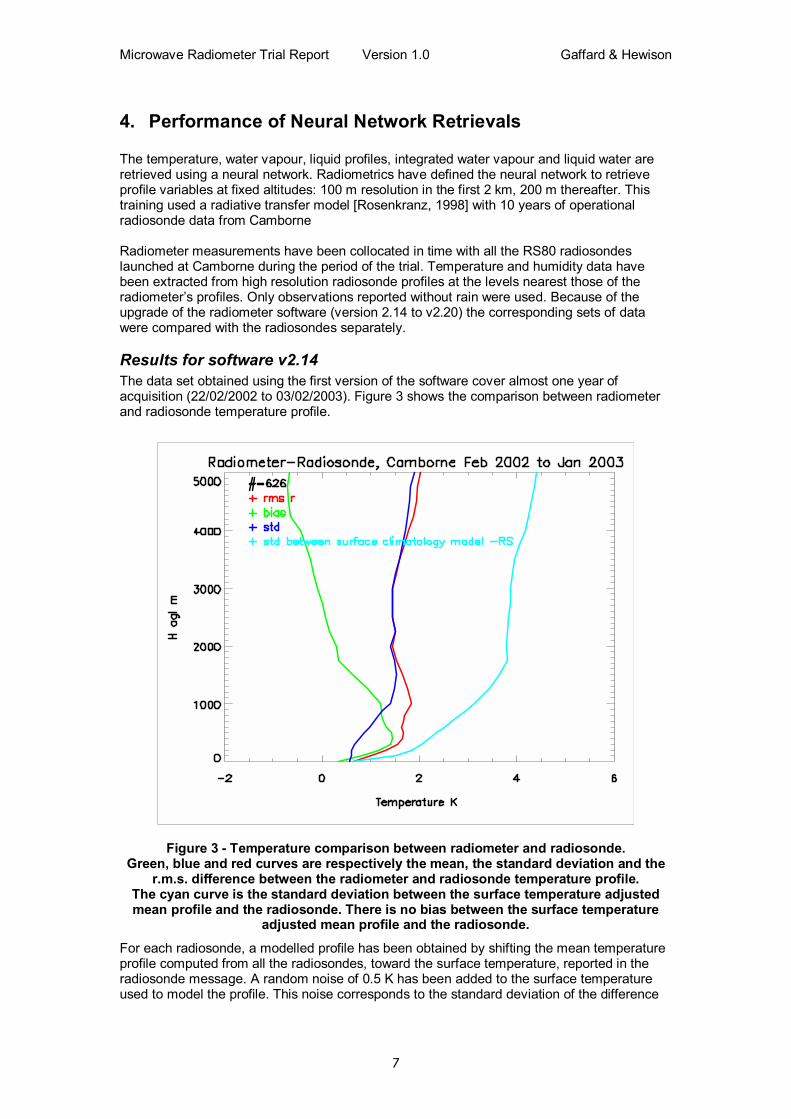
Results for software v2.14 The data set obtained using the first version of the software cover almost one year of acquisition (22/02/2002 to 03/02/2003). Figure 3 shows the comparison between radiometer and radiosonde temperature profile.
Figure 3 - Temperature comparison between radiometer and radiosonde. Green, blue and red curves are respectively the mean, the standard deviation and the
r.m.s. difference between the radiometer and radiosonde temperature profile. The cyan curve is the standard deviation between the surface temperature adjusted mean profile and the radiosonde. There is no bias between the surface temperature
adjusted mean profile and the radiosonde. For each radiosonde, a modelled profile has been obtained by shifting the mean temperature profile computed from all the radiosondes, toward the surface temperature, reported in the radiosonde message. A random noise of 0.5 K has been added to the surface temperature used to model the profile. This noise corresponds to the standard deviation of the difference

Microwave Radiometer Trial Report Version 1.0 Gaffard & Hewison
8
between the surface temperature measured by the radiometer and the radiosonde measurement. The cyan curve shows the standard deviation of the difference between the modelled profile and the radiosonde. The radiometer measurements are significantly closer to the radiosonde than the modelled profile. The reduction in the standard deviation by more than a factor 2 over all the range shows the amount of vertical information added by the radiometer. There is a steady increase in the standard deviation (blue curve) up to around 1300 m, due to the difficulty that the radiometer has to detect temperature inversions, when their altitudes increase. Another important point to notice is a bias in the retrieved temperature. There is an overestimation of the temperature by more than 1.5 K at 300 m, then the bias decreases with altitude, becoming nil at 2500 m and slightly negative above. This bias is consistent with the bias found on the brightness temperature (see Section 6). The bias correction obtained from the brightness temperature comparison in clear sky condition for Rosenkranz�98 has been applied on the brightness temperature. The bias correction on the channels at 51.25 GHz and 52.28 GHz were not applied because of the large discrepancy between the forward models and the average of the 4 models the bias correction is close to 0. The data has been reprocessed and compared again with the same radiosonde. Figure 4 shows that, indeed the correction on the brightness temperature had reduced the bias on the retrieved profiles.
Figure 4 - Same as Figure 3 but for profiles retrieved from bias corrected brightness
temperatures. The water vapour profile comparison is shown in the Figure 5.

Microwave Radiometer Trial Report Version 1.0 Gaffard & Hewison
9
Figure 5 - The green, blue, red curves represent respectively the mean, the standard deviation, and the rms difference between the radiometer profile and the radiosonde
profile. The mean water vapour profile from the radiosondes and its standard deviation is also plotted in yellow and cyan respectively. The pink curve shows the standard
deviation of the difference between the modelled and the radiosonde profile. A profile is deduced from the surface humidity sensor. For each of these profiles, the mean profile has been scaled to adjust the value of the water vapour at the surface to the observed value. As for the temperature a random noise equal to the standard deviation of the two humidity surface sensors (radiometer and values reported in the radiosonde) has been added to the surface value used for the modelled profile. Compared to the modelled value, the radiometer measurement improves the water vapour profile for all range. The biggest improvement is between 2000 m and 3000 m, where compared to the modelled value the reduction in the standard deviation is bigger than 30%. A positive bias is noticeable in the radiometer radiosonde comparison. This bias nearly disappears when the comparison is made from the profile obtained from the bias corrected brightness temperature as it can be seen on Figure 6.
Microwave Radiometer Trial Report Version 1.0 Gaffard & Hewison
10
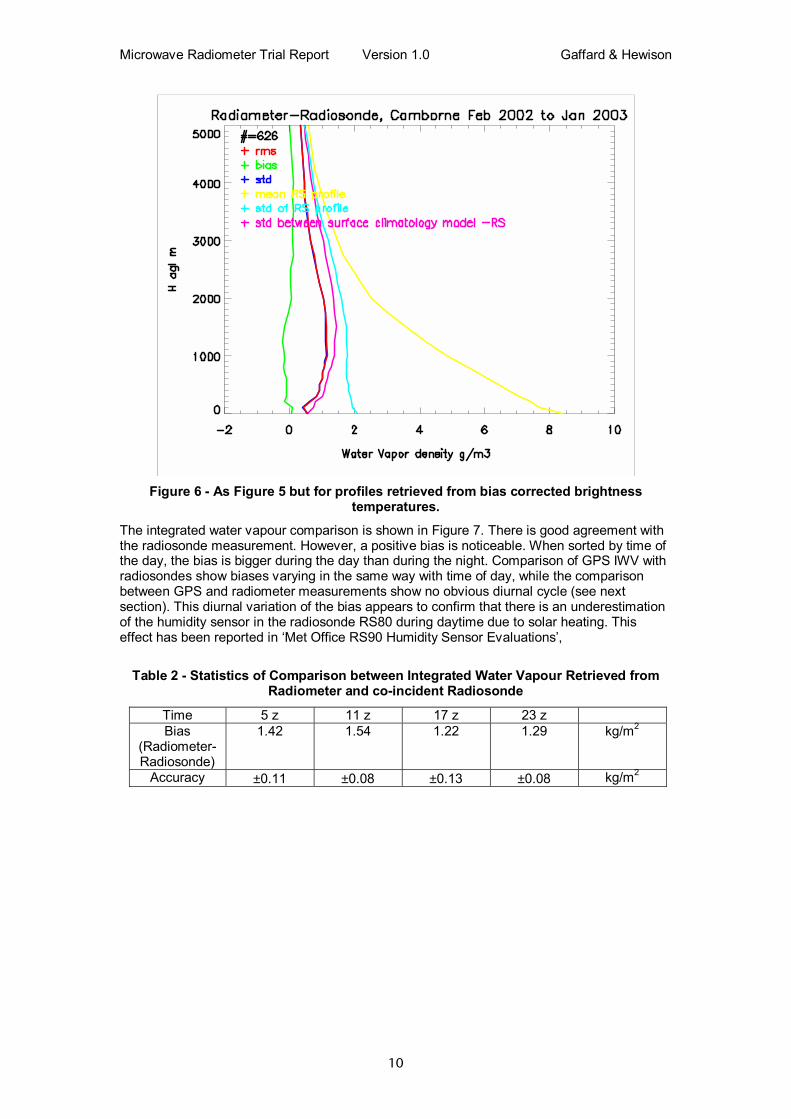
Figure 6 - As Figure 5 but for profiles retrieved from bias corrected brightness
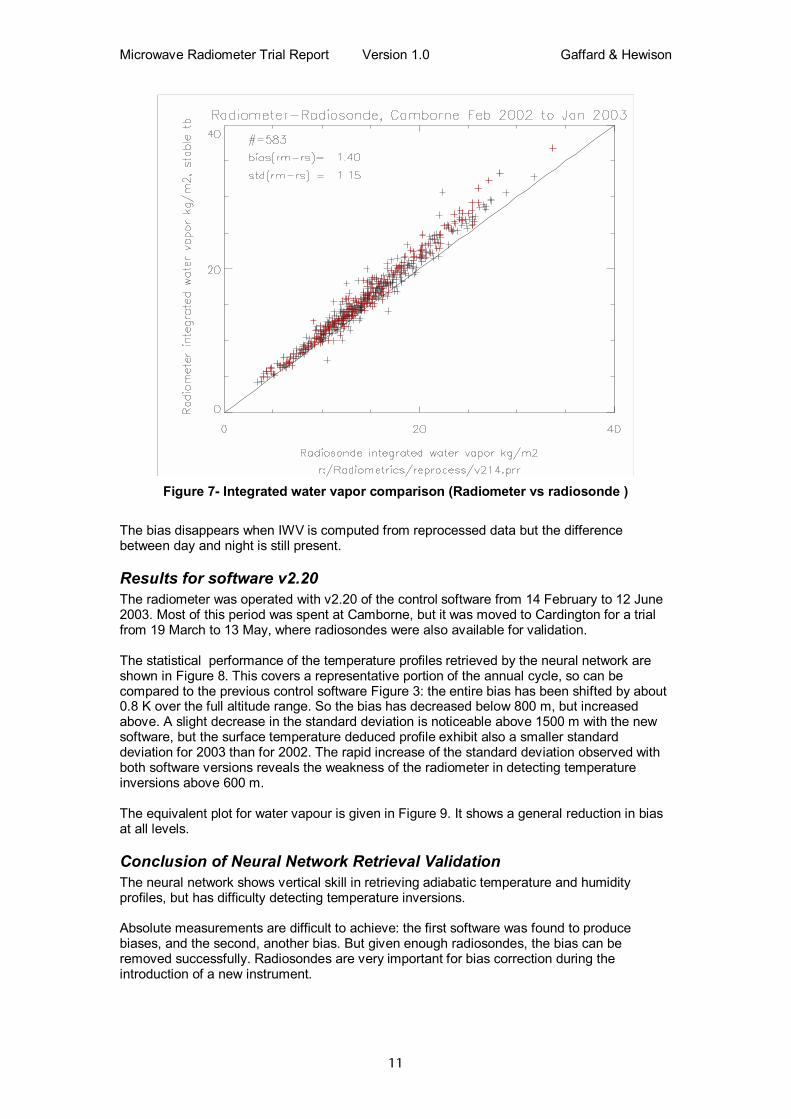
temperatures. The integrated water vapour comparison is shown in Figure 7. There is good agreement with the radiosonde measurement. However, a positive bias is noticeable. When sorted by time of the day, the bias is bigger during the day than during the night. Comparison of GPS IWV with radiosondes show biases varying in the same way with time of day, while the comparison between GPS and radiometer measurements show no obvious diurnal cycle (see next section). This diurnal variation of the bias appears to confirm that there is an underestimation of the humidity sensor in the radiosonde RS80 during daytime due to solar heating. This effect has been reported in �Met Office RS90 Humidity Sensor Evaluations�,
Table 2 - Statistics of Comparison between Integrated Water Vapour Retrieved from Radiometer and co-incident Radiosonde
Time 5 z 11 z 17 z 23 z Bias
(Radiometer-Radiosonde)
1.42 1.54 1.22 1.29 kg/m2
Accuracy ±0.11 ±0.08 ±0.13 ±0.08 kg/m2
Microwave Radiometer Trial Report Version 1.0 Gaffard & Hewison
11
Figure 7- Integrated water vapor comparison (Radiometer vs radiosonde )
The bias disappears when IWV is computed from reprocessed data but the difference between day and night is still present.
Results for software v2.20 The radiometer was operated with v2.20 of the control software from 14 February to 12 June 2003. Most of this period was spent at Camborne, but it was moved to Cardington for a trial from 19 March to 13 May, where radiosondes were also available for validation. The statistical performance of the temperature profiles retrieved by the neural network are shown in Figure 8. This covers a representative portion of the annual cycle, so can be compared to the previous control software Figure 3: the entire bias has been shifted by about 0.8 K over the full altitude range. So the bias has decreased below 800 m, but increased above. A slight decrease in the standard deviation is noticeable above 1500 m with the new software, but the surface temperature deduced profile exhibit also a smaller standard deviation for 2003 than for 2002. The rapid increase of the standard deviation observed with both software versions reveals the weakness of the radiometer in detecting temperature inversions above 600 m. The equivalent plot for water vapour is given in Figure 9. It shows a general reduction in bias at all levels.
Conclusion of Neural Network Retrieval Validation The neural network shows vertical skill in retrieving adiabatic temperature and humidity profiles, but has difficulty detecting temperature inversions. Absolute measurements are difficult to achieve: the first software was found to produce biases, and the second, another bias. But given enough radiosondes, the bias can be removed successfully. Radiosondes are very important for bias correction during the introduction of a new instrument.

Microwave Radiometer Trial Report Version 1.0 Gaffard & Hewison
12
Figure 8 � As Figure 3 but for profile retrieved from data obtained with the new
Software v2.20 14/2/03-12/6/03 at Camborne and Cardington.
Figure 9 � As Figure 5 but for data obtained with the new Software v2.20 14/2/03-12/6/03 at Camborne and Cardington.
Microwave Radiometer Trial Report Version 1.0 Gaffard & Hewison
13
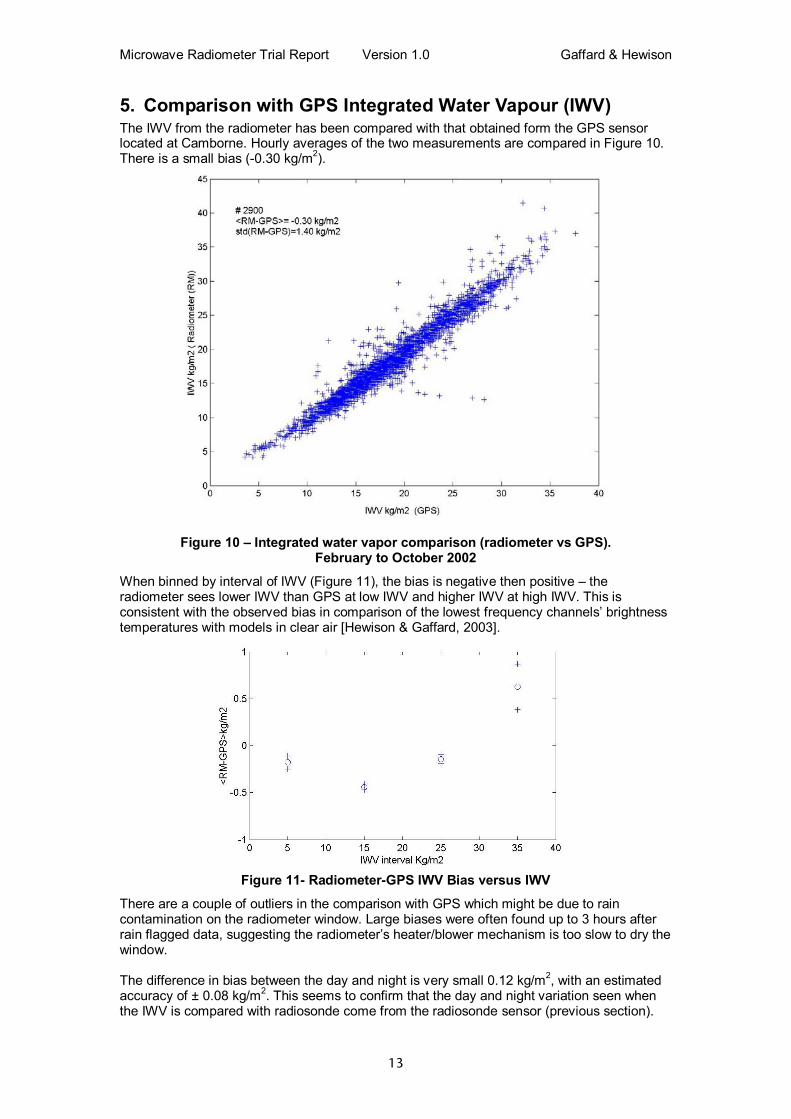
5. Comparison with GPS Integrated Water Vapour (IWV) The IWV from the radiometer has been compared with that obtained form the GPS sensor located at Camborne. Hourly averages of the two measurements are compared in Figure 10. There is a small bias (-0.30 kg/m2).
Figure 10 � Integrated water vapor comparison (radiometer vs GPS).
February to October 2002 When binned by interval of IWV (Figure 11), the bias is negative then positive � the radiometer sees lower IWV than GPS at low IWV and higher IWV at high IWV. This is consistent with the observed bias in comparison of the lowest frequency channels� brightness temperatures with models in clear air [Hewison & Gaffard, 2003].
Figure 11- Radiometer-GPS IWV Bias versus IWV
There are a couple of outliers in the comparison with GPS which might be due to rain contamination on the radiometer window. Large biases were often found up to 3 hours after rain flagged data, suggesting the radiometer�s heater/blower mechanism is too slow to dry the window. The difference in bias between the day and night is very small 0.12 kg/m2, with an estimated accuracy of ± 0.08 kg/m2. This seems to confirm that the day and night variation seen when the IWV is compared with radiosonde come from the radiosonde sensor (previous section).
Microwave Radiometer Trial Report Version 1.0 Gaffard & Hewison
14
6. Case Studies of Combination with Other Instruments A wind profiler and a ceilometer are operationally operated at Camborne. At present only the wind and the cloud base information obtained from these instruments is used operationally. As will be illustrated in this section, more information about the vertical structure of temperature and humidity is available in the return signal of the wind profiler and the ceilometer. The main cause of wind profiler radar returns is due to a Bragg scattering on turbulent inhomogeneities in the refractive index. The refractive index depends on the atmospheric temperature, humidity and pressure. Therefore there is a close link between the variation in the refractive index and the signal to noise ratio. The inhomogeneities in the refractive index are due to change in the temperature and humidity and to turbulent mixing. Rayleigh scattering by hydrometeors also contributes to the return signal. So ceilometer and cloud radar information is useful in the interpretation of the wind profiler echo. In the future we hope to enhance the vertical resolution of the retrievals from ground-based microwave radiometers with co-located active instruments. Three intensive observation periods have been conducted when radiosondes were launched hourly. These cover three different situations: development of the convective boundary layer, cloud evolution and clear air situations. Additionally, a case study of fog formation is shown.
Development of the Convective Boundary Layer Case Study
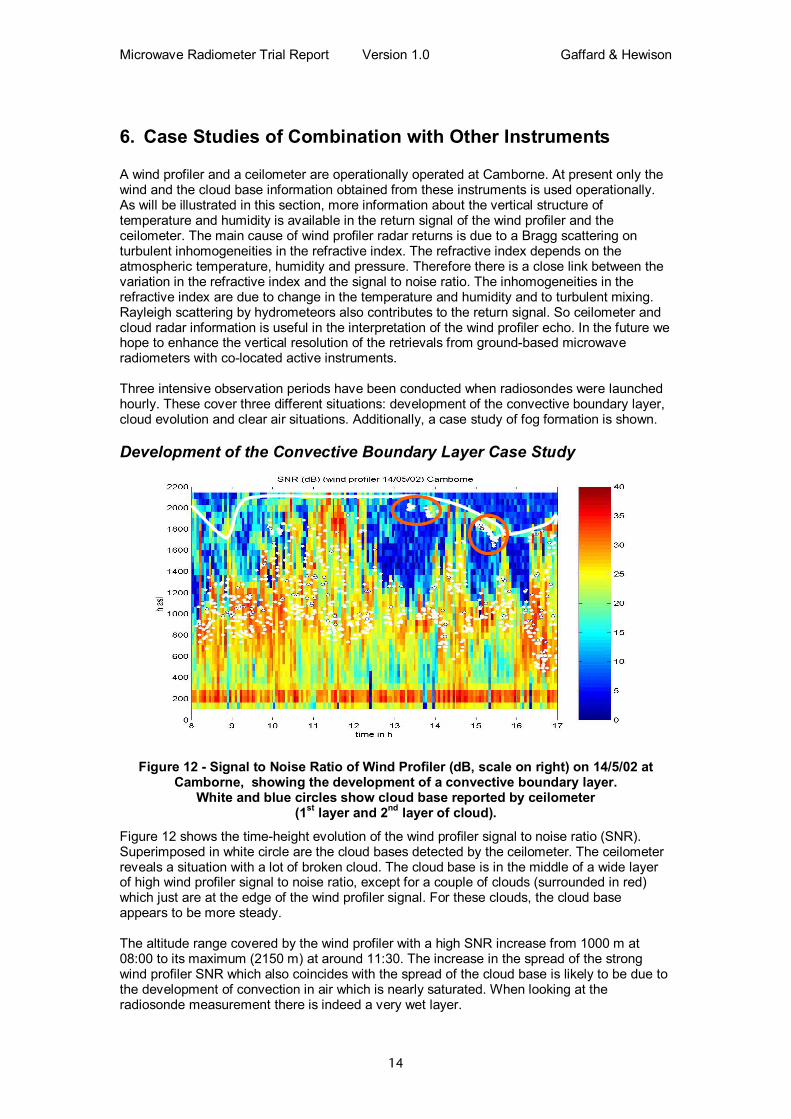
Figure 12 - Signal to Noise Ratio of Wind Profiler (dB, scale on right) on 14/5/02 at
Camborne, showing the development of a convective boundary layer. White and blue circles show cloud base reported by ceilometer
(1st layer and 2nd layer of cloud). Figure 12 shows the time-height evolution of the wind profiler signal to noise ratio (SNR). Superimposed in white circle are the cloud bases detected by the ceilometer. The ceilometer reveals a situation with a lot of broken cloud. The cloud base is in the middle of a wide layer of high wind profiler signal to noise ratio, except for a couple of clouds (surrounded in red) which just are at the edge of the wind profiler signal. For these clouds, the cloud base appears to be more steady. The altitude range covered by the wind profiler with a high SNR increase from 1000 m at 08:00 to its maximum (2150 m) at around 11:30. The increase in the spread of the strong wind profiler SNR which also coincides with the spread of the cloud base is likely to be due to the development of convection in air which is nearly saturated. When looking at the radiosonde measurement there is indeed a very wet layer.

Microwave Radiometer Trial Report Version 1.0 Gaffard & Hewison
15
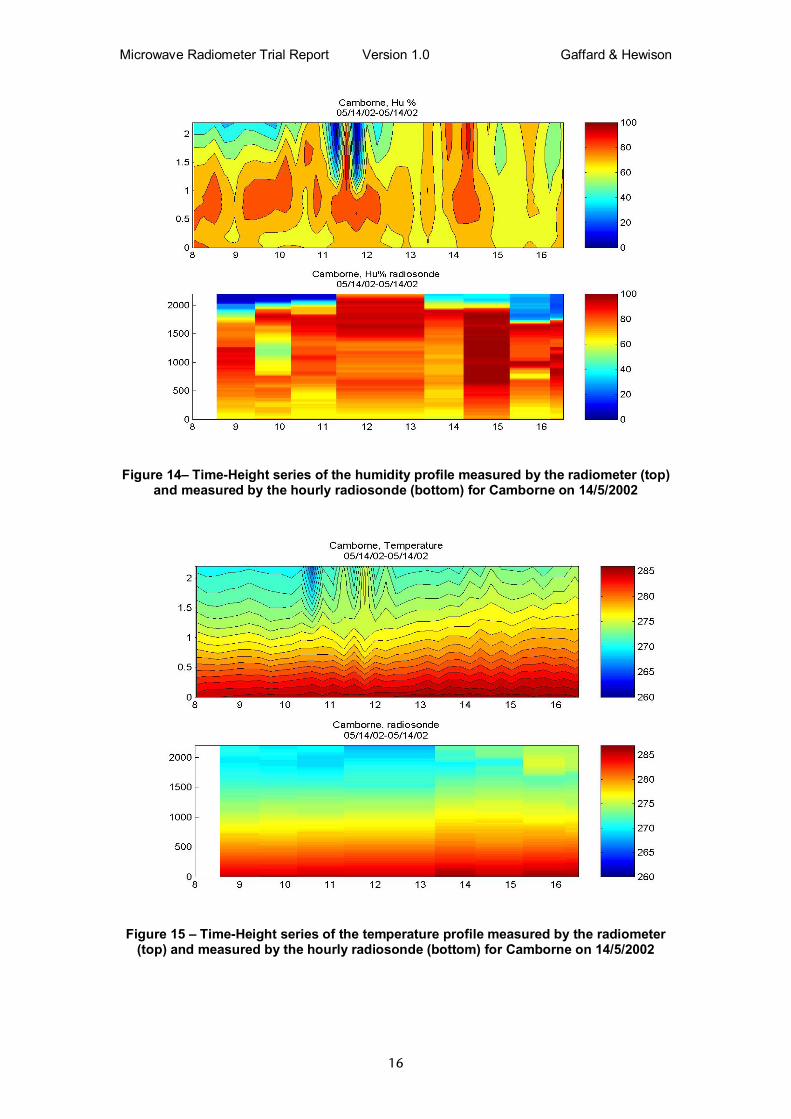
Above what appears to be the signature of the convective boundary layer, another zone of enhanced signal is highlighted in white. This line nearly coincides with a strong discontinuity in the refractive index (transition between a wet and dry layer one associated with a temperature inversion). The time height evolution of the square of the gradient of the refractive index ((dn/dz)2) in Figure 13 shows this discontinuity clearly. (dn/dz)2 can�t reproduce the signature of the convective boundary layer because mixing is not taken into account. The mixing is accessible through the width of the Doppler spectra, but more signal processing has to be done to make this information accurate. For the clouds surrounded in red, the enhanced signal of the wind profiler might show the cloud top that coincides with the temperature inversion. Information from a cloud radar will be useful. With a very coarse vertical resolution the radiometer (Figure 14) indicates a wet layer with cloud which correspond to the radiosonde measurement. The general evolution of the temperature is also reproduced (Figure 15). A couple of non-realistic measurements exist between 10:30 and 12:30. These are likely to be the result of cloud contamination. As shown by the ceilometer, the cloud cover is quite variable and it�s possible that within one minute (which is the radiometer acquisition time) clouds appear and disappear into the field of view of the radiometer. The new software reduces the window acquisition time, so we expect this kind contamination to be smaller. .
Figure 13 � Time-Height series of the Vertical Square Gradient of the Refractive Index,
computed from hourly radiosonde profiles for Camborne on 14/5/02. (Development of the Convective Boundary Layer Case Study)
Microwave Radiometer Trial Report Version 1.0 Gaffard & Hewison
16
Figure 14� Time-Height series of the humidity profile measured by the radiometer (top)
and measured by the hourly radiosonde (bottom) for Camborne on 14/5/2002
Figure 15 � Time-Height series of the temperature profile measured by the radiometer
(top) and measured by the hourly radiosonde (bottom) for Camborne on 14/5/2002
Microwave Radiometer Trial Report Version 1.0 Gaffard & Hewison
17
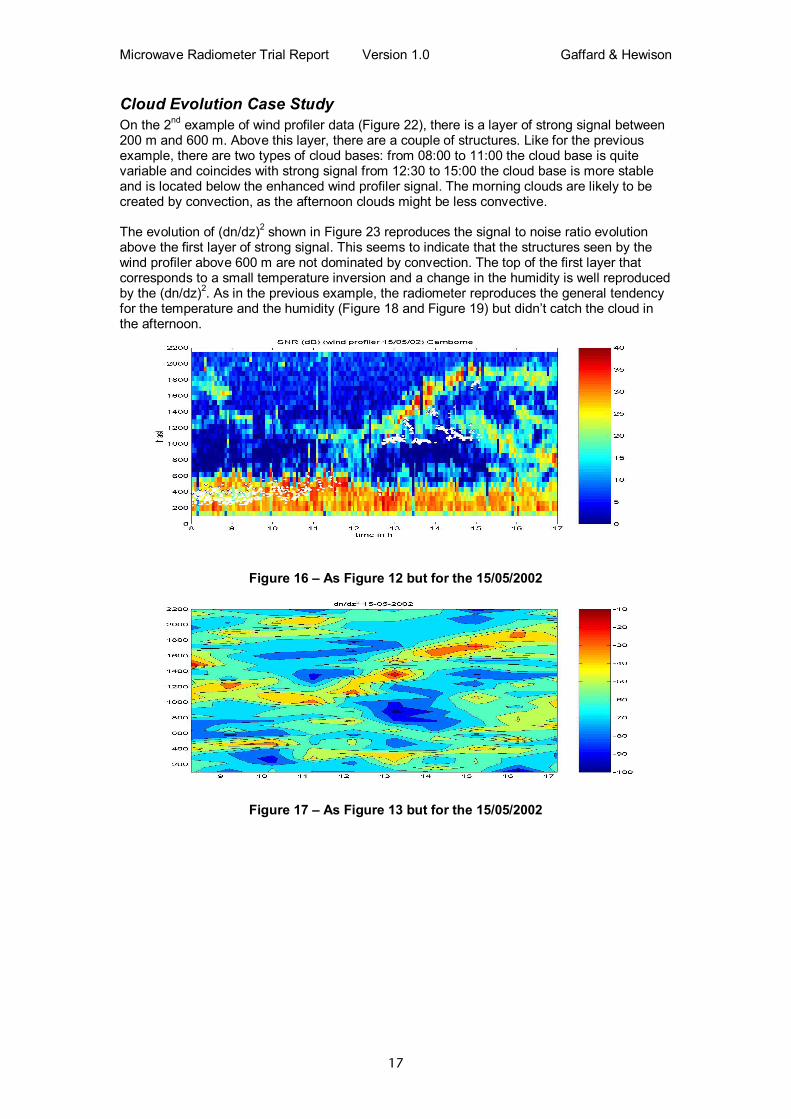
Cloud Evolution Case Study On the 2nd example of wind profiler data (Figure 22), there is a layer of strong signal between 200 m and 600 m. Above this layer, there are a couple of structures. Like for the previous example, there are two types of cloud bases: from 08:00 to 11:00 the cloud base is quite variable and coincides with strong signal from 12:30 to 15:00 the cloud base is more stable and is located below the enhanced wind profiler signal. The morning clouds are likely to be created by convection, as the afternoon clouds might be less convective. The evolution of (dn/dz)2 shown in Figure 23 reproduces the signal to noise ratio evolution above the first layer of strong signal. This seems to indicate that the structures seen by the wind profiler above 600 m are not dominated by convection. The top of the first layer that corresponds to a small temperature inversion and a change in the humidity is well reproduced by the (dn/dz)2. As in the previous example, the radiometer reproduces the general tendency for the temperature and the humidity (Figure 18 and Figure 19) but didn�t catch the cloud in the afternoon.
Figure 16 � As Figure 12 but for the 15/05/2002
Figure 17 � As Figure 13 but for the 15/05/2002

Microwave Radiometer Trial Report Version 1.0 Gaffard & Hewison
18
Figure 18 - same as Figure 14 but for 15/05/2002
.
Figure 19 - same as Figure 15 but for 15/05/2002

Microwave Radiometer Trial Report Version 1.0 Gaffard & Hewison
19
Clear air situation For the third case (Figure 20), there is no low-level cloud. Nevertheless the ceilometer indicates a layer (Figure 21). This layer just fits underneath the local maximum of the wind profiler and corresponds to a temperature inversion. It also reproduces some of the oscillations seen in the wind profiler signal. Aerosol or haze, trapped underneath the temperature inversion, backscatters the ceilometer signal. Figure 22 shows the evolution of (dn/dz)2 reproduces with a good agreement the signal to noise ratio in Figure 20.
Figure 20 � Same as Figure 12, but for 16/05/2002
Figure 21 � Ceilometer data averaged over 5 min for the 16/05/2002.
Colour scale is in dB.
Figure 22 - (dn/dz)^2 computed form hourly radiosonde launched on the 16/05/02
In this case the radiometer was able to reproduce the temperature inversion, as shown in Figure 23.

Microwave Radiometer Trial Report Version 1.0 Gaffard & Hewison
20
Figure 23 - Time-Height Series of Temperature Profiles from Radiometer (upper panel)
and Radiosondes (lower panel) for Clear Air Case Study, Camborne 16/5/02
Microwave Radiometer Trial Report Version 1.0 Gaffard & Hewison
21
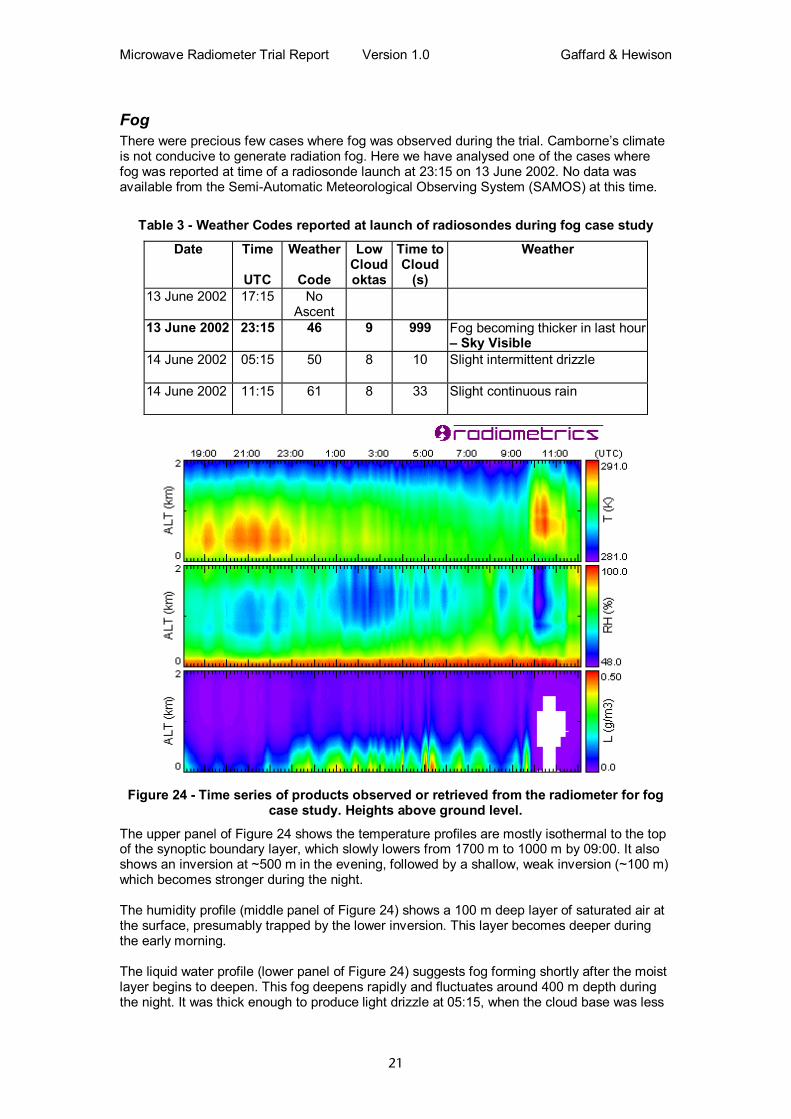
Fog There were precious few cases where fog was observed during the trial. Camborne�s climate is not conducive to generate radiation fog. Here we have analysed one of the cases where fog was reported at time of a radiosonde launch at 23:15 on 13 June 2002. No data was available from the Semi-Automatic Meteorological Observing System (SAMOS) at this time.
Table 3 - Weather Codes reported at launch of radiosondes during fog case study
Date
Time
UTC
Weather
Code
Low Cloudoktas
Time to Cloud
(s)
Weather
13 June 2002 17:15 No Ascent
13 June 2002 23:15 46 9 999 Fog becoming thicker in last hour � Sky Visible
14 June 2002 05:15 50 8 10 Slight intermittent drizzle
14 June 2002 11:15 61 8 33 Slight continuous rain
Figure 24 - Time series of products observed or retrieved from the radiometer for fog
case study. Heights above ground level. The upper panel of Figure 24 shows the temperature profiles are mostly isothermal to the top of the synoptic boundary layer, which slowly lowers from 1700 m to 1000 m by 09:00. It also shows an inversion at ~500 m in the evening, followed by a shallow, weak inversion (~100 m) which becomes stronger during the night. The humidity profile (middle panel of Figure 24) shows a 100 m deep layer of saturated air at the surface, presumably trapped by the lower inversion. This layer becomes deeper during the early morning. The liquid water profile (lower panel of Figure 24) suggests fog forming shortly after the moist layer begins to deepen. This fog deepens rapidly and fluctuates around 400 m depth during the night. It was thick enough to produce light drizzle at 05:15, when the cloud base was less
Microwave Radiometer Trial Report Version 1.0 Gaffard & Hewison
22
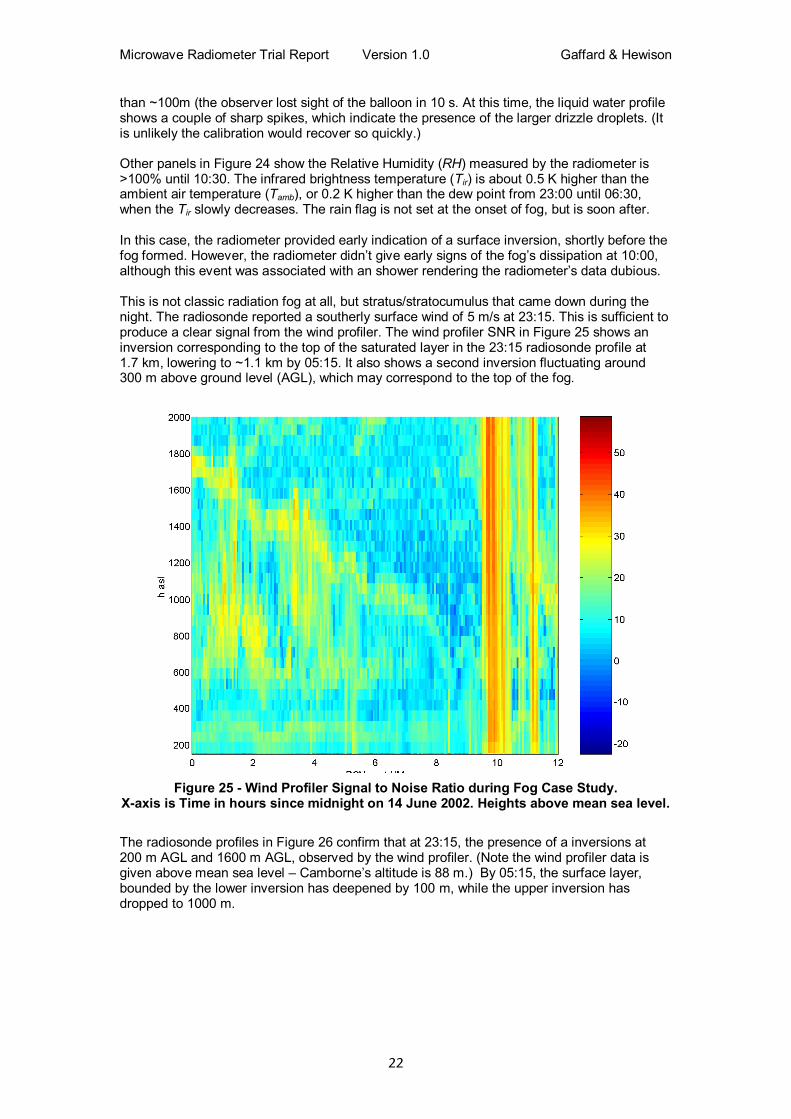
than ~100m (the observer lost sight of the balloon in 10 s. At this time, the liquid water profile shows a couple of sharp spikes, which indicate the presence of the larger drizzle droplets. (It is unlikely the calibration would recover so quickly.) Other panels in Figure 24 show the Relative Humidity (RH) measured by the radiometer is >100% until 10:30. The infrared brightness temperature (Tir) is about 0.5 K higher than the ambient air temperature (Tamb), or 0.2 K higher than the dew point from 23:00 until 06:30, when the Tir slowly decreases. The rain flag is not set at the onset of fog, but is soon after. In this case, the radiometer provided early indication of a surface inversion, shortly before the fog formed. However, the radiometer didn�t give early signs of the fog�s dissipation at 10:00, although this event was associated with an shower rendering the radiometer�s data dubious. This is not classic radiation fog at all, but stratus/stratocumulus that came down during the night. The radiosonde reported a southerly surface wind of 5 m/s at 23:15. This is sufficient to produce a clear signal from the wind profiler. The wind profiler SNR in Figure 25 shows an inversion corresponding to the top of the saturated layer in the 23:15 radiosonde profile at 1.7 km, lowering to ~1.1 km by 05:15. It also shows a second inversion fluctuating around 300 m above ground level (AGL), which may correspond to the top of the fog.
Figure 25 - Wind Profiler Signal to Noise Ratio during Fog Case Study.
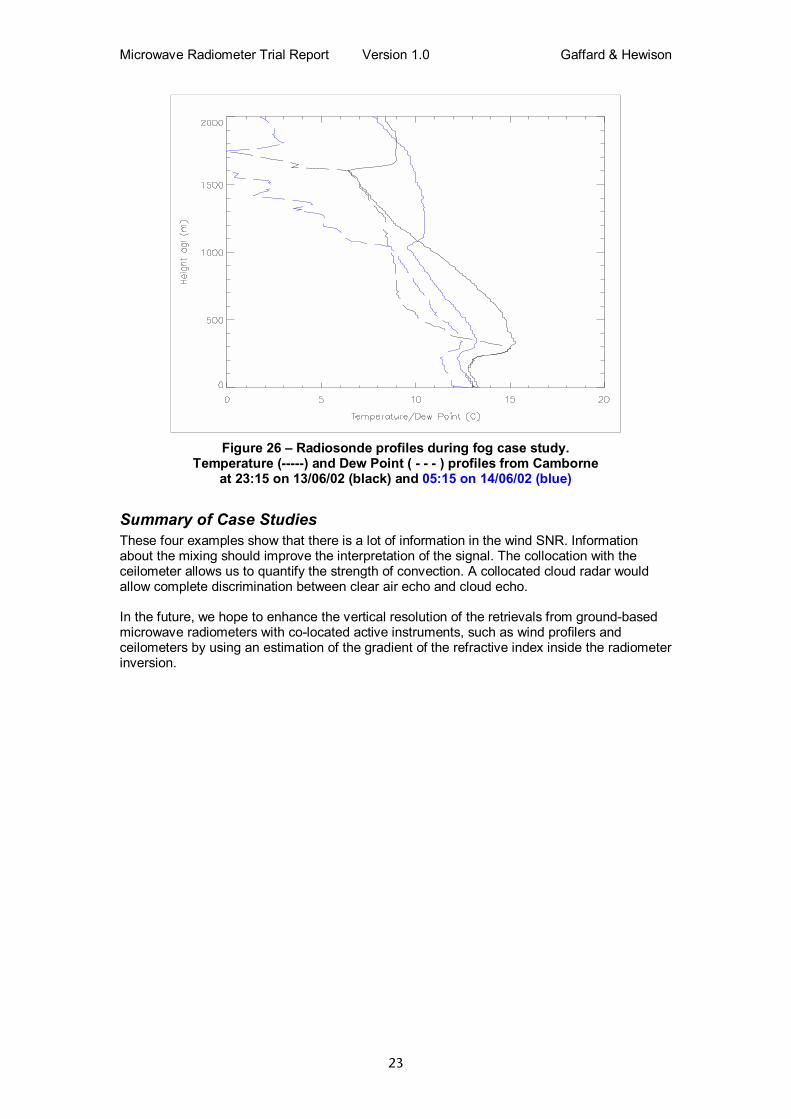
X-axis is Time in hours since midnight on 14 June 2002. Heights above mean sea level. The radiosonde profiles in Figure 26 confirm that at 23:15, the presence of a inversions at 200 m AGL and 1600 m AGL, observed by the wind profiler. (Note the wind profiler data is given above mean sea level � Camborne�s altitude is 88 m.) By 05:15, the surface layer, bounded by the lower inversion has deepened by 100 m, while the upper inversion has dropped to 1000 m.
Microwave Radiometer Trial Report Version 1.0 Gaffard & Hewison
23
Figure 26 � Radiosonde profiles during fog case study.
Temperature (-----) and Dew Point ( - - - ) profiles from Camborne at 23:15 on 13/06/02 (black) and 05:15 on 14/06/02 (blue)
Summary of Case Studies These four examples show that there is a lot of information in the wind SNR. Information about the mixing should improve the interpretation of the signal. The collocation with the ceilometer allows us to quantify the strength of convection. A collocated cloud radar would allow complete discrimination between clear air echo and cloud echo. In the future, we hope to enhance the vertical resolution of the retrievals from ground-based microwave radiometers with co-located active instruments, such as wind profilers and ceilometers by using an estimation of the gradient of the refractive index inside the radiometer inversion.
Microwave Radiometer Trial Report Version 1.0 Gaffard & Hewison
24
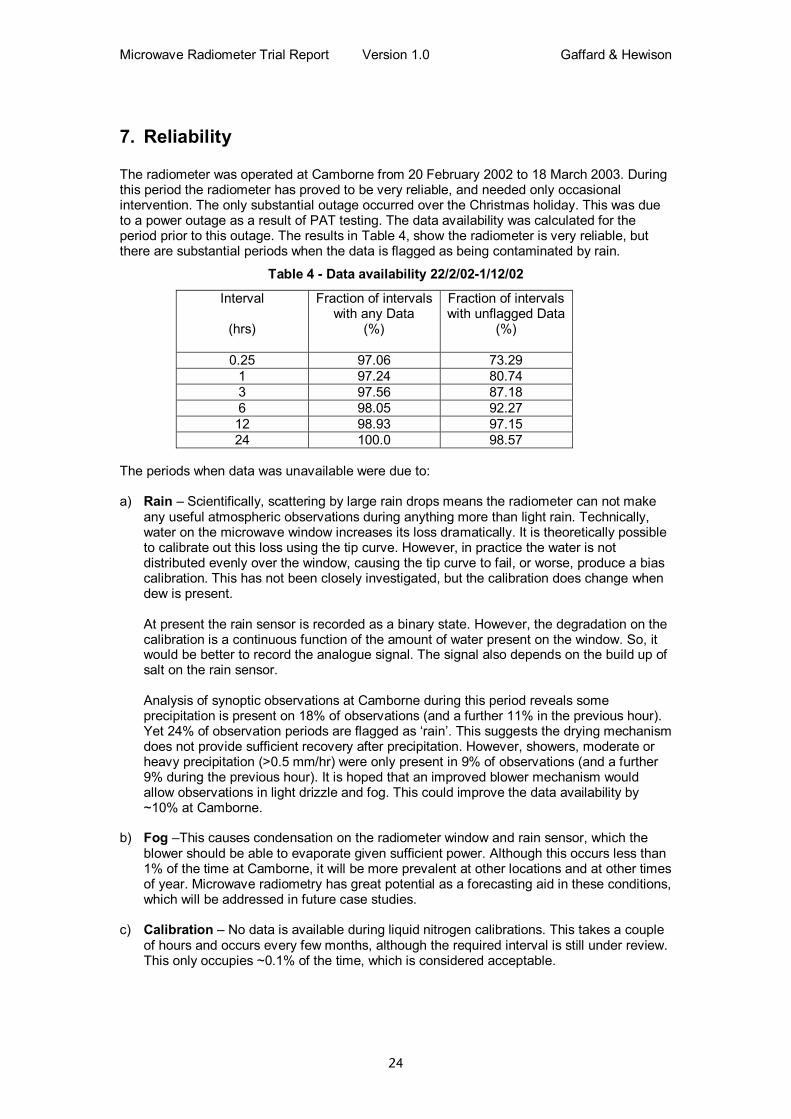
7. Reliability The radiometer was operated at Camborne from 20 February 2002 to 18 March 2003. During this period the radiometer has proved to be very reliable, and needed only occasional intervention. The only substantial outage occurred over the Christmas holiday. This was due to a power outage as a result of PAT testing. The data availability was calculated for the period prior to this outage. The results in Table 4, show the radiometer is very reliable, but there are substantial periods when the data is flagged as being contaminated by rain.
Table 4 - Data availability 22/2/02-1/12/02
Interval
(hrs)
Fraction of intervals with any Data
(%)
Fraction of intervals with unflagged Data
(%)
0.25 97.06 73.29 1 97.24 80.74 3 97.56 87.18 6 98.05 92.27 12 98.93 97.15 24 100.0 98.57
The periods when data was unavailable were due to: a) Rain � Scientifically, scattering by large rain drops means the radiometer can not make
any useful atmospheric observations during anything more than light rain. Technically, water on the microwave window increases its loss dramatically. It is theoretically possible to calibrate out this loss using the tip curve. However, in practice the water is not distributed evenly over the window, causing the tip curve to fail, or worse, produce a bias calibration. This has not been closely investigated, but the calibration does change when dew is present. At present the rain sensor is recorded as a binary state. However, the degradation on the calibration is a continuous function of the amount of water present on the window. So, it would be better to record the analogue signal. The signal also depends on the build up of salt on the rain sensor. Analysis of synoptic observations at Camborne during this period reveals some precipitation is present on 18% of observations (and a further 11% in the previous hour). Yet 24% of observation periods are flagged as �rain�. This suggests the drying mechanism does not provide sufficient recovery after precipitation. However, showers, moderate or heavy precipitation (>0.5 mm/hr) were only present in 9% of observations (and a further 9% during the previous hour). It is hoped that an improved blower mechanism would allow observations in light drizzle and fog. This could improve the data availability by ~10% at Camborne.
b) Fog �This causes condensation on the radiometer window and rain sensor, which the blower should be able to evaporate given sufficient power. Although this occurs less than 1% of the time at Camborne, it will be more prevalent at other locations and at other times of year. Microwave radiometry has great potential as a forecasting aid in these conditions, which will be addressed in future case studies.
c) Calibration � No data is available during liquid nitrogen calibrations. This takes a couple of hours and occurs every few months, although the required interval is still under review. This only occupies ~0.1% of the time, which is considered acceptable.
Microwave Radiometer Trial Report Version 1.0 Gaffard & Hewison
25
d) Power failure � Initially the radiometer powered down during monthly power tests. It now has a UPS.
e) User error � It is possible for user error to cause the software to crash, fail to restart automatically or lose power to the instrument. However, the system is reliable if left untouched. While the software is not particularly easy to configure, it is reliable in operation (despite being based on Windows 98).
The mounting tripod has been replaced due to concerns about corrosion due to salt water spray. A mirror used by its integral infrared radiometer has also been replaced with an aluminium alloy one, as the gold plating was found to degrade rapidly. Mechanically, the instrument is now believed to be sufficiently robust for operational use.
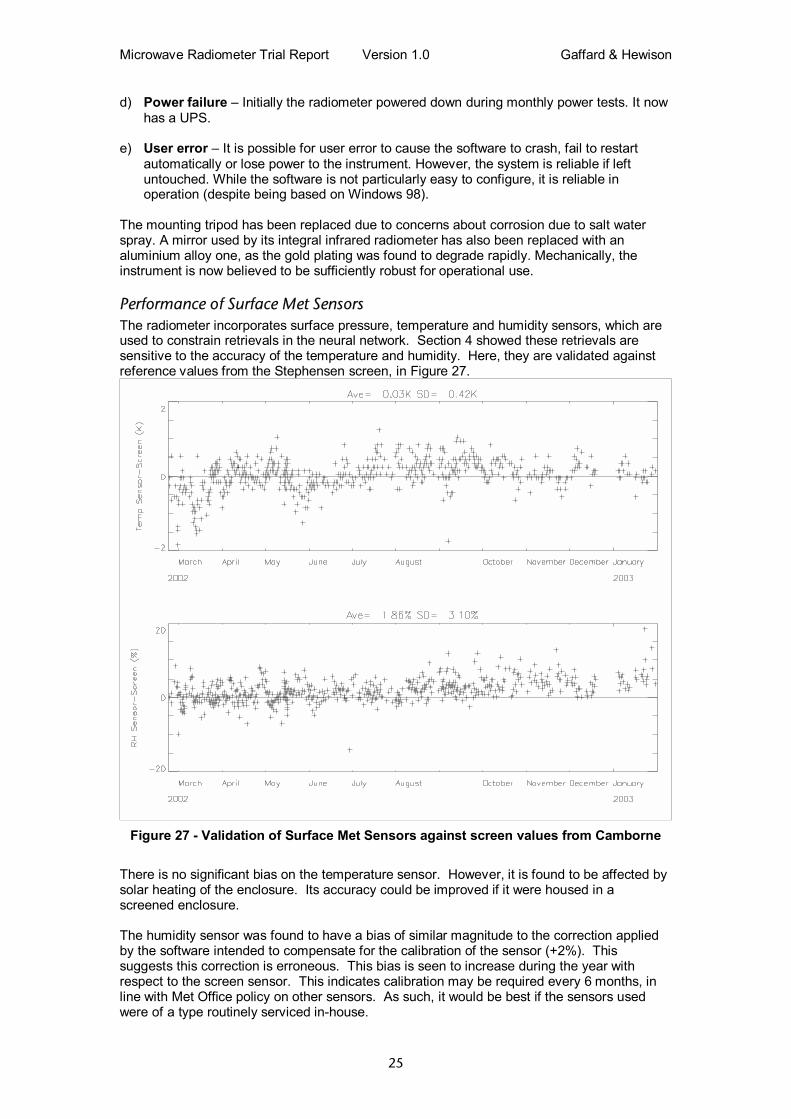
Performance of Surface Met Sensors The radiometer incorporates surface pressure, temperature and humidity sensors, which are used to constrain retrievals in the neural network. Section 4 showed these retrievals are sensitive to the accuracy of the temperature and humidity. Here, they are validated against reference values from the Stephensen screen, in Figure 27.
Figure 27 - Validation of Surface Met Sensors against screen values from Camborne
There is no significant bias on the temperature sensor. However, it is found to be affected by solar heating of the enclosure. Its accuracy could be improved if it were housed in a screened enclosure. The humidity sensor was found to have a bias of similar magnitude to the correction applied by the software intended to compensate for the calibration of the sensor (+2%). This suggests this correction is erroneous. This bias is seen to increase during the year with respect to the screen sensor. This indicates calibration may be required every 6 months, in line with Met Office policy on other sensors. As such, it would be best if the sensors used were of a type routinely serviced in-house.
Microwave Radiometer Trial Report Version 1.0 Gaffard & Hewison
26
8. Conclusions and Recommendations Substantial biases were found in the retrieved profiles. The biases in the oxygen channels have been reduced by a new release of the control software, and it is expected that this will reduce the bias found in the temperature profile near the surface. The biases in the water vapour channels are found to be related to the total humidity, and are believed to be partly due to a bias in the forward model, and partly due to the dry bias in the radiosondes. Mechanically, electrically, and computationally, the instrument is now believed to be sufficiently robust for operational use. However, there substantial development remains to improve the observation cycle, calibration, quality control and retrieval algorithms. The radiometer was supplied with a neural network algorithm to retrieve profiles of temperature, humidity and liquid water density. The temperature and humidity profiles have been validated against radiosondes, and found to be significantly better than a simple retrieval based on surface observations. The r.m.s. error in the temperature profiles increases rapidly from 0.5 K at the surface to 1.5 K at 1 km and more slowly to 1.8 K at 5 km. The humidity profiles are better than the reference model below 4 km. The neural network shows vertical skill in retrieving adiabatic temperature and humidity profiles, but has difficulty detecting temperature inversions. Absolute measurements are difficult to achieve: the first software was found to produce biases, and the second, another bias. But given enough radiosondes, biases can be removed. It is not intended to use the neural network retrievals operationally in NWP. Development of a variational data assimilation method is underway. To optimise the use of these data, it is essential to understand the error characteristics of the radiometer, which are discussed in this report. The case studies show that there is a lot of information in the wind profiler SNR. Information about the mixing should improve the interpretation of the signal. The collocation with the ceilometer allows us to quantify the strength of convection. A collocated cloud radar would allow complete discrimination between clear air echo and cloud echo. In the future, we hope to enhance the vertical resolution of the retrievals from ground-based microwave radiometers with co-located active instruments, such as wind profilers and ceilometers by using an estimation of the gradient of the refractive index inside the radiometer inversion.
Microwave Radiometer Trial Report Version 1.0 Gaffard & Hewison
27
Specific Recommendations for Radiometer Manufacturer We recommend a complete over-haul of the structure of the archived data sets. This should follow the convention of Level 0 to include all raw data (e.g. voltages), Level 1 to include calibrated observations (e.g. brightness temperatures) and Level 2 to include derived products (e.g. retrieved profiles). These should be structured to allow the recreation of any data set from the previous level given a set of coefficients to represent the transform. This would greatly facilitate the analysis of the performance of the radiometer, its calibration and retrieval processes. • Improve the blower mechanism to allow observations in fog and light drizzle. • The rain sensor should be recorded as an analogue voltage, not a binary state. • Improve the quality control and averaging of calibration data. • Reduce the time difference between observations made by different channels. • House the surface met sensors in a ventilated enclosure.
Specific Recommendations for Upper Air Technology Centre During the trial, we have formed an excellent working relationship with Radiometrics. We should continue liaison with them, while keeping abreast of developments from other manufacturers. Additionally, we should: • Acquire better case studies to investigate the radiometer�s ability to detect fog/stratus. • Acquire case studies to study development of boundary layer cloud with cloud radar. • Calibrate met sensors every 6 months.
9. References T.J.Hewison and C.Gaffard, 2003: �Radiometrics MP3000 Microwave Radiometer: Performance Assessment�, Met Office (OD) Technical Report 29, Available from National Meteorological Library, UK.
Radiometrics, 2001: �TP/WVP-3000 Temperature and Water Vapor Profiling Radiometer� Operators handbook. Radiometrics Corporation, http://radiometrics.com.
Rosenkranz, P.W., 1998: �Water Vapor Microwave Continuum Absorption: A Comparison Of Measurements And Models�, Radio Science, Vol.33, No.4, pp.919-928.
Solheim, F., J. Godwin, and R. Ware, 1996: �Microwave Radiometer for Passively and Remotely Measuring Atmospheric Temperature, Water Vapor, and Cloud Liquid Water Profiles�, Final Contract Report DAAL01-96-2009, White Sands Missile Range.


![The Advanced Microwave Radiometer – Climate Quality (AMR-C) … · 2018-03-08 · Microwave Radiometer (HRMR) [6] and a Supplemental Calibration System (SCS). The radiometer channels](https://img.dokumen.tips/doc/110x75/5f35db4eb6ba30245530385e/the-advanced-microwave-radiometer-a-climate-quality-amr-c-2018-03-08-microwave.jpg)