Embed Size (px)
Citation preview

Chart Pack
Race, Ethnicity & Medical CareA Survey of Public Perceptions and Experiences
The Henry J. Kaiser Family Foundation
October 1999
The Henry J. Kaiser Family Foundation, based in Menlo Park, California, is an independent national health carephilanthropy and is not associated with Kaiser Permanente or Kaiser Industries.

Chart 1
“How Big a Problem is Racism in Different Areas?”
Major Problem Minor Problem Not a Problem
41%
59%
21%
42%
30%
54%
16%
8%
21%
Latinos Say
AfricanAmericans
Say
Whites Say
THE WORK PLACE
HOUSING
EDUCATION
HEALTH CARE
* Don’t knows not shown
30%
35%
16%
45%
45%
52%
22%
15%
25%
Latinos Say
AfricanAmericans
Say
Whites Say
41%
59%
30%
38%
28%
48%
17%
11%
17%
Latinos Say
AfricanAmericans
Say
Whites Say
40%
50%
27%
38%
36%
47%
21%
13%
24%
Latinos Say
AfricanAmericans
Say
Whites Say
Source: Kaiser Family Foundation Survey of Race, Ethnicity and Medical Care: Public Perceptions and Experiences, October 1999 (Conducted July - Sept, 1999)

“How Do You Think the Average African AmericanCompares to the Average White Person in Terms of…?”
Awareof thediffer-ences
INFANT MORTALITY
Whites Say
Not awareof thedifferences
45% 54%
“just as well off” (39%)“better off” (6%)“don’t know” (9%)
African Americans Say
say “worse off”
Awareof thediffer-ences
Not awareof thedifferences
say “worse off”42% 58%
Awareof thediffer-ences
LIFE EXPECTANCY
Whites Say
Not awareof thedifferences
43% 57%
African Americans Say
say ”worse off”
Awareof thediffer-ences
Not awareof thedifferences
say “worse off”
46% 53%
say...
Chart 2
say...
“just as well off” (42%)“better off” (8%)“don’t know” (8%)
say...
say...
“just as well off” (43%)“better off” (5%)“don’t know” (9%)
“just as well off” (36%)“better off” (10%)“don’t know” (7%)
Source: Kaiser Family Foundation Survey of Race, Ethnicity and Medical Care: Public Perceptions and Experiences, October 1999 (Conducted July - Sept, 1999)
Facts: In 1997, black infant mortality was 2 ½ times higher than white (14.2 per 1,000 black infants bornversus 6.0 per 1,000 white infants born), and blacks in 1996, on average, lived 6.6 years less than whites.

“How Do You Think the Average African AmericanCompares to the Average White Person in Terms of…?”
Awareof thediffer-ences
GETTING ROUTINE MEDICAL CARE WHEN THEY NEED IT
Whites Say
Not awareof thedifferences
27%72%
“just as well off” (62%)“better off” (5%)“don’t know” (5%)
African Americans Say
say “worse off”
Awareof thediffer-ences
Not awareof thedifferences
say “worse off”51% 49%
Awareof thediffer-ences
HAVING HEALTH INSURANCE
Whites Say
Not awareof thedifferences
43% 57%
African Americans Say
say “worse off”
Awareof thediffer-ences
Not awareof thedifferences
say “worse off”59%
41%
say...
Chart 3
say...
“just as well off” (41%)“better off” (4%)“don’t know” (4%)
say...
say...
“just as well off” (48%)“better off” (3%)“don’t know” (6%)
“just as well off” (33%)“better off” (4%)“don’t know” (4%)
Source: Kaiser Family Foundation Survey of Race, Ethnicity and Medical Care: Public Perceptions and Experiences, October 1999 (Conducted July - Sept, 1999)

“How Do You Think the Average LatinoCompares to the Average White Person in Terms of…?”
Awareof thediffer-ences
Whites Say
Not awareof thedifferences
33% 66%
“just as well off” (54%)“better off” (3%)“don’t know” (9%)
Latinos Say
say “worse off”
Awareof thediffer-ences
Not awareof thedifferences
say “worse off”47% 53%
Awareof thediffer-ences
Whites Say
Not awareof thedifferences
48% 52%
Latinos Say
say “worse off”
Awareof thediffer-ences
Not awareof thedifferences
say “worse off”54% 46%
say...
Chart 4
say...
“just as well off” (46%)“better off” (5%)“don’t know” (2%)
say...
say...
“just as well off” (39%)“better off” (4%)“don’t know” (9%)
“just as well off” (37%)“better off” (6%)“don’t know” (3%)
GETTING ROUTINE MEDICAL CARE WHEN THEY NEED IT
HAVING HEALTH INSURANCE
Source: Kaiser Family Foundation Survey of Race, Ethnicity and Medical Care: Public Perceptions and Experiences, October 1999 (Conducted July - Sept, 1999)

Chart 5
Perceptions of Quality of Care Others Receive Compared toWhites When Getting Health Care Services
64%
23%
27%
67%
3%
1%
African AmericansSay
Whites Say
African Americans receivelower quality
African Americans receivesame quality
African Americans receivehigher quality
56%
27%
38%
59%
5%
3%
Latinos Say
Whites Say
Latinos receivelower quality
Latinos receivesame quality
Latinos receivehigher quality
* Don’t knows not shown
Source: Kaiser Family Foundation Survey of Race, Ethnicity and Medical Care: Public Perceptions and Experiences, October 1999 (Conducted July - Sept, 1999)

41%
61%
56%
33%
African Americans Say
Whites Say
True False
“African Americans with heart disease are just as likely as whites whohave heart disease to get specialized medical procedures and surgery”
Chart 6
Perceptions of African Americans’ Access to SpecificTreatments Compared to Whites
* Don’t knows not shown
Source: Kaiser Family Foundation Survey of Race, Ethnicity and Medical Care: Public Perceptions and Experiences, October 1999 (Conducted July - Sept, 1999)

“Whites with HIV or AIDS are more likely than African Americans withHIV or AIDS to get the newest medicines and treatments”
Chart 7
Perceptions of African Americans’ Access to HIV/AIDSTreatments Compared to Whites
* Don’t knows not shown
Source: Kaiser Family Foundation Survey of Race, Ethnicity and Medical Care: Public Perceptions and Experiences, October 1999 (Conducted July - Sept, 1999)
64%
43%
29%
47%
African Americans Say
Whites Say
True False
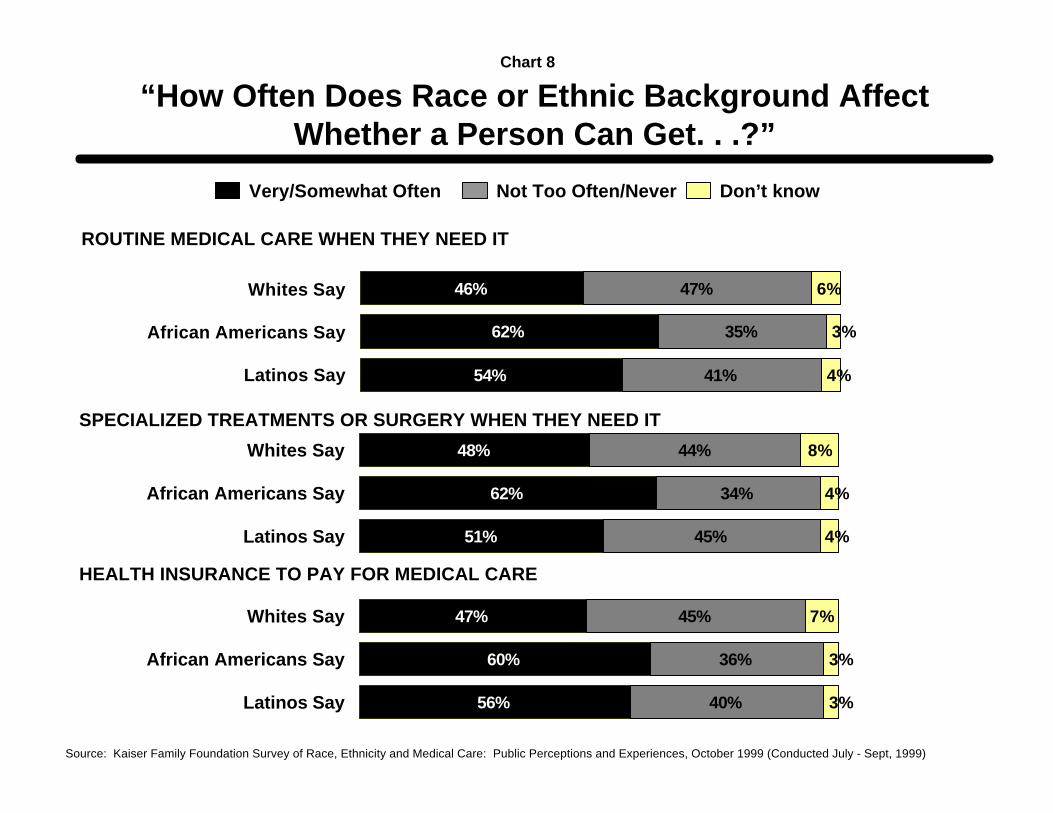
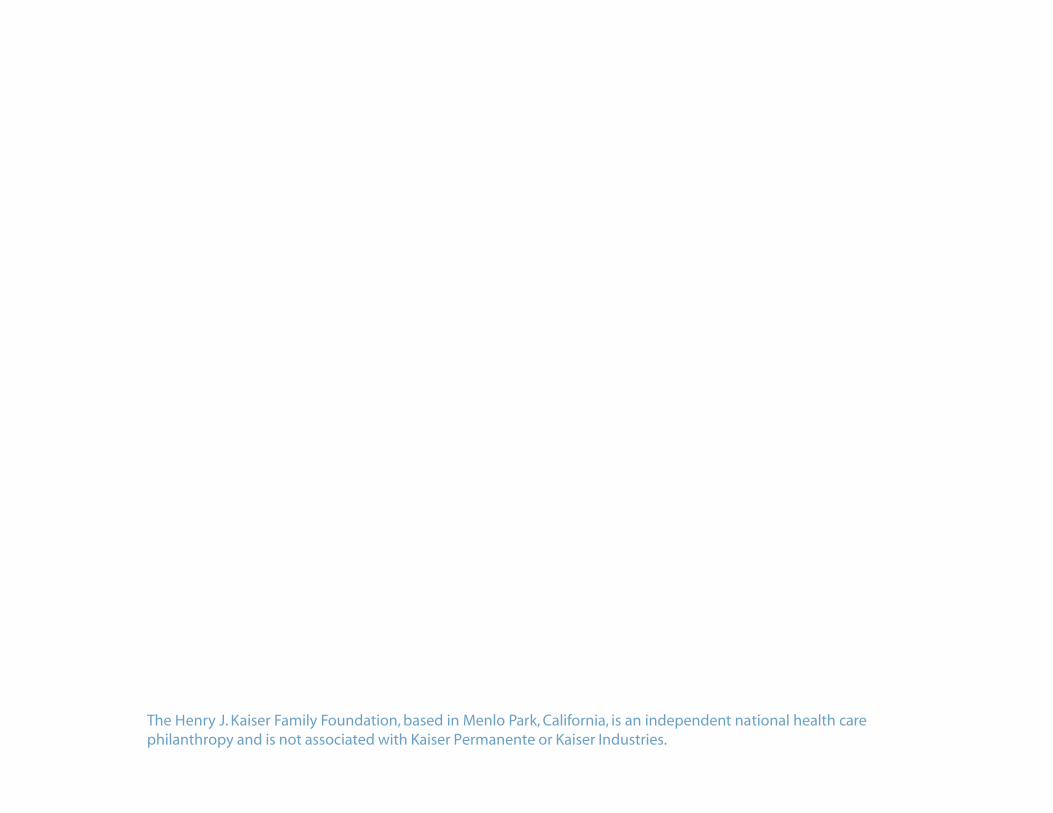
Chart 8
“How Often Does Race or Ethnic Background AffectWhether a Person Can Get. . .?”
Very/Somewhat Often Not Too Often/Never Don’t know
ROUTINE MEDICAL CARE WHEN THEY NEED IT
HEALTH INSURANCE TO PAY FOR MEDICAL CARE
SPECIALIZED TREATMENTS OR SURGERY WHEN THEY NEED IT
62%
48%
45%
34%
4%
4%
8%
51%
44%
Latinos Say
African Americans Say
Whites Say
60%
47%
40%
36%
3%
3%
7%
56%
45%
Latinos Say
African Americans Say
Whites Say
Source: Kaiser Family Foundation Survey of Race, Ethnicity and Medical Care: Public Perceptions and Experiences, October 1999 (Conducted July - Sept, 1999)
62%
46%
41%
35%
4%
3%
6%
54%
47%
Latinos Say
African Americans Say
Whites Say

Chart 9
“How Often Do You Think Our Health Care SystemTreats People Unfairly Based On...?”
HOW MUCH MONEY THEY HAVE
Very/Somewhat Often Not Too Often/Never Don’t Know
64%
72%
70%
32%
25%
26%
4%
3%
4%
Latinos Say
African Americans Say
Whites Say
WHETHER OR NOT THEY HAVE HEALTH INSURANCE
WHETHER THEY ARE MALE OR FEMALE
HOW WELL THEY SPEAK ENGLISH
WHAT THEIR RACE / ETHNIC BACKGROUND IS
WHETHER OR NOT THEY ARE OVERWEIGHT
69%
72%
69%
28%
24%
24%
3%
4%
7%
Latinos Say
African Americans Say
Whites Say
32%
34%
26%
65%
59%
67%
4%
7%
7%
Latinos Say
African Americans Say
Whites Say
72%
55%
57%
26%
37%
30%
2%
8%
13%
Latinos Say
African Americans Say
Whites Say
51%
56%
46%
43%
38%
43%
5%
5%
11%
Latinos Say
African Americans Say
Whites Say
50%
48%
36%
40%
44%
51%
10%
8%
13%
Latinos Say
African Americans Say
Whites Say
Source: Kaiser Family Foundation Survey of Race, Ethnicity and Medical Care: Public Perceptions and Experiences, October 1999 (Conducted July - Sept, 1999)

Chart 10
Personal Experiences With the Health Care System
THEIR ABILITY TO PAY FOR THE CARE
THE TYPE OF HEALTH INSURANCE THEY HAVEOR BECAUSE THEY DON’T HAVE HEALTHINSURANCE
Percent who say that they have felt that a doctor or health provider judgedthem unfairly or treated them with disrespect because of ...
THEIR RACE OR ETHNIC BACKGROUND
HOW WELL THEY SPEAK ENGLISH
Whites Say
African Americans Say
Latinos Say
Whites Say
African Americans Say
Latinos Say
Whites Say
African Americans Say
Latinos Say
Whites Say
African Americans Say
Latinos Say21%
20%
14%
16%
10%
9%
* Don’t knows not shown
Source: Kaiser Family Foundation Survey of Race, Ethnicity and Medical Care: Public Perceptions and Experiences, October 1999 (Conducted July - Sept, 1999)
14%
15%
5%
12%
1%
1%
Chart 11
Experience With Being Treated Unfairly When SeekingMedical Care Because of Race or Ethnic Background
HAVE YOU?
A FAMILY MEMBER?
A FRIEND OR SOMEONE YOU KNOW?
Percent Saying YesYes to any: You, a family member, afriend or someone you know was treatedunfairly because of race/ethnicbackground when getting medical care
Whites Say
African Americans Say
Latinos Say
Whites Say
African Americans Say
Latinos Say
Whites Say
African Americans Say
Latinos Say
Whites Say
African Americans Say
Latinos Say
25%
21%
13%
27%
18%
14%
13%
4%
1%
36%
35%
15%
* Don’t knows not shown
Source: Kaiser Family Foundation Survey of Race, Ethnicity and Medical Care: Public Perceptions and Experiences, October 1999 (Conducted July - Sept, 1999)

Chart 12
“For the Average African American, How Big a Problem is…?”
BEING ABLE TO AFFORD THE COST OF HEALTH INSURANCE AND NECESSARY MEDICAL CARE
HAVING ENOUGH DOCTORS AND OTHER HEALTH PROVIDERS NEAR WHERE THEY LIVE
HAVING DIFFICULTY GETTING CARE BECAUSE OF THEIR RACE OR ETHNIC BACKGROUND
Major Problem Minor Problem Not a Problem
26%
35%
38%
17%
28%
3%
8%
45%African
Americans Say
Whites Say
18%
15%
30%
3%
5%
40% 42%
47%
AfricanAmericans Say
Whites Say
Source: Kaiser Family Foundation Survey of Race, Ethnicity and Medical Care: Public Perceptions and Experiences, October 1999 (Conducted July - Sept, 1999)
Don’t Know
47%
23%
36%
5%
11%
1%
5%
71%African
Americans Say
Whites Say

Chart 13
“For the Average Latino, How Big a Problem is…?”
BEING ABLE TO AFFORD THE COST OF HEALTH INSURANCE AND NECESSARY MEDICAL CARE
HAVING ENOUGH DOCTORS AND OTHER HEALTH PROVIDERS NEAR WHERE THEY LIVE
HAVING DIFFICULTY GETTING CARE BECAUSE OF THEIR RACE OR ETHNIC BACKGROUND
Major Problem Minor Problem Not a Problem
21%
31%
37%
32%
29%
4%
13%
33%Latinos Say
Whites Say
17%
24%
30%
4%
11%
28% 44%
42%
Latinos Say
Whites Say
Source: Kaiser Family Foundation Survey of Race, Ethnicity and Medical Care: Public Perceptions and Experiences, October 1999 (Conducted July - Sept, 1999)
Don’t Know
47%
24%
28%
9%
14%
4%
11%
63%Latinos Say
Whites Say

Chart 14
Concern that in the Future When Seeking Medical Care“You or a Family Member will be treated Unfairly
Specifically Because of Your Race or Ethnic Background”
65%
22%
42%
33%
58%
76%
Latinos Say
African Americans Say
Whites Say
Very/Somewhat concerned Not too/Not at all concerned
* Don’t knows not shown
Source: Kaiser Family Foundation Survey of Race, Ethnicity and Medical Care: Public Perceptions and Experiences, October 1999 (Conducted July - Sept, 1999)
The Henry J. Kaiser Family Foundation2400 Sand Hill Road
Menlo Park, CA 94025
650-854-9400 Facsimile: 650-854-4800
Washington Office:1450 G Street N.W., Suite 250
Washington, DC 20005
202-347-5270 Facsimile 202-347-5274
http://www.kff.org
Additional free copies of this report (#1528) are available on our website or throughour publication request line at 800-656-4533.