Embed Size (px)
Citation preview
R Peak Detection Algorithm based on Continuous Wavelet Transform and Shannon Energy 167
R Peak Detection Algorithm based onContinuous Wavelet Transform and Shannon
Energy
Nantarika Thiamchoo1 and Pornchai Phukpattaranont2 , Members
ABSTRACT
The R peak detection algorithm is a necessary toolfor monitoring and diagnosing the cardiovascular dis-ease. This paper presents the R peak detection algo-rithm based on continuous wavelet transform (CWT)and Shannon energy. We evaluate the proposed algo-rithm with the 48 record of ECG data from MIT-BIHarrhythmia database. Results show that the proposedalgorithm gives very good DER (0.48%-0.50%) com-pared to those from previous publications (0.168%-0.87%). We demonstrated that the use of the CWTwith a single scaling parameter is capable of removingnoises. In addition, we found that Shannon energycannot improve the DER value but it can highlightthe R peak from the low QRS complex in ECG beatleading to the improvement in the robustness of theR peak detection algorithm.
Keywords: R Peak Detection Algorithm; WaveletTransform; Shannon Energy; Electrocardiography(ECG)
1. INTRODUCTION
In order to be alive, the heart is an important or-gan to pump the blood containing with the oxygenand the nutrient to cells in our body. Currently, thehuman behaviors, such as unhealthy diet, physicalinactivity, smoking and alcohol, lead to the risk ofcardiovascular disease (CVD). These behaviors makethe raised blood pressure, the raised blood glucose,and the raised blood lipids resulting in heart attack,stroke, or heart failure. According to the WorldHealth Organization (WHO) report, CVDs are thefirst cause of death worldwide [1]. In 2012, about17.5 million people died from CVDs. It is 31% ofall global deaths. Moreover, CVDs were the secondcause of death in the United Kingdom [2]. It is 27%of all deaths in 2014.
The electrocardiography (ECG) is a standard toolfor monitoring and diagnosing diseases related to theCVDs for prevention and treatment. Normally, the
Manuscript received on September 15, 2016 ; revised onNovember 21, 2016.Final manuscript received on February 21, 2017.1,2 The authors are with the Department of Electrical En-
gineering, Faculty of Engineering, Prince of Songkla Uni-versity, Hat Yai, Songkhla, 90112 Thailand., E-mail: [email protected] and [email protected]
ECG signal consists of P wave, QRS complex and Twave. The R peak is important for the heart ratecalculation and is used as a preliminary step in beatsegmentation algorithm. In practice, the ECG signalrecording was often contaminated with a variety ofnoises such as baseline wandering noise, power lineinterference noise, muscles noise (electromyographynoise), motion artefact noise, and electrode pop orcontact noise. These noises cause the difficulty in de-tecting R peak. Then, the R peak detection algorithmthat is capable of eliminating noise is very important.
For over last decades, various R peak detectionalgorithms were developed [3-11]. The principle ofthese algorithms consists of 4 main parts: signalpre-processing or noise removal, envelope detection,peak detection, and post-processing. For signal pre-processing, many techniques were applied to suppressnoise. One of the well-known techniques is wavelettransform (WT). Many researches developed the Rpeak detection algorithm based on WT [3-4]. Severalwavelet functions were studied including Harr, Gaus-sian, Mexican hat and Morlet wavelet functions [3].Results show that the Mexican hat wavelet functionprovided the highest performance. The output fromsignal pre-processing part was used for calculating theenvelope signal, which is used to define QRS complexduration.
Shannon energy is a successful method in detectingthe envelope signal in heart sound [12]. Recently, itwas applied in R peak detection algorithm [5, 6]. Re-sults show that the good detection error rate at 0.17%[6] and 0.25% [5] tested with all ECG records fromMIT-BIH arrhythmias database can be obtained.
In the peak detection processing part, the thresh-olding techniques are widely used [5, 7]. Normally,the thresholding techniques are divided into 2 types:the fixed thresholding and the adaptive thresholding.For fixed thresholding, the threshold value will be setto a constant value over time by experts. Althoughthe method has a low computational complexity, it isvery sensitive to noises. To improve the performance,the adaptive thresholding method was applied. Thethreshold value will adjust itself based on the definedmathematical model.
To increase the efficiency of the R peak detec-tion algorithm, some researches included the post-processing part such as search back method [5-6, 9].It is the method used for reducing the number of false
168 ECTI TRANSACTIONS ON COMPUTER AND INFORMATION TECHNOLOGY VOL.10, NO.2 November 2016
negative. When the algorithm cannot find the R peakwithin 150% of recent R-R interval, the threshold willbe decreased to the half [5].
This paper presents the R peak detection algo-rithm based on continuous wavelet transform andShannon energy. We point out the effect on usingShannon energy in our R peak detection algorithm.The rest of this paper is organized as follows. Section2 describes the details of the proposed R peak detec-tion algorithm and performance evaluation method.The results and discussion are presented in section 3.Finally, conclusions of this paper are given in section4.
2. THEORY
2.1 Continuous wavelet transform
The continuous wavelet transform (CWT) wasused for noise removal process. It is a method forconverting a signal into another form that can be rep-resented in time-frequency relationship. The waveletcoefficient of signal, CWT(a, b), can be expressed as
CWT (a, b) =1√a
∞∫−∞
x(t)ψ
(t− b
a
)dt, (1)
where x(t) is the ECG signal in this paper, ψ(t) isthe wavelet function, a is a scaling parameter, and bis a location parameter.
As shown in (1), the output from CWT value in-dicates the similarity level between the ECG signalx(t) and the wavelet function. In the context of Rpeak detection algorithm, we need the wavelet func-tion that has a similar shape to the pattern of QRSwaveform in the ECG signal so that the QRS signalto noise ratio is maximized. Therefore, the suitablewavelet function is very important. In this work, weuse the Mexican hat wavelet function, which is givenby
ψ(t) = (1− t2)e−t2
2 . (2)
We can see from (2) that the Mexican hat waveletfunction is the second derivative of a Gaussian func-tion.
2.2 Shannon energy
Shannon energy is one of methods used to generatean envelope of the heart sound for estimating systoleand diastole periods [12]. Recently, this method wasapplied in the field of R peak detection. The Shannonenergy, S[n], is formulated by
S[n] = −N [n]2 log2N [n]2 (3)
where N [n] is the normalized ECG signal after noiseremoval in this paper. The Shannon energy has the
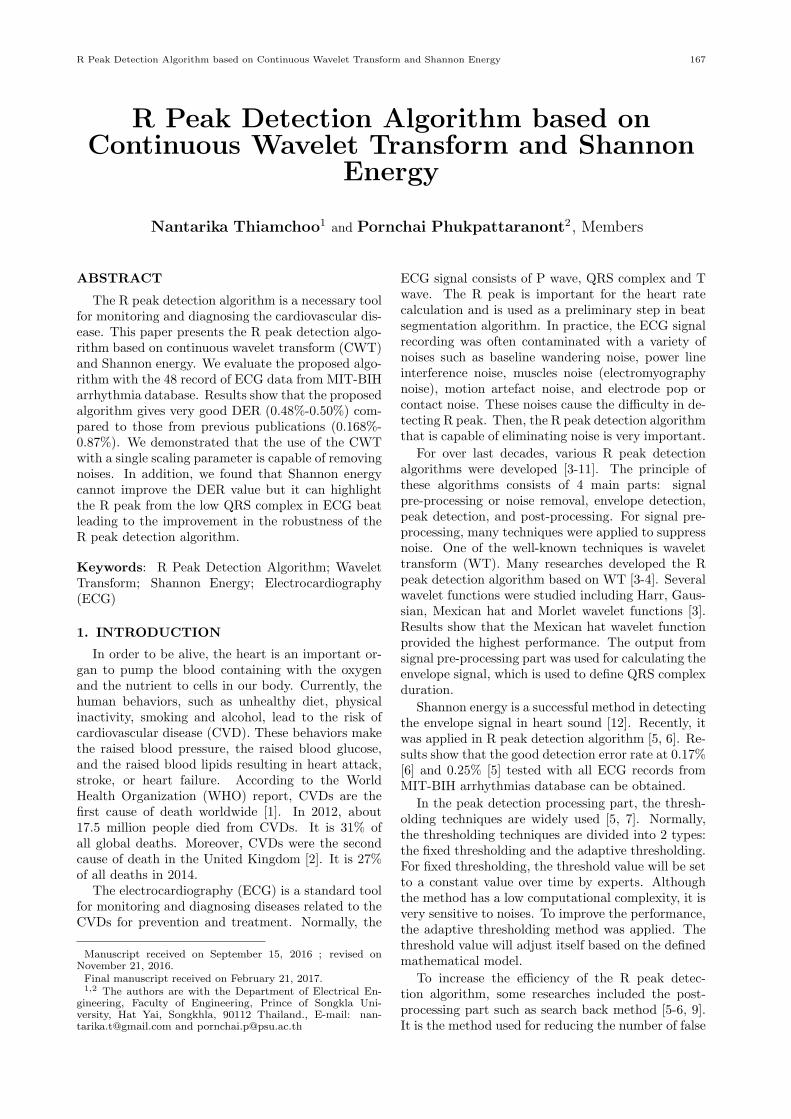
Fig.1: The block diagram of proposed R peak detec-tion algorithm.
better capability in emphasizing the low and mediumR peak amplitudes compared to the conventionalsquare energy operation. As a result, the R-peaksignal after processing with the Shannon energy doesnot have significant differences in terms of amplitude.This makes the use of a single thresholding techniquein R peak detection algorithm possible.
3. MATERIALS AND METHODS
3.1 Proposed algorithm
Fig. 1 shows a block diagram of the proposed algo-rithm. The original ECG signal, x[n], was processedwith CTW for noise removal. Then, the output fromCWT, y[n], was calculated using a square energy op-eration as given by
y2[n] = y[n]× y[n]. (4)
Subsequently, the output from the square energyoperation was normalized with the maximum ampli-tude of y2[n], which can be expressed as
N [n] =y2[n]
max(y2[n])(5)
Subsequently, we computed the Shannon energyof signal N [n] using (3). Next step, we determinethe envelope signal z[n] for defining the QRS timeduration used for R peak detection by the maximumfilter, which is given by
z[n] = maxk∈[n−L+1,n]
S[k], (6)
where L is the length of maximum filter. It was variedfrom 50 ms to 400 ms in this paper.
In order to detect R peak, we use a single fixedthresholding method, which is given by
Thv = λ×max(z[n]), (7)
where λ is a constant. The threshold value Thv de-termined using λ will separate the R peak from noise.Too low threshold value results in detecting noise as

R Peak Detection Algorithm based on Continuous Wavelet Transform and Shannon Energy 169
the R peak. On the other hand, too high thresh-old value lead to missing R peak detection. In thispaper, λ was empirically varied to achieve minimumerror detection rate. The QRS durations where the Rpeak signals locate are defined when the output sig-nal from the maximum filter z[n] is greater than theThv value. Then, we compute the R peak location atthe maximum value in y2[n].
3.2 ECG data and performance evaluation
For evaluating the performance of the proposed al-gorithm, the ECG signal from MIT-BIH arrhythmiadatabases [10] was analyzed. It consisted of 2 chan-nels of ECG signals acquired at a sampling frequencyof 360 Hz for 30 minutes. Moreover, the annotationfrom an expert was given. To demonstrate the per-formance of the proposed algorithm, we used threestatistical values: the sensitivity (SEN), the positivepredictive rate (PPR), and the detection error rate(DER). These values can be computed as follows:
SEN =TP
TP + FN× 100%, (8)
PPR =TP
TP + FP× 100%, (9)
DER =FN+ FP
TP + FN× 100%, (10)
where true-positive (TP) is the number of correct Rpeaks detected by the algorithm, false-negative (FN)is the number of missing R peaks detected, and false-positive (FP) is the number of incorrect R peaks de-tected by the algorithm.
4. RESULTS AND DISCUSSION
4.1 Parameter optimization
To analyze the capability of noise suppression us-ing CWT and Shannon energy, we vary a scaling pa-rameter a between 2 and 4 with a step size of 0.1. Inaddition, the maximum filter length (L) was variedbetween 50 and 400 ms with a step size of 25 ms. Wefound that the scaling parameter a 2.5 and the max-imum filter length L = 275 ms provide the best DERvalue.To investigate the effect of Shannon energy on theproposed R peak algorithm, the results from the pro-posed algorithm with and without Shannon energyoperation are shown. Fig. 2 shows the detection er-ror rate from proposed algorithm without Shannonenergy calculation at the length L = 275 ms as afunction of Thv between 1% and 7% of maximumsignal amplitude. The minimum DER value 0.48%is obtained when the Thv is 3% of maximum signalamplitude
Fig. 3 shows the detection error rate from pro-posed algorithm with Shannon energy calculation atthe length L = 275 ms as a function of Thv between
Fig.2: The detection error rate from proposed al-gorithm without Shannon energy calculation at thelength L = 275 ms as a function of Thv.
Fig.3: The detection error rate from proposed algo-rithm with Shannon energy calculation at the lengthL = 275 ms as a function of Thv.
10% and 70% of maximum signal amplitude. Resultsshow that the minimum DER value 0.50% is obtainedwhen the Thv is 30%.
Although the proposed algorithm without Shan-non energy can provide lower DER value than theproposed algorithm with Shannon energy calculation,the range of its threshold value is narrower. In otherwords, while the range of the Thv that provides theDER value lower than 1.5% is between 2% and 5%for the proposed algorithm without Shannon energy,the wider range of those from the proposed algorithmwith Shannon energy is obtained between 20% and40%. This is very important because it allows formore flexibility when the single fixed thresholdingtechnique in the R peak detection algorithm is used.
4.2 Signal characteristics
To compare the advantage of Shannon energy op-eration, example results from ECG data record num-
170 ECTI TRANSACTIONS ON COMPUTER AND INFORMATION TECHNOLOGY VOL.10, NO.2 November 2016
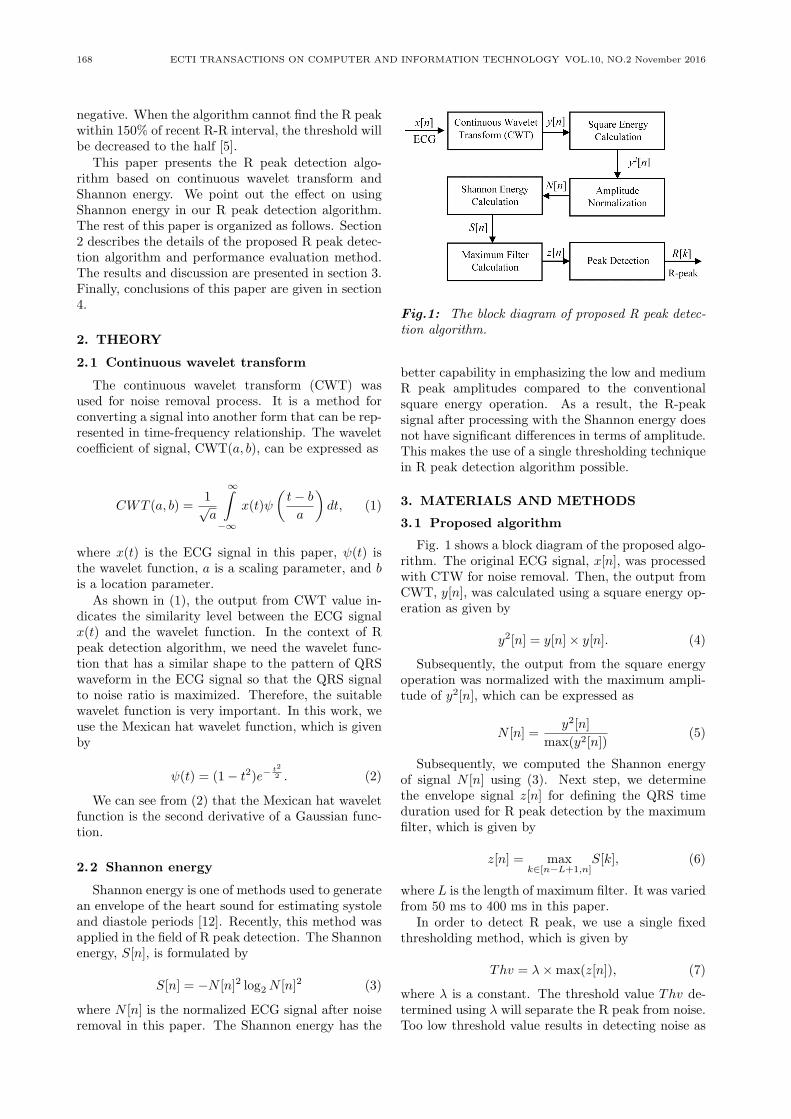
Fig.4: The result of proposed algorithm without Fig.5: The result of proposed algorithm with Shan-Shannon energy calculation applied on ECG sig- non energy calculation applied on ECG signal recordnal record 108. 108.
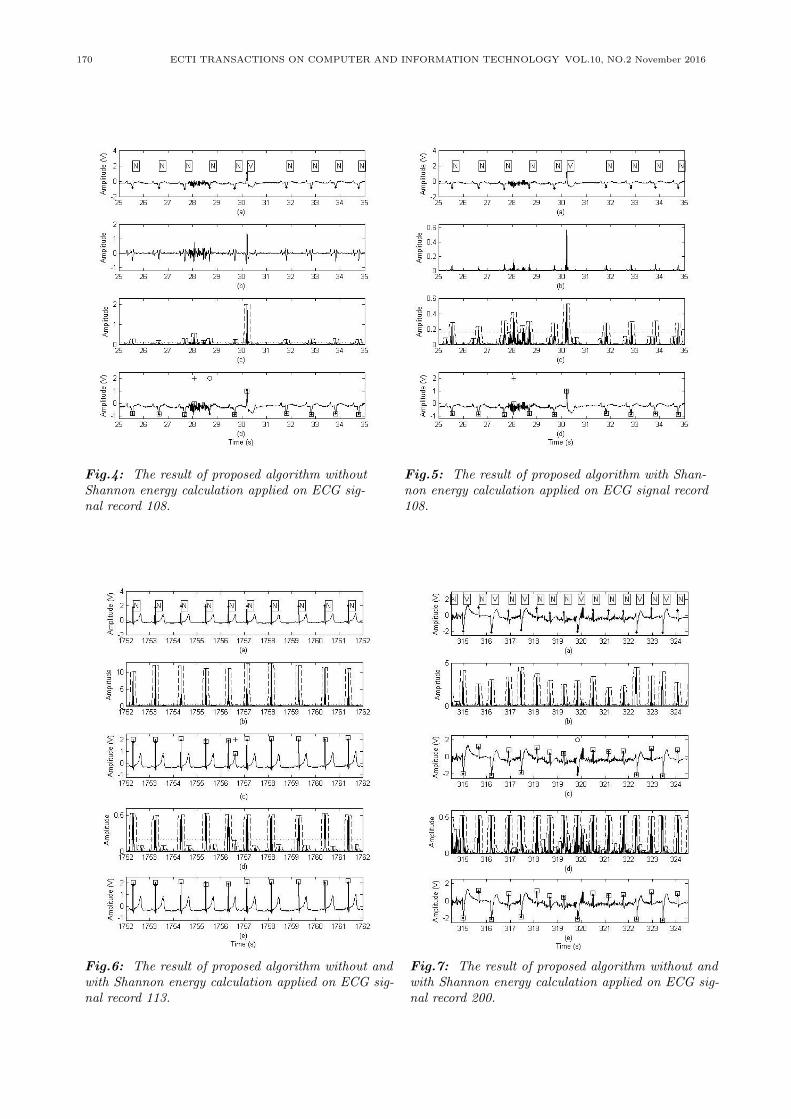
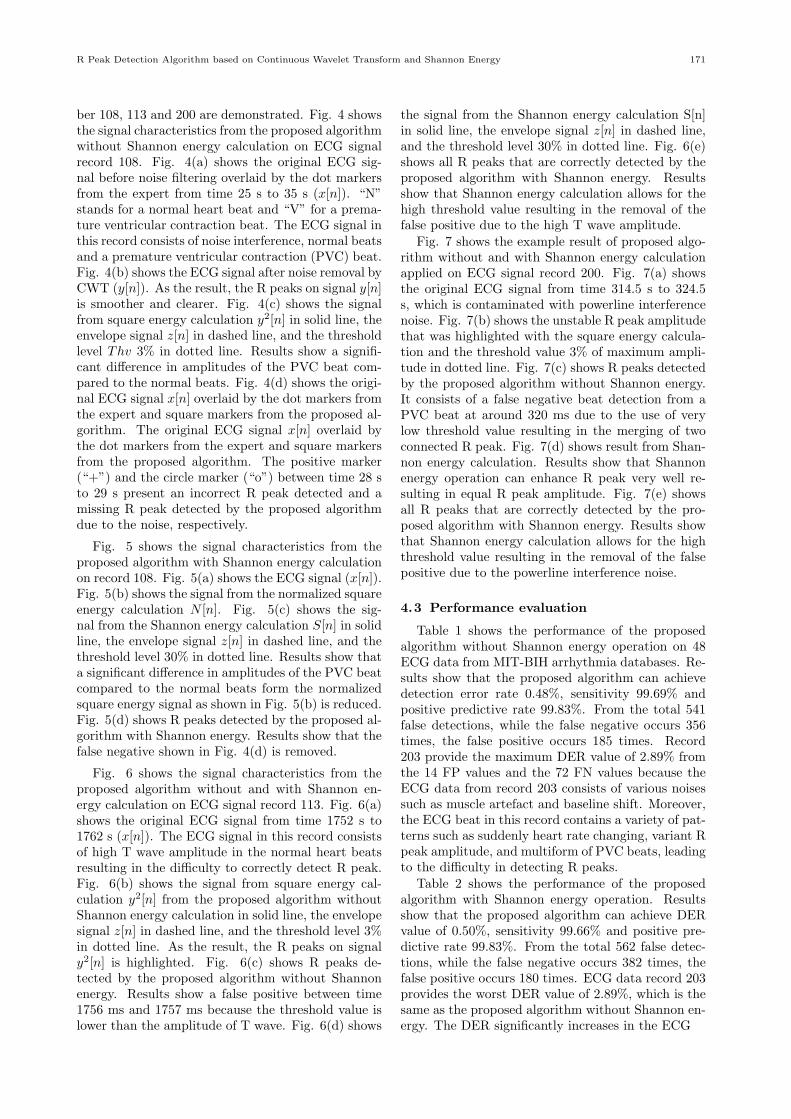
Fig.6: The result of proposed algorithm without and Fig.7: The result of proposed algorithm without andwith Shannon energy calculation applied on ECG sig- with Shannon energy calculation applied on ECG sig-nal record 113. nal record 200.
R Peak Detection Algorithm based on Continuous Wavelet Transform and Shannon Energy 171
ber 108, 113 and 200 are demonstrated. Fig. 4 showsthe signal characteristics from the proposed algorithmwithout Shannon energy calculation on ECG signalrecord 108. Fig. 4(a) shows the original ECG sig-nal before noise filtering overlaid by the dot markersfrom the expert from time 25 s to 35 s (x[n]). “N”stands for a normal heart beat and “V” for a prema-ture ventricular contraction beat. The ECG signal inthis record consists of noise interference, normal beatsand a premature ventricular contraction (PVC) beat.Fig. 4(b) shows the ECG signal after noise removal byCWT (y[n]). As the result, the R peaks on signal y[n]is smoother and clearer. Fig. 4(c) shows the signalfrom square energy calculation y2[n] in solid line, theenvelope signal z[n] in dashed line, and the thresholdlevel Thv 3% in dotted line. Results show a signifi-cant difference in amplitudes of the PVC beat com-pared to the normal beats. Fig. 4(d) shows the origi-nal ECG signal x[n] overlaid by the dot markers fromthe expert and square markers from the proposed al-gorithm. The original ECG signal x[n] overlaid bythe dot markers from the expert and square markersfrom the proposed algorithm. The positive marker(“+”) and the circle marker (“o”) between time 28 sto 29 s present an incorrect R peak detected and amissing R peak detected by the proposed algorithmdue to the noise, respectively.
Fig. 5 shows the signal characteristics from theproposed algorithm with Shannon energy calculationon record 108. Fig. 5(a) shows the ECG signal (x[n]).Fig. 5(b) shows the signal from the normalized squareenergy calculation N [n]. Fig. 5(c) shows the sig-nal from the Shannon energy calculation S[n] in solidline, the envelope signal z[n] in dashed line, and thethreshold level 30% in dotted line. Results show thata significant difference in amplitudes of the PVC beatcompared to the normal beats form the normalizedsquare energy signal as shown in Fig. 5(b) is reduced.Fig. 5(d) shows R peaks detected by the proposed al-gorithm with Shannon energy. Results show that thefalse negative shown in Fig. 4(d) is removed.
Fig. 6 shows the signal characteristics from theproposed algorithm without and with Shannon en-ergy calculation on ECG signal record 113. Fig. 6(a)shows the original ECG signal from time 1752 s to1762 s (x[n]). The ECG signal in this record consistsof high T wave amplitude in the normal heart beatsresulting in the difficulty to correctly detect R peak.Fig. 6(b) shows the signal from square energy cal-culation y2[n] from the proposed algorithm withoutShannon energy calculation in solid line, the envelopesignal z[n] in dashed line, and the threshold level 3%in dotted line. As the result, the R peaks on signaly2[n] is highlighted. Fig. 6(c) shows R peaks de-tected by the proposed algorithm without Shannonenergy. Results show a false positive between time1756 ms and 1757 ms because the threshold value islower than the amplitude of T wave. Fig. 6(d) shows
the signal from the Shannon energy calculation S[n]in solid line, the envelope signal z[n] in dashed line,and the threshold level 30% in dotted line. Fig. 6(e)shows all R peaks that are correctly detected by theproposed algorithm with Shannon energy. Resultsshow that Shannon energy calculation allows for thehigh threshold value resulting in the removal of thefalse positive due to the high T wave amplitude.
Fig. 7 shows the example result of proposed algo-rithm without and with Shannon energy calculationapplied on ECG signal record 200. Fig. 7(a) showsthe original ECG signal from time 314.5 s to 324.5s, which is contaminated with powerline interferencenoise. Fig. 7(b) shows the unstable R peak amplitudethat was highlighted with the square energy calcula-tion and the threshold value 3% of maximum ampli-tude in dotted line. Fig. 7(c) shows R peaks detectedby the proposed algorithm without Shannon energy.It consists of a false negative beat detection from aPVC beat at around 320 ms due to the use of verylow threshold value resulting in the merging of twoconnected R peak. Fig. 7(d) shows result from Shan-non energy calculation. Results show that Shannonenergy operation can enhance R peak very well re-sulting in equal R peak amplitude. Fig. 7(e) showsall R peaks that are correctly detected by the pro-posed algorithm with Shannon energy. Results showthat Shannon energy calculation allows for the highthreshold value resulting in the removal of the falsepositive due to the powerline interference noise.
4.3 Performance evaluation
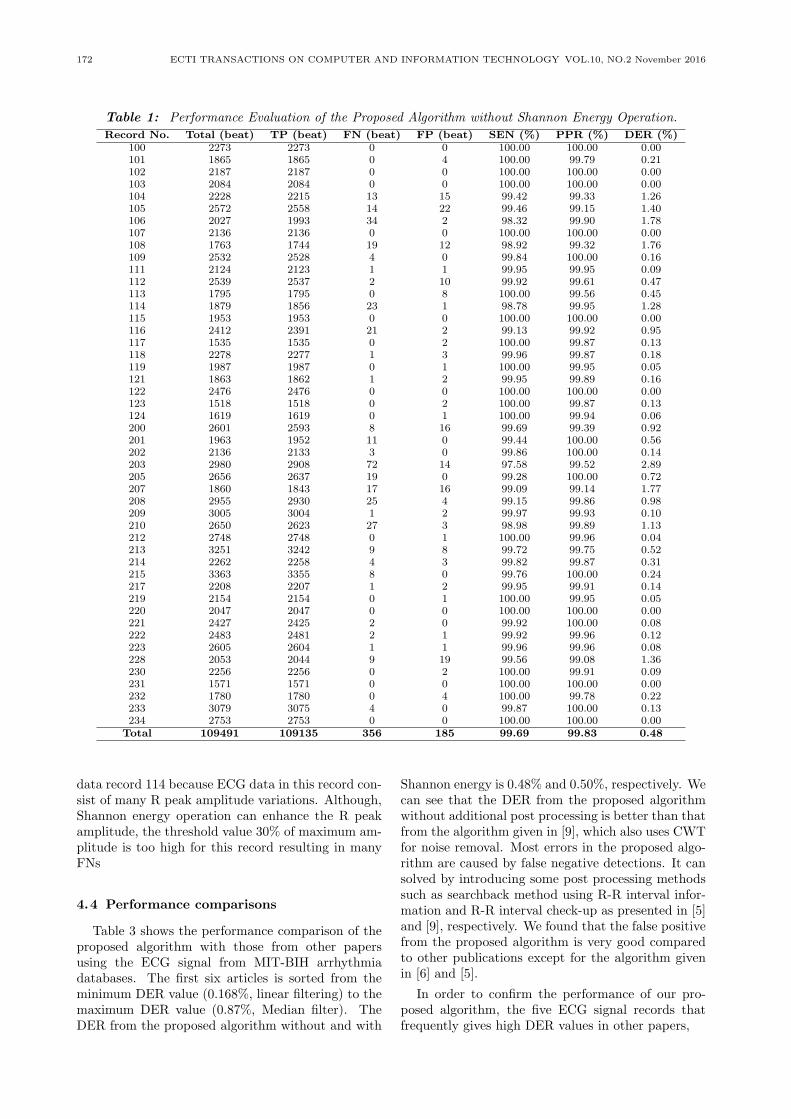
Table 1 shows the performance of the proposedalgorithm without Shannon energy operation on 48ECG data from MIT-BIH arrhythmia databases. Re-sults show that the proposed algorithm can achievedetection error rate 0.48%, sensitivity 99.69% andpositive predictive rate 99.83%. From the total 541false detections, while the false negative occurs 356times, the false positive occurs 185 times. Record203 provide the maximum DER value of 2.89% fromthe 14 FP values and the 72 FN values because theECG data from record 203 consists of various noisessuch as muscle artefact and baseline shift. Moreover,the ECG beat in this record contains a variety of pat-terns such as suddenly heart rate changing, variant Rpeak amplitude, and multiform of PVC beats, leadingto the difficulty in detecting R peaks.
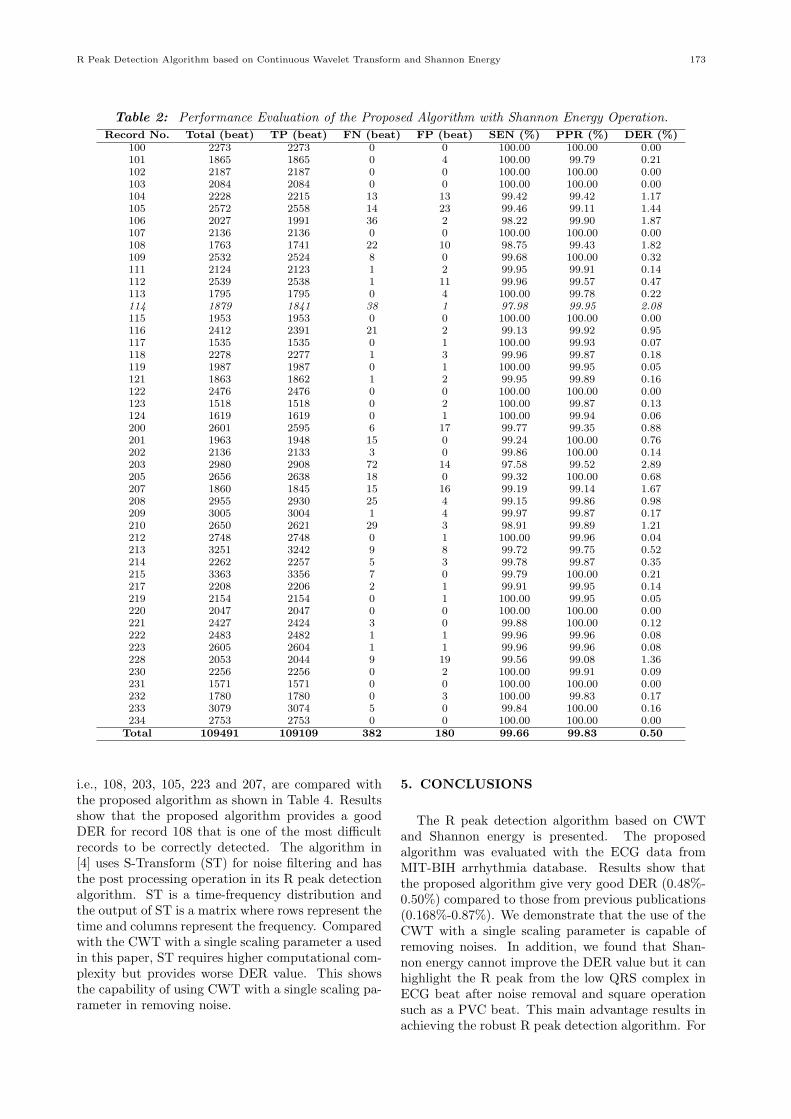
Table 2 shows the performance of the proposedalgorithm with Shannon energy operation. Resultsshow that the proposed algorithm can achieve DERvalue of 0.50%, sensitivity 99.66% and positive pre-dictive rate 99.83%. From the total 562 false detec-tions, while the false negative occurs 382 times, thefalse positive occurs 180 times. ECG data record 203provides the worst DER value of 2.89%, which is thesame as the proposed algorithm without Shannon en-ergy. The DER significantly increases in the ECG
172 ECTI TRANSACTIONS ON COMPUTER AND INFORMATION TECHNOLOGY VOL.10, NO.2 November 2016
Table 1: Performance Evaluation of the Proposed Algorithm without Shannon Energy Operation.
Record No. Total (beat) TP (beat) FN (beat) FP (beat) SEN (%) PPR (%) DER (%)100 2273 2273 0 0 100.00 100.00 0.00101 1865 1865 0 4 100.00 99.79 0.21102 2187 2187 0 0 100.00 100.00 0.00103 2084 2084 0 0 100.00 100.00 0.00104 2228 2215 13 15 99.42 99.33 1.26105 2572 2558 14 22 99.46 99.15 1.40106 2027 1993 34 2 98.32 99.90 1.78107 2136 2136 0 0 100.00 100.00 0.00108 1763 1744 19 12 98.92 99.32 1.76109 2532 2528 4 0 99.84 100.00 0.16111 2124 2123 1 1 99.95 99.95 0.09112 2539 2537 2 10 99.92 99.61 0.47113 1795 1795 0 8 100.00 99.56 0.45114 1879 1856 23 1 98.78 99.95 1.28115 1953 1953 0 0 100.00 100.00 0.00116 2412 2391 21 2 99.13 99.92 0.95117 1535 1535 0 2 100.00 99.87 0.13118 2278 2277 1 3 99.96 99.87 0.18119 1987 1987 0 1 100.00 99.95 0.05121 1863 1862 1 2 99.95 99.89 0.16122 2476 2476 0 0 100.00 100.00 0.00123 1518 1518 0 2 100.00 99.87 0.13124 1619 1619 0 1 100.00 99.94 0.06200 2601 2593 8 16 99.69 99.39 0.92201 1963 1952 11 0 99.44 100.00 0.56202 2136 2133 3 0 99.86 100.00 0.14203 2980 2908 72 14 97.58 99.52 2.89205 2656 2637 19 0 99.28 100.00 0.72207 1860 1843 17 16 99.09 99.14 1.77208 2955 2930 25 4 99.15 99.86 0.98209 3005 3004 1 2 99.97 99.93 0.10210 2650 2623 27 3 98.98 99.89 1.13212 2748 2748 0 1 100.00 99.96 0.04213 3251 3242 9 8 99.72 99.75 0.52214 2262 2258 4 3 99.82 99.87 0.31215 3363 3355 8 0 99.76 100.00 0.24217 2208 2207 1 2 99.95 99.91 0.14219 2154 2154 0 1 100.00 99.95 0.05220 2047 2047 0 0 100.00 100.00 0.00221 2427 2425 2 0 99.92 100.00 0.08222 2483 2481 2 1 99.92 99.96 0.12223 2605 2604 1 1 99.96 99.96 0.08228 2053 2044 9 19 99.56 99.08 1.36230 2256 2256 0 2 100.00 99.91 0.09231 1571 1571 0 0 100.00 100.00 0.00232 1780 1780 0 4 100.00 99.78 0.22233 3079 3075 4 0 99.87 100.00 0.13234 2753 2753 0 0 100.00 100.00 0.00
Total 109491 109135 356 185 99.69 99.83 0.48
data record 114 because ECG data in this record con-sist of many R peak amplitude variations. Although,Shannon energy operation can enhance the R peakamplitude, the threshold value 30% of maximum am-plitude is too high for this record resulting in manyFNs
4.4 Performance comparisons
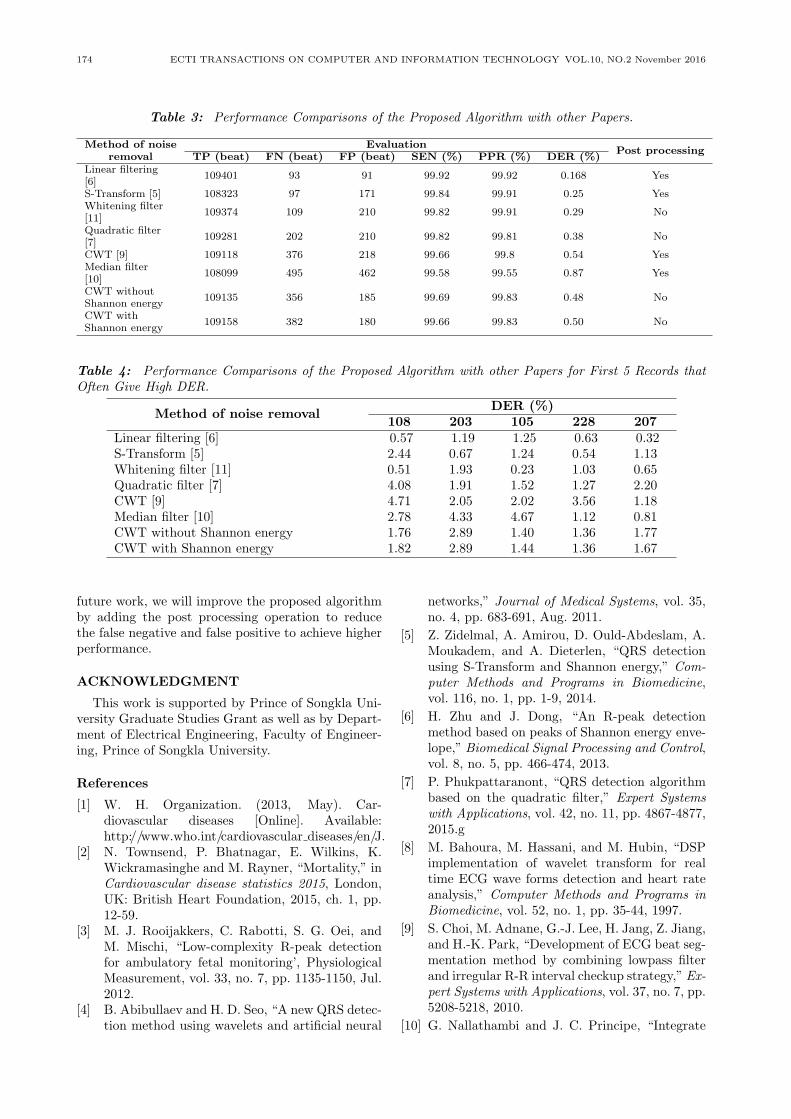
Table 3 shows the performance comparison of theproposed algorithm with those from other papersusing the ECG signal from MIT-BIH arrhythmiadatabases. The first six articles is sorted from theminimum DER value (0.168%, linear filtering) to themaximum DER value (0.87%, Median filter). TheDER from the proposed algorithm without and with
Shannon energy is 0.48% and 0.50%, respectively. Wecan see that the DER from the proposed algorithmwithout additional post processing is better than thatfrom the algorithm given in [9], which also uses CWTfor noise removal. Most errors in the proposed algo-rithm are caused by false negative detections. It cansolved by introducing some post processing methodssuch as searchback method using R-R interval infor-mation and R-R interval check-up as presented in [5]and [9], respectively. We found that the false positivefrom the proposed algorithm is very good comparedto other publications except for the algorithm givenin [6] and [5].
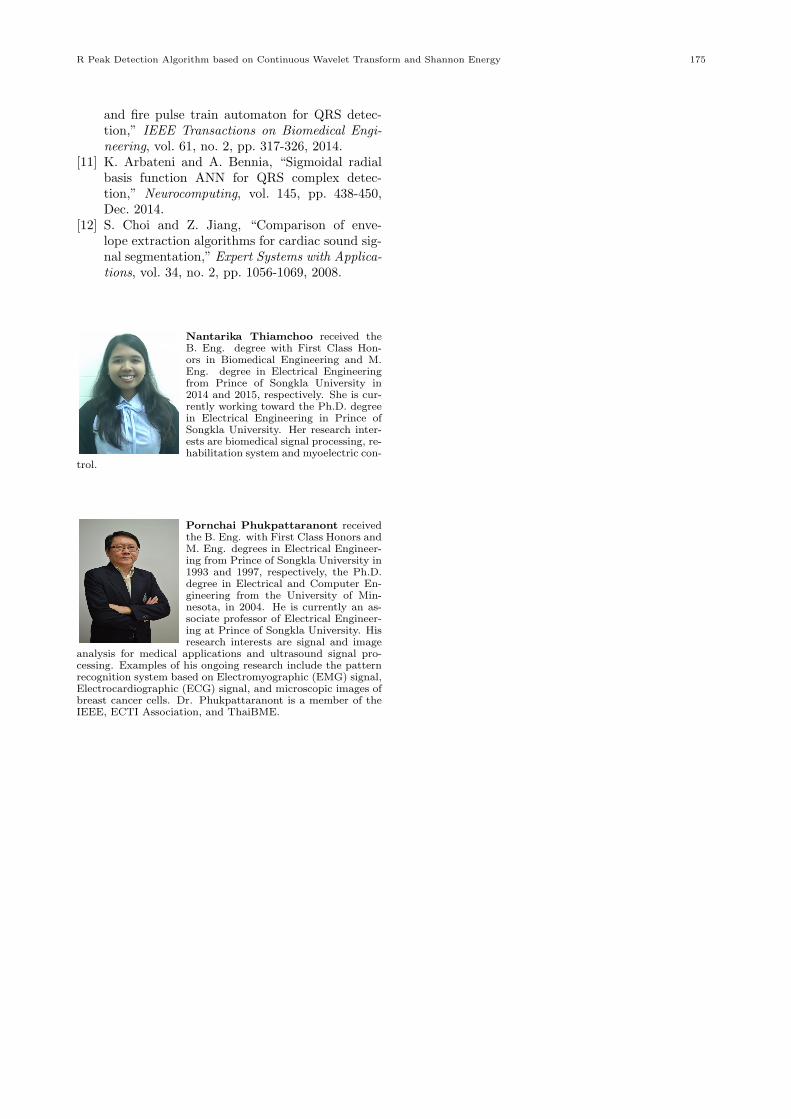
In order to confirm the performance of our pro-posed algorithm, the five ECG signal records thatfrequently gives high DER values in other papers,
R Peak Detection Algorithm based on Continuous Wavelet Transform and Shannon Energy 173
Table 2: Performance Evaluation of the Proposed Algorithm with Shannon Energy Operation.
Record No. Total (beat) TP (beat) FN (beat) FP (beat) SEN (%) PPR (%) DER (%)100 2273 2273 0 0 100.00 100.00 0.00101 1865 1865 0 4 100.00 99.79 0.21102 2187 2187 0 0 100.00 100.00 0.00103 2084 2084 0 0 100.00 100.00 0.00104 2228 2215 13 13 99.42 99.42 1.17105 2572 2558 14 23 99.46 99.11 1.44106 2027 1991 36 2 98.22 99.90 1.87107 2136 2136 0 0 100.00 100.00 0.00108 1763 1741 22 10 98.75 99.43 1.82109 2532 2524 8 0 99.68 100.00 0.32111 2124 2123 1 2 99.95 99.91 0.14112 2539 2538 1 11 99.96 99.57 0.47113 1795 1795 0 4 100.00 99.78 0.22114 1879 1841 38 1 97.98 99.95 2.08115 1953 1953 0 0 100.00 100.00 0.00116 2412 2391 21 2 99.13 99.92 0.95117 1535 1535 0 1 100.00 99.93 0.07118 2278 2277 1 3 99.96 99.87 0.18119 1987 1987 0 1 100.00 99.95 0.05121 1863 1862 1 2 99.95 99.89 0.16122 2476 2476 0 0 100.00 100.00 0.00123 1518 1518 0 2 100.00 99.87 0.13124 1619 1619 0 1 100.00 99.94 0.06200 2601 2595 6 17 99.77 99.35 0.88201 1963 1948 15 0 99.24 100.00 0.76202 2136 2133 3 0 99.86 100.00 0.14203 2980 2908 72 14 97.58 99.52 2.89205 2656 2638 18 0 99.32 100.00 0.68207 1860 1845 15 16 99.19 99.14 1.67208 2955 2930 25 4 99.15 99.86 0.98209 3005 3004 1 4 99.97 99.87 0.17210 2650 2621 29 3 98.91 99.89 1.21212 2748 2748 0 1 100.00 99.96 0.04213 3251 3242 9 8 99.72 99.75 0.52214 2262 2257 5 3 99.78 99.87 0.35215 3363 3356 7 0 99.79 100.00 0.21217 2208 2206 2 1 99.91 99.95 0.14219 2154 2154 0 1 100.00 99.95 0.05220 2047 2047 0 0 100.00 100.00 0.00221 2427 2424 3 0 99.88 100.00 0.12222 2483 2482 1 1 99.96 99.96 0.08223 2605 2604 1 1 99.96 99.96 0.08228 2053 2044 9 19 99.56 99.08 1.36230 2256 2256 0 2 100.00 99.91 0.09231 1571 1571 0 0 100.00 100.00 0.00232 1780 1780 0 3 100.00 99.83 0.17233 3079 3074 5 0 99.84 100.00 0.16234 2753 2753 0 0 100.00 100.00 0.00
Total 109491 109109 382 180 99.66 99.83 0.50
i.e., 108, 203, 105, 223 and 207, are compared withthe proposed algorithm as shown in Table 4. Resultsshow that the proposed algorithm provides a goodDER for record 108 that is one of the most difficultrecords to be correctly detected. The algorithm in[4] uses S-Transform (ST) for noise filtering and hasthe post processing operation in its R peak detectionalgorithm. ST is a time-frequency distribution andthe output of ST is a matrix where rows represent thetime and columns represent the frequency. Comparedwith the CWT with a single scaling parameter a usedin this paper, ST requires higher computational com-plexity but provides worse DER value. This showsthe capability of using CWT with a single scaling pa-rameter in removing noise.
5. CONCLUSIONS
The R peak detection algorithm based on CWTand Shannon energy is presented. The proposedalgorithm was evaluated with the ECG data fromMIT-BIH arrhythmia database. Results show thatthe proposed algorithm give very good DER (0.48%-0.50%) compared to those from previous publications(0.168%-0.87%). We demonstrate that the use of theCWT with a single scaling parameter is capable ofremoving noises. In addition, we found that Shan-non energy cannot improve the DER value but it canhighlight the R peak from the low QRS complex inECG beat after noise removal and square operationsuch as a PVC beat. This main advantage results inachieving the robust R peak detection algorithm. For
174 ECTI TRANSACTIONS ON COMPUTER AND INFORMATION TECHNOLOGY VOL.10, NO.2 November 2016
Table 3: Performance Comparisons of the Proposed Algorithm with other Papers.
Method of noise EvaluationPost processing
removal TP (beat) FN (beat) FP (beat) SEN (%) PPR (%) DER (%)Linear filtering
109401 93 91 99.92 99.92 0.168 Yes[6]S-Transform [5] 108323 97 171 99.84 99.91 0.25 YesWhitening filter
109374 109 210 99.82 99.91 0.29 No[11]Quadratic filter
109281 202 210 99.82 99.81 0.38 No[7]CWT [9] 109118 376 218 99.66 99.8 0.54 YesMedian filter
108099 495 462 99.58 99.55 0.87 Yes[10]CWT without
109135 356 185 99.69 99.83 0.48 NoShannon energyCWT with
109158 382 180 99.66 99.83 0.50 NoShannon energy
Table 4: Performance Comparisons of the Proposed Algorithm with other Papers for First 5 Records thatOften Give High DER.
Method of noise removalDER (%)
108 203 105 228 207Linear filtering [6] 0.57 1.19 1.25 0.63 0.32S-Transform [5] 2.44 0.67 1.24 0.54 1.13Whitening filter [11] 0.51 1.93 0.23 1.03 0.65Quadratic filter [7] 4.08 1.91 1.52 1.27 2.20CWT [9] 4.71 2.05 2.02 3.56 1.18Median filter [10] 2.78 4.33 4.67 1.12 0.81CWT without Shannon energy 1.76 2.89 1.40 1.36 1.77CWT with Shannon energy 1.82 2.89 1.44 1.36 1.67
future work, we will improve the proposed algorithmby adding the post processing operation to reducethe false negative and false positive to achieve higherperformance.
ACKNOWLEDGMENT
This work is supported by Prince of Songkla Uni-versity Graduate Studies Grant as well as by Depart-ment of Electrical Engineering, Faculty of Engineer-ing, Prince of Songkla University.
References
[1] W. H. Organization. (2013, May). Car-diovascular diseases [Online]. Available:http://www.who.int/cardiovascular diseases/en/J.
[2] N. Townsend, P. Bhatnagar, E. Wilkins, K.Wickramasinghe and M. Rayner, “Mortality,” inCardiovascular disease statistics 2015, London,UK: British Heart Foundation, 2015, ch. 1, pp.12-59.
[3] M. J. Rooijakkers, C. Rabotti, S. G. Oei, andM. Mischi, “Low-complexity R-peak detectionfor ambulatory fetal monitoring’, PhysiologicalMeasurement, vol. 33, no. 7, pp. 1135-1150, Jul.2012.
[4] B. Abibullaev and H. D. Seo, “A new QRS detec-tion method using wavelets and artificial neural
networks,” Journal of Medical Systems, vol. 35,no. 4, pp. 683-691, Aug. 2011.
[5] Z. Zidelmal, A. Amirou, D. Ould-Abdeslam, A.Moukadem, and A. Dieterlen, “QRS detectionusing S-Transform and Shannon energy,” Com-puter Methods and Programs in Biomedicine,vol. 116, no. 1, pp. 1-9, 2014.
[6] H. Zhu and J. Dong, “An R-peak detectionmethod based on peaks of Shannon energy enve-lope,” Biomedical Signal Processing and Control,vol. 8, no. 5, pp. 466-474, 2013.
[7] P. Phukpattaranont, “QRS detection algorithmbased on the quadratic filter,” Expert Systemswith Applications, vol. 42, no. 11, pp. 4867-4877,2015.g
[8] M. Bahoura, M. Hassani, and M. Hubin, “DSPimplementation of wavelet transform for realtime ECG wave forms detection and heart rateanalysis,” Computer Methods and Programs inBiomedicine, vol. 52, no. 1, pp. 35-44, 1997.
[9] S. Choi, M. Adnane, G.-J. Lee, H. Jang, Z. Jiang,and H.-K. Park, “Development of ECG beat seg-mentation method by combining lowpass filterand irregular R-R interval checkup strategy,” Ex-pert Systems with Applications, vol. 37, no. 7, pp.5208-5218, 2010.
[10] G. Nallathambi and J. C. Principe, “Integrate
R Peak Detection Algorithm based on Continuous Wavelet Transform and Shannon Energy 175
and fire pulse train automaton for QRS detec-tion,” IEEE Transactions on Biomedical Engi-neering, vol. 61, no. 2, pp. 317-326, 2014.
[11] K. Arbateni and A. Bennia, “Sigmoidal radialbasis function ANN for QRS complex detec-tion,” Neurocomputing, vol. 145, pp. 438-450,Dec. 2014.
[12] S. Choi and Z. Jiang, “Comparison of enve-lope extraction algorithms for cardiac sound sig-nal segmentation,” Expert Systems with Applica-tions, vol. 34, no. 2, pp. 1056-1069, 2008.
Nantarika Thiamchoo received theB. Eng. degree with First Class Hon-ors in Biomedical Engineering and M.Eng. degree in Electrical Engineeringfrom Prince of Songkla University in2014 and 2015, respectively. She is cur-rently working toward the Ph.D. degreein Electrical Engineering in Prince ofSongkla University. Her research inter-ests are biomedical signal processing, re-habilitation system and myoelectric con-
trol.
Pornchai Phukpattaranont receivedthe B. Eng. with First Class Honors andM. Eng. degrees in Electrical Engineer-ing from Prince of Songkla University in1993 and 1997, respectively, the Ph.D.degree in Electrical and Computer En-gineering from the University of Min-nesota, in 2004. He is currently an as-sociate professor of Electrical Engineer-ing at Prince of Songkla University. Hisresearch interests are signal and image
analysis for medical applications and ultrasound signal pro-cessing. Examples of his ongoing research include the patternrecognition system based on Electromyographic (EMG) signal,Electrocardiographic (ECG) signal, and microscopic images ofbreast cancer cells. Dr. Phukpattaranont is a member of theIEEE, ECTI Association, and ThaiBME.