Embed Size (px)
Citation preview

Centimeter1 2 3 4 5 6 7 8 9 10 11 12 13 14 15 mm
1 2 3 4 5
Inches IIIII1.0 _"_11_,,_11t2-----5
,._r
' 1111"-----8
lllll_Ilili_ulll',_

4
!
It

ugsOUCRL-ID-116122
/Preliminary Report on the Isotope Hydrology
I Investigations at the Nevada Test Site:• Hydrologic Resources Management Program
_ 1992-1993,/
M. L. Davisson
J. M. KenneallyD. K. Smith
G. B. Hudson
G. J.NimzJ. H. Rego
Nudear Chemistry DivisionLawrence Livermore National Laboratory
January 1994
This is an informal report intended primarily for internal or limited external ....'...............::::..........distflbution. The opinions and conclusions stated arethose of the author and mayor may not be those of the Laboratory.
,_ Work performed under the auspices of the U.S. Department of EnerKy by theLawrence Livermore National Laboratory under Contract W.7405-EnK-48.

DISCLAIMER
This docummt was prepared asan 8ccount of'work sponsored by an qency o(the United SLttesGovernment.Neither tbe UnitedStates Government nor the Universityd C811tornhtnor Shy ot their employees, makes anywsrranty, express or implied, or assumes amy kpl littdlity or reqmeslbilJt7 for the accurst, completeness,or usefulness tinny InformaUon,apparatus, product, or process disclosed Or represents that its usewould notinfrlnse privstely owned rlshts. Reference herein to any specific commercial products, process, or service bytnudenuume,trsdemarl_mtnufJ_urer orotherwisedoesnotnecessarily constitute or Imply its indorsement,
- _mmdatlo_ or favoring by the UnitedStates Government or the University orCsliromh_. The views andopinions or authors expressed herein do notnecess_Uy state or reflect those orthe United States Governmentor the University oF_tUfornJa, and sbsII not beuse6 for advertising or product endorsement purposes.
Tlds report has been reproduceddirectly from the best avsitsble copy.
Avsilsbie to DOE end DOE contractors from theOffice oCSdatiCk: and Todnnd_l lnfmtion
P.O. Box 62, Oak Ridse, T_ 37831Prices svsilsble from (615) 5'76-8401,FI'S 626-8401
Available to the public from theNstiomd T_nlml lntormstioa Service
US. D_artmmt o¢_nm'_$28S Port RoyJdRd.,
SprinL41eld,VA 22161
j5 .......... _.... _ ir_ .....

PRELIMINARY REPORT ON THE ISOTOPE HYDROLOGY
INVESTIGATIONS AT THE NEVADA TEST SITE: HYDROLOGIC
. RESOURCES MANAGEMENT PROGRAM
FY 1992-1993
by
M.L. Davisson
J. M. Kenneally
D.K. Smith
G.B. Hudson
G.J. Nimz
J.H. Rego
Nuclear Chemistry Division
Lawrence Livermore National Laboratory

ABSTRACT
A comprehensive isotope data base of the NTS groundwaters collected during FY
92-93 is presented with preliminary interpretations. Multiple samples were collected
from over 30 sites on pumped wells and open-holes by wireline bailing. Field water level
measurements indicate essentially a bimodal distribution separated by water levels at
higher elevations (e.g. Pahute Mesa) from water levels of lower elevations (e.g. Yucca
. and Frenchman Flats). Down hole temperature measurements have confirmed anomalous
temperature gradients in the eastern Yucca Flat area and on Pahute Mesa, where
horizontal temperature gradients up to 0.33°F/100ft are found.
Consistent with previous reports by others, the major ion geochemistry of the
NTS groundwater are dominated by Na-K-HCO3 and Ca-Mg-HCO3 water types, where
the Na-rich water appears to be related to dissolution in the volcanic tufts and the Ca-rich
water to the Paleozoic carbonates. Increases in dissolved Si also seems to be indicative of
groundwater that resides in the volcanic tufts. Processes controlling the Na/Ca ratios are
complex and may include ion exchange reactions with clays, evaporative concentration in
the vadose zone, and lithological heterogeneities in addition to simple differential
dissolution between the volcanic tuffs and the Paleozoic carbonates.
Apparent 14(2ages range between 4000 and 38,000 years for groundwaters at the
NTS. The uncertainty is large for exact age determinations at this time. The 14C
abundance decreases with increased dissolved HCO3, and 13C suggests dissolution of the
"dead" Paleozoic carbonates significantly influence the ages, but more work is needed to
" investigate the influence of vadose zone carbonate.
The 36C1/C1ratios measured in the NTS groundwaters do not indicate the
presence of very old groundwater. Most of the decrease in the 36C1concentrations may
be attributed to addition of a "dead" chloride from dissolution of the Paleozoic carbonates
and the volcanic tufts.

The 87Sr/86Sr measurements of the dissolved Sr in the NTS groundwaters indicate
that a less radiogenic signature is characteristic of higher Si concentrations related to the
volcanic tufts, where more radiogenic values are associated with higher bicarbonate
concentrations or the Paleozoic carbonates. Lithological heterogeneities and secondary
mineralization may be the major controls on the 87Sr/86Sr ratios of the NTS groundwaters
and further investigations, particularly of the solid phase, are needed.
Contaminant characterization of selected fission related radionuclides is in
progress for all wells in addition to drill back holes in explosion cavities. Low-level
tritium analyses indicate that all wells, with the exception of the drill back wells, fall well
below the drinking water standards. Many of the wells are tritium "dead" indicating old
groundwater (>100 years), where some wells may suggests some anthropogenic levels of
tritium of very low levels, but analytical questions exist and re-analysis is needed. Well
UE-5n shows abnormal tritium level of approximately 9900 pCi/L or half the drinking
water standard. The tritium source probably originates from infiltration of Cambric ditch
tritiated water, and is consistent with fluid rate calculations. Field measurements of
tritium levels in the drill back holes vary up to 5 orders of magnitude, with the highest .
occurring in well U-4u at approximately 107 pCi/L.
The 234U/238U values measured in the NTS groundwaters during FY 92-93 are
not included in this report and are undergoing data reduction. A review of previous work
on 234Uf238U at the NTS is presented.
Measured noble gas abundances in the water supply wells are anticipated in the
near future. The data should yield information regarding the recharge temperatures and
elevation of the groundwater. In addition, 4He concentrations can be calibrated against
the 14(2abundances to derive an independent groundwater age, and an example is
presented.

TABLE OF CONTENTS
Introduction ................................................................................................................... 1
Hydrogeological Background ....................................................................................... 2
- Methodology ................................................................................................................. 3
u
Results and Discussion
Field Data................................................................................................................ 6
Hydrochemistry ...................................................................................................... 9
Environmental Isotopes .......................................................................................... 12
iContaminant Characterization .......................... "_..................................................... 25
Summary ....................................................................................................................... 29
Acknowledgments ....................................................................................................... 32
References ..................................................................................................................... 33
Figure Captions ............................................................................................................. 41
Appendices .................................................................................................................... A
°..
111

INTRODUCTION
The Hydrologic Resources Management Program (HRMP) is administered by the
Department of Energy Nevada Operations Office and has as its focus the groundwater of
the Nevada Test Site (NTS) and surrounding regions of Nevada and eastern California.
Two of the central responsibilities of the program are groundwater protection and
groundwater monitoring at the NTS. In order to fulfill these responsibilities, generating
" adequate information to understand the NTS hydrologic system is required. Such
information makes it possible to develop measures needed to protect the groundwater,w
from contamination, due to the various activities on the NTS, and to develop strategies
for a its satisfactory monitoring. Therefore it becomes one of the responsibilities of the
HRMP to use its resources to aid in what is now a decades-long effort by many agencies
to better characterize the hydrologic system underlying the NTS. The Nuclear Chemistry!
Division of the Lawrence Livermore National Laboratory has facilities and capabilities
for isotopic and hydrochemical characterization of water that are unique within the
HRMP. Part of the LLNL-HRMP effort has therefore been directed in the area of isotope
hydrology at the NTS. This document reports the preliminary finding of this work, that
was conducted during the 1992 and 1993 fiscal years. The large amount of isotopic and
hydrochemical data produced is initially directed at data interpretation in this report, and
will ultimately be synthesized with existing the physical hydrologic data. Therefore, this
document is only preliminary to finalized reports that will be able to provide a broader
understanding of the significance of the data and its relationship to groundwater flow at
the NTS.
. The ultimate goal of this work is to construct a hydro-isotopic framework that will
characterize the groundwater at the NTS in terms of its recharge and discharge, flow
directions and rates, and the origin of its dissolved constituents. The analytical
techniques employ a suite of isotopic measurements of major and minor elements
dissolved in or combined with the groundwater mass. Included in this suite are stable

isotopes 180, deuterium, 13C, 3He, 4He, cosmogenic nuclides ]4C, and 36C1,radiogenic
nuclides 87Sr/86Sr, 234U/238U, and noble gas abundances. Many techniques using these
isotopes have been developed in other groundwater basins (see Fritz and Fontes, 1986 for
summary), but only in rare cases have such a diverse group of isotopes been applied
collectively to acquire detailed knowledge of groundwater (see Nordstrom et al., 1989
and accompanied articles; Frt)hlich et al, 1991; Pearson et al., 199?).
HYDROGEOLOGIC BACKGROUND
The southwestern Nevada groundwater province consists predominantly of
miogeoclinal Precambrian to Paleozoic sedimentary rocks of the western Cordilleran that
incorporate evidence of a repeated history of tectonic shortening, followed by late-
Cenozoic Basin-and-Range extension. The stratigraphic thickness of the Precambrian to
Paleozoic section is in excess of 12 kilometers. Potable goundwater in these rocks can be
found to depths in excess of 3000 meters from the earth's surface (Winograd and
Thordarson, 1975; Mifflin and Hess, 1979). The sedimentary rocks are composed of
approximately equal proportions of marine siliciclastics and carbonates. Overlying the
sedimentary section are >4000 meters of late-Cenozoic volcanic rocks erupted
concurrently with the Basin-and-Range tectonic extension. They consist predominantly
of rhyolitic lavas and ash-flow tufts, with minor basalt flows and sedimentary deposits
(Winograd and Thordarson, 1975). The closed basins formed by the extension, for
example Yucca Flat and Frenchman Flat on the NTS, that contain up to 600 meters of,,_
poorly-sorted alluvium.!
The most extensive hydrogeologic framework constructed for the NTS was by
Winograd and Thordarson (1975) where, based on detailed geologic investigations, pump
test data, and major ion chemistry, they inferred a regional model for groundwater flow
extending from the Pahranagat Valley (to the northeast) to Death Valley (to the
southwest). Discharge occurs in the Death Valley region, and in Oasis Valley and Ash

Meadows in the Amargosa desert. The regional flow is considered dominant in the
Paleozoic carbonate rocks. Winograd and Thordarson (1975) characterized the
groundwater of Yucca and Frenchman Flats as being semiperched, predominantly
saturating the tuff aquitard, and moving downward into the underlying Paleozoic
carbonates. In all, Winograd and Thordarson recognized 10 separate hydrogeologic units
(flow subsystems) at the NTS.
" Blankennagel and Weir (1973) characterized the hydrogeology of the Pahute
Mesa region where they noted that the groundwater flow appears to be independent of thew
complex volcanic stratigraphy, but locally controlled by faults and fractures within the
rock. They concluded that groundwater flow was from the Mesa southwestward into the
Amargosa Desert in aquifer material with transmissivities ranging from 1400 to 140(O
gallons per day per foot. The relationship between the Pahute Mesa volcanic aquifers and
the regional carbonate aquifers is poorly understood. Also unclear, is the nature of the
groundwater system in the Timber Mountain area on the western boundary of the NTS,
separating Pahute Mesa from Yucca Mountain.
SAMPLING METHODOLOGY
Wells sampled at the NTS during FY 92-93 are shown in Fig. 3. The majority of
the wells available for isotopic sampling are concentrated in Yucca and Frenchman Flats
on the eastern side of the NTS proximal to areas of nuclear testing. A good, but less
dense, well coverage exists in the northwestern portion of the NTS on Pahute and RainierIi.
Mesas. Little coverage exists in the west-central area of the NTS. Over half of the wells
. sampled were drilled at least 25 years ago (Table 1). The depth range among the wells
sampled is between 566 to 1675 meters below the surface. Most sampling del_ths
approximately correspond to the depths that the casing is completed, while a. few samples
were obtained tens to hundred of meters below the completed casing and others within
the casing interval. About 25% of the wells sampled have total drill depths that exceed

the groundwater sampling depths by more than 150 meters (Table 1). Most of the total
drill depths of the well were not field checked but determined by well history records
(Raytheon, 1990). Caving of the lower portion of the wells may occur, but was not
specifically investigated in this study.
Both pumped wells and open holes were sampled for isotopic analysis during the
FY 92-93 field seasons. Pumped wells are those that provide a steady supply of water at
the NTS and are indicated in Table 1. Sampling of the pumped wells entailed a small
diversion of the groundwater from the discharge pipe leading from the pump, usually
along a point previously developed for water quality sampling or as close to the well head
as possible to prevent any contamination along the flow path. Most open holes sampled
are covered at the top to prevent foreign material from entering the well bore. On two
occasions wells were encountered that were contaminated beyond usefulness: UE-1-L
had a substantial amount of diesel fuel on top of the water column, and at well UE-1 la
extensive organic contamination (dead animal?) was discovered to have altered the
groundwater beyond use.
Open holes were sampled using a wireline mechanism and a raised boom (Fig 2).
The wireline and raised boom are separate vehicles operated by LLNL at the NTS. Some
wells were temperature logged prior to sampling (Table 1). Temperature logs were
completed by lowering a calibrated thermocouple tool slowly through the water column
at -3 meters per minute. From the temperature logs, the desired sampling intervals were
determined usually based on any occurrences of sharp temperature changes. Where no
temperature changes were apparent, the sample was usually collected from the lower half
of the well bore, and each sample depth is indicated in Table 1.
For sampling, a remotely controlled valve attached to the wireline tool
electronically opened and closed a valve that permitted the evacuated stainless-steel
bailers to be filled. This same tool also recorded depth to water in each well. Individual
bailers have 2.2 liter volumes with screw-cap ends and O-ring seals equipped with a

needle valve that opened and closed manually. For each sampling of the open hole, two
2.2 liter bailers were attached in line by a brass connector similar to the screw-cap ends,
but allowed transmission of water between the two bailers. Each bailer was cleaned with
isopropyl alcohol before each drop, attached to the wireline tool, and evacuated to
approximately 10-2 torr. All needle valves were left open except for the bottom one
which was plugged. The wireline and bailers were dropped down the open hole and the
watertablelevelwas "tagged"beforethefinaldepthwasreached.The valveinthe
. wirelinetoolwas openedatthepredeterminedsamplingintervalbyanelectronicsignal
throughthewirclineandleftopenforapproximately2-I0minutes.The toolvalvewas
thenclosedandthebailerwasbroughttothesurface.Atthesurface,theremaining
needlevalve,swereclosed,thebailersweredetachedfromthetoolandseparatedintothe
2.2litersectionswheretheywerecarriedintothefieldtrailer.
DuringFY 93,anenclosedfieldtrailerwasusedtoprocesssamples.InFY 92,
sampleswerefilledinbottlesnexttotheboom truckandfieldmeasurementswere
usuallydoneina fieldvehicleorinthebackofapickuptruck.The likelihoodof
significantcontaminationduringthelessidealsamplingconditionofFY 92islowand
doesnotseem apparentfromthedatainTable2 withthepossibleexceptionofwellUE-
lawhichhasthehight,st14Cabundanceandisslightlyanomalous.Samplebottleswere
filleddirectlyfromthebailersaccordingtothemethodsoutlinedinAppendixI,
simultaneoustothefioAdmeasurements(Table2).Temperaturesweremeasuredassoon
aspossibleafterthebailerarrivedatthesurface,butmany measuredtemperaturesmaybe
greaterthantheactualdown-holetemperaturesduetore-equilibrationduringtransportto
- thesurfaceandhandlingofthebailers.Sulfateandchloridewcrcmeasuredbyion
chromatographyatLLNL. Alkalinitywas measuredbyfieldkits(Hach,andBauschand
Lomb),andcomparisonofdifferentbrandnamesshowssome systematicdiscrepancy
betweenresults,andlargeuncertainties(+50 mg/L)arosetotheirabsolutevalues,
particularlyduringFY 92. Subsequentlaboratoryextractionofdissolvcdcarbonfor14C

analysis liberates the total dissolved inorganic carbon and the field results were compared
against the extraction yields. Where large discrepancies occurred or when field alkalinity
was not measured, the extraction yield is reported and noted in Table 2 instead. The
dissolved oxygen (DO) was also measured using field kits. Some error may exist in the
DO since the rate that oxygen dissolves in an undersamrated sample is rapid relative to
the field analytical time, and the water samples in some cases experience a significant
exposure (__.I min) to the atmosphere. The pH, total dissolved solids, and specific
conductivity were, measured using an electronic field measuring instrument calibrated atw
each new well site. Calibration for pH was against pH 7 and pH 10 buffers and for
conductivity against air (zero value) and a 1413 I_Sstandard.
Procedures for f'flling bottles are listed in Appendix 1 where a step-by-step
method was developed specifically for isotopic samples. Analytical procedures for the
isotopic analyses in groundwater performed at the Nuclear Chemistry Division of LLNL
arc listed in Appendix 2
RESULTS AND DISCUSSION
Eit,ld_da
Water levels in the wells are essentially bimodal with approximately 50% ranging
between 700 and 900 meters above sea level, and with the exception of one well, the
remainder range between 1100 and 1450 meters above sea level (Fig. 4). An upper
horizontal field is defined in Fig. 4 and appears to be related to wells that are drilled on
Pahute Mesa. On the Mesa, water tables have higher elevations. The lower horizontal
field in Fig. 4 corresponds to wells in the Yucca and Frenchman Flats, where water tables
have lower elevations. A non-trivial relationship between the water elevation and the
total penetration depth of the wells exists (Fig 4). Under ideal hydrostatic conditions in a
groundwater basin, a direct relationship should exist between the water height and the
total penetration depth such that,

P = pgh
where P is the overlying pressure exerted on a mass of fluid, h is the height of the fluid
column above a datum, p is the density of the fluid, and g is the acceleration of gravity.
In Fig. 4, the two horizontal fields are indicative of water masses under more hydrostatic
conditions, where groundwater from different penetration depths experience different but
. proportional overlying pressures that essentially maintain a consi=tent water table among
wells. Wells that appear to depart from this relationship are circled in Fig. 4. This field
of data preferentially occurs in wells at surface elevations from 1220 to 2070 meters.
These wells suggest that the overlying pressure is abnormal causing either sub-normal or
artesian conditions relative to the horizontal fields of data. This may be linked to the
relationship seen in Fig. 5, where in many cases the change in the surface elevation
arnong wells is greater than the corresponding change in the water table elevations.
Figure 5 suggests that the rate of change in the topographic elevation exceeds the rate of
change in the water table elevation. As a result, many groundwaters may have sub-
hydrostatic pressure gradients relative to depth. This result was derived through
observations by Winograd and Thordarson (1975) and Blankennagel and Weir (1973)
where perched aquifers and downward fracture flow were shown to exist in some areas of
the NTS.
Figure 6 is a map of the wells sampled at the NTS during FY 92-93 plotted with
the temperatures of the waters in °F. Some of the geographic variation in the water
- temperatures is due to the different depths of sampling. The temperature variation in the
eastern part of Yucca Flat though, is controlled by locally elevated subsurface
temperatures whose anomalies have been noted by previous workers (Thompson, 1991).
In an attempt to understand some of the anomalous temperatures, a northwest-southeast
cross-section was constructed that shows well depths and contoured temperatures (Fig.
7
[

7). The cross-section indicates an anomalously high temperature gradient between wells
TW-B and ER-6-1, where a >20°F temperature change occurs across approximately 1830
horizontal meters (0.33°1=/100 feet). This same high temperature anomaly has been
acknowledged b_ several other agencies working at the NTS (LANL, USGS and RSN),
but detailed studies are lacking. Thompson (1991) documented a substantial increase in
subsurface temperatures in southeast Yucca Flat noting vertical temperature gradients
from 0.7 to 3.6°F per 100', and postulated a possible structural control on the heat
distribution. Similar temperature anomalies have been reported by Blankennagel and
Weir (1973) in the eastern Pahute Mesa area where they attributed the elevated
temperatures to latent heat from a Tertiary igneous intrusion approximately 2400 meters)
below the surface. Proper representation of the temperature anomalies in Fig. 6 would
require information on the down-hole temperature gradients, and at this time adequate
information is lacking and calculation would be crude at best.
The specific conductivities of the groundwaters sampled at the NTS range
between 170 and 1300 gS representing typical fresh water concentrations in similar
aquifers. The increase in the specific conductivity of--8 times is mostly controlled by the
increased bicarbonate concentrations.
Most of the pH values of the groundwaters range between 6.5 and 9.3. The
waters with pHs above 8 typically have higher sodium concentrations and lower
bicarbonate concentrations. Even higher pHs occur in the post-shot holes drilled into test
cavities and also sample U12s, which is an unused emplacement hole for nuclear testing..-
Dissolved oxygen contents in the sampled NTS groundwaters range from
approximately 2 to 6 mg/L (Table 2). These values are typical of those noted by other
workers (Winograd and Robertson, 1982) in southern Nevada, where the non-zero DO
values are attributed to the oxidized volcanic deposits of the NTS and arid vadose zones
that lack significant microbial activity available to deplete the DO in recharging
groundwaters.

Hvdrochemistrv
Listed in Table 2 are the major and some minor dissolved constituents in the NTS
groundwaters measured during FY 92-93. Dissolved HCO3 is the dominant anion in all
the groundwaters, ranging from approximately 100 mg/L to 500 mg/L with the exception
of water supply well UE-19-e that has a concentration of 37 mg/L. Most of the highest
HCO3 wells are completed in the Paleozoic carbonates. The SO4 concentrations in the
samples range between 2 mg/L and 100 rag/L, although the data set in Table 2 is not
• complete and some higher concentrations in other wells have been reported by previous
workers (Winograd and Thordarson, 1975; Chapman and Lyles, 1993). Chloride
concentrations usually are low, between 3 and 45 mg/L and do not represent a major
control on the total dissolved concentrations of these groundwaters.
Sodium is typically the cation with the highest dissolved concentration in the
groundwaters at the NTS and ranges between 30 mg/L and 130 mg/L. The higher Na
concentration occurrences are thought to be a result of groundwater flowing through
alluvial and tuff dominated aquifers (Winograd and Thordarson, 1975). The Ca
concentration of these groundwaters is slightly less than Na and ranges from I mg/L to
110 mg/L. The Ca is proportional to the less abundant Mg concentration, whereas the Na
is proportional to the less abundant K concentration. The proportional abundance
between Na and Ca is almost exactly equivalent to the proportional abundance between
Na+K and Ca+Mg (Fig. 8). This relationship suggests that the Na and K have the same
source (volcanic rocks) and likewise the Ca and Mg have simialr rgins (Paleozoic
carbonates).
- Figure 9 is a Piper plot of the major chemical constituents from Table 2. As seen
from the figure, the data plot near the HCO3 apex of the anion triangle with minor
deviations toward SO4 and CI. The points plotting along the CI-HCO3 axis'are for
samples for which SO4 data are unavailable. The cation triangle shows a near-linear
mixing trend between a Na dominated end-member and an end-member with near equal

proportions of Ca and Mg. The distribution of data in Fig 9 is characteristically similar to
Piper plots of chemical data found in Winograd and Thordarson (1975) and Chapman and
Lyles (1993), and validates, on the first order, the quality of the major chemical data in
Table 2. In detail, the ion balance calculation of the major chemistry shows up to 20%
deviations from unity in charge balance between cations and anions, that is probably
attributable to analytical error,but represent only minor deviations from the true
geochemical character of the groundwaters.
A summary of previous work and a discussion on the origin of the dissolvedI
constituents in the groundwater in and around the NTS is presented in Winograd and
Thordarson (1975) where, based on an earlier report by Schoff and Moore (1964), they
characterize the groundwater into three catagories: 1) a Na+K-HCO3 groundwater usually
found residing in rocks dominated by volcanic tuff, 2) Ca+Mg-HCO3 groundwater
typically found in the carbonate lithologies, and 3) a groundwater that is a mixture of
types 1 and 2. The latter is typically found in many areas of the NTS and has been
hypothesized to represent a mixture between the downward flow of groundwater
primarily from the volcanic tufts and the regionally flowing groundwater residing in the
Paleozoie carbonates (Winograd and Thordarson, 1975). Flow directions were inferred
from the geochemical patterns. Low sodium groundwater is thought to originate in the
Pahranagat Valley area and acquire a higher sodium concentration due to both dissolution
of minerals along its southeasterly flow path and mixing with groundwater migrating
downward from volcanic aquifers (Winograd and Thordarson, 1975).._.
The Na/Ca weight ratios are listed in Table 2 and range between 0.5 and 43.
Weight ratios of Na to Ca measured in rocks of the Paintbrush volcanic tuff (Knauss,
1984) is approximately 4.0 and is probably representative of the elemental ratios in many
volcanic tufts at the NTS, although further research is necessary. The Na/Ca ratios in the
groundwaters deviate considerably from the ratios of the host volcanic material. Possible
controls on the Na/Ca ratios of the groundwater that exceed 4.0 include: 1) ion exchange
10

between Ca and Na in clays, 2) differential build up of Na over Ca due to vadose zone
evaporation and concentration of salts, 3) and lithological and mineralogical
heterogeneities along groundwater flow paths. Processes that might cause the Na/Ca
ratio to be lower than 4.0 are 1) dissolution of Paleozoic carbonate material in the bedded
aquifers or alluvium dominated by carbonate clasts, and 2) possible lithological and
mineralogical heterogeneities with greater susceptibilities for Ca dissolution. Future
work that considers all these options will require a more complete understanding of the
. elemental and mineralogical distribution in NTS lithologies and chemical equilibrium
modeling to constrain possible reactions that control the elemental abundances in the
groundwater.
Recently, Chapman and Lyles (1993), in a geographically more detailed analysis
of the major chemistry in well waters of the NTS, showed that significant heterogeneity
exists in the major chemistry among wells considered part of the same flow regimes,
particularly in the Yucca Flat and Pahute Mesa areas. Their work demonstrated the scale
dependency on the interpretation of mixing and flow in the NTS area using geochemical
data. The larger scale geochemical study from which Winograd and Thordarson (1975)
derived their flow interpretations probably dampen many of the smaller scale chemical
heterogeneities in the groundwater observed by Chapman and Lyles (1993). At the
smaller scale, the influence of local geochemical reactions will have a greater bearing on
the interpretations of the flow paths.
According to Drever (1988), the aqueous geochemistry of an advecting
groundwater mass follows the differential relationship such that,
%
c)ci D 02 Ci Oci= -u x +J (1)ax2
where ci is the concentration of theith species, D is a diffusion or dispersion coefficient of
the particular geologic medium, ux is flow rate in the x direction, and J is the addition or
11

loss of dissolved constituents from chemical reactions in the system. The first and third
term on the right side of this equation both contribute to the geochemical character of a
groundwater. The magnitude of a geochemical effeCt from the first and third term
depends on their comparative rates relative to the fluid flux. The possible influence on
the fluid geochemistry from a dominant diffusion and dispersion parameter depends on
the porosity and permeability conditions in the aquifer and concentration gradients, where
in many cases it has been demonstrated to exert a significant control (see Domenico and
Schwartz, 1990 for examples, and also Hendry and Schwartz, 1988). The term J dictates/
the change in the geochemistry due to processes such as adsorption equilibria, chemical
equilibration with solids, kinetic reactions of dissolution and precipitation, ion exchange,
and in the case of isotopic systems, radioactive decay (Drever, 1988). Areas of lower
flow rates earl be expected to be influenced greater by the J term, than areas where the
advection rates are much higher. Interpretations of flow directions based solely on
increases of soluble chemical species in the groundwater may be inaccurate, particularly
where the groundwater flow rates are much slower than the kinetic rates of chemical
reactions between the groundwater and the host rock. Furthermore, pervasive lithological
heterogeneties within the NTS complicate interpretations of the observed elemental
variation in the groundwater. Flow path histories may be complicated by a groundwater's
interaction with one or more host lithological types. This is also an important concept for
the interpretation of the environmental isotopic data discussed below.
Environmental Isotopes
Carbon Isotopes - Carbon-14 is a commonly used age discriminator of groundwater
(T1/2=5730 years; see Mazor, 1991 for review) and provides in many cases the most
reliable chronometer for groundwater flow. The 14(2is produced by cosmic ray
interaction with nitrogen (14N + n = 14(2+ p) in the upper atmosphere. The 14C derived
from atmospheric fallout is incorporated into the dissolved inorganic and organic phases
12

of the shallow subsurface and decays from an initial concentration that is assumed to be
characteristic of a groundwater's recharge area. The 14(2abundance relative to the total
carbon at any given time is a function of its decay rate such that,
14Cfm c "- e-A't (2)
" where 14Cfmcis the ratio of the measured 14(2atomic abundance to an initial abundance,
reported as a fraction of modem carbon (fmc), _, is the decay constant, and t is time. The
t4Cfmc is analogous to the more familiar ratio of A/Ao, where A is the measured 14(2
beta activity in a sample and Ao is the assumed initial 14Cactivity of a groundwater mass
at the time it was first isolated from the atmosphere. The 14Cfmc represents a calculated
ratio of the 14(2atomic abundance of a sample to the 14C atomic abundance of a standard
(in this case NBS Oxalic Acid-1) following the derivations of Stuiver and Polacb (1977).
The 14Cfmcvalues in Table 2 do not incorporate any corrections that account for the
actual initial 1412abundances in the recharge groundwater mass, but rather all values
assume that the initial 14C abundance of the groundwater reflects pre-nuclear testing
atmospheric CO2. Differences between the true initial 14Cabundances and the assumed
value, and the influence on the measured 1412abundances from subsurface exchange are
discussed _low. In addition, the 14Cfmcvalues have been converted to percentages
(14Cpmc) in Table 2.
The 14Cabundances show a range between 1% and 60% modem carbon (Table
2). All the NTS wells appear to have some measurable activity. Over half the wells so
- faranalyzedinTable2 have1412concentrationsbetween1% and10% modem carbon;
UE-1-aalonehasanunusuallyhighabundanceof60%. Otherworkers(Groveetal.,
1968;WinogradandPearson,1976)havefoundcomparable14CabundancesintheNTS
wells,andtheseandadditionalmeasurementsaresummarizedinSpencer0990).
13

Apparent ages calculated from the 14Cfm c are listed in Table 2 and can be considered
maximum groundwater ages.
The dissolved 14(2abundance of groundwater to the total dissolved carbon varies
due to water-rock exchange with 14(2depleted carbon-bearing lithologies. This is
particularly important for the NTS where the Paleozoic carbonates present a large source
of "dead" dissolved inorganic carbon in the vadose and saturated zones. Carbon-13
analyses of the groundwater have been used in an attempt to delineate the different
carbon sources at the NTS (Grove et al., 1969; Spencer, 1990). Dissolved inorganic
carbon from the root zone of a recharge area usually has a lower 13C abundance (-25.0 to
-12.0 %o, normalized to PDB standard) relative to the Paleozoic carbonates (-2.0 to,+2.0
%0). A mass balance calculation between the two carbon sources has been proposed for
the NTS (Grove et al., 1969; Spencer, 1990) which provides a correction factor that is a
13C-dependent ratio such that:
14Ccorrect__ t,, _,.,soil--O _'carbonate 1,,gl3t" .glJt" 4Cmeasured (3)_, i.,measured _t_, _'.'carbonate
where 813C = (RsdRst- 1)1000, and R is the 13C/12C ratio of the sample and a standard
respectively. For this equation to be valid for all the groundwaters, 1) a uniform 813Caoit
value is required, 2) the 813C increase must be attributable to progressive dissolution of
the Paleozoic carbonates, 3) and diffusion and dispersion effects must be negligible.
Spencer (1990) suggested that most 13C values for soil carbon at the NTS was -12.0%0,
but the latter two requirements have not been addressed to date..t,
Figure 10 is a _il3c-14Cprr,e compilation of many springs and groundwaters at the
NTS. For equation (3) to be true in all cases, all the _i13C-14Cvalues of groundwaters in
Fig. 10 must have a single origination point where the 14Cpme ~ 100 (assuming 100%
initial concentration), and the 813C ~ -12%o. From this origination point, the _il3c and
14

I
14(2values change within a triangular region confined by a line extending from the
originating point to 813C = 0%0 and 14(2= 0. This line defines the change in 14(2
abundance of a groundwater from dissolution of Paleozoic carbonate with no associated
radioactive decay of the 14(2,and defines an upper graphical limit on the position of the
data points. The data set for the NTs groundwaters in Fig. 10 appears to be confined
below this limiting condition. Older groundwaters (<50 pmc) with low 813C values
suggest that little interaction with the Paleozoic carbonates has occurred, particularly in
the Pahute Mesa area. On the other hand, groundwaters with higher 813C values suggest
a significant interaction with the Paleozoie carbonates.
Figure 11 characterizes the possible pathways that the 13C and 14(2abundances in
the NTS groundwaters might follow over time. Some of these pathways might cause
large uncertainties in the calculated ages. Most groundwaters will originate with a low
_13C value and a relatively high 14(2abundance, possibly near the upper left hand comer
of Fig. 11. Lower initial 14(2abundances are highly likely (to 50%?) in some cases and
their origins would fall below the upper left hand comer. Subsequent 14(2decay andi
dissolution of the Paleozoie carbonates will cause a migration along some near
exponential decay pathway that trends toward a 0%0 813C value and a 0% 14(2
concentration. Dispersion and diffusion of the carbon isotopes within the aquifer will
accelerate this trend along a similar pathway, but probably only represent a minor effect.
A vertically downward pathway may occur if dissolution of the Paleozoic carbonates is
negligible and only 14(2decay occurs. Some groundwaters may originate with higher
initial 13Cconcentrations in the vadose zone and the subsequent decay pathways may be
' shifted to the right. Overall, the carbon isotope evolution of all the groundwater
influenced by the Paleozoic carbonate will def'me a broad curvilinear zone that progresses
to zero values for both isotopic systems. Isotopic equilibration between the groundwater
and the host rock will be more progressive for older waters, and the broad band defined in
Fig. 11 should narrow as it approaches the zero isotopic values. This latter effect is
15

clearlyseen in the NTS dataof Fig. 10. Precipitationand dissolutionof the dissolved
bicarbonateand decay of 14Careprobablythe main controlson the carbon isotope values
of the NTS groundwaters.
Specific examples of uncertaintiesthat arise in the carbonisotopes can be seen in
some of the datapoints in the lower righthandcomer of Fig. 10. ,'_orinstance,well UE-
18-rhas a 14Cabundanceof 8%and a high 513Cvalue of- 1.4%o,even th,,,Igh the well is
completed in the volcanic tufts. Such high 13C concentrations would be expected for
groundwaterin the Paleozoic carbonateaquifer,and is uncharacteristicof residence in
volcanic materialwhere carbonsources arelimited. Thereis noevidence thus far that
suggests the groundwaterin UE-18-r may originatefrom the Paleozoic carbonates. More
likely, the initial 813C value of the groundwaterthat rechargedUE-18-r was high, and its
subsequent14Cdecay pathway has been vertically downwardfrom the upperright hand
cornerof Fig. 10 to its present p'0si!ion.
Two groundwatersplotted in_l_ig.10 (UE-lq and ER-6-1) arefrom wells
completedin the carbonates drilled by the GroundwaterCharacterizationProject. They
l_ave14Cabundances of 7.7 and 2.1%respectively, and 813Cvalues of-2.3 and -0.7%0.
']lie 13C content of the groundwaterfromthese wells is veryclose tO typical values in the
Paleozoic carbonates. Both of these wells arecaseddown to the Paleozoic carbonates
below Yucca Flat and the carbon isotope datasuggest that the waterhas seen a significant
residencetime within these rocks. Applyingequation 3 to these groundwaterswould
result in correctedages between 7600 and 8600 years as comparedto 20,650 and 32,100
years for apparentages. Extensive isotopic exchange of 13C between the groundwater
and the carbonates is plausible,which would cause anincreasein the 813C values of the
groundwaterand a net decrease in the 14Catomic abundance,butnot necessarily an
increasein the dissolved bicarbonate. Use of equation 3 depends on the coupling
between the change in 813C of the groundwaterwith the increased dissolved bicarbonate
due to dissolution. Therefore, the corrected14Cages of this groundwaterwould represent
16

a minimum residence time. The actual ages of this groundwater lie between the corrected
ages and the apparent ages derived from the raw data (Table 2), leaving at this time a high
uncertainty. More detailed laboratory and field analysis will narrow the possible age
range of many of these groundwaters.
Chlorine-36 - Several studies have attempted to exploit the natural radioactive decay rates
of 36(21(TI/2 = 301,000 yrs) for age dating of old groundwater (see Bentley, 1986).
Chlorine-36 is produced in the upper atmosphere by spallation of argon-40 by high
energy protons and neutron capture by argon-36 (Davis and Murphy, 1986). Steady-state
fallout of the 36(21atoms from atmospheric circulation and dissolution into precipitation
provides a constant supply to the total atmospheric chloride. Above-ground nuclear
testing released a large anthropogenic pulse of 36(21to the atmosphere beginning in the
late 1950's, and has returned to near.natural levels at present time. Aerosols provide
chloride from the sea that have undetectable 36(21concentrations, and dilutes the 36C1/C1
ratio in precipitation. The dilution causes a gradient in the 36C1/C1ratio in average
precipitation with increasing 36C1/C1contributions occurring toward the continental
interior (Bentley, 1986). In principle, the initial 36121atom abundance in young
groundwater is indicative of the average 36C1atom abundance of local precipitation in the
groundwater's recharge area. Most groundwaters in the unsaturated and saturated zones
have chloride concentrations much higher than those measured in precipitation (Bentley
et al., 1986), where evaporative concentration effects in the unsaturated zone increase the
total dissolved chloride by at least an order of magnitude. Bentley et al. (1986) observed
the evaporative effects on the 36(21atom concentration in the recharge groundwaters of
the Great Artesian Basin, where, because the 36(21atom concentration is measured
relative to a fixed volume, the evaporative concentration decreases the volume of water in
the unsaturated zone and proportionally increases the 36(21atom concentration in the
17

water. Many workers report 36C1values as a ratio to total chloride since the ratio does
not change during evaporation.
Norris et al. (1987) and Phillips et al. (1988), tracing bomb pulse 36C1and tritium
in the vadose zone, have both shown that chloride mobility (and hence 36C1mobility) in
the upper vadose zone (~2m) is much slower than water, due to phase relations that
transport water as a liquid and a vapor, where chloride movement is limited only to the
aqueous phase. The chloride distribution and mobility in the vadose zone is spatially
heterogeneous (Norris et al., 1987) possibly due to differing infiltration rates.
Bentley et al. (1986) first applied 36C1dating methods to the Great Artesian Basin
in Australia, where they showed systematic age increases (from <100,0C0 to 1,200,000
yrs) with increasing depth along a Jurassic sandstone aquifer. These ages agreed with
hydrodynamically calculated ages. Bentley et al. (1986) further proposed that the natural
decay of 36(21is partially countered by simultaneous production of 36C1in the sLbsurface
due to neutron flux from other radioactive elements (e.g. uranium). Phillips et al. (1986)
attempted to apply the same principles to the Milk River aquifer in Alberta, Canada,
where a non-systematic trend in the 36(21atom abundance was interpreted to be
influenced by ion filtration of chloride in the subsurface. Based on this assumption,
Phillips et al. (1986) calculated ages from 500,000 to 2,000,000 yrs for the groundwater.
Subsequent works friendly and Schwartz, 1988; Nolte et al., 1991; Fabryka-Martin et al.,
1991) have demonstrated that groundwater dispersion and chloride diffusion are probably
controlling the 36C1atom abundances in the Milk River aquifer rather than ion filtration,r
and maximum ages may only be 1,000,000 yrs, although these ages are still a factor of
two greater than the calculated hydrodynamic ages. Recently, Andrews and Fontes
(1993) questioned the validity of dating of very old groundwater with 36C1,calling
attention to the predominance of "dead" chloride in the deeper groundwaters and
simultaneous increase in the chloride concentration. Radioactive decay of 36C1is slow
compared to chronometers such as 14C, and its use as a groundwater age indicator
18

requires water of a considerable age. All groundwater at the Nevada Test Site has some
level of 14(2activity, and any depletion of an initial 36C1abundance due to decay would
be less than 2% and age discrimination using 36C1is improbable (Davisson et al., 1993).
This report will focus, on the other hand, on the s,,mrces of chloride and 36121variations in
saturated zone groundwaters at the NTS, and interpret the 36(21data and discuss their
evaporative concentration effects in the vadose zone.
The 36C1/C1ratios in Table 2 show that a large variation exists in the
. groundwaters sampled at the NTS. Most groundwaters have ratios between 100 and 1000
x 10-15 with many occurring in the middle of this range. The 36(21atom concentrations
per volume range from 3.6 to 38.6 x 10⁷ atoms/L and mimic the order of magnitude
variation of the 36C1/C1ratios, although most atom abundances range between 5 and 17 x
107 atoms/L. One sample has an unusually high abundance (UE-5n) attributed to
contamination. UE-5n (3H = --3100 TU) is a near-by satellite well to the Cambric Ditch,
which contained radionuclide enriched fluids pumped during an induced radionuclide
migration experiment from the Cambric cavity (Bryant, 1992). Subsurface migration
from the ditch to UE-5n probably has occurred over the subsequent time (Buddemeier et
al., 1991).
Aside from well UE-5-n, the range in 36C1/C1ratios of the sampled groundwater
is similar to ratios measured in soil (500 x 10-15) about a meter below the surface:(below
the bomb pulse) as determined by other workers in unsaturated zone studies at the NTS
(Norris et al., 1987). With the exception of wells WW-C, WW-C1, and UE-lh little
change in the 36C1/C1ratios has occurred between the unsaturated zone and the saturated
- zone, although a significant variation exists in terms of the calculated 36C1age (< 285,000
years). The three wells listed above as exceptions appear to be around a factor of two to
six lower than most other wells in their 36C1/C1ratios, but due to their abnormally high CI
concentrations, fall within the same range of the other wells in their 36C1atom
abundances.
19

Figure 12 is a plot of the 36C1/C1ratiosof groundwatersfrom the NTS and the
Dakota Aquiferin Kansasplottedagainst the log of theirCIconcentrations. The concept
of this graphicalrelationship firstpurposedby Andrewsand Fontes (1993) demonstrates
theevaporative enrichmentof CI in the vadose zone and the subsequentmixturewith
"dead"CI in the saturatedzone. Evaporativeenrichmentis best seen on the upper
portions of the diagramwhere the 345C1/C1ratios areabove 1000 and the CI
concentrationsvary between2 and 50 mg/L. Here the netevaporationof vadose zone
watercauses differentialincreases in the totalCI concentrationper unitvolume, but has
no effect on the 36C1/C1ratio. The net effect in the upperportionof the dataon this plot
is to cause a wide variationin CI concentrationsbut a negligible variationin the 34_C1/C1
ratios. This same effect can be seen in the NTS groundwaterdata as well.
Both the Dakota aquiferand NTS groundwatersdecreasetheir 36C1/Clratiosand
increase their CIconcentrationsdue to the influence of "dead"subsurfaceCI on the
absolute ratios in the groundwater. For instance,the groundwatersfrom the Dakota
aquifers significantly increasetheir chlorideconcentrationwith depth and confinement,
where the source of the CI can be tracedto dissolutionof evaporites at depth and upward
advection and diffusion of the NaCI. The dissolved evaporiteshave essentially no
measurable36(31and their dissolution into the overlyinggroundwatercauses a decreasein
the net 36(31abundancein the groundwater. This effect is best seen in the curvifinear
trendof the Dakota aquiferdata towardshigher CIconcentrationsand lower 36C1/C1
ratios(Fig. 12). To a lesserextent, the NTS dataalso shows a tendency towardhigherCIj,
concentrations with a correspondingdecreasein its 36C!/C1ratios. The subsurfacesource
of CI at the NTS is notreadilyapparentat this timeand may be attributableto residual
marineCI in the Paleozoic rocks, as well as contributionof CI from the host lithology
duringdissolution as the groundwaterincreases in age. Furtherinvestigationis still
required,but it is useful to note that the lowest 36C1/C1ratios in Table 2 arederived from
2O

wells that are predominantly completed in the Paleozoic carbonates and where marine
sources of "dead" CI appears most plausible.
Strontium Isotopes - Strontium dissolved in groundwater acquires the 87Sr/86Sr isotopic
signature of its host aquifer. The 87Sr/86Srratio does not mass fractionate under the
physical conditions experienced by groundwater, and therefore can potentially trace
- water-rock reactions and mixing of isotopically distinct waters. An increasing 87Sr/86Sr
ratio may be indicative of sources with higher RblSr ratios (87Rb decays to 87Sr; half
life= 4.8x10¹⁰ years).
Sr isotopes have been employed at the NTS to specific hydrologic investigations
relating to the vertical movement of the water table at Yucca Mountain (Marshall et al.,
1993, Peterman et al., 1992a, Stuckless et al., 1991), but only Peterman et al. (1992b)
have proposed a comprehensive regional model of hydrologic flow using these isotopes.
They determined that recharged groundwater in the Spring Mountains has a 87Sr/86Sr
ratio ranging between 0.70845 and 0.70976 that is similar to a0.70845 mean Sr isotopic
ratio for the carbonate rocks through which this recharge occurs. Inflow from the
Pahranagat Valley ranges from 0.71079 to 0.71392, representative of ground-water
signatures of the regional carbonate aquifer comprising southern Nevada. The 87Sr/86Sr
values of discharge along the line of springs in Ash Meadows in the Amargosa V/dley
southwest of NTS range from 0.71234 to 0.71905, where the more radiogenic waters
represent an anomalously high 87Sr/86Sr input to the southern end of the spring line.
Well waters sampled from the east central part of the NTS from the regional carbonate
, aquifer have 87Sr/atSr values between 0.71272 (well UE-7NS) and 0.71489 (well C-l).
Peterman et al. (1992b) conclude that the radiogenic signatures observed in the west-
central part of the flow system and from the Pahranagat Valley balance the less
radiogenic signatures of recharge in the Spring Mountains and produce, through mixing,
intermediate values for the spring discharge in Ash Meadows. The source for the
21

extremely radiogenic water flowing from the northern extremities of the Ash Meadows
system is not identified, but they suggested thatsuch signatures would be derived from
radiogenic siliciclastic sources.
To further characterize the Sr isotopic signature of groundwater as a function of
the host aquifer's lithology, Peu_rmanet al. (1992b) used Ca/Na ratios of southwestern
Nevada groundwater to distinguish the volcanic from carbonate aquifers. The Ca
enrichment in the water is derived from dissolution of carbonate aquifers, while they
believed that Na is enriched by dissolution of the Tertiary sili¢ic volcanic aquifers. They
found that the Ca/Na ratio inversely correlates with the 87Sr/86Srratios of the
groundwater. Similarly, though, a plot of Ca verses Si for the HRMP data (Fig. 13)
indicates two distinct trends. Ca is enriched relative to Si for waters derived from wells
exclusively producing from the carbonate aquifer. In contrast, Si is enriched relative to
Ca in waters derived both from wells producing solely from the volcanic aquifer and from
wells producing from the volcanic and the underlying carbonate aquifers. The
corresponding 87Sr/86Sr ratios adjacent to the data points in Fig. 13 demonstrate that a
radiogenic source of Sr is derived from carbonate beating lithologies and not only
radiogenic siliciclastic sources as suggested by Peterman et al. (1992b). Fig. 14 further
suggests that the enriched 87Sr/86Sr ratios correspond to elevated HCO3 concentrations.
Aside from Sr isotopic zonation that occurs in the volcanic tufts (Stueldess et al., 1991), a
strong possibility exists that more radiogenic sources of Sr occur in the Paleozoic
carbonates and that 87Sr/86Sr heterogeneities must be accounted for before simple.r
conclusions on groundwater flow are drawn from the Sr isotope data. In particular, an
investigation of the role of secondary mineralization is needed to determine its effect on
the Sr isotope signature of the groundwater.
Uranium Isotopes - To date, no final 234U/238U ratios are available from FY 92-93
sampling; although most samples have been analyzed, the results are undergoing data
22

reduction and review. A brief review of 234U/23SU is presented below. The final FY 92-
93 report will incorporate the yet unreported analyses and build an interpretive
framework from the discussion below.
The secular equilibrium of natural radioactive decay established between 234U
and 238U have been used to estimate groundwater ages (for review, see Davis and
Murphy, 1986). The activity ratio of 234U/238U should equal 1.0 when the two isotopes
have equal solubility in the groundwater and when 234U and 238U are in secular
. equilibrium in the host rock. Typically, the activity ratios are greater than 1.0 in many
groundwaters. This is due to 1) the greater solubility of 234U from crystal lattice sites
damaged from alpha-recoil during decay of 238U, and 2) the alpha-recoil ejection of
234Th (daughter of 238U that decays to 234U) from the crystal lattice. The 234Th has a
very low solubility and most likely decays to 234U (T1/2 = 24 days) from a solid phase
that precipitated after ejection. The 234U subsequently is more soluble than 234Thand its
activity increases in the groundwater over the 238U.l
Osmond and Cowart (1982) have presented the most comprehensive data base of
234U/238U for groundwater and springs in southwestern Nevada (Fig. 15). Because most
groundwaters in southwesternNevada are oxidizing, Osmond and Cowart (1982)
suggested that the uranium can be considered a conservative aqueous species. They
suggested that the 234U excess of the groundwaters inthe carbonate aquifer is cohtrolled
by mixing between the recharge areas of the Spring Mountains and the Pahranagat
Valley. From their data, they further suggested that the Indian Springs area and theq.
Yucca Flat carbonate aquifer have little contribution to the Ash Meadows discharge (Fig.
- 15).
Cd2P wells ER-6-1 and UE-lq are also plotted in Figure 15. As can be seen, the
GCP wells do not plot within the mixing triangle suggested by Osmond and Cowart
(1982), but rather have a much higher 234U excess. This suggests that the uranium
concentrations and the 234U/238U activity ratio may have a more local control in Yucca
23

Flat and do not suitably compare to the regional interpretation Osmond and Cowart
(1982). Possible controls on the aqueous uranium may be due to a heterogeneous
distribution of uranium in the rock. It may also be possible that a significant variability ini
oxidizing condition,s in the subsurface exists and limits uranium mobility.
Noble Gas - The non-radiogenic noble gas concentrations in groundwater offer a variety
of important information on the source and age of a groundwater mass. In particular,
Mazor (1972) showed that the temperature dependency of argon, krypton, xenon, and
neon solubility in groundwater could be exploited to determine recharge temperatures by
accurately measuring the absolute abundances of the noble gases dissolved in the
groundwater.
Samples for noble gas abundances were collected during FY 92-93 for all the
water supply wells but have not been analyzed to date. These same noble gas analyses
have been performed on two GCP wells listed in Table 2. Using well UE-lq as an
example, its noble gas abundance suggests a recharge temperature of 16 + 1°C. This
temperature is consistent with current mean annual air temperatures measured within this
region of the NTS (Winograd and Thordarson, 1975; Lyles and Mihevc, 1992). Based on
an altitude calculation from the noble gas data, a 1500 ± 300m elevation is determined.
Yucca Flat elevation ranges approximately from 1200m at the valley floor to 1800m for
the adjacent hills, and this elevation range is entirely consistent with the noble gas
calculations. In general, the noble gas data are consistent with the idea that the recharge
is of local origin, and agree with the 14Cresults and the conclusions of Winograd and
Thordarson (1975).
Because of the long range transport of 4He in the crust, it is difficult to use 4He
accumulation as a precise groundwater chronometer. Since the aquifer is a trap for 4He,
however, high concentrations of 4He generally indicate long residence ages for the
groundwater. A simple model can be used to estimated the residence age. We take a
24

uniformcrustalflux of 4He to be 3 x 10⁵ atoms4He/cm2sex (e.g. TorgersonandClarke,,
1985 and O'Nions and Oxburgh,1983), and given the 4He flux into the waterand the
volume of the water, we can calculatethe rateatwhich the 4H¢ concentration should
increaseor:I
( Flux )( Residence age )4He _( Aquiferthickness)( Porosity) )"
wi
The measured radiogenic 4He concentration is about 1012atomgml for UE-lq (Davisson
et al., 1993). If we choose an aquiferthickness of 103 m and a porosityof 20%, then we
calculate anage of approximately3700 years (Thisdepartsfrom the calculated age given
in Davisson et al., 1993 by a factor ten due to a revised4He flux). In general, the water is
old but the 4He data gives an age a factor of 6 less thanthe apparent14(2age. The lower
apparent4He age may be due to a reducedregional flux of 4He into the aquiferbeneath
the Nevada Test Site. This model also assumes that no4He loss fromthe aquiferhas
occurred.The 4Heage is very uncertainat this timebut may be calibratedagainst the 14C
ages as the database grows.
ContaminantCharacterization _.-
Radionuclides - The radionuclides3H, 60Co, 85Kr, 90Sr, 99Tc, 125Sb, and 137Cs comprise
the suite of radiochemicalanalyses measuredduringFY 92-93 that also may include the
" environmental isotopes 36C1,14C, and 129I. These radionuclides are weapons testing-
related productscommonly foundin subsurfacenucleartest cavities. Their moderateto
long half-lives make them ideal radioactivecontaminanttracers of nuclear cavity
products. All concentrationsfor these constituentsmeasured thus far on the HRMP
samples, with the exception of 3H (and the environmentalisotopes), are below detectable
limits (Table 2). With the exception of one well (UE-Sn) measuredduringFY 92-93, the
25

3H contents are at natural, non-contaminant levels. In addition, all the levels, including
the 3H, are well below the maximum permissible concentrations for potable groundwater.
Below is a list of proposed federal drinking water limits of the radionuclides (Federal
Register, 1991) measured for this report:
Tritium (3H) 60,000 pCi/L
Carbon-14 (14C) 3200 pCi/L
Chlorine-36 (36C1) 1850 pCi/L
Cobalt-60 (60Co) 218 pCi/L
*Krypton-85 (85Kr) 250 pCifl.,
Strontium-90 (90Sr) 42 pCi/L
Technetium-99 (99Tc) 3790 pCi.L
Antimony-125 (125Sb) 1940 pCi/L
Iodine-129 (1290 21 pCifL
Cesium-137 (137Cs) 119 pCi/L
Uranium-234 (234U) 26 pCi/L
Uranium-235 (235U) 27 pCi_
Uranium-238 (238U) 26 pCi/L
* Valueis 10 timestheanalyticallimitandis setby theUGTARI/FSatDOENevada.
Most radionuclide characterization of groundwater at th, NTS has incorporated}
the analysis of water from or near detonation cavities (Borg et al., 1976; Crow, 1976;
Bryant, 1992) where fission-related contaminants comprise a radionuclide source term
including groundwater and melt glass (Smith, 1993). Radionuclides currently being
analyzed for these HRMP samples are common fission products (85Kr and 99Tc), neutron
activation products (60Co), or radiogenic products from decay of short-lived fission
26

products (90Sr,137Cs,125Sb, 85Kr, and 99Tc) produced from a subsurface nuclear
detonation (Borg et al., 1976; Bryant, 1992). The activity level of any particular one of
these radionuclides in the groundwater depends on the magnitude and the type of test and
the response of the geologic medium (Borg et al., 1976).
Krypwn-85 is in a dissolved gas phase and has a higher rate of mobility within the
groundwater than 90Sr and 137Cs which tend to absorb to rock material and be immobile,
although their fission product precursors were volatile nuclides with a potential for short
. range migration. Technetium-99 is mobile in oxidized waters, whew,as 60Co and 125Sb
tend to have a low mobility and an affinity to rock absorption.
The 3H analyses completed at LLNL are determined using the 3He accumulation
technique (Surano et al., 1992). In this method, all the 3He initially present in the sample
is removed and the 3H is allowed to decay to its daughter product 3He for a known length
of time, and accumulate to a measurable concentration. After about 60 days, the
accumulated 3He is analyzed by high sensitive mass spectrometry (detection limit = 104
atoms 3He).
Tritium (tl/2=12.43 yrs) is produced in the upper atmosphere by nuclear reactions
. between energetic cosmic rays and nitrogen and oxygen. This natural production
mechanism leads to a mean 3H concentration in continental precipitation of about 5 TU
(Craig and Lal, 1961; ITU = 3.2 pCi/l H20 = 0.12 Bq/l H20). -"
With the advent of atmospheric nuclear testing, 3H levels in precipitation rose
dramatically (especially in the northern hemisphere) to a peak value of about 1000 TU in%
1963 (Weiss and Roether, 1980). Current precipitation averages about 10-20 TU in
central continentalareasand averagesabout 5 TU nearthe California coast.
All of the samples analyzed have relatively low to undetectable 3H levels with the
exception of UE-5n. This sample shows 3H at 3100 TU, that given its close proximity
(--300 meters) to the Cambric ditch, must be receiving infiltrated tritiated water that
recharged when the ditch was full during the pumping experiments with the Cambric
27

cavity (Bryant, 1992).The 3H value of UE-5n is less than 1%of the Cambricditchwater
3H activity and is abouthalf the drinkingwater standardof 20,000 pCFl(6250 TU).
Ruggieriet al. (1988) determinedthat infiltrationratesof tritiatedwater below the
Cambricditch was approximately0.3 m/day, or about 110 m/year. The Cambricevent
pumpingexperiment was initiatedin October 1975 wherewaterdischargedfrom the well
into the Cambric ditch reacheda maximumconcentrationof 107pCi/L. Over the course
of 18 years since the pumpingwas initiated,the tritiummaximumconcentrationtoday
would be approximately3.8 x 106pCi/L. This tritiumpulsewould be able to reachthe
watertable in UE-5n at ~215 meterswithin a minimumof 3-4 years. The tritium
concentrationin UE-5n is <1% of the expected concentrationof the Cambric ditchwater.
The tritiumin UE-5n probablyrepre,_entsa dispersivetail of the tritiumplume beneath
the Cambric ditch and greatertritiumconcentrations(<3 x 10⁶pCi/L) may occuradjacent
to the well With time, dispersionof the tritiumwill decrease its totalconcentration per
volume.
About half of the remainingsamplesshow 3Hbelow 0.5 TU indicatingessentially
purepre-nucleartest water.The remainderof the samples show valuesup to about4 TU
which suggests the presenceof some anthropogenic3H. However, two duplicate
analyses within this set showed variationsof this magnitude,so we areconcerned that an
analytical blankproblemmightexist (although noneOfthe analyticalblanksshowed the
effect). All of the samples which showed detectable 3H arebeing re-analyzed and will be
includedin the final report.
The Nuclear ChemistryDivision has extensive experience with nuclear diagnostic
measurements involving hydrogenisotopes. On a large numberof undergroundnuclear
explosions (about20), we have includedlargequantitiesof D20 as a tracerfor residual
3H. Frommeasurementsof promptlyrecovered hydrogenand water,we were able to
infer the extent of dilutionof the bomb residual3Hby local groundwater. We were also
able to deduce the distributionof residual3H between HT (tritiatedhydrogengas) and
28

HTO(tritiatedwater). We expect little of the HT to be incorporatedinto the groundwater
mass, while most of the HTOwould combine with the groundwatermass. The
experimentallydeterminedresultsshow that the majorityof the residual3H (>95%) ends
up as HTOdue to isotopic exchange between HT and H20 at temperaturesaround700°C.
The mass of the H20 whichequilibrateswith the gaseous HT is reasonablyconstant at
two times the watercontained in the explosion meltmass or about 109 gH20/kiloton. For
" most undergroundnucleartests, the watercontent is about 10-20% by weight (nearly
. saturated). Thus we can conclude thatabout 3 x 10⁵liter of H20/kiloton mixes with the
device residual3H. Device residual3H variesconsiderablybutcan be estimatedon a
case by case basis. We haveadopted 109.1010pCi/l H20 as anaveragevalue for the
cavity source term and we believe that the majorityof this water is freely available to
enterand mix with groundwater. Activity levels detectedoutside of cavities tend to be
somewhat lower (e.g. 3H=lx106 to lxl07pCi/L, Crow, 1976; Bryant,1992) due to the
groundwaterdilution.
Field beta scans of the groundwatersampled in the drill-back holes at the NTS
show levels from a factorof 100 less thandrinkingwater levels (UE-7ns) to levels overa
factorof I000 greater than drinkingwater limits (U-4u). All fall ator below the observed
level of tritiumoutside of cavities mentioned above andsuggests that groundwater
dilution may have occurredin the zones penetratedby these wells. -'
SUMMARY
This report presentsthe initial resultsand preliminaryinterpretation for a new
: geochemical and isotope databasedeveloped for the NTS groundwaters. Techniques for
field sampling using wireline bailing methods andutilizing existing pumpingsystems, as
well as analytical proceduresfor the isotopic analysis have been developed.
Field measurementsof waterlevels in the sampledwells indicateessentially a
bimodal distributionseparatingwaterlevels at higherelevations (e.g. Pahute Mesa) from
29

water levels of lowerelevations (e.g. Yuccaand FrenchmanHats). The remainingwater
levels appearto forma non-hydrostatictransitionbetween thetwo groupingsof water
levels and areprobablyrelatedto higherelevations adjacentto the Flats. Down-hole
temperaturemeasurementshave confirmedanomaloustemperaturegradientsin the
easternYucca Flat areaand on PahuteMesa, where horizontaltemperaturegradients up
to 0.33°F/100ft arefound.
Consistent with previousworkby others, the majorion geochemistryof the NTS "
groundwateris dominatedby Na-K-HCO3and Ca-Mg-HCO3watertypes, where the Na-
richwater appearsto be relatedto dissolutionof the volcanic tufts and the Ca-richwater
is relatedto dissolution of the Paleozoiccarbonates. An inc_ in dissolved Si also
seems to be indicativeof groundwaterthat residesin the volcanic tufts. The source(s) of
the variationof the Na/Ca ratios may be complex andcontroUedbyion exchange
reactionswith clays, evaporativeconcentrationin the vadose zone, and lithologicai
heterogeneitiesin additionto simple differentialdissolutionbetween the volcanic tufts
and the Paleozoic carbonates.
To date, 14Cmeasurements on 15 wells yield apparentages between 4000 and
38,000 years for groundwatersat the NTS. Age calculationsat this time have high
uncertainties(± 10,000 years on some wells) dueto carbonate dissolution and 813C
variabilityand exchange. Many of the groundwatersdecrease their 14Crelative
abundance as their HCO3 concentrationsincreasesuggesting that dissolution of
carbonates control the apparentages. Carbon-13analysis of the groundwaterindicatejs
that isotopic contributionto thedissolved HCO3is probablyfromthe "dead"Paleozoic
carbonates, consistent withprevious reports. Furtherinvestigation of the vadose zone
carbonate would help to constrain all the potential carbon sourcesand influence on the
14Catomic abundancesin the saturatedzone. The uncertaintyin the calculated ages will
decrease as more geographicaland geochemical constraint can be made on: 1)the
recharge613Csignature of the groundwater,2) the extent of carbonate dissolution and
3O

isotopic exchange with the Paleozoic carbonates, and 3) the initial 14(2atomic
abundances in the recharging groundwater.
The 3_1/C1 ratios measured in the NTS groundwaters do not indicate the
presence of very old groundwater, in agreement with the observation that all
groundwaters have a perceptible 14Cactivity. The 36C1systematics have been
investigated and compared with similar groundwater conditions in the Dakota Aquifer of
Kansas, where it is found that addition of a "dead" 36C1chloride source to the dissolved
- chloride in the groundwater lowers the 36CI/C1ratios by a factor of 10 or more. In the
case of Kansas, 36C1depleted saline brines diffuse upward and mix with the potable
groundwater at shallower depths. At the NTS addition of "dead" chloride by perhaps the
Paleozoic carbonates and the volcanic tufts are contributing to much of the decrease in
the 36CI/C1ratios of the groundwater.
Initial results of 87Sr/StSr measurements of the dissolved Sr in the NTS
groundwaters indicate that the less radiogenic component is characteristic of higher Si
concentrations related to the volcanic tufts, where more radiogenic values are associated
with higher bicarbonate concentrations and the Paleozoic carbonates. Lithological
heterogeneities and secondary mineralization may be major controls on the 87Sr/86Sr
ratios of the NTS groundwaters and further investigations are needed.
The 234U/238U values measured in the NTS groundwaters during FY 92_93 are
not included in this report and are undergoing data reduction. A review of previous work
on 234U/238U at the NTS is presented.t
Measured noble gas abundances in the water supply wells are anticipated in the
: near future. The data should yield information regarding the recharge temperatures and
elevations of the groundwater. In the future, 'tHe concentrations may help calibrate the
14Cages.
Contaminant characterization of select fission related radionuclides is in progress
for all wells in addition to drill back holes in explosion cavities. Results from tritium
31

analyses indicate that all wells, with the exception of the drill back wells, fall well below
the drinking water standards. Many of the wells are tritium dead indicating old
groundwater, where some wells may suggests some anthropogenic levels of tritium of
very low levels, but analytical uncertainties are very high at this time and re-analysis is
needed. Well UE-Sn shows a substantial tritium level of approximately 9900 pCFL or
half the drinking water standard. The tritium source probably originates from infiltration
of Cambric ditch t.ritiatedwater, and is consistent with fluid rate calculations. Field
measurements of u'itium levels in the drill back wells vary up to 5 orders of magnitude,w
with the highest occurring in well U4u at approximately 107 pCifL.
ACKNOWLEDGMENTS
We gratefully acknowledge the indispensable help of John Andrews, Joan
Beiriger, Jan Brown, Dick Nagel, Ken Marsh, Sid Niemeyer, Marc Caffee, Bob Finkel,
Carol Velsko, and the numerous individuals at the NTS whose knowledge and experience
contributed to the success of this project.
32

L
REFERENCES
Andrews,J.N. and Fontes, J.Ch., 1993, Comment on "Chlorine-36datingof very old
groundwater,3, furtherresults on theGreatArtesianBasin, Australia"by
Torgensenet al. WaterResourcesResearch,29, 187I-1874.
Bentley, H.W., 1986, Chlorine-36in the terrestrialenvironment,in Fritz,P., Fontes, J.
Ch., eds. Handbook of EnvironmentalIsotope Geochemistry. p. 427-480.
Bentley, H.W., Phillips, F.M., Davis, S.N., Habermehl, M.A., Airey, P.L., Calf, G.E.,
Elmore, D., Gore, H.E., Torgersen,T., 1986, Chlorine-36 dating of very old
groundwater: 1. The Great Artesian Basin, Australia. Water Resour. Res., 22, p.
1991-2001.
Blankennagel,R.K. and Weir, J.E., 1973, Geohydrologyof theeastern partof Pahute
Mesa, NevadaTest Site, Nye County, Nevada. USGS Prof.Paper712-B, 35 pgs.
Borg, I.Y., Stone, R., Levy, H.B., Ramspott,L.D., 1976, Informationpertinent to the
migrationof radionuclidesin groundwaterat the NevadaTest Site. UCRL-52078,
LLNL, 216 pgs.
Bryant, E.A., 1992, The Cambricmigrationexperiment. LA-12335-MS, LANL, 37 pgs.
-- Buddemeier,R.W., Finkel,R.C., Marsh,K.V., Ruggieri,M.R., Rego, LH., Silva, R.J.,
1991, Hydrology and radionuclidemigrationat the NevadaTest Site.
RadiochimicaActa, 52/53, 275-282.
33

Chapman, LB. and Lyles, B.F., 1993, Groundwater chemistry at the Nevada Test Site:
Data and preliminary interpretations. Desert Research Institute Water Resources
Center Publication 45100, 45 pgs.
Craig, H. and Lal, D., 1961, The production rate of natural tritium, Tellus 13, 85-105.
Crow, N.B., 1976, First observations of tritium in groundwater outside chimneys of
underground nuclear explosions, Yucca Flat, Nevada Test Site. UCRL-52073, ,r
LLNL, 36 pgs.
Davis, S.N. and Murphy, E., 1986, Dating Groundwater and the Evaluation of
Repositories for Radioactive Waste. NURF_ICR-4912, University of Arizona.
181 pgs.
Davisson, M.L., G.B. Hudson, J. Kenneally, GJ. Nimz and LH. Rego, 1993, Report on
the radiochemical and environmental isotope character for monitoring well
UE-lq: Groundwater Characterization Program, Lawrence Livermore National
Laboratory, UCRL-ID- 114158, 28p...
Domenico, P.A. and Schwartz, F.W., 1990, Physical and Chemical Hydrogeology. John
Wiley and Sons: New York, 824 pgs.°e
Drever, J.I., 1988, The Geochemistry of Natural Waters. Prentice Hall: New Jersey, 435
pgs.
Elmore, D., et aL, 1979, Analysis of 36C1in environmental water samples using an
electrostatic accelerator. Nature, 277, p. 22-25.
34

Fabryka-Martin, L, Whittemore, D.O., Davis, S.N., Kubik, P.W., Sharma, P., 1991,
Geochemistry of halogens in the Milk River aquifer, Alberta, Canada. Applied
Geocbem., 6, p. 447-464.
Fallow,R.A., Beiriger, L, Rego, LH., Buddemeier, R.W., Marsh, K.V., 1988, Calibration
and application of Marinelli beakers. UCRL-53779, LLNL, p. 32-34.
. Federal Register, 1991, 58, 33120-33121.
Fritz, P., Fontes, J. Ch., 1986, Handbook of Environmental Isotope Geochemistry. Vols.
1-2. Elsevier: New York, 557 pgs.
FrOlich, K., et al., 1991, Application of isotopic methods to dating of very old
groundwaters: Milk River aquifer, Alberta, Canada. Appl. Geochem., 6, 465-472.
Goldberg, E.D., Minoru, K., Schmitt, R.A., Smith, R.H., 1963, Rare-earth distributions in
the marine environment. Jour. Geophy. Res., 68, p. 4209-4217.
Grove, D.B., Rubin, M., Hanshaw, B.B., Beetem, W.A., 1969, Carbon-14 dates-6f
groundwater from a Paleozoic carbonate aquifer, south-central Nevada. U.S.
Geol. Survey Prof. Paper 650-C, p. C215-C218.%
: Gunnink, R. and Niday, J.B., 1972, Computerized quantitative analysis by gamma-ray
spectrometry. UCRL-51061, LLNL.
35

Hendry, M.L and Schwartz, F.W., 1988, An alternative view on the origin of chemical
and isotopic patterns in groundwater from the Milk River aquifer, Canada. Water
Resour. Res., 24, p. 1747-1763.
Horwitz, E.P., Dietz, M.L., Fisher, D.E., 1991, Separation and preconcentration of
strontium from biological, environmental, and nuclear waste samples by
extraction chromatography using a crown ether. Anal. Chem., 63, 522-525.
e.
Knauss, ICG., 1984, Petrologic and geochemical characterization of the Tonopah Spring
Member of the Paintbrush Tuff: Outcrop samples used in waste packaging
experiments. Lawrence Livermore Lab UCRL-53558, 36 pgs.
Lyles, B.F. and Mihevc, T.M., 1992, NTS groundwater recharge study, FY 1992. Desert
Research Institute. 40 pgs.
Marshall, B.D., Z.E. Peterman and LS. Stucldess, 1993, Strontium isotopic evidence for a
higher water table at Yucca Mountain, High Level Radioactive Waste
Management, Proceedings of Fourth International Conference, American Nuclear
Society and American Society of Civil Engineers, p. 1948 -1952. "
Mazor, E., 1991, Applied Chemical and Isotopic Groundwater Hydrology. Halsted Press:
New York, 274 pgs.
Mazor, E., 1972, Paleotemperamres and other hydrological parameters deduced from
noble gases dissolved in groundwater; Jordan Rift Valley, Israel. Geochim.
Cosmochim. Acta, 36, p. 1321-1336.
36

Mifflin, M.D. and Hess, J.W., 1979, Regional carbonate flow systems in Nevada. J.
Hydrol., 43, 217-237.
Nolte, E., Krauthan, P., Korschinek, G., Maloszewski, P., Fritz, P., Wolf, M., 1991,
Measurements and interpretations of 36C1in groundwater, Milk River aquifer,
Albert, Canada. Applied Geochem., 6, 435,445.
, Nordstrom, D.K., Olsson, T., Carlsson, L., Fritz, P., 1989, Introduction to the
hydrogeochemical investigations within the International Stripa Project.
Geochim. Cosmochim. Acta, 53, 1717-1726.
Norris, A.E., Wolfsberg, K., Gifford, S.K., Bentley, H.W., Elmore, D., 1987, Infiltration
at Yucca Mountain, Nevada, traced by 36C1. Nuclear Instr. Methods. Phys. Res.,
B29, p. 376-379.
O'Nions, R. K. and Oxburgh, E.R., 1983, Heat and helium in the earth: Nature, 306, p.
429-431.
Osmond, J.K. and CowarL J.B., Groundwater. in Ivanovich, M. and Harmon, R.S., eds.
Uranium Series Disequilibrium: Applications to Environmental Problems.
Clarendon Press: Oxford. p. 202-245.
" Pearson, F.J. Jr., et al., 1991, Applied Isotope Hydrology, A Case Study in Northern
Switzerland. Studies in Environmental Science 43, Elservier: New York.
Peterman, Z.E., J.S. Stuckless, B.D. Marshall, S.A. Mahan and K. Futa, 1992a, Strontium
isotope geochemistry of calcite fracture fillings in deep core, Yucca Mountain,
37

Nevada- a progressreport, High Level Radioactive Waste Management,
Proceedings of the Third International Conference, American Nuclear Society and
American Society of Civil Engineers, p. 1582- 1586.
Peterman, Z.E., Stuckless, J.S., Mahan, S.A., Marshall, B.D., Gutentag, E.D., Downey,
J.S., 1992b, Strontium isotope characterization of the Ash Meadows groundwater
system, southern Nevada, USA. in Kharaka, Y.K., Maest, A.S., eds. Proceedings
of the 7th International Symposium on Water-Rock Interaetion-WRI-7, Park City,
Utah, p. 825-829.
Phillips, F.M., Bentley, H.W., Davis, S.N., Elmore, D., Swanick, G.B., 1986, Chlorine-36
dating of very old groundwater: 2. Milk River aquifer, Alberta, Canada. Water
Resour. Res., 22, p. 2003-2016.
Phillips, F.M., Mattiek, J.L., Duval, T.A., Elmore, D., Kubik, P.W., 1988, Chlorine-36
and tritium from nuclear weapons fallout as tracers for long-term liquid and vapor
movement in deserts soils. Water Resour. Res., 24, p. 1877-1891.r
Raytheon Services Nevada (1990) Nevada Test Site drilling and mining summary. "The
Red Book".
°I.
Ruggieri, M.R., Tyler, S., Buddemeier, R.W., 1988, Infiltration and recharge (Cambric
event site), in Buddemeier, R.W., ed., Hydrology and Radionuclide Migration
Program 1985-1986 Progress Report. Lawrence Livermore Lab. UCRL-53779,
47 pgs.
38

Schoff, S.L. and Moore, J.E., 1964, Chemistry and movement of groundwater, Nevada
Test Site. USGS Trace Element Investigations TEI-838, 75 pgs.
Silva, R.L, Evans, R., Rego, LH., Buddemeier, R.W., 1986, Technetium analyses in the
radionuclide migration project. Nuclear Chemistry Division FY86 Annual
Report, LLNL, p. 14-16.
, Smith, D.K., 1993, A review of literature pertaining to the leaching and sorption of
radionuciides associated with nuclear explosive melt glasses. Lawrence
Livermore Lab., UCRL-ID-113370, 26 pgs.
Spencer, E.B., 1990, A radiocarbon study of groundwater in the western Nevada Test Site
and vicinity. Master's Thesis, University of Nevada, Reno. 124 pgs.
Stuckless, J.S., Peterman, Z.E., Muhs, D.R., 1991, U and Sr isotopes in groundwater and
calcite, Yucca Mountain, Nevada: Evidence against upwelling water. Science,
254, p. 551-554.
Stuiver, M. and Polach, H.A., 1977, Reporting of 14Cdata. Radiocarbon, 19, p.355-363.
Surano, K.A., Hudson, G.B., Failor, R.A., Sims, J.M., Holland, R.C., MacLean, S.C.,
Garrison, J.C., 1992, Helium-3 mass spectrometry for low -level tritium analysis
: of environmental samples. Jour. Radioanal. Nuclear Chem. Art., 161, p. 443-453.
Thompson, P.H., 1991, Geothermal investigation of LANL areas of Yucca Flat. Letter to
K. Hahn at LANL. Raytheon Services Nevada-Geology/Hydrology Division. 11
pgs.
39

Torgerson, T. and Clarke, W. B., 1985, Helium accumulation in groundwater, I: An
evaluation of the sources and the continental flux of crustal 4He in the Great
Artesian Basin, Australia. Oeochimica st Cosmochimica Acta, 49, p. 1211-
1218.
Weiss, W. and Rcether, W., 1980, The rates of tritium input m the world oceans. Earth
Planet. Sci. Lett., 49, 435-446.
Winograd, I.J., Thordarson,W., 1975, Hydrogeologic and hydrochemical framework,
south-central Great Basin, Nevada-California, with special reference to the
Nevada Test Site. U.S. Geological Survey Professional Paper 712-C. 126 pgs.
Winograd, I.J. and Pearson, F.J., 1976, Major carbon 14 anomaly in a regional carbonate
' aquifer: possible evidence for megascale channeling, south central Great Basin.
Water Resources Research, 12, 1125-1143.
Winograd, I.J. and Robertson, F.N., 1982, Deep oxygenated groundwater:, anomaly or
common occurrence7 Science, 216, 1227-1229. '
40

FIGURE CAPTIONS
Figure 1. Location mapafterWinogradandThordarson(1975) showing the NevadaTest
Site. Highlightedgroundwaterlevel contorts suggest groundwaterflow directions.
Downwardflow is inferredin Yucca andFrenchmanFlats where contoursareenclosed.
Note also that groundwaterelevations are-600 meters higheron Pahute Mesa.
- Figure 2. Generalsketchof equipmentused at the well headfor open hole sampling.
b
Figure 3. Locations of all the wells sampledduringFrY92-93. Note that most of the
wells generally lie in a northwest-southeastdirectionfrom PahuteMesa to Frenchman!
Flat.
Figure 4. Water level elevations have a bimodal distributionseparatingwells located at
higher elevations from wells located at lower elevations. The horizontal distribution of
the water levels relative to the penetration depth suggests normal hydrostatic pressures,
where deviations from horizontal may indicate non-hydrostatic pressures.
Figure 5. The waterlevels in the NTS wells do not form a unit regression, where rates of
increase in surface elevation commonly arehigherthanratesof inc_ase in water
elevations.
Figure6. Mappedare the down-hole temperaturemeasurementscollected during the FrY
. 92-93 field seasons. Although some of the temperaturevariationis attributableto
differences in the sampledepth, abnormaltemperaturegradientsexist below the surface
at Pahute Mesa and eastern Yucca Flat.
41

.........
i
Figure 7. Cross-section runningnorthwest-southeastthroughYucca Flatwith measured
temperaturescontoured. Note the highhorizontaltemperaturegradient(0.33°F/100ft)
betweenwells ER-6-1 andTW-B.
Figure 8. Na and K most likely arederivedfromthe volcanic tufts, while Ca andMg are
predominandyfrom the Paleozoic carbonates. The one-to-one relationshipsuggests that
no additionalsources may be independendycontrollingthese concentrationsin the
groundwater.
Figure 9. Piperplot showing a distinctmixing line between a Na-HCO3end-memberand
a mixed Ca-Mg-Na-HCO3groundwaterat the test site. Similar diagramshave been
presentedby Winogradand Tbordarson(1975) and Chapmanand Lyles (1993).
Figure 10. The 14Cdecrease in the NTS groundwaterscorrelateswith 813Cenrichment
indicatingthe influence of "dead"dissolved carbonate. Some of the enrichmentof 813C
may be from isotopic equilibrationbetween the Paleozoic carbonates and the dissolved
bicarbonatein the groundwaterthatoccur, in part,independentof increaseddissolutionof
the Paleozoic carbonates.
..*
Figure 11. Possible mechanismsthat increase the uncertaintyin the 14Ccalculatedages
from groundwateratthe NTS.,i
Figure 12. The 36C1/C1ratiosof the NTS groundwatersarecomparedto those from the
DakotaAquifer of Kansas. Both groundwatersshow a common trendof "dead"CI
enrichmentthat is matchedby a dec_ in the 36C1/C1ratios. Possible sources of "dead"
CI at the NTS mayinclude the Paleozoic carbonates and volcanic tufts, or small amounts
of residualmarinewatersstill in the marinesediments.
42

1
Figure 13. Increased$i concentrationsappearto be related to groundwaterresidingin
volcanic tufts at the NTS, whereasCaenrichmentsareprobablyrelatedto Paleozoic
carbonates. The87Sr/S6Srvalues in this figure suggests thata more radiogenic
groundwatersource is indicativeof the higherCawaters derivedfrom the Paleozoic
carbonates.
,. Figure 14. More radiogenic87Sr/S6Srsignaturestend to be relatedto higherbicarbonate
concentrations in the groundwater,wherethe positive trendis most likely related to
increases in dissolution of the Paleozoic carbonates.
Figure 15. The 234U-excess (where the 234Uexcess - (activity ratio- I)[U]) for
southwesternNevada groundwateris comparedto theiruraniumconcentrations(after
Osmond and Cowart, 1982). Osmond andCowart(1982) suggested that the oxidized
watersin this region allow conservative treatmentof the uraniummobility in the
groundwaL_r.They suggested thatthedata in this figure represents mixing of different
water masses ir_the hypothesized regional flow system for the region. Well UE-lq is
from Yucca Flat (considered separatefrom the regional flow) andhas a higher2MU-
excess than those within the mixing diagram. HS=HiKo Spr.,CS=CrystalSpr.,"
PWS=PedersonWarm Spr.,AS=Ash Spr.,DH=Devirs Hole, AT=ArmagosaTest Well,
KS=King $pr., CP--CrystalPool, BS=Big Spr.,RS=RogersSpr.,FBSW=FairbanksSpr.
southwest, FBNE=FairbanmksSpr.northeast,IS=IndianSpr.,ARMY=ArmyWell #1,
: CCfCold Spr.,TS=TroutSpr., TrS=TravertineSpr.,TxS=Texas Spr.,NS=Nevares Spr.,
WJFfJackass Flats welded tuff aquifer,WFFfFrenchman Flatswelded tuff aquifer,
AFFfFrenchman Flats alluvial aquifer,YFfYucca Flats, Paleozoic carbonate aquifer.
43


J Valve
/
/J
Tool / Logging lnstrumenis/
Boom Truck i "
/
2\ i
Well Head _
_, Wireline Truck
2.2 literBailer
\
\\
\
Pleg
Figure 2.
i ii i i illll H,N i I I ililliiII III III I I III IHII II

= UE19h
• UE19c _ I - -,, d "' """
111",1 ,U12s I ..... 1519 12 8 11w¢_ ,_., ...... lo
UE18r 2 9
17 UE17a 4 TW-D 7_ _ • ,, i,,i -
18 UE16d ,,,_,_o
IDOl
0
UE16f 1 UElh= 3
30 i 16 * 11........ TW-B14
29 WWC= C-1
8 ww4!_ • I IE11aPW-3 , II P _/-2
UE5c PV_.1O
......
• J-12 WW5¢
• 5• 25
23
II #1
Figure 3

"_,axtdx...q

Surface Elevation (msl)Figure 5.


(1.]) uo!l_^Ol_t

"8 o_n_!_I
OL


"0[ oan_!_I
0"0 O'E- O'lr- 0"9- 0"8- 0"0I- O'EI- O'lrI-
_0" Q i
_ a_5 ee • • -o_ ,,
-09P,
-08
£6-E6 X._q"IN"I_"I-0(066I) j_ou_s •
,,,i,,,i,''l'''l'''l'''l''' OOIS&N

100
Figure 11.

"_;I_n_!_I

"£I _nfl!..q
- -0_'e
o,,,,,,,,,,,,,,,,,,,,,,, 09
S,.LN

"p[ _a"_!...ll"
(lomm) ¢O)H
0"6 0"9 0"£ 0"0, , , , , , , , , , , , . . , , : 080L'O
• 060L'OO• • • OOIL'O
• OIIL'O• Q _
• • OglL'O _o_
• O£IL'O 6,"J
O_,IL'O
• OglL'O
, , , , , , , , , , , , , , , , , 09IL'O
S,I,lsl

234U.EXCESS (ppb elY/


Table 1: HRMP FY 92-93
Wel_ SampleDate NTS Area Total Depth (mad Depthmrumpled(null)UE-Ia* 9/1/92 1 1141 1144UE-Ib* 9/1/92 1 920 1095
UE-Ic* 9/2/92 1 709 870, 783
UE-Ih 5/2(093 1 407 614, 566
TW-D 6/8/93 4 687 717
UE-5n 5/24/93 5 715 728
PW-I*^ 5/26/93 5 714 718PW-2*^ 5/25/93 5 695 703
PW.3 *^ 5/7.6/93 5 709 712.o
TW-B 6/7/93 6 693 710
LIE-1la 5/25/93 11 667 NONE- U-12s 7i13/93 12 1664 1675
UE.16f 7/12/93 16 996 1023
TW-I* 8/13/92 17 756 1252
UE.17a 6/9/93 17 1078 1178, 1129, 1101
UE.18r* 8/11/92 18 163 1179
UE-19h* 8/12/92 19 1368 1399
UE-20blI-I* 6/2003 20 1167 1173
Water Supply WellsUE-Sc* 5/13/93 5 163 639
WW- 5c* 5/20/93 5 577 625
WW-C* 5/19/93 6 677 722
WW-CI* 5119/93 6 675 710
WW'-4* 5/20,93 6 647 683
UE-16d* 6/2/93 16 513 1093
WW-8* 6/2/93 18 62 1359
UE-19c* 8/1382 19 -444 1372
Army Well #1" 5/12/93 22 368 613J-13* 5113/93 25 -52 654
J-12* 511_93 25 607 700
GCP Wells
UE-Iq 7/10/92 1 452 495ER-6-1 10/9/92 6 551 655
w
*Totaldepth fromRaytheon Services Nevada "NevadaTest Site Drillln8and Mining Summary".- ^Well elevations apl_oximatedfrom USGS 15' topographicalsheets.
Numbersin parenthesisaremsl elevations of the bottom of linings.All elevations are in metersrelative to sealevel

Table 1: HRMP FY 92-93
Wells Surface EJlev(mid) Water Table (msl) Casing Depth (msl)
UE.Ia* 1312 1145 1288UE-Ib* 1302 1106 1279
UE-Ic* 1282 887 1259
UE-Ih 1218 744 567
TW-D 1266 740 747
UE-5n 949 734 484 (686)
PW.I *^ 969 733 719
PW-2*^ 975 718 704
PW.3*^ 1000 727 714 .
TW-B 1198 739 728 (687)
UE.IIa 1081 736 899
U-12s 2071 1784 2067
UE-16f 1418 1306 1024TW-1" 1876 1430 1384 (745)
UE-17a 1432 1238 1063
UE-18r* 1688 1272 1192
UE-19h* 2067 1423 1372
UE-20bh-l* 2023 1350 1433
Water Supply WellsUE-Sc* 980 733 980
WW- 5_ 939 728 577
WW-C* 1195 725 777 (700)
WW-CI* 1195 723 918 (692)
WW-4* 1098 844 660
UE-16d* 1428 1198 782
WW-8* 1736 1409 1736 (838)
UE-19c* 2144 1432 1406
ArmyWell #1" 961 751 576 (547)J-13* 1011 728 540 (-20)
J-12* 954 729 684
GCP Wells
UE-Iq 1244 - 495ER.6-1 1200 - 655 .-
*Totaldepthfrom Raytheon Sexvices Nevada "NevadaTest Site DrillingandMiningSummary".
^Well elevations approximatedfrom USGS 15' topographicalsheets.
Numbersin parenthesisaremsl elevations of the bottom of linings.All elevations are in metersrelative to sealevel

Table 2: HRMP-FY 92-93
WELL T_C pH TDS (mg/L) Spec. Cond. (gS) DO (mg/L)UE-Ia 25.4 7.35 348 692 3.0UE-Ib 27.4 7.41 217 448 4.0UE-Ic-1350 26.2 7.29 232 479 6.0
liE- 1c-1636 36.2 7.45 226 452 5.0UE- lh- 1979 25.3 8.20 515 1029 -
UE-lh-2137 25.3 8.20 515 1029 -U-3mi-1600 33.0 8.07 -U-3mi-1650 33.0 8.07 - - "TW-D 23.9 7.88 228 445 4.0UE-5n 25.7 8.82 214 427 2.0
., PW-I 22.5 8.67 407 407 3.0PW-2 23.3 8.52 231 462 3.0PW-3 24.1 9.30 198 295 3.0TW-B 20.1 7.50 188 381 3.0
U-12s 26.1 10.45 - 632 7.0
UE-16f 29.4 8.85 1090 3.5
TW-1 26.6 8.66 118 238 2.0
UE-17a-831' 26.6 7.58 396 789 4.0
UE-17a-992' 23.9 7.63 400 803 1.5UE-17a-1085' 24.4 8.27 1,090 1325 1.5LIE-18r 31.9 8.05 208 394 3.5UE-19h 27.9 8.33 193 415 2.0UE-20bh-1 25.8 8.26 93 186 12,0
Water Supply WellsUE-5c 26.3 8.01 227 452 5.5
WW-5c 25.4 8.81 302 603 3.0WW-C 35.2 6.89 566 1135 3.0WW-CI 32.7 6.54 563 1131 1.8
WW-4 25.3 7.39 207 415 6.0
UE-l(xl 20.4 - 360 717 <1.0WW-8 25.0 - 97 194 6.0
UE-19c 36.5 7.71 87 174 6.0
Army Well #1 29.3 7.50 315 625 3.5J-13 29.3 7.26 170 338 6.0J-12 26.7 7.36 150 299 6.0GCP Wells
"' UE-I-q 31.2 7.80 - - -ER-6-1 39.0 7.13 - 514 5.0
• Post-Shot WellsUE-2ce - - 669 - 2.0
UE-3e#4-1630' - 12.50 4,030 - -UE-3e#4-1785' - 11.50 2,070 - 3.5UE-3e#4-1885' - - -UE-3e#4-2150' 11.30 1,150 - 3.0U-4t-PS-3A 7.55 377 - 3.0U-4u-PS-2A - 7.55 209 - 3.0
UE-7-ns - - 223 - 2.5

1J
Table 2: HRMP-FY 92-93
WELL Ca (mg/L) Mg (mg/L) Na (mg/L) K (mg/L) Na/Ca
UE-Ia 48.5 23.9 50.5 8.7 1.0
UE-Ib 37.4 13.7 31.3 10.7 0.8
LIE-le- 1350 36.0 13.4 34.5 12.3 1.0
LIE-le- 1636 36.7 13.7 33.7 12.4 0.9
UE-Ih-1979 - - -
UE- 1h-2137 15.3 7.5 102.0 25.0 6.7
U-3mi-1600 16.9 3.3 126.3 7.1 7.5
U-3mi-1650 18.9 3.7 121.6 8.0 6.4
TW-D ....
UE-5n 6.5 1.4 78.0 8.0 12.0
PW-1 14.9 5.4 57.0 6.0 3.8 ,
PW-2 19.2 7.0 56.0 6.0 2.9
PW-3 14.5 5.6 60.0 7.0 4.1
TW-B ....
U-12s ....
UE-16f - -
TW-I 1.2 - 51.3 0.5 42.8
UE-17a-831' ....
UE-17a-992' - - - "
UE-17a-1085' ....
UE-18r 15.6 0.3 72.5 2.0 4.6
UE-19h 14.9 1.5 63.8 4.0 4.3
UE-20bh-I ....
Water Supply WellsUE-5c 8.0 2.1 83.0 6.0 10.4
WW-5c 13.5 0.8 130.0 6.0 9.6
WW-C 71.1 29.6 118.0 13.0 1.7
WW-C 1 79.0 30.2 119.0 13.0 1.5
WW-4 23.0 5.9 48.0 5.0 2.1
UE-16d ....
WW-8 - - "
UE-19e 1.4 - 35.8 0.5 25.6
Army Well #1 43.5 22.2 40.0 5.0 0.9J-13 12.0 1.9 41.0 4.0 3.4
J-12 13.9 2.4 40.0 4.0 2.9
GCP Wells
UE-I-q 29.4 15.3 31.2 4.6 1.1ER-6-1 3.2 13.1 46.9 7.0 0.1
Post-Shot Wells
UE-2ce - - -
UE-3e#4-1630' - - "
UE-3e#4-1785' - - - "
UE-3e#4-1885' -
UE-3e#4-2150' -
U-4t-PS-3A - - -
U-4u-PS-2A - - -
UE-7-ns - - "

Table 2: HRMP-FY 92-93
WELL Li (pg/L) U _) Sr (lagS) Mn (lag/L) Fe (pg/L) SI (rag/L)UE- la 630.0 I00.0 1180.0 9.0UE-Ib 4.3 470.0 37.8UE-Ic-1350 - 4.1 410.0 - - 44.3UE-1c-1636 - 4.4 420.0 - - 44.5
UE-Ih-1979 - - 169.0 41.3 - -UE-lh-2137 83.0 0. I 200.0 23.7 120.0 5.5U-3mi-1600 80.0 18.5 480.0 50.0 120.0 54.5U-3mi-1650 • 80.0 16.5 840.0 50.0 120.0 56.9TW-D - - " "UE-5n 21.0 2.6 46.0 15.6 170.0 20.7PW-1 22.0 4.5 104.6 2.6 90.0 25.1PW-2 23.0 6.3 186.0 41.1 100.0 14.6PW-3 23.0 3.5 107.0 3.5 60.0 20.2
" TW-B - 0.8 14.9 77.7 150.0U-12s - -UE-16f .....
TW-I - - 20.0 - 20.0 9.1UE-17a-831' - 0.4 829.0 62.5 180.0 -UE-17a-992' - 0.8 855.0 44.8 180.0 -UE-17a-1085' - - 314.0 10.7UE-18r 80.0 3.5 80.0 - - 21.6UE-19h 90.0 7.7 270.0 60.0 20.0 25.5UE-20bh-1 - 1.0 0.9 4.0 60.0 -
Water Supply WellsUE-5c 15.0 4.6 51.1 0.9 70.0 30.9WW-5c 3.0 6.5 19.4 0.4 24.0WW-C 302.0 6.4 793.0 - 520.0 13.7WW-C1 299.0 6.4 811.0 0.7 520.0 14.2WW-4 21.0 5.4 146.0 - 100.0 27.4UE-16d - 1.6 434.0 2.7 - -WW-8 - 0.6 8.2 1.6 - -
UE-19e .... 19.7
Army Well #1 51.0 2.2 744.0 - 330.0 9.7J-13 90.0 0.4 36.5 1.2 100.0 27.3
J-12 46.0 0.6 42.0 - 80.0 26.6
GCP Wells
• UE-I-q 10.0 2.3 140.0 - - 23.8ER-6-1 30.0 3.3 180.0 15.8
• Post-Shot Wells
UE-2ce ......
UE-3e#4-1630' - ....
UE-3e_-1785' - - " "UE-3e#4-1885' - - - - "UE-3e#4-2150' -U-4t-PS-3A ....
U-4u-PS-2A ......
UE-7-ns .....

Table 2: HRMP-FY 92-93
WELL CI (mg/L) 804 (mg/L) HCO3 (mg/L) I (ttg/L)UE-Ia 26.3 - "357i -
UE-Ib 5.9 "184
UE-lc-1350 5.6 "180 -"190UE-lc-1636 5.5 -
UE-Ih-1979 43.2 - 260 8.0
UE-lh-2137 43.6 2.5 260 5.6
U-3mi-1600 - - "
U-3mi-1650 - " "
TW-D . - *225 8.0
UE-5n 14.6 27.2 160 6.8
PW-1 12.0 34.3 100 2.3 -
PW-2 15.2 26.6 100 4.2
PW-3 10.1 28.9 90 3.4 t_
TW-B 22.6 21.0 100 13.0
U-12s 14.0 - " "
UE-16f 18.8 - *900 3.0
TW-1 3.2 - "104 2.0
UE-17a-831' 27.7 95.5 200 15.0
UE-17a-992' 28.0 96.0 200 26.0
UE-17a-1085' 43.1 45.0 540 280.0
UE-18r 6.3 . "164 -
UE-19h 8.5 . "147 -UE-20bh-1 . 60 2.0
Water Supply WellsUE-5e 14.1 45.0 150 3.9WW-5e 12.3 29.6 270 6.6WW-C 43.5 65.1 485 6.4WW-C 1 43.6 67.1 480 5.2
WW-4 15.2 42.3 "134 3.1
UE-16d 14.3 59.4 200 12.0WW-8 9.2 14.2 30 4.0
UE-19c 3.1 . *37 : -
Army Well #1 24.0 54.7 400 3.2J-13 7.6 17.6 105 3.2
J-12 8.0 21.4 100 3.8
GCP Wells
UE-I-q 5.3 - 160 -ER-6-1 9.9 - 210
Post-Shot WellsUE-2ee . . 201 -
UE-3e#4-1630' 240.0 >700 -
UE-3e#4-1785' 160.0 - "
UE-3e#4-1885' - - "
UE-3e#4-2150' 60.0 - 195
U-4t-PS-3A . <120 -
U-4u-PS-2A - 214 -
UE-7-ns - 104 -
* Bicarbonate calculated from laboratory extractions of total inorganiccarbon.

Table 2: HRMP-FY 92-93
WELL 8180 _I_, 14Cfmc 813C 14C age
UE-Ia - 0.605 -8.6 4,209
UE-lb - 0.160 -4.5 14,996
UE- Ic- 1350 - 0.026 -4.6 28,987
UE-lc-1636 - - 0.026 -5.3 28,987
UE-lh-1979 ....
UE-Ih-2137 - - " "
U-3mi-1600 - - " "
U-3mi-1650 - " "
TW-D - "
UE-5n - - " "
,, PW- 1 - - 0.167 -7.3 14,790PW-2 - - 0.338 - 8,979
PW-3 . - 0.210 -7.4 12,897
* TW-B - -
U-12s ....
UE-16f ....
TW-1 - 0.301 -10.2 9,925
UE-17a-831' .....
UE-17a-992' - - " "
UE-17a-1085' - -
UE-18r . - 0.082 -1.4 20,281
UE-19h - 0.094 -3.3 19,546
UE-20bh-1 - - " "
Water Supply WellsUE-5c .....
WW-Se .....
WW-C - - - "
WW-C1 . - 0.010 - 37,827
WW-4 ....
UE-16d .....
WW-8 .....
UE-19c - - 0.114 -5.3 17,737
Army Well #1 - - 0.054 - 24,129J-13 - " -
J-12 ....
GCP Wells
• UE-I-q - - 0.077 -2.4 20,650
" ER-6-1 . - 0.021 -0.7 31,900
• Post-Shot Wells.t
UE-2ce ....
UE-3e#4-1630' - - "
UE-3e#4-1785' - ....
UE-3e#4-1885' - ....
UE-3e#4-2150' - -
U-4t-PS-3A ....
U-4u-PS-2A ....
UE-7-ns - " "

Table 2: HRMP-FY 92-93
_VELL 36Cl/Cl x 10"13 36CI atoms x 107 87Sr/86Sr 234U/238U
UE-Ia 8.63 38.6 0.70959 / "
UE-Ib 6.26 6.3 0.70953 -
UE-Ic-1350 7.14 6.8 -
UE-lc-1636 7.22 6.7
UE-lh-1979 1.52 11.2
UE-lh-2137 1.71 12.7 - -
U-3mi-1600 - "
U-3mi-1650 - - "
TW-D 7.24
UE-5n 423.00 1049.3 0.70931 -
PW-1 8.42 17.2 - " "
PW-2 5.27 13.6 0.71116 -
PW-3 6.78 11.6 -
TW-B 9.42 36.2 "
U-12s 3.35 8.0 - "
UE-16f 3.12 10.0 - "
TW-1 9.68 5.3 0.70893 -
UE,17a-831' 5.85 27.5 "
UE-17a-992' 5.66 26.9
UE-17a-1085' 3.58 26.2 " "
UE-18r 6.36 6.8 0.70909 -
UE-19h 4.79 6.9 " "
UE-20bh-1 6.45 - " "
Water Supply Wells - - " "UE-5c 6.13 14.7 0.70975 -
WW-5c 6.96 14.5 0.71074 -
WW-C 1.76 13.0 0.71503 -
WW-C1 1.66 12.3 0.71506 -
WW-4 6.16 15.9 "
UE-16d 6.36 15.5 " -
WW-8 5.83 9.1 - -
UE-19e 6.26 3.3 0.70943 -
Army Well #1 4.28 17.5 0.71196
J-13 5.02 6.5 0.71155 -
J-12 5.03 6.8 0.71162 -
GCP Wells
UE-I-q 7.90 7.10 0.71129 0.000268ER-6-1 3.92 6.59 0.71283 0.000229
J
Post-Shot Wells
UE-2ce - " "
UE-3e#4-1630' - " " "
UE-3e#4-1785' - - "
UE-3e#4-1885' " "
UE-3e#4-2150' - -
U-4t-PS-3A - " "
U-4u-PS-2A - " "
UE-7-ns

Table 2: HRMP-FY 92-93
WELL 4Hex 1012atm/mli 129Xex 1010 82Krx 1011 20Nex 1012 36Arx 1013
UE-la .....
UE-Ib " " "UE-lc-1350 -UE-lc-1636 ....
UE-lh-1979 - - " "UE-lh-2137 - - " "U-3mi-1600 .....
U-3mi-1650
TW-D - "UE-5n .....
PW-I .....PW-2 - - " "
PW-3 .....
" TW-B - - "U-12s - " "
UE-16f ....
TW-1 .....
UE-17a-831' - " " "
UE-17a-992' .....
UE-17a-1085' - - -
UE-18r - "
UE-19h .....
UE-20bh-1 .....
Water Supply Wells .....UE-5¢ .....
WW-5e - - "WW-C - " "WW-CI - ' " "WW.4 - - " "
UE-16d .....
WW-8 .....
UE-19c - " "
Army Well #1 - - " "J-13 - - " "
J-12 - - " "GCP Wells
" UE-I-q 1.76 5.81 1.92 4.27 2.51" ER-6-1 10.10 6.01 2.09 7.14 2.96
• Post-Shot WellsQ
UE-2ce - - " "
UE-3e#4-1630' - - " "UE-3e#4-1785' - ....
UE-3e#4-1885' - - -UE-3e#4-2150 .....
U-4t-PS-3A - " "
U-4u-PS-2A - " "
UE-7-ns - - " "

Table 2: HRMP-FY 92-93
WELL 3H (TU) 8SKr(pCi/L) 90Sr (pCi/L) 99Tc (pCI/L) 60Co (pCi/L)LIE-Ia - - - <5 <0.680
UE-Ib - - <5 <0.437UE-Ic-1350 - - - <5 <0.472UE-lc-1636 - <5 <0.582UE-lh-1979 3.4:k0.6 - <5UE-Ih-2137 1.9i-9.5 - <5 -
U-3mi-1600 - - - <5 -U-3mi-1650 - - - <5 -TW-D 1.2x_.4 - <5 -UE-5n 3079+161 - <5 -PW- 1 0.1:£-0.2 - <5 •
PW-2 0.2±0.2 - <5 -PW-3 1.2±0.3 - <5 - g
TW-B - - - <5 <0.667
U-12s - - <5 -
UE-16f . - <5 -
TW-1 . . - <5
UE-17a-831' - - <5 -UE-17a-992' 0.0±0.2 - - <5 -
UE-17a-1085' 0.5i-0.2 - <5 -UE-18r - - - <5 <0.631UE-19h - - <5 <0.455UE-20bh-1 0.3i,0.2 - <5 -
Water Supply Wells - - -UE-5c 0.2±0.2 - - <5 -WW-5c 0.2±0.2 - - <5 -WW-C 3.6i0.5 - - <5 -WW-C1 .....
WW-4 0.3±0.2 - - <5
UE-16d 19.8±12.0 - <5 -W_,V-8 0.5±0.3 - - <5 -
UE-19e 0.5±0.2 - - <5 <0.699
Army Well #1 0.4:£-0.2 - <5 -J-13 0.2:£-0.2 - <5 -
J-12 0.2±0.2 - - <5
GCP Wells
UE-I-q <0.3 <30 <0.9 <5 <0.590 .ER-6-1 <0.3 <30 <0.9 <5 <0.400Post-Shot Wells fieldscans
UE-2ce 40,625 - - "
UE-3e#4-1630' 137,500 - - -
UE-3e#4-1785' 15,000 -
UE-3e#4-1885' 10,313 -
UE-3e#4-2150' 2,937,500 ....
U-4t-PS-3A 12,188 - - -
U-4u-PS-2A 15,000,000 - -
UE-7-ns 144 - -

Table 2: HRMP-FY 92,93
WELL 12SSb(pCl/L) 137Cs (pCi/L)UE-Ia <1.90 <0.695
UE-lb <1.32 <0.427
UE-1¢-i350 <1.43 <0.455
UE-1¢-1636 <1.65 <0.583
UE-Ih-1979UE-lh-2137 - "U-3mi-1600 - -U.3mi-1650 - "TW-D - "UE-5n - "
• PW-I
PW-2 - "e
PW-3 " "
TW-B <1.90 <0.706
U-12s
UE-16f - "TW-1 - "
UE-17a-831' - "
UE-17a-992' - "
UE-17a-1085' - -
UE-18r <1.82 <0.609
UE-19h <1.36 <0.437
LlE-20bh-1
Water Supply Wells -UE-5e - -WW-5e - -
WW-CWW-C1
WW-4
UE-16d - -
WW-8
UE-19c <1.93 <0.641
Army Well #1J-13 - -
J-12 - -
GCP Wells
: UE-I-q <1.80 <0.650ER-6-1 <1.20 <0.400
" Post-Shot Wells -
UE-2cc - -
UE-3e#4-1630' - -
UE.3e#4-1785'
UE-3e#4-1885'
UE.3e#4-2150' - -
U-4t-PS-3A - -
U-4u-PS-2A - -
UE-7-ns

APPENDIX 1: Sampling Procedures For Isotopic Analyses of Groundwater
Noble Gases (for pumpedwe_lsonly)
Samplingcontainers: Coppertube mountedbetween two pinchclamps on a metalbase;
three to fourper well.
1. Label the copper tube with a Sharpiepen.
2. Attachthe small diameterhose to the large diameterhose. then to the coppertube.
" Attachthe extra lengthof plaintygon tubingto the outlet end of the copper tubing.
ouuetend of the plaintygon tubing above the level of the• 3. One person must hold the '"
copper tubing. This preventsanymodern atmospherefrom entering the sample.
4. Obtaina slow, non-turbulentwaterflow using the regulatorand/orsplitter.
5. Dislodge any airbubbles by lightly strikingthe hose and coppertubing with the
ratchetwrench.
6. Use the wrenchto tighten the pinchclamps. Pinch the outlet end of thecopper tube
first. Be very careful thatthe small diameter hose at the inlet end of thecopper tube
doe_ not blow-off from the increasein pressure. It may be necessary to stop the flow
of water with the regulatoronce the outlet endof the copper tube has been
pinchedoff. Caremust be takennot to over flex the pinch in the coppertube as this
will destroythe airtightness of the coppertubeandcompromise the sample.
7. Tightenthe pinch clamps atthe inlet endof thecopper tube. Remove all tygon tubing
from thecopper tubing.
NOTE: Collect a minimumof three samplesper well; preferablyfour samples.
Q
" I8_,.D._ (steps 1 and 2 for pumpedwells only).
Sampling containers: two 30 ml glass bottles.
1. Rinse the outsidebefore opening the bottle to remove any accumulationof duston the
bottle surface.
A

2. Fill the bottle with approximately15 mls of water,cap andshake. DiscardthisbottleJ
rinse.
3. Fill the bottle leaving about 3 mls (or 10%of the bottle volume) of headspace. Make
sure the cap is sealed properlyso as not to promoteevaporationand compromise the
sample.
4. Dry and label the bottle.
5.Single bagthebouleandtapethebag closed.
9
3I-1(steps I and 2 for pumpedwells only).
Sample container: one 0.5 literglass bottle.
1. Rinse the outside beforeopening the bottle to remove any accumulationof dust on the
bottle surface.
2. Fill the bottle with approximately250 mls of water,cap andshake. Discard this bottle
rinse.
3. Fill the bottle completely leaving a small headspace.
4. Single bag the boule and tape the bagclosed.
36C,,1(steps I and 2 for pumpedwells only).
Sampling container: l-liter plastic l-Chem bottle
1. Rinse theoutside before opening the bottle to remove any accumulationof duston the
bottle surface.
2. Fill the bottle with approximately2 liters of water,cap and shake. Discard this bottle
rinse.
3. Fill the boule to the blackmark on the shoulderof the bottle,
4. Dry and label the bottle.
5. Single bagthe bottleand tape the bagclosed.
B

14_ (steps 2-4 for pumped wells only).
Sampling container: l-liter glass bottle (cleaned & acid leached)
1. Latex gloves must be worn when touching the bottle, and the first bag that covers the
bottle, and during the addition of HgCI2.
2. Rinse the outside of the bag before opening to remove an/accumulation of dust on the
bag surface.
3. Fill the bottle with approximately 500 mls of water, cap and shake. Discard this bottle
, rinse.
4. Insert the short tygon tubing, attached beneath the I-Chem bottle cap, into the bottle
and fill. NOTE: The tygon tubing inserted into the bottle is not to touch anything else
except the plastic I-Chem bottle with which it is stored. Allow at least one bottle
volume to overflow. Leave about 5 ml headspace.
5. Dry, label and single bag the bottle. Tape the bag closed to keep dust off the bottle.
6. In a sheltered area (the trailer in Mercury), add 4 drops saturated aqueous mercuric
chloride solution using a cleaned disposable pipette.
NOTE: Keep the saturated aqueous mercuric chloride away from any acids.
7. Double bag the bottle with two new clean bags. Tape the bags closed.
234_238_._.87_86Sr (steps 2 and 6 for pumped wells only).
Sampling container: One acid leached l-liter plastic I-Chem bottle.
1. Attach 0.45mm filter to the appropriate hoses such that the flow arrow on the filterQt
. capsule points up.q
. 2, Purge 5-8 minutes while keeping the flow arrow on the filter pointing up.
3. Latex gloves must be worn when touching the bottle or the first bag that covers the
bottle.
4. Rinse the outside of the bag before opening to remove any accumulation of dust on the
bag surface.
C

5. Rinse theoutside of the bottlebeforeopeningto removeany accumulationof dust on
the bottle surface.
6. Fill the bottle with approximately500 mls of water,cap and shake. Discard this bottle
rinse.
7. Insertthe short tygon tubing,attachedbeneath the I-Chembottlecap, into the bottle
and f'fll. NOTE: The tygon tubinginsertedintothe bottle is not to touchanythingelse
except the plastic l-Chem bottle with which it is stored. Allow at least one bottle d
volume to overflow (not for bailed wells). Leave about5 ml headspace.
8. Dry, label and single bag the bottle. Tape the bagclosed to keep dust off the bottle.
9. In a sheltered area(trailerin Mercury),add HNO3 to each bottleto achieve a pH of 2.
I0. Secure the cap with a stripof parafilm. (i.e. wrapparafilmaroundthe cap to prevent
leakageduringshipping).
11.Tape the bag.
12. Add a second bag and tape it.
_JSr (steps 2 and4-6 for pumped wells only).
Samplingcontainer: l-liter plastic I-Chembottle.i
1. Attach0.45ram filter to the appropriatehoses such that the flow arrowon the filter
capsule points up.
2. Purge5-8 minutes while keeping the flow arrowon the filter pointing up.
3. Laytex gloves must be worn when touching the bottleor the firstbag that covers thett
B
bottle.
4. Rinse the outside of the bag before openingto remove any accumulationof dust on the ."
bag surface.
5. Rinse the outside of the bottle beforeopening to remove any accumulationof dost on
the bottle surface.
D

6. Fill the bottle with approximately 500 mls of water, cap and shake. Discard this bottle
rinse.
7. Insert the short tygon tubing, attached beneath the l-Chem bottle cap, into the bottle
and f'dl. NOTE: The tygon tubing inserted into the bottle is not to touch anything else
except the plastic l-Chem bottle with which it is stored. Allow at least one bottle
volume to overflow. Leave about 5 ml headspace.k
8. Dry, label and single bag the bottle. Tape the bag closed to keep dust off the bottle.
, 9. In a sheltered area (trailer in Mercury), add HNO3 to ear.h bottle to achieve a pH of 2.
I0. Secure the cap with a strip of parafilm. (i e. wrap parafilm around the cap to prevent
l__kage during shipping).
1I. Tape the bag.!
12. Add a second bag and tape it.
99_ (steps 1 and 2 for pumped wells only).
Sampling container: 4-liter plastic l-Chem bottle
1. Rinse the outside before opening the bottle to remove any accumulation of dust on the
bottle surface.
2. F'dlthe botde with approximately 2 liters of water, cap and shake. Discard this bottle
rinse.
3. Fill the bottle to the black mark on the shoulder of the botde.
4. Dry and label the bottle.441
. 5. Single bag the bottle and tape the bag closed.q,h
137_,&,._125,_Jl (steps 1 and 2 for pumped wells only).
Sample container: one 1.liter plastic I-Chem bottle.
1. Rinse the outside before opening the bottle to remove any accumulation of dust on the
bottle surface.
E

2. Fill the bottle with approximately 500 mls of water, cap and shake. Discard this bottle
rinse.
3. Fill the bottle to the shoulder.
4. Single bag the bottle and tape the bag closed.
85Kr (for pumped wells only).d
Sampling container: one l-liter stainless steel evacuated cylinder.
1. Remove and save the closed-end nuts, used for shipping, from both ends of the ,
cylinder.
2. Place the free end of the small diameter tygon tubing over one end of the now-bear
threads.
3. While holding the cylinder vertical, with the hose end pointing down, slowly open the
bottom knob, closest to the attached hose. A hissing sound associated with the filling
of the cylinder can be heard.
4. Allow the cylinder to fill.
5. When the cylinder is full (often the temperature of the water is sufficiently different
from that of the stainless steel cylinder that the water level in the cylinder can be easily
determined), slowly open the top knob while keeping the cylieder vertical.
6. Allow 2-3 cylinder volumes (2-3 liters) to overflow.
7. Close the top knob first, then quickly close the bottom knob.
NOTE: Because of the pressure build-up associated with several steps in this procedure,Ib
all steps must be carded out quickly. The pressure of the water may be adjusted before
beginning sampling. -'
For bailed wells, collect a sealed bailer for shipment back to LLNL.
F

APPENDIX 2: Analytical Techniques
All analyses were completed at the Nuclear Chemistry Division of Lawrence
Livermore Lab unless otherwise stated. Analyses for field 3H were completed using
standard scintillation counting techniques at the NTS.
The Tc for 99Tc determination was separated and concentrated by resins andm
analyzed by liquid scintillation counting (Silva et al., 1986). One liter of the sample wasotalc
+ oxidized with HCI and H202 and mixed with 0.5 grams of AG 1 x 8 (100-200 mesh)
anion resin. After 4 hours of stirring, the resin was separated and stacked in a column,
and then converted from the chloride form to the perchlorate form with 2cc of NaCIO4.
The Tc was reduced and eluted from the column with a 1M NaCIO4-O.02M Na2SO3
solution. Two milliliters of the sample was mixed with 15cc of scintillation cocktail and
counted.
In the Sr purification for 90Sr analYSiS, the water sample was mixed with a 2mg Sr
carrier, evaporated down to a dry residue in a teflon beaker and then redissolved with 2cc
of 6N HNO3. The dissolved sample was loaded onto a Sr-Spec resin column and washed
6 times with 6N HNO3 (Horwitz et al., 1990). The Sr was removed from the resin with
0.05N HNO3, mixed with a 20rag yittrium carrier, and equilibrated for 28 days allowing
90y to grow. The Y was then separated from the Sr by the same resin technique as
above. A saturated solution of (NI-I4)2C204 was added to the Y extract. The mixture
was then filtered and the residue ashed into a yittrium oxide. The oxide was sandwiched
+. between mylar and beta counted.
- The 60(20, 125Sb, 137Cs activities were counted using a cylindrical Marinelli
beaker with a well design for a standard up-looker cryostat (Failor et al., 1988). The
cryostat contains a high purity germanium gamma-ray detector. Samples were untreated
and counted for approximately 1 week. Raw data was reduced using the GAMANAL
software (Gunnink and Niday, 1972).
G

The 36C1was extracted by precipitating a quantitative yield of CI from the water
by adding AgNO3 and precipitating a AgCI solid (Bentley et al., 1986). The AgCI was
then dissolved in NH4OH to precipitate out any sulfates. The aqueous solution was
filtered and AgCI was reprecipitated by acidification. The precipitate was then washed,
dried-down, and packed into an aluminum target. The 36(21was separated from the AgCI
by Cs source ionization and accelerator mass spectrometry (Elmore et al., 1979), and the
analysis was reported as a ratio of 36(21to total CI in the water.
The inorganic carbon was extracted from the sample by vacuum line acid .
stripping of the water using 5 ml of 100% phosphoric acid to acidify the sample to a pH
<1. Carbon dioxide liberation from the sample was further facilitated by an ultrapure
nitrogen carrier gas. The CO2 was cryogenically trapped and separated from the water.
The CO2 was split for 13(2analysis by stable isotope mass spectrometry, completed at the
University of California, Davis Geology Department. The carbon dioxide for 14C was
reduced on a separate vacuum line to graphite using a cobalt catalyst and hydrogen gas at
a 5700C reaction temperature, and 14(2concentrations were determined by accelerator
mass spectrometry.
For 87Sr/86Sr ratio determination, the water sample was evaporated down to a dry
residue in a teflon beaker and then redissolved with 2ee of 6N HNO3. The dissolved
sample was loaded onto a Sr-Spec resin column and washed 6 times with 6N HNO3
(Horwitz et al., 1990). The Sr was removed from the resin with 0.05N HNO3, and the Sr
extract was dried-down. The residue was baked onto a tantalum filament and analyzedDD
for its 87Sr/86Sr ratio by thermal ionization mass spectrometry. ,o[,
For 234U/238U ratio determination, an aliquot of the water sample was added to a
10mg/ml FeCI2 solution. The mixture was adjusted to pH 8 with NI-I4OH and the U was
precipitated out with Fe(OH)3 (Goldberg et al., 1963). The precipitate was collected,
acidified, and the U was separated with a uranium specific resin. The U extract was
H
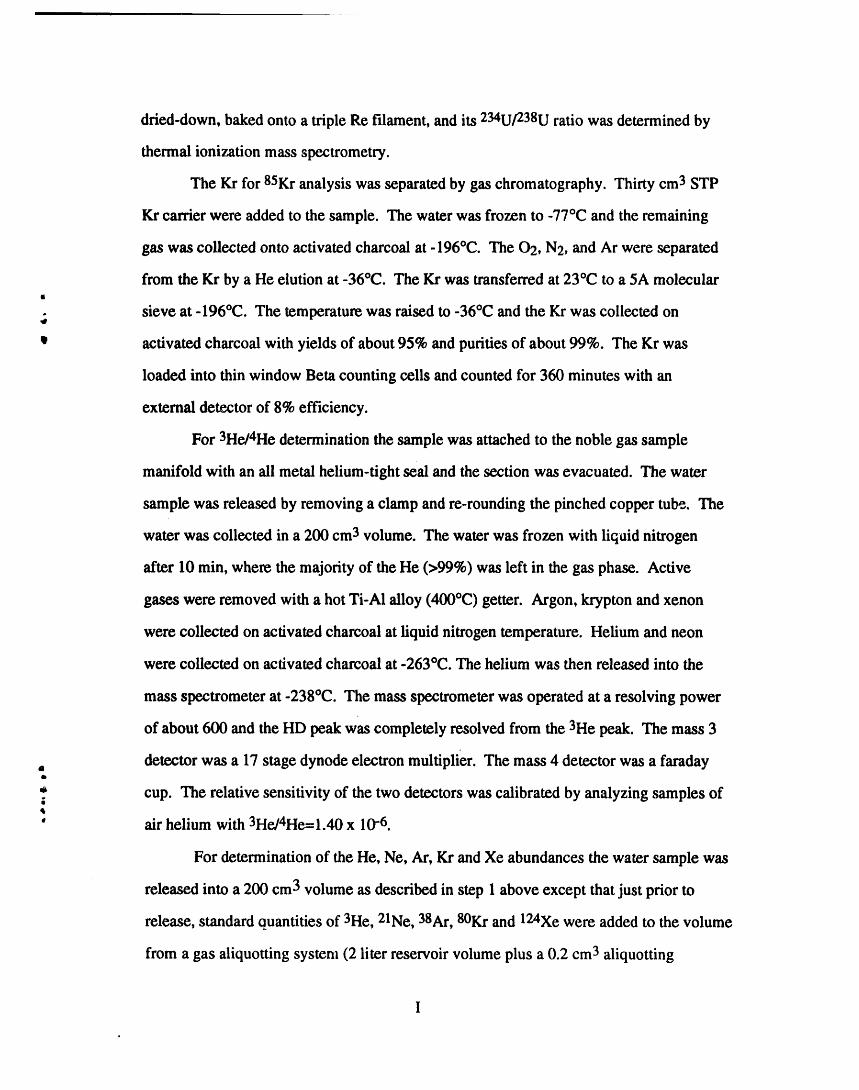
dried-down, baked onto a triple Re filament, and its 234U/238U ratio was determined by
thermal ionization mass spectrometry.
The Kr for 85Kr analysis was separated by gas chromatography. Thirty cm 3 STP
Kr carder were added to the sample. The water was frozen to -77°C and the remaining
gas was collected onto activated charcoal at -196°C. The 02, N2, and Ar were separated
from the Kr by a He elution at -36°C. The Kr was transferred at 23°C to a 5A molecularI
.; sieve at -196°C. The temperature was raised to -36°C and the Kr was collected on
activated charcoal with yields of about 95% and purities of about 99%. The Kr was
loaded into thin window Beta counting cells and counted for 360 minutes with an
external detector of 8% efficiency.
For 3He/4He determination the sample was attached to the noble gas sample
manifold with an all metal helium-tight seal and the section was evacuated. The water
sample was released by removing a clamp and re-rounding the pinched copper tube. The
water was collected in a 200 cm 3 volume. The water was frozen with liquid nitrogen
after 10 min, where the majority of the He (>99%) was left in the gas phase. Active
gases were removed with a hot Ti-AI alloy (400°C) getter. Argon, krypton and xenon
were collected on activated charcoal at liquid nitrogen temperature. Helium and neon
were collected on activated charcoal at -263°C. The helium was then released into the
mass spectrometer at -238°C. The mass spectrometer was operated at a resolving power
of about 600 and the HD peak was completely resolved from the 3He peak. The mass 3
detector was a 17 stage dynode electron multiplier. The mass 4 detector was a faradayIl
? cup. The relative sensitivity of the two detectors was calibrated by analyzing samples ofI
' air helium with 3He/4He=l.40 x 10-6.
For determination of the He, Ne, At', Kr and Xe abundances the water sample was
released into a 200 cm 3 volume as described in step 1 above except that just prior to
release, standard quantities of 3He, 21Ne, 38Ar, 80Kr and 124Xe were added to the volume
from a gas aliquotting system (2 liter reservoir volume plus a 0.2 cm 3 aliquotting
I

volume). The watersample was frozenwith liquid nitrogenandthen thawed and warmed
to 50°C. The sample was then frozenagainwith dryice (-78°C). This process was to
mix the sample gases with thespike gases (3He,21Ne, 38At, 80Krand 124Xe). A small
aliquot of the gas (1%) was takenfor argonanalysis. The gas was purifiedbyexposure to
hotTi-AI alloy getters and then thegas was admittedto the mass spectrometerfor
isotopic analysis. The remaininggas was purifiedby gettering,and then the Ar, Krand
Xe were collected on activatedcharcoal. The He and Ne were split into two samples.
First the He was analyzed, then the Ne was analyzed. The charcoaltrapcontaining the Kr t
and Xe was warmedslightly to desorb the At, andthe At was pumpedaway. The Krand
Xe were then completely released and admittedto the mass spectrometer. The Krand Xe
were measuredsimultaneously. The measurementswere calibrated by using samples of
water preparedin the laboratory(mostly at 2I°C, 600' elevation). Analytical uncertainty
is approximately2%.

C:,
__.QIT/ iT/


![UCRL-PRES-215087 Update on the Development and Validation ... · UCRL-PRES-215087 MERCURY [1] is a modern Monte Carlo particle transport code being developed at LLNL. The intent is](https://img.dokumen.tips/doc/110x75/5ec75a1b1ef01d61b25383ca/ucrl-pres-215087-update-on-the-development-and-validation-ucrl-pres-215087-mercury.jpg)