Embed Size (px)
Citation preview
1
REPORTCARD
OrangeCountySchools
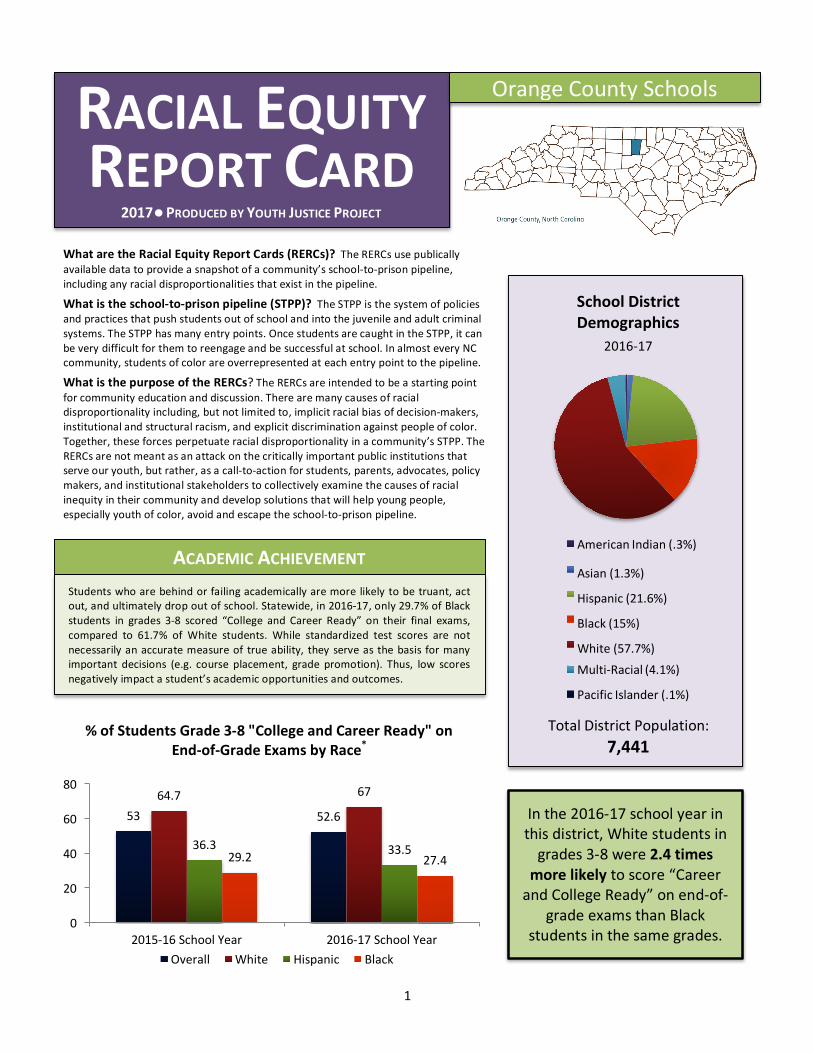
AmericanIndian(.3%)
Asian(1.3%) Hispanic(21.6%) Black(15%) White(57.7%) Multi-Racial(4.1%)
PacificIslander(.1%)
SchoolDistrictDemographics
2016-17
2017•PRODUCEDBYYOUTHJUSTICEPROJECT
ACADEMICACHIEVEMENT
TotalDistrictPopulation:7,441
RACIALEQUITY
Inthe2016-17schoolyearinthisdistrict,Whitestudentsingrades3-8were2.4timesmorelikelytoscore“CareerandCollegeReady”onend-of-
gradeexamsthanBlackstudentsinthesamegrades.
Studentswhoarebehindorfailingacademicallyaremore likely tobetruant,actout,andultimatelydropoutofschool.Statewide,in2016-17,only29.7%ofBlackstudents in grades3-8 scored “College andCareerReady”on their final exams,compared to 61.7% ofWhite students. While standardized test scores are notnecessarilyanaccuratemeasureof trueability, theyserveas thebasis formanyimportant decisions (e.g. courseplacement, gradepromotion). Thus, low scoresnegativelyimpactastudent’sacademicopportunitiesandoutcomes.
ACADEMICACHIEVEMENT
WhataretheRacialEquityReportCards(RERCs)?TheRERCsusepublicallyavailabledatatoprovideasnapshotofacommunity’sschool-to-prisonpipeline,includinganyracialdisproportionalitiesthatexistinthepipeline.
Whatistheschool-to-prisonpipeline(STPP)?TheSTPPisthesystemofpoliciesandpracticesthatpushstudentsoutofschoolandintothejuvenileandadultcriminalsystems.TheSTPPhasmanyentrypoints.OncestudentsarecaughtintheSTPP,itcanbeverydifficultforthemtoreengageandbesuccessfulatschool.InalmosteveryNCcommunity,studentsofcolorareoverrepresentedateachentrypointtothepipeline.
WhatisthepurposeoftheRERCs?TheRERCsareintendedtobeastartingpointforcommunityeducationanddiscussion.Therearemanycausesofracialdisproportionalityincluding,butnotlimitedto,implicitracialbiasofdecision-makers,institutionalandstructuralracism,andexplicitdiscriminationagainstpeopleofcolor.Together,theseforcesperpetuateracialdisproportionalityinacommunity’sSTPP.TheRERCsarenotmeantasanattackonthecriticallyimportantpublicinstitutionsthatserveouryouth,butrather,asacall-to-actionforstudents,parents,advocates,policymakers,andinstitutionalstakeholderstocollectivelyexaminethecausesofracialinequityintheircommunityanddevelopsolutionsthatwillhelpyoungpeople,especiallyyouthofcolor,avoidandescapetheschool-to-prisonpipeline.
53 52.664.7 67
36.3 33.529.2 27.4
0
20
40
60
80
2015-16SchoolYear 2016-17SchoolYearOverall White Hispanic Black
%ofStudentsGrade3-8"CollegeandCareerReady"onEnd-of-GradeExamsbyRace*
2
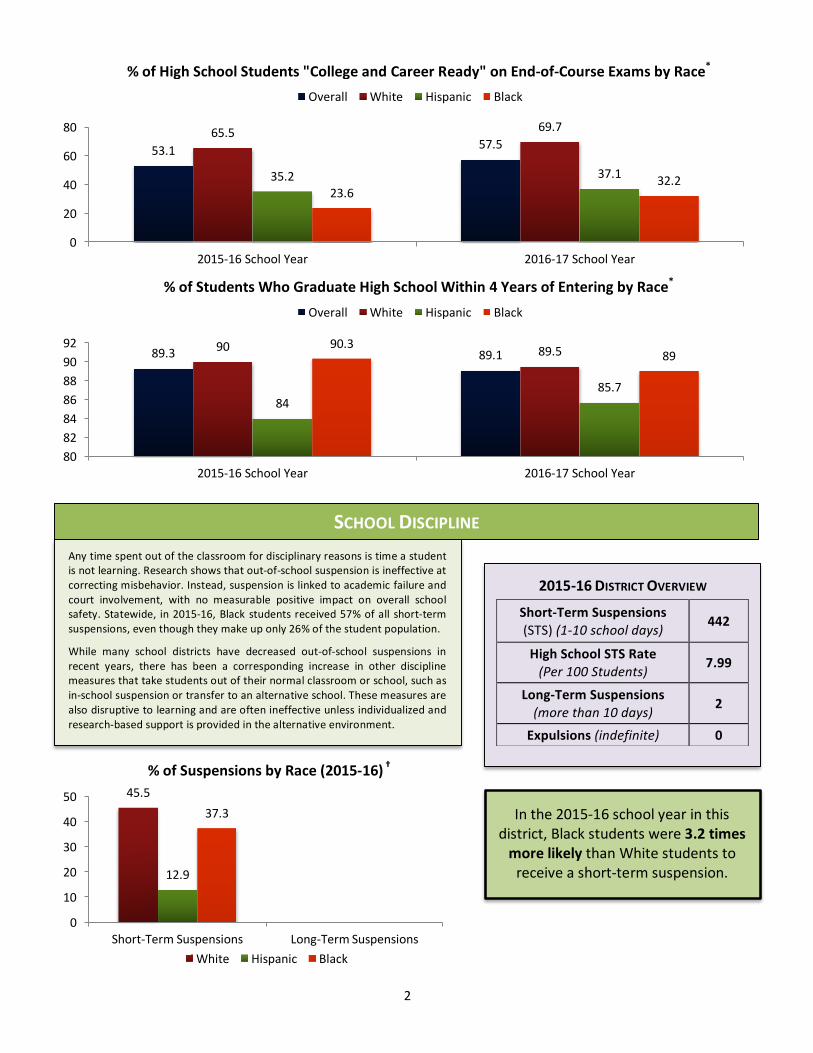
Short-TermSuspensions(STS)(1-10schooldays) 442
HighSchoolSTSRate(Per100Students) 7.99
Long-TermSuspensions(morethan10days) 2
Expulsions(indefinite) 0
53.1 57.565.5 69.7
35.2 37.123.6
32.2
0
20
40
60
80
2015-16SchoolYear 2016-17SchoolYear
Overall White Hispanic Black
%ofHighSchoolStudents"CollegeandCareerReady"onEnd-of-CourseExamsbyRace*
45.5
12.9
37.3
0
10
20
30
40
50
Short-TermSuspensions Long-TermSuspensionsWhite Hispanic Black
2015-16DISTRICTOVERVIEW
89.3 89.190 89.5
8485.7
90.389
80828486889092
2015-16SchoolYear 2016-17SchoolYear
Overall White Hispanic Black
%ofStudentsWhoGraduateHighSchoolWithin4YearsofEnteringbyRace*
SCHOOLDISCIPLINE Anytimespentoutoftheclassroomfordisciplinaryreasonsistimeastudent
isnotlearning.Researchshowsthatout-of-schoolsuspensionisineffectiveatcorrectingmisbehavior.Instead,suspensionislinkedtoacademicfailureandcourt involvement, with no measurable positive impact on overall schoolsafety.Statewide, in2015-16,Blackstudentsreceived57%ofall short-termsuspensions,eventhoughtheymakeuponly26%ofthestudentpopulation.
While many school districts have decreased out-of-school suspensions inrecent years, there has been a corresponding increase in other disciplinemeasuresthattakestudentsoutoftheirnormalclassroomorschool,suchasin-schoolsuspensionortransfertoanalternativeschool.Thesemeasuresarealsodisruptivetolearningandareoftenineffectiveunlessindividualizedandresearch-basedsupportisprovidedinthealternativeenvironment.
Inthe2015-16schoolyearinthisdistrict,Blackstudentswere3.2timesmorelikelythanWhitestudentstoreceiveashort-termsuspension.
%ofSuspensionsbyRace(2015-16)†
3
SCHOOLDISCIPLINE
YouthJusticeProjectoftheSouthernCoalitionforSocialJusticeworkstoensureequity,fairness,andjusticeforyouthinhigh-qualityeducation,juvenile,andcriminalsystems.
Formoreinformation,visitusatyouthjusticenc.org.
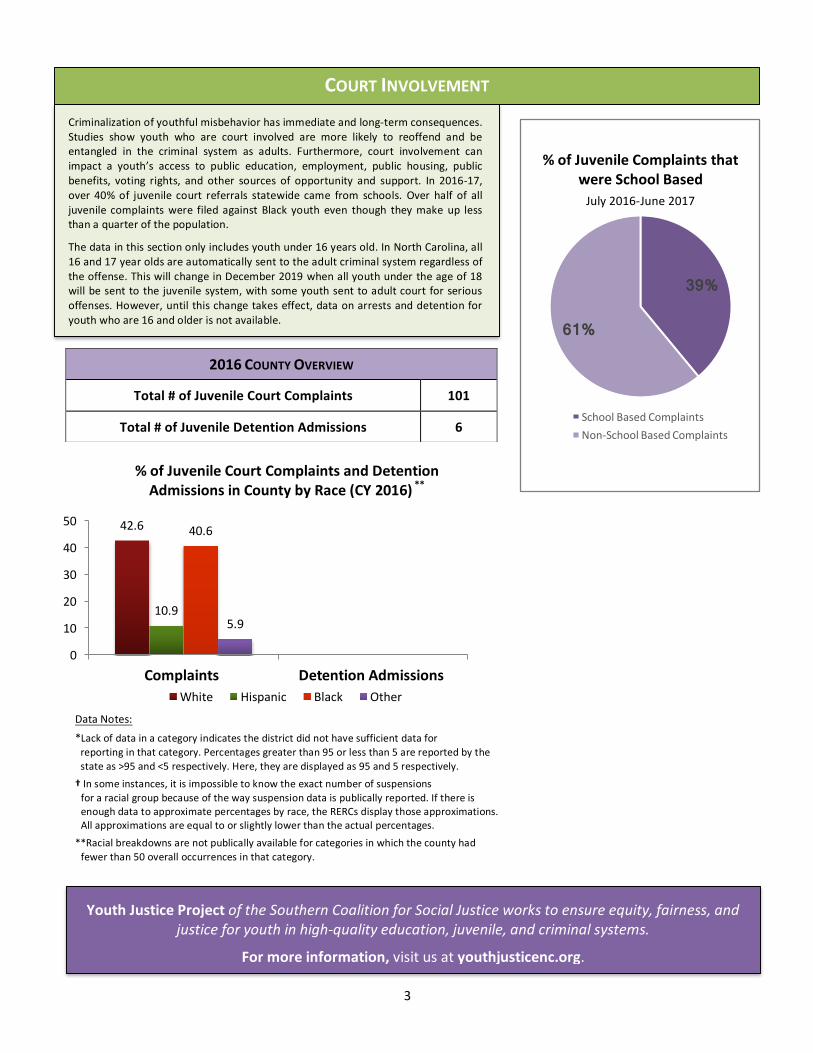
2016COUNTYOVERVIEW
Total#ofJuvenileCourtComplaints 101
Total#ofJuvenileDetentionAdmissions 6
42.6
10.9
40.6
5.9
0
10
20
30
40
50
Complaints DetentionAdmissionsWhite Hispanic Black Other
%ofJuvenileCourtComplaintsandDetentionAdmissionsinCountybyRace(CY2016)**
COURTINVOLVEMENT Criminalizationofyouthfulmisbehaviorhasimmediateandlong-termconsequences.
Studies show youth who are court involved are more likely to reoffend and beentangled in the criminal system as adults. Furthermore, court involvement canimpact a youth’s access to public education, employment, public housing, publicbenefits, voting rights, andother sourcesof opportunity and support. In 2016-17,over 40%of juvenile court referrals statewide came from schools. Overhalf of alljuvenile complaintswere filed against Black youth even though theymake up lessthanaquarterofthepopulation.
Thedatainthissectiononlyincludesyouthunder16yearsold.InNorthCarolina,all16and17yearoldsareautomaticallysenttotheadultcriminalsystemregardlessoftheoffense.ThiswillchangeinDecember2019whenallyouthundertheageof18willbesenttothejuvenilesystem,withsomeyouthsenttoadultcourt forseriousoffenses.However,until thischangetakeseffect,dataonarrestsanddetentionforyouthwhoare16andolderisnotavailable.
39%
61%
SchoolBasedComplaintsNon-SchoolBasedComplaints
%ofJuvenileComplaintsthatwereSchoolBasedJuly2016-June2017
DataNotes:*Lackofdatainacategoryindicatesthedistrictdidnothavesufficientdataforreportinginthatcategory.Percentagesgreaterthan95orlessthan5arereportedbythestateas>95and<5respectively.Here,theyaredisplayedas95and5respectively.†Insomeinstances,itisimpossibletoknowtheexactnumberofsuspensionsforaracialgroupbecauseofthewaysuspensiondataispublicallyreported.Ifthereisenoughdatatoapproximatepercentagesbyrace,theRERCsdisplaythoseapproximations.Allapproximationsareequaltoorslightlylowerthantheactualpercentages.
**Racialbreakdownsarenotpublicallyavailableforcategoriesinwhichthecountyhadfewerthan50overalloccurrencesinthatcategory.