Embed Size (px)
Citation preview

68
r bulletin 102 — may 2000 bull
69
Four Years of SOHO Discoveries– Some Highlights
B. Fleck, P. Brekke, S. Haugan & L. Sanchez DuarteSolar System Division, ESA Space Science Department, NASA/GSFC, Greenbelt, Maryland, USA
V. DomingoDepartment of Astronomy and Meteorology, University of Barcelona, Spain
J.B. Gurman & A.I. PolandLaboratory for Astronomy and Solar Physics, NASA/GSFC, Greenbelt, Maryland, USA
The SOHO missionSOHO, the Solar and Heliospheric Observatory,is an international cooperative project by ESAand NASA to study the Sun, from its deep coreto the outer corona, and the solar wind. Itcarries a complement of twelve sophisticatedinstruments (Table 1) developed and furnishedby twelve international Principal Investigator (PI) consortia involving 39 institutes from fifteencountries (Belgium, Denmark, Finland, France,
work stations in the SOHO Experimenters’Operations Facility (EOF) at NASA/GoddardSpace Flight Center, from where they cancommand their instruments in near real time.From the outset SOHO was conceived as an integrated package of complementaryinstruments, being once described as an‘object-oriented, rather than an instrument-oriented mission’. There is therefore greatemphasis on coordinated observations. Internally,this is facilitated through a nested scheme ofplanning meetings (monthly, weekly, daily), andexternally through close coordination and dataexchange for special campaigns and collabo-rations with other space missions and ground-based observatories over the Internet.
More than 500 articles have already appearedin the refereed literature and over 1500 articles in conference proceedings and in otherpublications. Here, we can only touch uponsome selected highlights.
Global structure and dynamics of the solarinteriorJust as seismology reveals the Earth’s interiorby studying earthquake waves, solar physicistsprobe the inside of the Sun using a techniquecalled ‘helioseismology’. The oscillationsdetectable at the visible surface are due tosound waves reverberating through the Sun’sinterior. These oscillations are usually describedin terms of normal modes (identified by threeintegers: angular degree l, angular order m, andradial order n). The frequencies of the modesdepend on the structure and flows in theregions where they propagate. Becausedifferent modes sample different regions insidethe Sun, one can, in principle, map the solarinterior by observing many modes. Bymeasuring precisely the mode frequencies, one
Since its launch on 2 December 1995, the Solar and HeliosphericObservatory (SOHO) has provided an unparalleled breadth and depthof information about the Sun, from its interior, through the hot anddynamic atmosphere, out to the solar wind. Analysis of thehelioseismology data from SOHO has shed new light on a number ofstructural and dynamic phenomena in the solar interior, such as theabsence of differential rotation in the radiative zone, subsurface zonaland meridional flows, sub-convection-zone mixing, a possiblecircumpolar jet, and very slow polar rotation. The ultraviolet imagersand spectrometers have revealed an extremely dynamic solaratmosphere in which plasma flows play an important role. Evidencefor an upward transfer of magnetic energy from the Sun’s surfacetoward the corona has been found. Electrons in coronal holes havebeen found to be relatively ‘cool’, whereas heavy ions are extremelyhot and have highly anisotropic velocity distributions. The sourceregion for the high-speed solar wind has been identified and theacceleration profiles of both the slow and fast solar wind have beenmeasured.
soho discoveries
Germany, Ireland, Italy, Japan, The Netherlands,Norway, Russia, Spain, Switzerland, UnitedKingdom, and the United States). Detaileddescriptions of all twelve instruments, thescience operations and data products, as wellas a complete mission overview, can be foundin ESA Bulletin No. 87.
SOHO has a unique operating mode thatprovides a ‘live’ display of data on the scientists’

can infer the temperature, density, elementaland isotopic abundances, interior mixing,interior rotation and flows, even the age of theSolar System, and pursue such esotericmatters as testing the constancy of thegravitational constant.
Interior rotation and flowsThe nearly uninterrupted data from SOHO’sMichelson Doppler Imager (MDI) yield oscillationpower spectra with an unprecedented signal-to-noise ratio that allow the determination ofthe frequency splittings of the global resonantacoustic modes of the Sun with exceptionalaccuracy. These data confirm that the decreasein angular velocity Ω with latitude seen at thesurface extends with little radial variationthrough much of the convection zone, at thebase of which is an adjustment layer, called the‘tachocline’, leading to nearly uniform rotationdeeper in the radiative interior (Fig. 1).Furthermore, a prominent rotational shearinglayer in which Ω increases just below the surfaceis discernible at low- to mid-latitudes.
The MDI team has also been able to study thesolar rotation closer to the poles than has beenachieved in previous investigations. The datahave revealed that the angular velocity isdistinctly lower at high latitudes than previouslyextrapolated from measurements at lowerlatitudes based on surface Doppler observations
and helioseismology. Moreover, they foundevidence of a submerged polar jet nearlatitudes of 75°, which is rotating more rapidlythan its immediate surroundings (red oval nearthe poles in Fig. 2).
Alternating zonal bands of faster and slowerrotation (± 7 m/s) at a depth of 2 – 9 Mmappear to coincide with an evolving pattern of‘torsional oscillations’ reported from earliersurface Doppler studies (Fig. 2). Clear evidenceof the migration of these zonal flows towardsthe equator has been found, and a recent study has established that these banded flowsare not merely a near-surface phenomenon.Rather, they extend downward at least 60 Mm(some 8% of the total solar radius) and thus are evident over a significant fraction of thenearly 200 Mm depth of the solar convectionzone (Fig. 3).
Long-lived velocity cells extending over 40–50°of longitude, but less than 10° of latitude, havebeen identified with the elusive ‘giant cells’ byBeck et al.. Their suprisingly large aspect ratiomay be a consequence of the Sun’s differentialrotation, whereby larger features are broken upby rotational shear.
High-precision MDI measurements of the Sun’sshape obtained during two special 360° rollmanoeuvres of the SOHO spacecraft have
r bulletin 102 — may 2000 bull
70
Table 1. The SOHO scientific instruments
Investigation Principal Investigator
GOLF Global Oscillations at Low Frequencies A. Gabriel, IAS, Orsay, France
VIRGO Variability of Solar Irradiance and Gravity Oscillations C. Fröhlich, PMOD Davos, Switzerland
MDI Michelson Doppler Imager P. Scherrer, Stanford University, USA
SUMER Solar Ultraviolet Measurements of Emitted Radiation K. Wilhelm, MPAe Lindau, Germany
CDS Coronal Diagnostic Spectrometer R. Harrison, RAL, Chilton, UK
EIT Extreme-Ultraviolet Imaging Telescope J.-P. Delaboudinière, IAS, Orsay, France
UVCS Ultra-Violet Coronagraph Spectrometer J. Kohl, SAO, Cambridge, USA
LASCO Large-Angle Spectroscopic Coronagraph R. Howard, NRL, Washington, USA
SWAN Solar Wind Anisotropies J.-L. Bertaux, SA, Verrières, France
CELIAS Charge, Element and Isotope Analysis System P. Bochsler, Univ. of Bern, Switzerland
COSTEP Comprehensive Supra-Thermal and Energetic-Particle Analyser H. Kunow, Univ. of Kiel, Germany
ERNE Energetic and Relativistic Nuclei and Electron Experiment J. Torsti, Univ. of Turku, Finland
IAS : Institut d’Astrophysique Spatiale SAO : Smithsonian Astrophysical ObservatoryPMOD : Physikalisch-Meteorologisches Observatorium Davos NRL : Naval Research LaboratoryRAL : Rutherford Appleton Laboratory SA : Service d’Aeronomie MPAe: Max-Planck-Institut für Aeronomie

71
Figure 1. Solar interior rotation. Red indicatesthe fastest rotating material, dark blue theslowest (courtesy of SOHO/MDI Consortium)
Figure 2. Variations in solar motion. This false-colour image represents the difference inspeeds between various areas on the Sun, bothat the surface and in the interior. Red - yellowis faster and blue slower than average. On theleft side of the image, the light-yellow bandsare zones that are moving slightly faster thantheir surroundings. The cutaway on the rightside of the image reveals speed variations inthe interior of the Sun. Only the outer 30% ofthe Sun’s interior where the variations are morecertain is shown. The red ovals embedded inthe green areas at the poles are the newlydiscovered polar plasma ‘jet streams’. Theymove approximately 10% faster than theirsurroundings, and each is about 25 000 kmacross, large enough to engulf two Earths(courtesy of SOHO/MDI Consortium)
soho discoveries
Figure 3. Migrating bandedzonal flows: variation ofrotation rate with latitude andtime at four different depths inthe convection zone. Theuniform olive-green verticalbands indicated time periodswhen no data were availablefrom SOHO (during the summerof 1998 due to the temporaryloss of the spacecraft, and inJanuary 1999 when SOHO wasin safe mode after a gyroscopefailure). The colour barindicates the dynamic range innHz of the angular velocity(from Howe et al.)

Figure 4. Relativedifferences between thesquared sound speed inthe Sun as observed by
GOLF and MDI and areference model (solid
line), as well as twomodels including
macroscopic mixingprocesses in the
tachocline (dashed anddash-dotted lines) (from
Brun et al.)
produced the most precise determination ofsolar oblateness ever. These measurementsunambiguously rule out the possibility of arapidly rotating core, and any significant solar-cycle variation in the oblateness.
Interior sound-speed profileThe unprecedented accuracy of helioseismicdata from SOHO’s MDI, GOLF and VIRGOinstruments has enabled substantial improve-ments in models of the solar interior, and haseven shown the importance of consideringmixing effects, which turn out to solve existingriddles in the isotopic composition of the Sun.
Figure 4 is quite remarkable in that there is verygood agreement between the measured soundspeed and the model throughout most of thesolar interior. Except for the conspicuous bumpat about 0.68 R (the location of the transitionfrom the radiative zone into the convectionzone), the difference is less than 0.2%,suggesting that our understanding of the meanradial stratification of the Sun is reasonablyaccurate.
In order to resolve this discrepancy at 0.68 Rand the failure of recent updated standardmodels to predict the photospheric lithiumabundance, Brun et al. introduced a new term– macroscopic mixing below the convectivezone – into the standard stellar structureequations. They showed that the introductionof this ‘tachocline layer mixing’ significantlyimproves the agreement with the helioseismicdata and photospheric abundance data. Inparticular, the anomalous bump in the sound-speed plot is practically erased (see the dash-dotted line in Fig. 4).
Local-area helioseismologyIn conventional helioseismology, most results
are obtained from a global-mode analysis. Withthe availability of high-spatial-resolution datafrom MDI, interest in studying the Sun’s localstructure has grown rapidly. As a result, severalnew techniques are being developed, includinghelioseismic holography, ring-diagram analysisand time-distance helioseismology.
Helioseismic holographyOriginally proposed by Roddier in 1975 (thoughnot as ‘holography’) and developed over thelast few years mainly by Lindsey & Braun, thistechnique has been applied to MDI data torender acoustic images of the absorption andegression of sunspots and active regions.These images have revealed a remarkableacoustic anomaly surrounding sunspots, calledthe ‘acoustic moat’, which is a conspicuoushalo of enhanced acoustic absorption at 3 mHz. At 5–6 mHz, on the other hand, aprominent halo of enhanced acoustic emission,called ‘acoustic glory’, was found surroundingactive regions. Helioseismic holographytechniques can be applied to render images ofsupposed acoustic sources that can besampled at any desired depth. This techniquehas recently been applied by Lindsey & Braunto derive the first seismic images of the far sideof the Sun, from MDI data (Fig. 5).
Ring-diagram analysisThe second technique, known as ‘ring-diagramanalysis’, is based on the study of three-dimensional power spectra of solar p-modeson a part of the solar surface. Several groupshave applied this technique to MDI data todetermine near-surface flows in the Sun. Aremarkable meridional flow from the equator tothe poles was found in the outermost layers ofthe convection zone, reaching a maximum of25–30 m/s at approximately 30° latitude. Nochange of sign of the meridional flow has beenmeasured, i.e. no evidence of a return flow hasbeen detected in this depth range. The rotationrate determined with the ring-diagramtechnique agrees well with that from globalmodes, and the measurements could beextended closer to the surface, providing newinsight into the shear layer immediately beneaththe surface.
Time-distance helioseismologyThe third, and perhaps most exciting and mostpromising new technique for probing the three-dimensional structure and flows beneath thesolar surface is called ‘time-distance helio-seismology’ or ‘solar tomography’. It measuresthe travel time of acoustic waves betweenvarious points on the surface. In a first-orderapproximation, the waves can be considered tofollow ray paths that depend only on a meansolar model, with the curvature of the ray paths
r bulletin 102 — may 2000 bull
72
(C2 ex
p–C
2 th)/
C2 th
r/R

Figure 5a. Cross-sectionof the solar interiorillustrating the waveconfiguration of two-skipfar-side seismicholography. Sound wavesfrom the far side of theSun are reflectedinternally once beforereaching the front side,where they are observedwith MDI
Figure 5b. The upper two images show themagnetic field strengthmeasured with MDI whilethe active region wasfacing the Earth – beforeand after being holo-graphically imaged on thefar side, shown in thelower image (fromLindsey & Braun)
One of the most successful applications oftime-distance helioseismology has been thedetection of large-scale meridional flows in thesolar convection zone. Meridional flows fromthe equator to the poles have been observedbefore on the solar surface in direct Doppler-shift measurements. The time-distancemeasurements by the Stanford MDI teamprovided the first evidence that such flows
being caused by the increasing sound speedwith depth below the surface. The travel time isaffected by various inhomogeneities along theray path, including flow, temperature inhomo-geneities, and magnetic fields. By measuring alarge number of travel times between differentlocations and using an inversion method, it ispossible to construct three-dimensional mapsof the subsurface inhomogeneities.
By applying this new technique tohigh-resolution MDI data, Duvallet al. were able to generate thefirst maps of horizontal andvertical flow velocities as well assound-speed variations in theconvection zone just below thevisible surface (Fig. 6). Theyfound that in the upper layers, 2–3 Mm deep, the horizontal flowis organised in supergranularcells, with outflows from the cellcentres. The characteristic size ofthese cells is 20–30 Mm and thecell boundaries coincide with theareas of enhanced magnetic field. The supergranulation outflowpattern disappears at a depth ofapproximately 5 Mm, suggestingthat the depth of the super-granular layer is less than onequarter of the characteristichorizontal size of the cells (20–30Mm).
soho discoveries
73

74
Figure 6. A vertical cutthrough the upper
convection zone showingsubsurface flows and
sound speedinhomogeneities (from
Kosovichev et al.)
persist to great depths (Fig. 7), and thereforemay play an important role in the 11-year solarcycle. They found the meridional flow to persistto a depth of at least 26 Mm, with a depth-averaged velocity of 23.5 ± 0.6 m/s at mid-latitude. More recently, they extended thesemeasurements to a depth of 0.8 R withoutfinding any evidence of a return flow. Continuityconsiderations led them to estimate the returnflow below 0.8 R at approximately 5 m/s,which might actually be detectable in thefuture, providing a useful constraint for dynamotheories.
One of the most exciting applications of solartomography is in studying the birth andevolution of active regions and complexes ofsolar activity. Kosovichev et al. have studiedthe emergence of an active region on the Sun’sdisc with this technique and their resultssuggest that the emerging flux ropes travel very
r bulletin 102 — may 2000 bull
quickly through the upper 18 Mm of theconvection zone. They estimate the speed ofemergence at about 1.3 km/s, which issomewhat higher than predicted by earliertheories. Wave speeds vary in the emergingactive region by about 0.5 km/s. The observeddevelopment of the active region suggests thatthe sunspots are formed as a result of theconcentration of magnetic flux close to thesurface. The Stanford team also presentedtime-distance results on the subsurfacestructure of a large sunspot observed on 20 June 1998 (Fig. 8). The wave-speedperturbations in the spot are much stronger thanin the emerging flux (0.3–1 km/s). At a depth of4 Mm, a 1 km/s wave-speed perturbationcorresponds to a 10% temperature variation(approx. 2800 K) or to a 18 kG magnetic field.Beneath the spot, the perturbation is negativein the subsurface layers and becomes positivefurther down in the interior. Their tomographicimages also revealed sunspot ‘fingers’ – long,narrow structures at a depth of about 4 Mm –
Figure 7. The geometryof the time-distance
analysis of subsurfacemeridional flows (from
Giles et al.)
horizontal distance (Mm)
dep
th (M
m)

75
which connect the sunspot with surroundingpores of the same polarity. Pores with theopposite polarity are not connected to the spot.
MDI has also made the first observations ofseismic waves from a solar flare, opening uppossibilities for studying both the flares and thesolar interior. During the impulsive phase of theX2.6-class flare of 9 July 1996, a high-energyelectron beam caused an explosive evaporationof chromospheric plasma at supersonicvelocities. The upward motion was balanced bya downward recoil in the lower chromosphere,which excited propagating waves in the solarinterior. On the surface, the outgoing circularflare waves resembled ripples from a pebblethrown into a pond (Fig. 9). The seismic wavepropagated at least 120 000 km from the flare’sepicentre, with an average speed of about 50 km/s on the solar surface.
Transition-region dynamicsExplosive events and ‘blinkers’Several types of transient events have beendetected in the quiet Sun. High-velocity eventsin the solar transition region, also called‘explosive events’, were first discovered in theearly eighties based on ultraviolet observationswith the High-Resolution Telescope-Spectrometer(HRTS) rocket payload. They have largevelocity dispersions, approximately ±100 km/s,i.e. velocities are directed both towards andaway from the observer causing a strongbroadening of the spectral lines observed.
Explosive events have been studied extensivelyby a number of authors using SUMER data,and several results support the magneticreconnection origin of these features. Innes etal. have reported explosive events that showspatially separated blue- and red-shifted jetsand some that show transverse motion of blueand red shifts, as predicted if reconnection was the source (Fig. 10). Comparisons withmagnetograms from MDI and those obtainedat ground-based solar observatories have alsoprovided evidence that transition-region explosiveevents are a manifestation of magneticreconnection occurring in the quiet Sun.
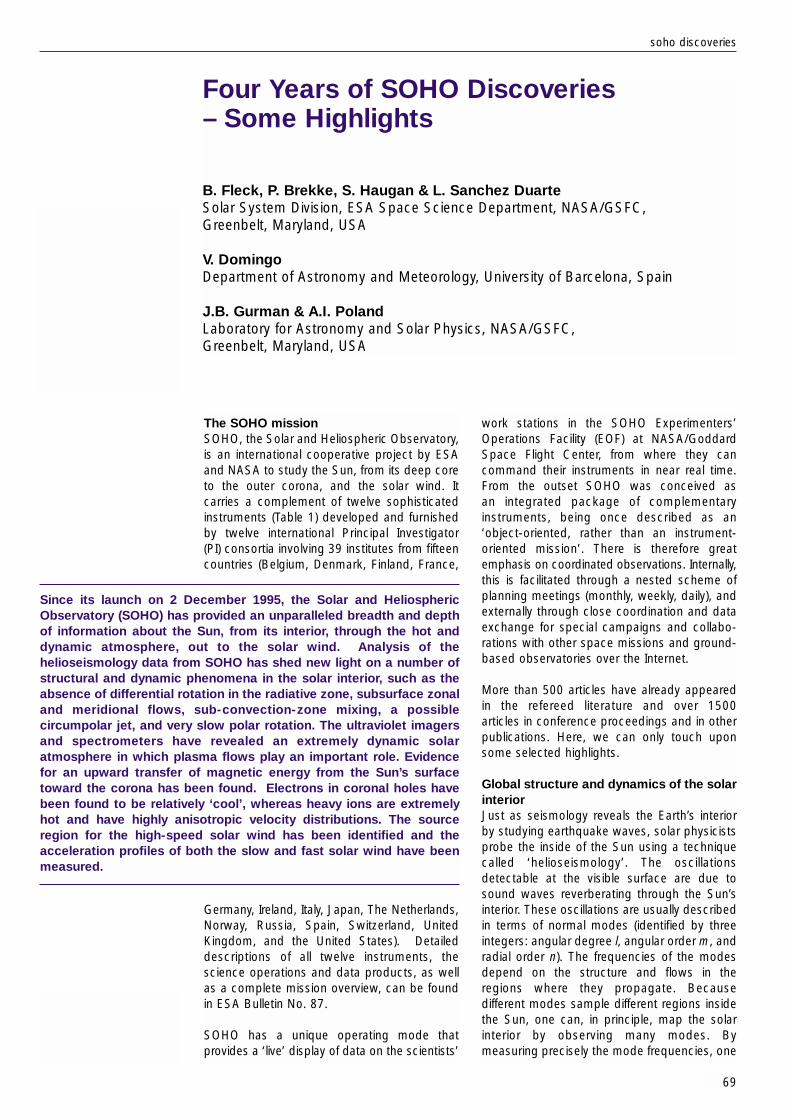
Harrison et al. have presented a comprehensivestudy of EUV flashes, also known as ‘blinkers’,
soho discoveries
Figure 8. The subsurface sound speedperturbations in a sunspot region observed on20 June 1998 by MDI. The horizontal size ofthe box is 13 deg (158 Mm), the depth is 24 Mm. The horizontal cut in panels (a) and (b)reaches down to a depth of 21.6 Mm, while inpanel (c) it is 4.8 Mm deep. Positive variationsare shown in red, negative variations in blue.Scaling: ±1 km/s (from Kosovichev et al.)

76
which were identified in the quiet Sun network asintensity enhancements of order 10–40% usingCDS (Fig. 11). They have analysed 97 blinkerevents and identified blinker spectral, temporaland spatial characteristics, their distribution,frequency and general properties, across abroad range of temperatures, from 20 000 to 1 200 000 K. The blinkers are most pronouncedin the transition region lines O III, O IV and O V,with modest or no detectable signature athigher and lower temperatures. A typical blinkerlasts about 1000 s, but due to a long tail oflonger duration events the average duration is2400 s. Comparisons with plasma coolingtimes led to the conclusion that there must becontinuous energy input throughout the blinkerevent. There are about 3000 blinker events inprogress at any given time. Remarkably, lineratios from O III, O IV and O V show nosignificant change throughout the blinker event,suggesting that the intensity increase is not atemperature effect, but is predominantlycaused by increases in density or filling factor.The thermal-energy content of an averageblinker is estimated as 2 x 1025 erg.
While the explosive events appear as extremelybroad line profiles with Doppler shifts of
r bulletin 102 — may 2000 bull
Figure 10. Bi-directionalplasma jets observed bySUMER in Si IV 1393 Å inJune 1996 and aschematic of the plasmaflow (from Innes et al.)
Figure 9. Seismic waves(‘sun quake’) produced by
a solar flare on 9 July1996 (from Kosovichev &
Zharkova)
y, M
my,
Mm
x, Mm x, Mm
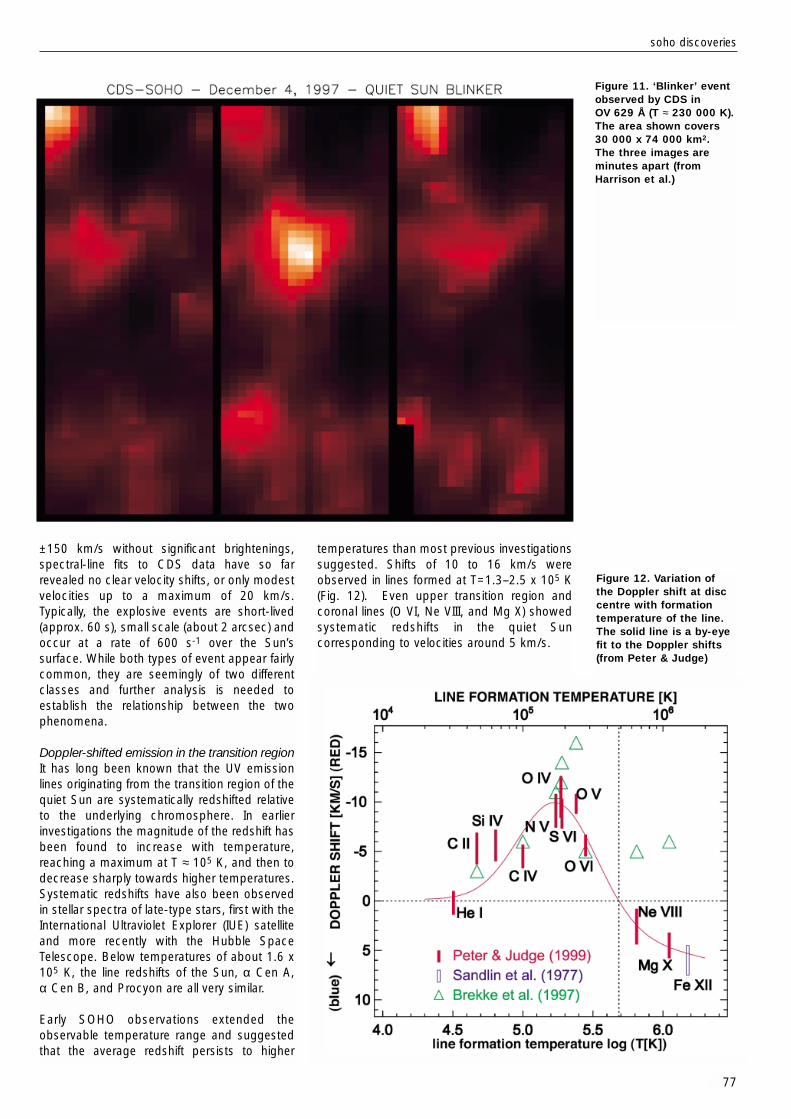
Figure 11. ‘Blinker’ eventobserved by CDS in OV 629 Å (T ≈ 230 000 K).The area shown covers30 000 x 74 000 km2. The three images areminutes apart (fromHarrison et al.)
temperatures than most previous investigationssuggested. Shifts of 10 to 16 km/s wereobserved in lines formed at T=1.3–2.5 x 10⁵ K(Fig. 12). Even upper transition region andcoronal lines (O VI, Ne VIII, and Mg X) showedsystematic redshifts in the quiet Suncorresponding to velocities around 5 km/s.
±150 km/s without significant brightenings,spectral-line fits to CDS data have so farrevealed no clear velocity shifts, or only modestvelocities up to a maximum of 20 km/s.Typically, the explosive events are short-lived(approx. 60 s), small scale (about 2 arcsec) andoccur at a rate of 600 s-1 over the Sun’ssurface. While both types of event appear fairlycommon, they are seemingly of two differentclasses and further analysis is needed toestablish the relationship between the twophenomena.
Doppler-shifted emission in the transition regionIt has long been known that the UV emissionlines originating from the transition region of thequiet Sun are systematically redshifted relativeto the underlying chromosphere. In earlierinvestigations the magnitude of the redshift hasbeen found to increase with temperature,reaching a maximum at T ≈ 105 K, and then todecrease sharply towards higher temperatures.Systematic redshifts have also been observedin stellar spectra of late-type stars, first with theInternational Ultraviolet Explorer (IUE) satelliteand more recently with the Hubble SpaceTelescope. Below temperatures of about 1.6 x10⁵ K, the line redshifts of the Sun, α Cen A, α Cen B, and Procyon are all very similar.
Early SOHO observations extended theobservable temperature range and suggestedthat the average redshift persists to higher
soho discoveries
77
Figure 12. Variation ofthe Doppler shift at disccentre with formationtemperature of the line.The solid line is a by-eyefit to the Doppler shifts(from Peter & Judge)

Figure 13. CoronalDiagnostic Spectrometer
(CDS) raster imagesshowing the intensity and
velocity distribution oftransition-region plasmain AR8737 on the south-
west limb in October1999. Six emission lines
were observedsimultaneously, of which
one is shown here (O V 629 Å, formed at
about 230 000 K). Dopplershifts corresponding to a
velocity greater than ± 40 km/s (144 000 km/h)
are fully red/blue.Contours outline areas
with velocities exceeding± 50 km/s (180 000 km/h)
(courtesy of T. Fredvik &O. Kjeldseth-Moe)
More recent investigations using SUMERobservations have revisited this problem,addressing possible errors in the restwavelengths of lines from highly ionised atoms(e.g. Ne VIII, Na IX, Mg X, Fe XII). Using full-discscans from SUMER and assuming that all massor wave-motion effects on the limb cancel outstatistically, new rest wavelengths for Ne VIIIand Mg X have been established, leading toblueshifts of 2.5 km/s and 4.5 km/s, respectively,at disc centre.
These recent results suggest that the uppertransition region and lower corona appear blue-shifted in the quiet Sun, with a steeptransition from red- to blue-shifts above 5 x 10⁵ K.This transition is significant because it hasmajor implications for the transition region andsolar-wind modelling, as well as for ourunderstanding of the structure of the solaratmosphere.
The networkEarly models of the solar atmosphere assumedthat the temperature structure of the upperatmosphere was continuous, with a thintransition region connecting the chromospherewith the corona. This depiction now appearstoo simplistic. Rather, it seems that the solaratmosphere consists of a hierarchy ofisothermal, highly dynamic loop structures. Of particular interest in this context is thenetwork, which is believed to be the backboneof the entire solar atmosphere and the basicchannel of the energy responsible for heatingthe corona and accelerating the solar wind.
Patsourakos et al. have used CDS data tostudy the width variation of the network withtemperature. They found that the networkboundaries have an almost constant width upto about 250 000 K (where the network contrastis also strongest) and then fan out rapidly atcoronal temperatures. The network in thelower transition region is about 10 arcsecacross and spreads to about 16 arcsec at 1 MK. These results are in very good agreementwith Gabriel’s transition region-corona model,dating from1976.
Active-region dynamicsEIT, SUMER and CDS observations haveclearly demonstrated that the solar transitionregion and corona are extremely dynamic andtime variable in nature. Large line shifts of up to60 km/s were observed with CDS in individualactive region loops (Fig. 13). High Dopplershifts are common in active-region loops andstrong shifts are present in parts of loops fortemperatures up to 0.5 MK. Regions with bothred and blue shifts are seen. While typicalvalues correspond to velocities of ± 50-100 km/s,shifts approaching 200 km/s have beendetected. At temperatures T > 1 MK, i.e. in Mg IX 368 Å or Fe XVI 360 Å, only small shiftsare seen. The high Doppler shifts thereforeseem to be restricted to the transition region.
Brynildsen et al. studied 3-min transition-regionoscillations above sunspots by analysing timeseries recorded in O V 629 Å, N V 1238 Å and1242 Å, and the chromospheric Si II 1260 Åline in NOAA 8378. The 3-min oscillations that
r bulletin 102 — may 2000 bull
78

Figure 15. Line profile ofO VI from UVCSobservations in a polarcoronal hole (lower panel)compared to discobservations fromSUMER. The broad O VIline widths indicatevelocities of up to 500km/s, equivalent to athermal-motion kinetictemperature of 200million K. Narrow peaksin the lower panel are dueto stray light (from Kohlet al.)
One of the most surprising results from SOHOhas been the extremely broad coronal profilesof highliy ionised elements such as oxygen andmagnesium (Fig. 15). Kohl et al. and Cranmeret al. have presented a self-consistent empiricalmodel of a polar coronal hole near solarminimum, based on H I and O VI UVCS spectro-scopic observations. Their model describes the
they observed above the sunspot umbra show:(a) larger peak line intensity amplitudes thanreported previously, (b) clear signs of non-linearities, (c) significant oscillations in linewidth, and (d) maxima in peak line intensity andmaxima in velocity directed towards theobserver that are nearly in phase. They alsoperformed a simple test and calculated thevelocity oscillations from the intensity oscillations(which, to a first approximation for optically thinlines, is proportional to ρ2) using a standardtext-book equation for simple nonlinearacoustic waves. The agreement with theobserved velocity is astounding, providingconvincing evidence that the oscillations thatthey observed are upward-propagating,nonlinear acoustic waves.
CoronaCoronal-hole temperature and densitymeasurementsUsing the two SOHO spectrometers CDS andSUMER, David et al. have measured theelectron temperature as a function of heightabove the limb in a polar coronal hole (Fig. 14).Temperatures of around 0.8 MK were foundclose to the limb, rising to a maximum of lessthan 1 MK at 1.15 R, then falling to around 0.4 MK at 1.3 R. In equatorial streamers, onthe other hand, the temperature was found torise constantly with increasing distance, fromabout 1 MK close to the limb to over 3 MK at1.3 R. With these low temperatures, theclassical Parker mechanism for solar-windacceleration cannot alone explain the high windvelocities, which must therefore be due to thedirect transfer of momentum from MHD wavesto the ambient plasma.
soho discoveries
79
Figure 14. Temperaturegradient measurement inthe quiet corona(equatorial west limb) andthe north polar coronalhole (from David et al.)

radial and latitudinal distributions of the densityof electrons, H I and O VI, as well as theoutflow velocity and unresolved anisotropicmost probable velocities for H I and O VI.
Polar plumesWilhelm et al. have determined the electrontemperatures, densities and ion velocities inplumes and interplume regions of polar coronalholes from SUMER spectroscopic observationsof the Mg IX 706/750 Å and Si VIII 1440/1445Å line pairs. They find the electron temperatureTe to be less than 800 000 K in a plume in therange from r = 1.03 to 1.60 R, decreasing withheight to about 330 000 K. In the interplumelanes, the electron temperature is also low, butstays between 750 000 and 880 000 K in thesame height interval. Doppler widths of O VIlines are narrower in the plumes (v1/e ≈ 43 km/s)than in the interplumes (v1/e ≈ 55 km/s).Thermal and turbulent ion speeds of Si VIIIreach values up to 80 km/s, corresponding to akinetic ion temperature of 107 K.
These results clearly confirm that the ions in acoronal hole are extremely hot and theelectrons much cooler. They also clearlydemonstrate that local thermal equilibriumdoes not exist in polar coronal holes, and thatthe assumption of Collisional IonisationEquilibrium (CIE) and the common notion thatTe ≈ Tion can no longer be made in models ofcoronal holes.
It seems difficult to reconcile these low electrontemperatures measured in coronal holes withthe freezing-in temperatures deduced fromionic charge composition data. The freezing-inconcept, however, assumes that the adjacentcharge states are in ionisation equilibrium. Acritical reevaluation of this concept appears tobe justified.
Previously, plumes were considered to be thesource regions for the high-speed solar wind.Given the narrower line widths in plumes andthe absence of any significant motions there,Wilhelm et al. suggested that the sourceregions of the fast solar wind are the interplumelanes rather than the plumes, since conditionsthere are far more suitable for a strongacceleration than those prevailing in plumes.
Heating processesA promising theoretical explanation for the hightemperatures of heavy ions and their strongvelocity anisotropies is the efficient dissipationof high-frequency waves that are resonant withion-cyclotron Larmor motions about thecoronal magnetic-field lines. This effect hasbeen studied in detail by Cranmer et al., whohave constructed theoretical models of the
non-equilibrium plasma state of the polar solarcorona using empirical ion velocity distributionsderived from UVCS and SUMER. They foundthat the dissipation of relatively small-amplitudehigh-frequency Alfvén waves (10–10 000 Hz)via gyro resonance with ion cyclotron Larmormotions can explain many of the kineticproperties of the plasma, in particular thestrong anisotropies, the greater than mass-proportional temperatures, and the fasteroutflow of heavy ions in the high-speed solarwind. Because different ions have differentresonant frequencies, they receive differentamounts of heating and acceleration as afunction of radius, which is exactly what isrequired to understand the different features of the H I and O VI velocity distributions.Furthermore, because the ion-cyclotron wavedissipation is rapid, the extended heatingseems to demand a constantly replenishedpopulation of waves over several solar radii.This suggests that the waves are generatedgradually throughout the wind, rather thanpropagating up from the base of the corona.
In addition to measuring velocity and intensityoscillation, MDI also measures the line-of-sightcomponent of the photospheric magnetic field.In long, uninterrupted MDI magnetogramseries, a continuous flux emergence of smallbipolar regions has been observed. Smallmagnetic bipolar flux elements are continuallyemerging at seemingly random locations.These elements are rapidly swept by granularand mesogranular flows to supergranular cellboundaries where they cancel and replaceexisting flux. The rate of flux generation of this‘magnetic carpet’ (Fig. 16) is such that all of theflux is replaced in about 40 hours, withprofound implications for coronal heating onthe top side and questions of local fieldgeneration on the lower side of the photo-sphere. Estimates of the energy supplied to thecorona by ‘braiding’ of large-scale coronalfields through small-scale flux replacementindicate that it is much larger than thatassociated with granular braiding.
Coronal Mass EjectionsLASCO has been collecting an extensivedatabase for establishing the best statisticsever on coronal mass ejections (CMEs; Fig. 17)and their geomagnetic effects. St.Cyr et al.have reported the properties of all 841 CMEsobserved by the LASCO C2 and C3 white-lightcoronagraphs from January 1996 through theSOHO mission interruption in June 1998 andcompared those properties with previousobservations by other instruments. The CMErate for solar-minimum conditions was slightlyhigher than had been reported for previoussolar cycles, but both the rate and the
r bulletin 102 — may 2000 bull
80

81
Figure 16. Magneticcarpet. Model of magneticfield lines based on MDImagnetograms,superimposed on animage of the solar coronain Fe XII 195 Å from EIT(courtesy of SOHO/MDIConsortium)
Figure 17. Progress of aCoronal Mass Ejection(CME) observed over an 8 h period on 5-6 August1999 by LASCO C3. Thedark disc blocks the Sunso that the LASCOinstrument can observethe structures of thecorona in visible light.The white circlerepresents the size andposition of the Sun(courtesy of SOHO/LASCOConsortium)
distribution of apparent locations of CMEsvaried during this period as expected. While thepointing stability provided by the SOHOplatform in its L-1 orbit and the use of CCDdetectors have resulted in superior brightnesssensitivity for LASCO over earlier coronagraphs,they have not detected a significant populationof fainter (i.e. low-mass) CMEs. The generalshape of the distribution of apparent sizes forLASCO CMEs is similar to those of earlierreports, but the average (median) apparent sizeof 72° (vs. 50°) is significantly larger.St.Cyr et al. have also reported on a population
soho discoveries
of CMEs with large apparent sizes, whichappear to have a significant longitudinalcomponent directed along the Sun–Earth line,either toward or away from the Earth. These arethe so-called ‘halo CMEs’ (Fig. 18). Using full-disc EIT images, they found that 40 out of 92 ofthese events might have been directed towardsthe Earth. A comparison of the timing of thoseevents with the Kp geomagnetic storm index inthe days following the CME showed that 15 out of 21 (71%) of the Kp > 6 storms could beaccounted for as SOHO LASCO/EIT front-sidehalo CMEs. Three more Kp storms may have

Figure 18. Massive ‘halo’CME as recorded by
LASCO C2 on 17 February2000. Displayed here is a
so-called ‘runningdifference’ image,
showing the variation inbrightness from one
frame to the next(courtesy of SOHO/LASCO
Consortium)
Figure 19. Sequence ofEIT difference imagesshowing the intensity
(density) enhancementand following rarefactionassociated with a shockwave expanding acrossthe solar disc from the
site of the origin of aCME, recorded on 12 May
1997. A halo CME wasobserved by LASCO.These images were
formed from thedifferences of successive
images in the emissionlines of Fe XII near 195 Å;
this ion is formed attemperatures of about 1.5million degrees. The wavefront travels at speeds of
~ 300 km/s, typical of afast mode Alfvén shock in
the lower solar corona(from Thompson et al.)
been missed during LASCO/EIT datagaps, bringing the possible associationrate to 18 out of 21 (86%).
EIT has discovered large-scale transientwaves in the corona, also called‘Coronal Moreton Waves’ or ‘EITwaves’, propagating outward fromactive regions below CMEs. Theseevents are usually recorded in the Fe XII 195 Å bandpass, during high-cadence (< 20 min) observations. Theirappearance is stunning in that theyusually affect most of the visible solardisc (Fig. 19). They generally propagateat speeds of 200–500 km/s, traversinga solar diameter in less than an hour.Active regions distort the waves locally,bending them towards the lower Alfvénspeed regions. On the basis of speedand propagation characteristics, the EIT waveswere associated with fast-mode shock waves.Another interesting aspect of these coronalMoreton waves is their association with theacceleration and injection of high-energyelectrons and protons, as measured, forexample, by COSTEP and ERNE.
Solar windOrigin and speed profile of the fast windCoronal-hole outflow velocity maps obtainedwith the SUMER instrument in the Ne VIIIemission line at 770 Å show a clear relationshipbetween coronal-hole outflow velocity and thechromospheric network structure (Fig. 20), withthe largest outflow velocities occurring alongnetwork boundaries and at the intersection ofnetwork boundaries. This can be consideredthe first direct spectroscopic determination ofthe source regions of the fast solar wind incoronal holes.
Proton and O VI outflow velocities in coronalholes have been measured by UVCS using theDoppler dimming method. The O VI outflowvelocity was found to be significantly higher
than the proton velocity, with a very steepincrease between 1.5 and 2.5 R, reachingoutflow velocities of 300 km/s at around 2 R(Fig. 21). While the hydrogen outflow velocitiesare still consistent with some conventionaltheoretical models for polar wind acceleration,the higher oxygen flow speeds cannot beexplained by these models. A possibleexplanation is offered by the dissipation of high-frequency Alfvén waves via gyroresonance withion-cyclotron Larmor motions, which can heatand accelerate ions differently depending ontheir charge and mass.
Speed profile of the slow solar windTime-lapse sequences of LASCO white-lightcoronagraph images give the impression of acontinuous outflow of material in the streamerbelt. Density enhancements, or ‘blobs’, formnear the cusps of helmet streamers and appearto be carried outward by the ambient solarwind. Sheeley et al., using data from theLASCO C2 and C3 coronagraphs, have traceda large number of such ‘blobs’ from 2 to over25 solar radii. Assuming that these ‘blobs’ arecarried away by the solar wind like leaves on
r bulletin 102 — may 2000 bull
82

83
Figure 20. Source regions of the fast solar wind. Background: EIT full-Sun imagetaken in the emission line of Fe XII 195 Å, revealing gas at 1.5 million degreesshaped by magnetic fields. Bright regions indicate hot, dense plasma loopswith strong magnetic fields, while dark regions imply an open magnetic fieldgeometry, and are the source of the high-speed solar wind. The ‘zoomed-in’or ‘close-up’ region shows a Doppler velocity map of plasma at about 630 000 K at the base of the corona, as recorded by SUMER in the Ne VIIIemission line at 770 Å. Blue represents blue shifts or outflows and redrepresents red shifts or downflows. The blue regions are inside a coronal hole,or open magnetic field region, where the high-speed solar wind is accelerated.Superposed are the edges of ‘honeycomb-shaped’ patterns of magnetic fieldsat the surface of the Sun (from Hassler et al.)
the river, they have measured the accelerationprofile of the slow solar wind, which typicallydoubles its speed from 150 km/s near 5 R to300 km/s near 25 R. They found a constantacceleration of about 4 ms-2 through most ofthe 30 R field-of-view. The speed profile isconsistent with an iso-thermal solar-windexpansion at a temperature of about 1.1 MKand a sonic point near 5 R.
Solar-wind compositionUsing data from the CELIAS/MTOF sensor, theCELIAS team has made the first in-situdetermination of the isotopic composition ofcalcium and nitrogen in the solar wind. Thesemeasurements are important for studies ofstellar modelling and Solar System formation,because the present-day solar Ca isotopicabundances are unchanged from their originalisotopic composition in the solar nebula. Theisotopic ratios 40Ca/42Ca and 40Ca/44Cameasured in the solar wind were found to beconsistent with terrestrial values. The isotoperatio 14N/15N was found to be 200 ± 60,indicating a depletion of 15N in the terrestrialatmosphere compared to solar matter.
Ion freeze-in temperatures were measured byCELIAS/CTOF with a time resolution of 5 min.These measurements indicate that some of thefilamentary structures of the inner coronaobserved in Hα survive in the inter-planetarymedium as far as 1 AU.
The unprecedented time resolution of theCELIAS/CTOF data has allowed a fine-scaledstudy of the elemental Fe/O ratio as a functionof the solar-wind bulk speed. Since Fe is a lowFirst Ionisation Potential (FIP) element and O ahigh-FIP element, their relative abundance isdiagnostic for the so-called ‘FIP fractionationprocess’. The Fe/O abundance shows acontinuos decrease with increasing solar-windspeed by a factor of two between 350 km/sand 500 km/s, in correspondence with thewell-established FIP effect.
CometsSOHO is not only providing new measurementsabout the Sun. On 4 February 2000, SOHOdiscovered its 100th comet, 93 of which belongto the Sun-grazing Kreutz family (Fig. 22). Aparticular feature is the presence of a dust tailfor only a few Sun grazers. Analysis of the lightcurves is used to investigate the properties ofthe nuclei (size, fragmentation, destruction) andthe dust production rates.
Thanks to rapid communication from theLASCO group and the near-real-time observingcapabilities of the SOHO instruments, UVCScould make spectroscopy measurements of
soho discoveries
Figure 21. Empirical outflow velocity of O VI and H I in coronal holes over thepoles (from Kohl et al.)

84
Figure 22. LASCO sees two comets plunge into the Sun. In a rare celestialspectacle, two comets were observed by the LASCO coronagraph plunginginto the Sun’s atmosphere in close succession, on 1 and 2 June 1998.Science instruments on SOHO have discovered more than 100 comets,including many so-called ‘Sun grazers’, but none in such close succession(courtesy of SOHO/LASCO Consortium)
several comets on the day of their discovery.UVCS measurements of comet C/1996Y1obtained at 6.8 R confirmed the predictions ofmodels of the cometary bow shock driven bymass-loading as cometary molecules areionised and swept up in the solar wind. Fromthe width and shift of the line profiles, the solar-wind speed at 6.8 R could be determined (640km/s). The outgassing rate of the comet wasestimated at 20 kg/s, implying an activenucleus area of only about 6.7 m in diameterand a mass of about 120 000 kg.
Comets are surrounded by large clouds ofhydrogen, produced by the break-up of watermolecules evaporating from the comets’ ice.The solar-wind mapper SWAN sees these largeclouds of hydrogen glowing in the light of the H I Lyman-α line. The huge cloud of hydrogensurrounding Comet Hale-Bopp (Fig. 23) duringits perihelion passage in the spring of 1997 wasmore than 100 million kilometres wide,diminishing in intensity outwards (contour lines).It far exceeded the great comet’s visible tail(inset photograph). Although generated by acomet nucleus perhaps only 40 km in diameter,the hydrogen cloud was 70 times wider thanthe Sun itself (yellow dot to scale) and ten timeswider than the hydrogen cloud of CometHyakutake observed by SWAN in 1996. Thewater evaporation rate of Hale-Bopp wasmeasured by SWAN at more than 200 milliontons per day. Comet Wirtanen, the target forESA’s Rosetta mission (2003), pumped outwater vapour at a rate of 20 000 tons a dayduring its most recent periodic visit to the Sun,according to the SWAN data. SWAN has alsoseen something else extraordinary – thebiggest shadow ever observed in our SolarSystem, namely that of a comet projected onthe sky behind it (Fig. 24).
HeliosphereThe Sun is moving through the Local InterstellarCloud (LIC) at about 26 km/s. The solar windbuilds a cavity, the heliosphere, within theionised gas component of the LIC. The neutralatoms (e.g. He) of the LIC, on the other hand,enter the heliosphere unaffected. The He flowproperties are now well-constrained from aseries of measurements (vHe = 25.5 ± 0.5 km/s,THe = 6000 ± 1000 K). These values are inagreement with the LIC velocity andtemperature deduced from stellar spectro-scopy. Hydrogen, on the other hand, isexpected to be affected by coupling with thedecelerated plasma via charge-exchange.Neutral hydrogen heating and decelerationtherefore provides a measurement of thiscoupling and, in turn, of the plasma density inthe LIC, which is responsible for most of theheliosphere’s confinement.
r bulletin 102 — may 2000 bull
Figure 23. SWAN H I Ly-α image of the huge cloud of hydrogen surroundingcomet Hale-Bopp when it neared the Sun in the spring of 1997. The smallyellow dot shows the Sun to scale (from Combi et al.)

Figure 24. SWANobservations of cometHale-Bopp’s shadow(courtesy of SOHO/SWANConsortium)
value of the remarkably stable cut-off frequencyobserved by Voyager.
Of particular interest for future studies might bethe temperature minimum measured betweenthe upwind and downwind directions. Classicalmodels predict a monotonic increase in theline-of-sight temperature from upwind todownwind. The authors interpret this behaviouras first evidence of the existence of two distinctpopulations at different velocities, as predictedby some heliosphere/interstellar-gas interfacemodels. If confirmed, this should provide agood diagnostic of the interface.
Total solar irradiance variationsThe VIRGO instrument on SOHO extends therecord of Total Solar Irradiance (TSI)measurements into cycle 23. In Figure 25,measurements from six independent space-based radiometers since 1978 (top) have beencombined to produce the composite TSI overtwo decades (bottom). They show that theSun’s output fluctuates during each 11-yearsunspot cycle, changing by about 0.1%between maxima (1980 and 1990) and minima(1987 and 1997) in solar activity. Temporarydips of up to 0.3% and a few days duration arethe result of large sunspots passing over the
The SWAN team, analysing data fromabsorption cells, found hydrogen temperaturesT0 of 11 500 ± 1500 K, i.e. significantly abovethe temperature of the interstellar He flow (6000± 1000 K), requiring strong heating of morethan 3500 K at the heliosphere interface. Partof this excess temperature is probably due toradiative-transfer effects.
The apparent interstellar hydrogen velocity inthe up- and downwind direction was measuredto be -25.4 ±1 km/s and +21.6 ±1.3 km/s,respectively, with the most precise determination(since model-independent) of the H flowdirection. The new estimate of the upwinddirection from SWAN measurements is 252.3 ± 0.73 deg and 8.7 ± 0.90 deg in eclipticcoordinates, which is off by about 3–4 deg fromthe He flow direction. The SWAN teamspeculates that this might be a sign of anasymmetry in the heliospheric interface due tothe ambient interstellar magnetic field.
Comparing the above hydrogen temperatureand velocity measurements by SWAN withheliospheric models leads to an estimate of theinterstellar plasma density of ne ≈ 0.04 cm-3. Itis interesting to note that the plasma frequencyfor ne ≈ 0.04 cm-3 is 1.8 kHz, i.e. exactly the
soho discoveries
85

Figure 25. Total solarirradiance variations from
1978 to 1999. The dataare from the Hickey-
Frieden (HF) radiometer ofthe Earth Radiation
Budget (ERB) experimenton Nimbus-7 (1978-1992),
the two Active CavityRadiometer Irradiance
Monitors (ACRIM I and II)aboard the Solar
Maximum Mission (1980-1989) and the Upper
Atmosphere ResearchSatellite (1991-),
respectively, and theVIRGO radiometers on
SOHO (1996-). Also shownare the data from the
radiometer on the ERB(1984-), and SOVA2 as
part of the SolarVariability Experiment onthe European RetrievableCarrier (1992-1993) (from
Quinn and Fröhlich)
visible hemisphere. The larger number ofsunspots near the peak in the 11-year cycle isaccompanied by a general rise in magneticactivity that creates an increase in the luminousoutput which exceeds the cooling effects ofsunspots. Offsets between the various datasets are the direct result of uncertainties in theabsolute radiometer scale of the radiometers(±0.3%). Despite these biases, each data setclearly shows varying radiation levels that trackthe overall 11-year solar activity cycle.
ConclusionsSOHO set out to tackle three broad topics insolar and heliospheric physics: the structureand dynamics of the solar interior, the heatingand dynamics of the solar corona, and theacceleration and composition of the solar wind.In all three areas, its observations have allowedgreat strides to be made in our understandingof the diverse physical processes at work in our Sun. This has been made possible by the comprehensive suite of state-of-the-artinstruments mounted on the superb and stableSOHO spacecraft, operating from the uniquevantage point of the L1 halo orbit.
In such complex areas of research as solarphysics, progress is not made by just a fewpeople acting in a vacuum. The scientificachievements of the SOHO mission are theresults of a concerted, multi-disciplinary effortby a large international community of solarscientists, involving sound investments in
space hardware, coupled with a vigorous andwell-coordinated scientific operation andinterpretation effort. The interplay betweentheory and observations has already providedmany new insights and will continue to do sofor many years.
With the wealth of SOHO data already in thearchive (and many more data yet to come,hopefully well beyond the next solar maximum),we should be able to unravel even more of themysteries of our closest star.
Acknowledgements The great success of the SOHO mission is atribute to the many people who designed andbuilt this exquisite spacecraft and theseexcellent instruments, and to the many peoplewho diligently work behind the scenes to keepit up and running. Special thanks go to: HaroldW. Benefield and his AlliedSignal FlightOperations Team; Helmut Schweitzer andJean-Philippe Olive from the ESA/MMS TechnicalSupport Team; the Science Operations Co-ordinators Laura Roberts, Joan Hollis and PietMartens; Craig Roberts, John Rowe and theircolleagues from Flight Dynamics, the colleaguesfrom DSN, and, last but not least, to FrancisVandenbussche and his recovery team formaking a miracle come true! r
r bulletin 102 — may 2000 bull
86