Embed Size (px)
Citation preview
International Quinoa Conference 2016:Quinoa for Future Food and Nutrition Security in Marginal Environments
Dubai, 6-8 December 2016www.quinoaconference.com
Quínoa Research and Development in the AndeanCountries
By: L Gomez-Pando, W Rojas and J OchoaAffiliation
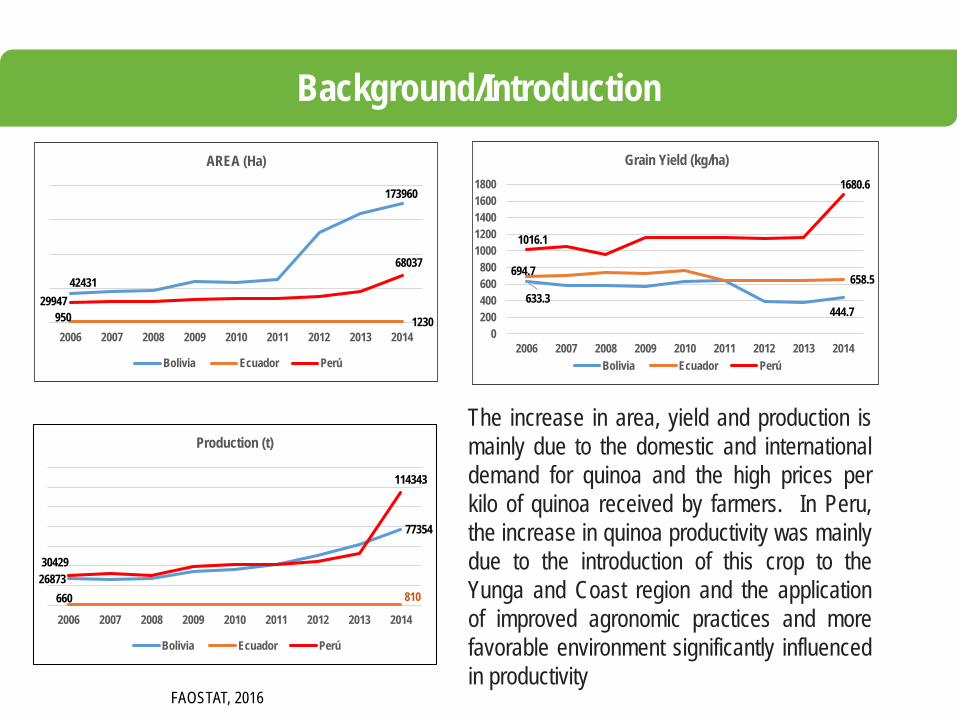
Background/Introduction
42431
173960
950 123029947
68037
2006 2007 2008 2009 2010 2011 2012 2013 2014
AREA (Ha)
Bolivia Ecuador Perú
633.3444.7
694.7658.5
1016.1
1680.6
0200400600800
10001200140016001800
2006 2007 2008 2009 2010 2011 2012 2013 2014
Grain Yield (kg/ha)
Bolivia Ecuador Perú
26873
77354
660 810
30429
114343
2006 2007 2008 2009 2010 2011 2012 2013 2014
Production (t)
Bolivia Ecuador Perú
The increase in area, yield and production ismainly due to the domestic and internationaldemand for quinoa and the high prices perkilo of quinoa received by farmers. In Peru,the increase in quinoa productivity was mainlydue to the introduction of this crop to theYunga and Coast region and the applicationof improved agronomic practices and morefavorable environment significantly influencedin productivity
FAOSTAT, 2016
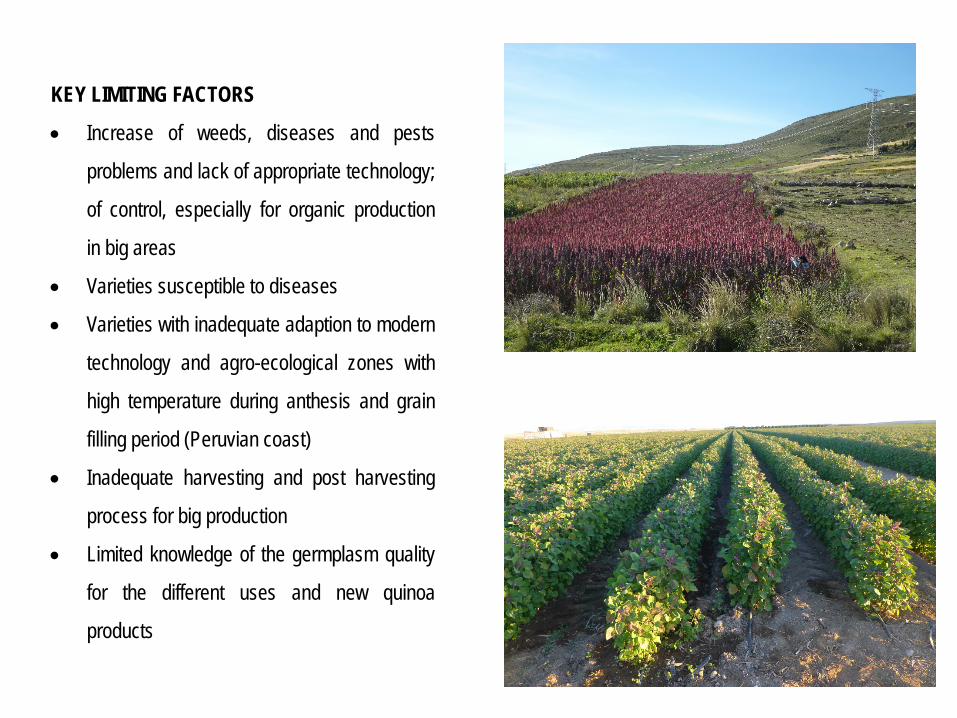
KEY LIMITING FACTORS
• Increase of weeds, diseases and pests
problems and lack of appropriate technology;
of control, especially for organic production
in big areas
• Varieties susceptible to diseases
• Varieties with inadequate adaption to modern
technology and agro-ecological zones with
high temperature during anthesis and grain
filling period (Peruvian coast)
• Inadequate harvesting and post harvesting
process for big production
• Limited knowledge of the germplasm quality
for the different uses and new quinoa
products
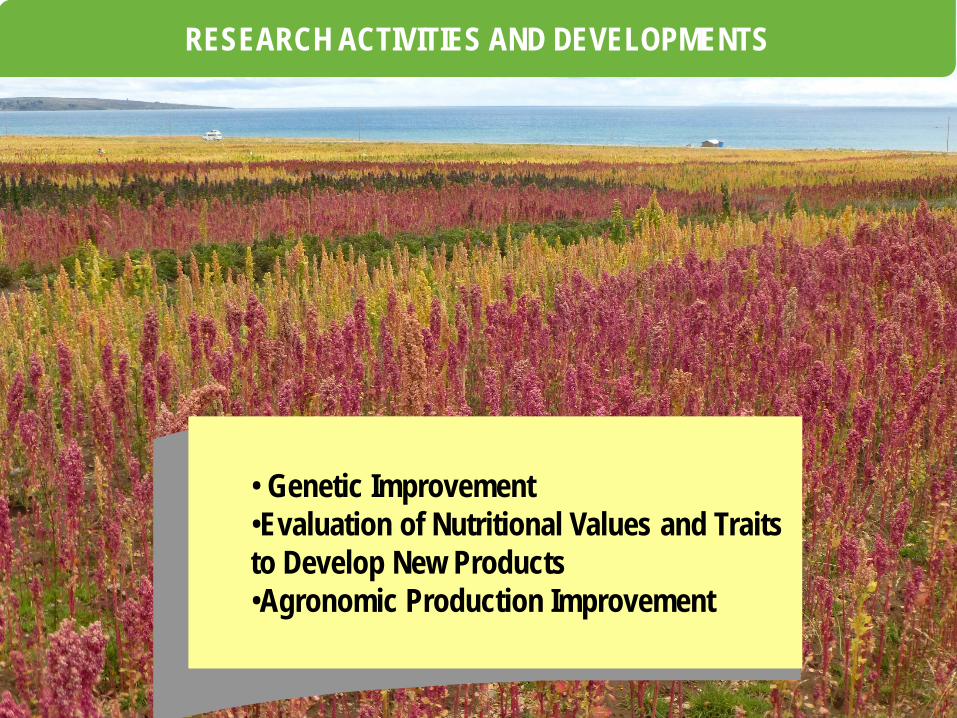
RESEARCH ACTIVITIES AND DEVELOPMENTS
• Genetic Improvement•Evaluation of Nutritional Values and Traits to Develop New Products•Agronomic Production Improvement
GENETIC IMPROVEMENT
Results
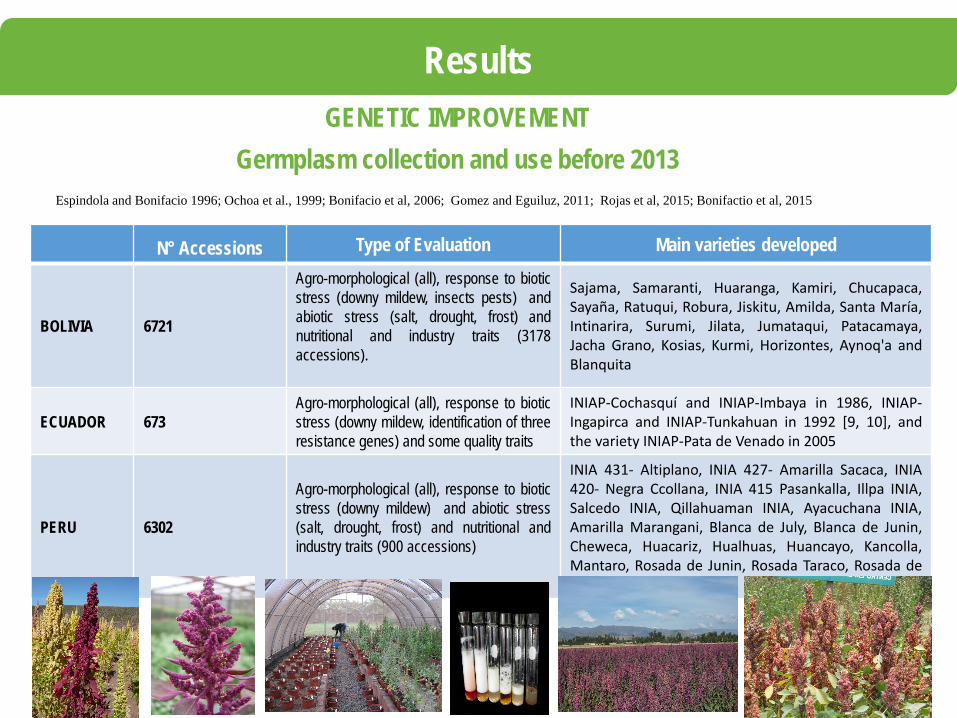
Germplasm collection and use before 2013
N° Accessions Type of Evaluation Main varieties developed
BOLIVIA 6721
Agro-morphological (all), response to bioticstress (downy mildew, insects pests) andabiotic stress (salt, drought, frost) andnutritional and industry traits (3178accessions).
Sajama, Samaranti, Huaranga, Kamiri, Chucapaca,Sayaña, Ratuqui, Robura, Jiskitu, Amilda, Santa María,Intinarira, Surumi, Jilata, Jumataqui, Patacamaya,Jacha Grano, Kosias, Kurmi, Horizontes, Aynoq'a andBlanquita
ECUADOR 673Agro-morphological (all), response to bioticstress (downy mildew, identification of threeresistance genes) and some quality traits
INIAP-Cochasquí and INIAP-Imbaya in 1986, INIAP-Ingapirca and INIAP-Tunkahuan in 1992 [9, 10], andthe variety INIAP-Pata de Venado in 2005
PERU 6302
Agro-morphological (all), response to bioticstress (downy mildew) and abiotic stress(salt, drought, frost) and nutritional andindustry traits (900 accessions)
INIA 431- Altiplano, INIA 427- Amarilla Sacaca, INIA420- Negra Ccollana, INIA 415 Pasankalla, Illpa INIA,Salcedo INIA, Qillahuaman INIA, Ayacuchana INIA,Amarilla Marangani, Blanca de July, Blanca de Junin,Cheweca, Huacariz, Hualhuas, Huancayo, Kancolla,Mantaro, Rosada de Junin, Rosada Taraco, Rosada deYanamango
Espindola and Bonifacio 1996; Ochoa et al., 1999; Bonifacio et al, 2006; Gomez and Eguiluz, 2011; Rojas et al, 2015; Bonifactio et al, 2015
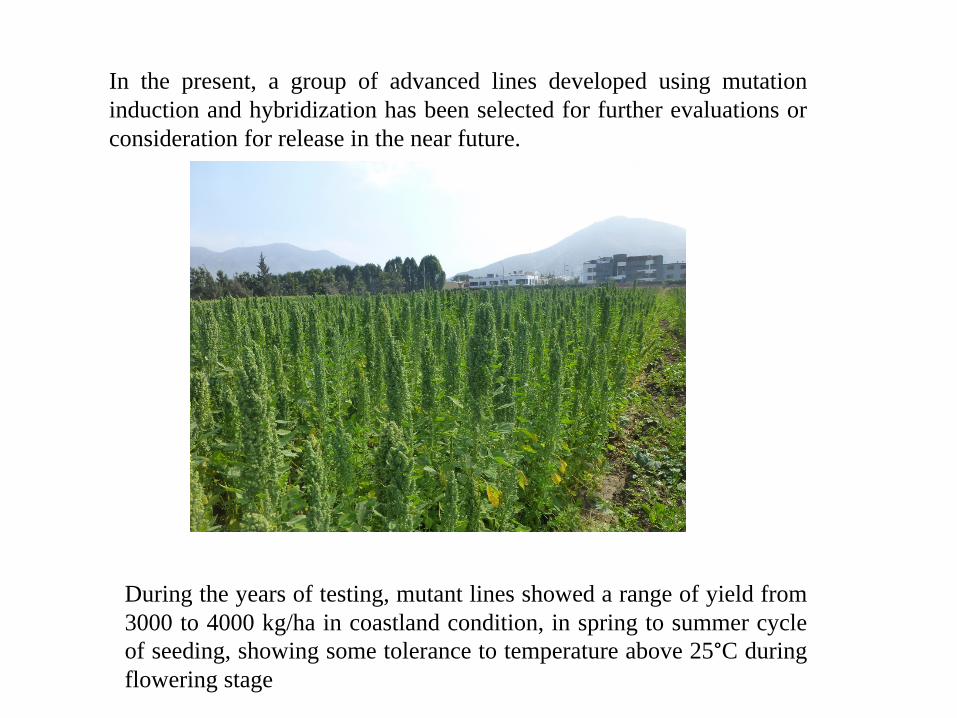
In the present, a group of advanced lines developed using mutationinduction and hybridization has been selected for further evaluations orconsideration for release in the near future.
During the years of testing, mutant lines showed a range of yield from3000 to 4000 kg/ha in coastland condition, in spring to summer cycleof seeding, showing some tolerance to temperature above 25°C duringflowering stage
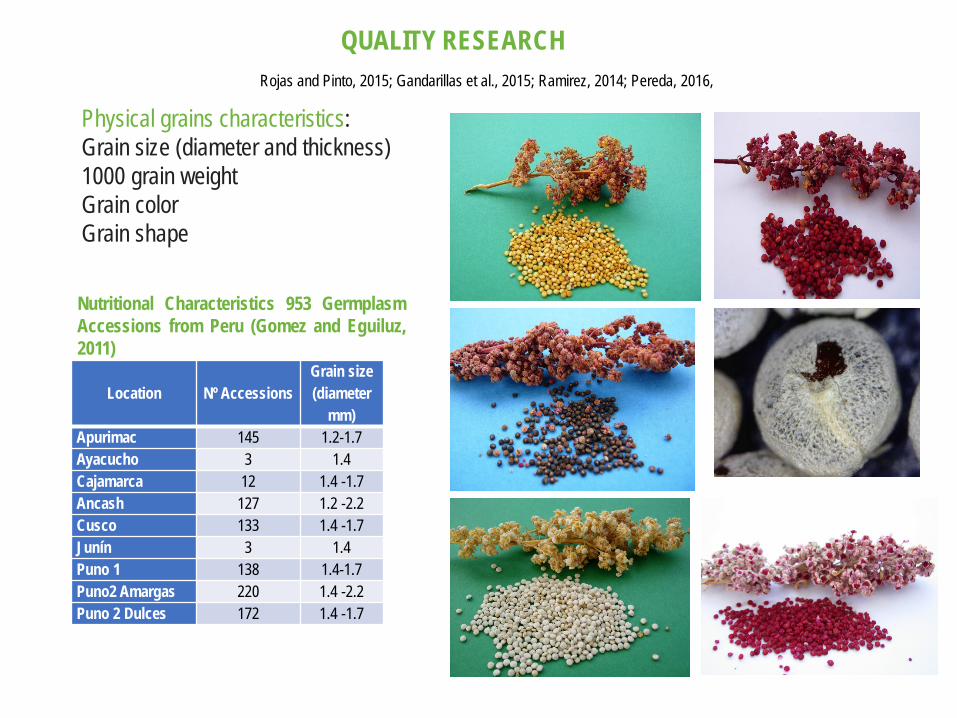
QUALITY RESEARCHRojas and Pinto, 2015; Gandarillas et al., 2015; Ramirez, 2014; Pereda, 2016,
Physical grains characteristics: Grain size (diameter and thickness)1000 grain weightGrain color Grain shape
Location Nº AccessionsGrain size (diameter
mm)Apurimac 145 1.2-1.7Ayacucho 3 1.4Cajamarca 12 1.4 -1.7Ancash 127 1.2 -2.2Cusco 133 1.4 -1.7Junín 3 1.4Puno 1 138 1.4-1.7Puno2 Amargas 220 1.4 -2.2Puno 2 Dulces 172 1.4 -1.7
Nutritional Characteristics 953 GermplasmAccessions from Peru (Gomez and Eguiluz,2011)
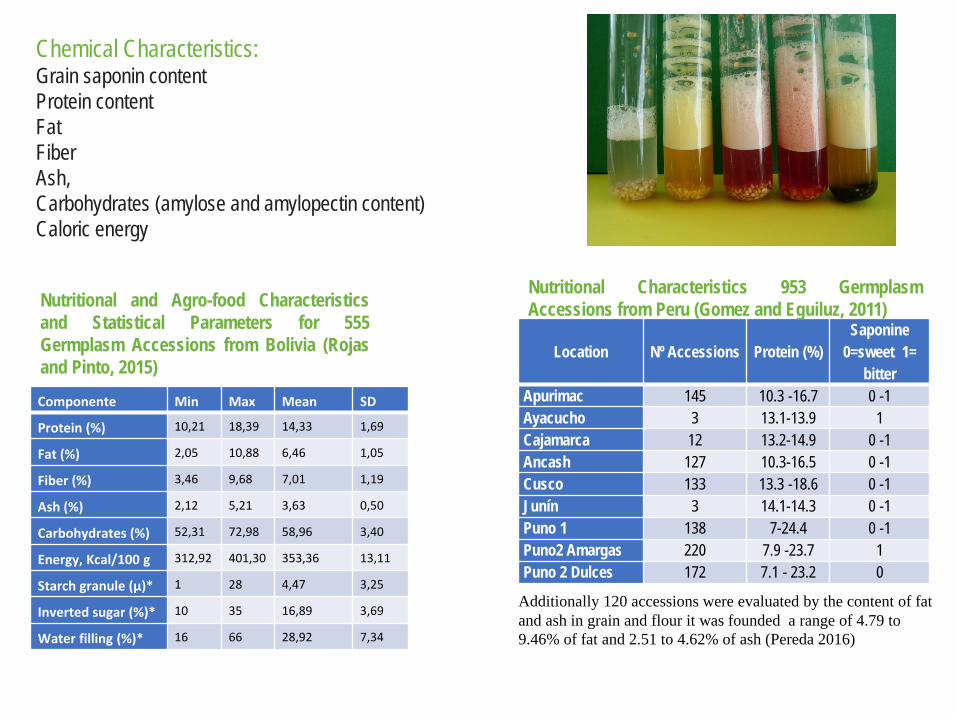
Chemical Characteristics:Grain saponin contentProtein contentFatFiberAsh, Carbohydrates (amylose and amylopectin content) Caloric energy
Componente Min Max Mean SD
Protein (%) 10,21 18,39 14,33 1,69
Fat (%) 2,05 10,88 6,46 1,05
Fiber (%) 3,46 9,68 7,01 1,19
Ash (%) 2,12 5,21 3,63 0,50
Carbohydrates (%) 52,31 72,98 58,96 3,40
Energy, Kcal/100 g 312,92 401,30 353,36 13,11
Starch granule (µ)* 1 28 4,47 3,25
Inverted sugar (%)* 10 35 16,89 3,69
Water filling (%)* 16 66 28,92 7,34
Nutritional and Agro-food Characteristicsand Statistical Parameters for 555Germplasm Accessions from Bolivia (Rojasand Pinto, 2015)
Location Nº Accessions Protein (%)Saponine
0=sweet 1= bitter
Apurimac 145 10.3 -16.7 0 -1Ayacucho 3 13.1-13.9 1Cajamarca 12 13.2-14.9 0 -1Ancash 127 10.3-16.5 0 -1Cusco 133 13.3 -18.6 0 -1Junín 3 14.1-14.3 0 -1Puno 1 138 7-24.4 0 -1Puno2 Amargas 220 7.9 -23.7 1Puno 2 Dulces 172 7.1 - 23.2 0
Nutritional Characteristics 953 GermplasmAccessions from Peru (Gomez and Eguiluz, 2011)
Additionally 120 accessions were evaluated by the content of fat and ash in grain and flour it was founded a range of 4.79 to 9.46% of fat and 2.51 to 4.62% of ash (Pereda 2016)
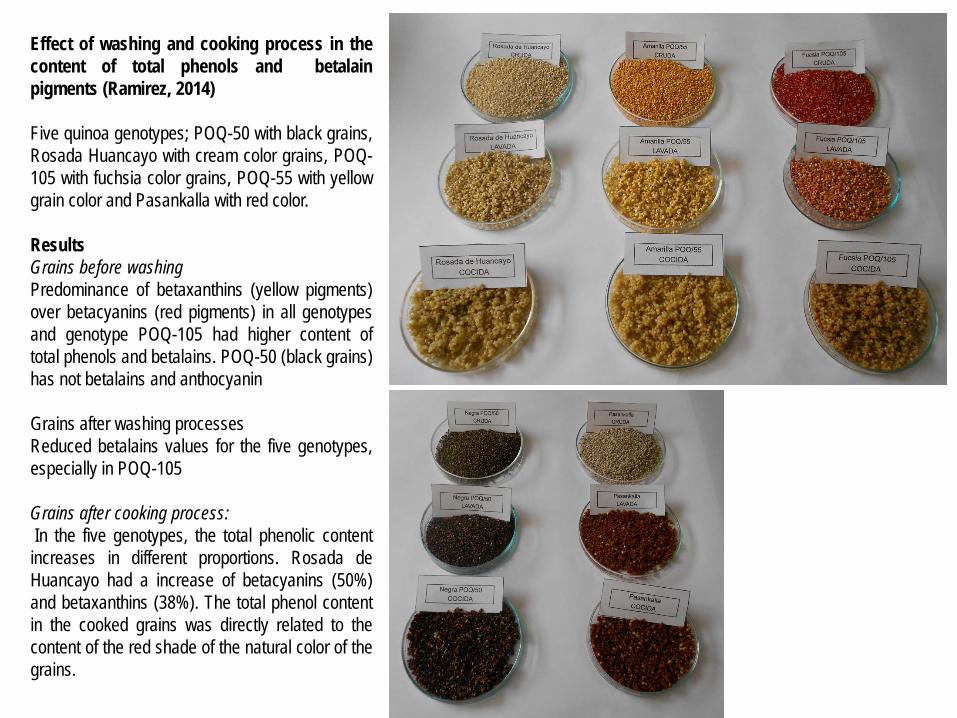
Effect of washing and cooking process in thecontent of total phenols and betalainpigments (Ramirez, 2014)
Five quinoa genotypes; POQ-50 with black grains,Rosada Huancayo with cream color grains, POQ-105 with fuchsia color grains, POQ-55 with yellowgrain color and Pasankalla with red color.
ResultsGrains before washingPredominance of betaxanthins (yellow pigments)over betacyanins (red pigments) in all genotypesand genotype POQ-105 had higher content oftotal phenols and betalains. POQ-50 (black grains)has not betalains and anthocyanin
Grains after washing processesReduced betalains values for the five genotypes,especially in POQ-105
Grains after cooking process:In the five genotypes, the total phenolic content
increases in different proportions. Rosada deHuancayo had a increase of betacyanins (50%)and betaxanthins (38%). The total phenol contentin the cooked grains was directly related to thecontent of the red shade of the natural color of thegrains.
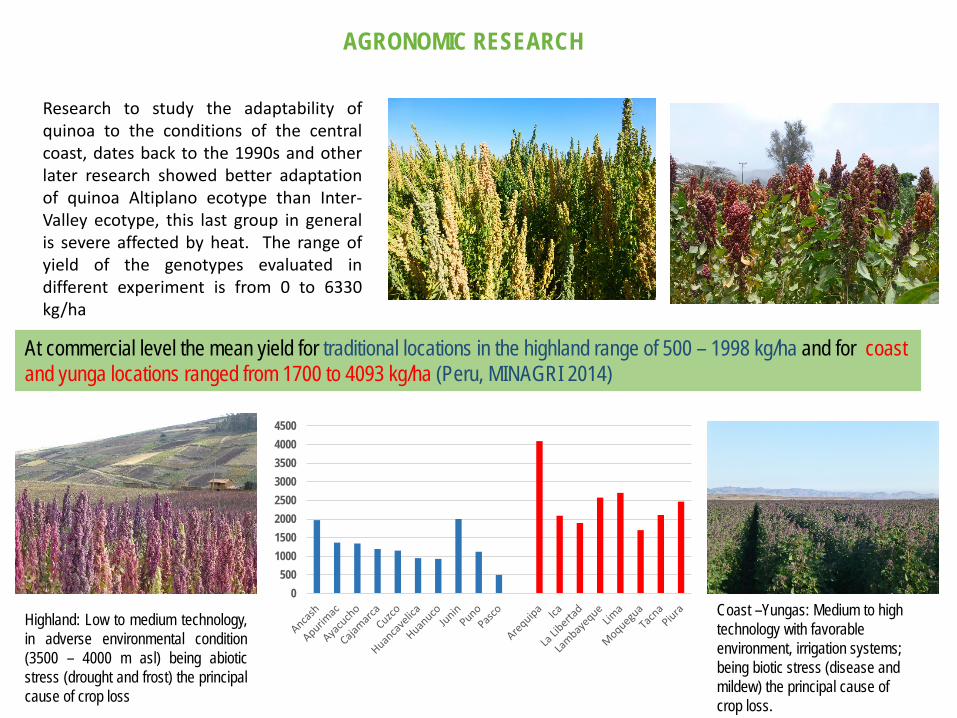
AGRONOMIC RESEARCH
Research to study the adaptability ofquinoa to the conditions of the centralcoast, dates back to the 1990s and otherlater research showed better adaptationof quinoa Altiplano ecotype than Inter-Valley ecotype, this last group in generalis severe affected by heat. The range ofyield of the genotypes evaluated indifferent experiment is from 0 to 6330kg/ha
0500
10001500200025003000350040004500
At commercial level the mean yield for traditional locations in the highland range of 500 – 1998 kg/ha and for coast and yunga locations ranged from 1700 to 4093 kg/ha (Peru, MINAGRI 2014)
Highland: Low to medium technology,in adverse environmental condition(3500 – 4000 m asl) being abioticstress (drought and frost) the principalcause of crop loss
Coast –Yungas: Medium to high technology with favorable environment, irrigation systems; being biotic stress (disease and mildew) the principal cause of crop loss.
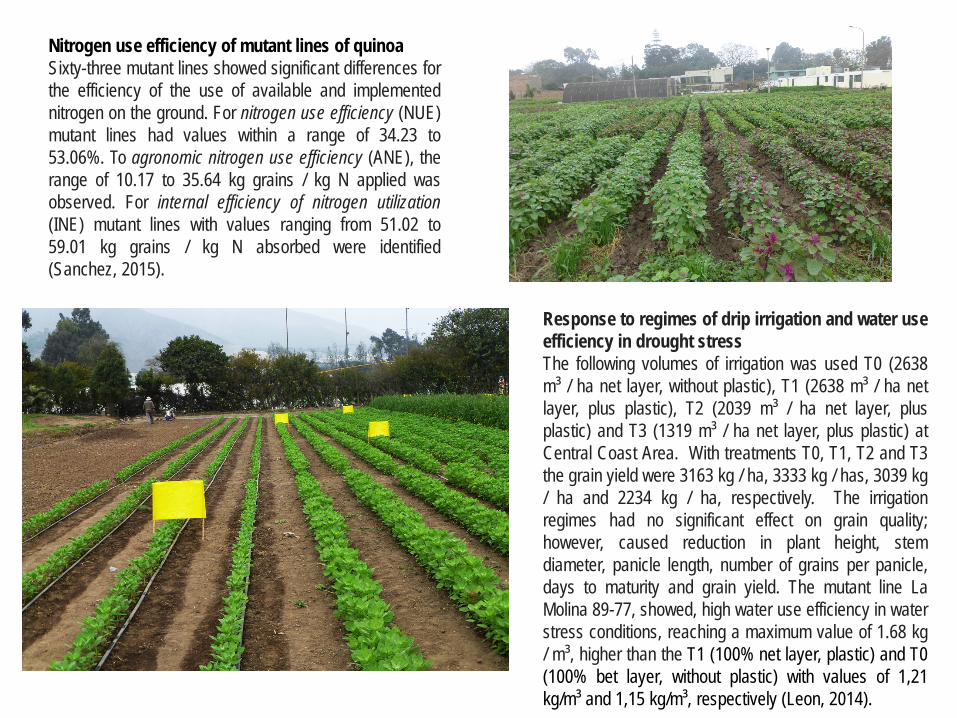
Nitrogen use efficiency of mutant lines of quinoaSixty-three mutant lines showed significant differences forthe efficiency of the use of available and implementednitrogen on the ground. For nitrogen use efficiency (NUE)mutant lines had values within a range of 34.23 to53.06%. To agronomic nitrogen use efficiency (ANE), therange of 10.17 to 35.64 kg grains / kg N applied wasobserved. For internal efficiency of nitrogen utilization(INE) mutant lines with values ranging from 51.02 to59.01 kg grains / kg N absorbed were identified(Sanchez, 2015).
Response to regimes of drip irrigation and water useefficiency in drought stressThe following volumes of irrigation was used T0 (2638m³ / ha net layer, without plastic), T1 (2638 m³ / ha netlayer, plus plastic), T2 (2039 m³ / ha net layer, plusplastic) and T3 (1319 m³ / ha net layer, plus plastic) atCentral Coast Area. With treatments T0, T1, T2 and T3the grain yield were 3163 kg / ha, 3333 kg / has, 3039 kg/ ha and 2234 kg / ha, respectively. The irrigationregimes had no significant effect on grain quality;however, caused reduction in plant height, stemdiameter, panicle length, number of grains per panicle,days to maturity and grain yield. The mutant line LaMolina 89-77, showed, high water use efficiency in waterstress conditions, reaching a maximum value of 1.68 kg/ m³, higher than the T1 (100% net layer, plastic) and T0(100% bet layer, without plastic) with values of 1,21kg/m³ and 1,15 kg/m³, respectively (Leon, 2014).
FUTURE RESEARCH AREAS AND PRIORITIES
• The evaluation of the collections of germplasm will continues, giving greater emphasis to the identification of sources of resistance to diseases and insects and to abiotic factors such us tolerance to frost, drought and heat.
• To determine nutritional quality traits of all the collections and new experiments to study the response to industrial processes of elaboration of flakes, popped grains, energy bars, noodles, beverages and others are being performed.
• Development of new varieties of quinoa, suitable for different types of agricultural management, localities, with resistance / tolerance to biotic and abiotic factors and high quality.
• To develop or improve agricultural technologies for organic, ecological and conventional farming for traditional and new areas.

THANK YOU