Embed Size (px)
Citation preview

Chapter 11
QUEUEING ANALYSIS IN HEALTHCARE
Linda GreenGraduate School of Business,Columbia University,New York, New York 10027
Abstract: Many organizations, such as banks, airlines, telecommunications companies,and police departments, routinely use queueing models to help determinecapacity levels needed to respond to experienced demands in a timely fashion.Though queueing analysis has been used in hospitals and other healthcaresettings, its use in this sector is not widespread. Yet, given the pervasivenessof delays in healthcare and the fact that many healthcare facilities are trying tomeet increasing demands with tightly constrained resources, queueing modelscan be very useful in developing more effective policies for bed allocation andstaffing, and in identifying other opportunities for improving service.Queueing analysis is also a key tool in estimating capacity requirements forpossible future scenarios, including demand surges due to new diseases or actsof terrorism. This chapter describes basic queueing models as well as somesimple modifications and extensions that are particularly useful in thehealthcare setting, and give examples of their use. The critical issue of datarequirements is also be discussed as well as model choice, model- building andthe interpretation and use of results.
Key words: Queueing, capacity management, staffing, hospitals
1. INTRODUCTION
1.1 Why is queueing analysis helpful in healthcare?
Healthcare is riddled with delays. Almost all of us have waited for daysor weeks to get an appointment with a physician or schedule a procedure,and upon arrival we wait some more until being seen. In hospitals, it is not
Easy PDF Creator is professional software to create PDF. If you wish to remove this line, buy it now.

2 Chapter 11
unusual to find patients waiting for beds in hallways, and delays for surgeryor diagnostic tests are common.
Delays are the result of a disparity between demand for a service and thecapacity available to meet that demand. Usually this mismatch is temporaryand due to natural variability in the timing of demands and in the duration oftime needed to provide service. A simple example would be a healthcareclinic where patients walk in without appointments in an unpredictablefashion and require anything from a flu shot to the setting of a broken limb.This variability and the interaction between the arrival and service processesmake the dynamics of service systems very complex. Consequently, it’simpossible to predict levels of congestion or to determine how muchcapacity is needed to achieve some desired level of performance without thehelp of a queueing model.
Queueing theory was developed by A.K. Erlang in 1904 to helpdetermine the capacity requirements of the Danish telephone system (seeBrockmeyer et al. 1948). It has since been applied to a large range of serviceindustries including banks, airlines, and telephone call centers (e.g. Brewton1989, Stern and Hersh 1980, Holloran and Byrne 1986, Brusco et al 1995,and Brigandi et al 1994) as well as emergency systems such as police patrol,fire and ambulances (e.g. Larson 1972, Kolesar et al 1975, Chelst andBarlach 1981, Green and Kolesar 1984, Taylor and Huxley 1989). It has alsobeen applied in various healthcare settings as we will discuss later in thischapter. Queueing models can be very useful in identifying appropriatelevels of staff, equipment, and beds as well as in making decisions aboutresource allocation and the design of new services.
Unlike simulation methodologies, discussed in Chapter 9, queueingmodels require very little data and result in relatively simple formulae forpredicting various performance measures such as mean delay or probabilityof waiting more than a given amount of time before being served. Thismeans that they are easier and cheaper to use and can be more readily usedto find “optimal” solutions rather than just estimating the systemperformance for a given scenario.
Timely access has been identified as one of the key elements ofhealthcare quality (Institute of Medicine 2001) and consequently, decreasingdelays has become a focus in many healthcare institutions. Given thefinancial constraints that exist in many of these facilities, queueing analysiscan be an extremely valuable tool in utilizing resources in the most cost-effective way to reduce delays. The primary goal of this chapter is to providea basic understanding of queueing theory and some of the specific queueingmodels that can be helpful in designing and managing healthcare systems.For more detail on specific models that are commonly used, a textbook onqueueing theory such as Hall (1991) is recommended.
Easy PDF Creator is professional software to create PDF. If you wish to remove this line, buy it now.

11. Queueing Analysis in Healthcare 3
Before discussing past and potential uses of queueing models inhealthcare, it’s important to first understand some queueing theoryfundamentals.
1.2 Queueing System Fundamentals
A basic queueing system is a service system where “customers” arrive toa bank of “servers” and require some service from one of them. It’simportant to understand that a “customer” is whatever entity is waiting forservice and does not have to be a person. For example, in a “back-office”situation such as the reading of radiologic images, the “customers” might bethe images waiting to be read. Similary, a “server” is the person or thing thatprovides the service. So when analyzing delays for patients in the emergencydepartment (ED) awaiting admission to the hospital, the relevant serverswould be inpatient beds.
If all servers are busy upon a customer’s arrival, they must join a queue.Though queues are often physical lines of people or things, they can also beinvisible as with telephone calls waiting on hold. The rule that determinesthe order in which queued customers are served is called the queuediscipline. The most common discipline is the familiar first-come, first-served (FCFS) rule, but other disciplines are often used to increaseefficiency or reduce the delay for more time-sensitive customers. Forexample, in an ED, the triage system is an example of a priority queuediscipline. Priority disciplines may be preemptive or non-preemptive,depending upon whether a service in progress can be interrupted when acustomer with a higher priority arrives. In most queueing models, theassumption is made that there is no limit on the number of customers thatcan be waiting for service, i.e. there is an infinite waiting room. This is agood assumption when customers do not physically join a queue, as in atelephone call center, or when the physical space where customers wait islarge compared to the number of customers who are usually waiting forservice. Even if there is no capacity limit on waiting room, in some casesnew arrivals who see a long queue may “balk” and not join the queue. Thismight happen in a walk-in clinic. A related characteristic that is incorporatedin some queueing systems is “reneging” which occurs when customers growinpatient and leave the queue before being served. An example of thisbehavior is found in some EDs where the patients who renege are oftenreferred to as “left without being seen”.
Finally, queues may be organized in various ways. In most cases, we willconsider a single line that feeds into all servers. But sometimes each serverhas his/her own queue as may be the case for a primary care office in whichpatients have their own physician. This is usually referred to as queues in
Easy PDF Creator is professional software to create PDF. If you wish to remove this line, buy it now.

4 Chapter 11
parallel. In other situations, we may want to consider a network design inwhich customers receive service from different types of servers in asequential manner. For example, a surgical inpatient requires an operatingroom (OR), then a bed in the recovery unit, followed by a bed in a surgicalintensive care unit (ICU), and/or other part of the hospital. However, it mightstill make sense to analyze a single queue in these situations to determine thecapacity requirements of a single type of resource, particularly if there isreason to believe that the resource is a bottleneck.
A queueing model is a mathematical description of a queuing systemwhich makes some specific assumptions about the probabilistic nature of thearrival and service processes, the number and type of servers, and the queuediscipline and organization. There are countless variations possible, butsome queueing models are more widely used and we will focus on these inthis chapter. For these models, as well as many others, there are formulaeavailable that enable the fast calculation of various performance measuresthat can be used to help design a new service system or improve an existingone.
2. BASIC QUEUEING PRINCIPLES AND MODELS
Most of queueing theory deals with system performance in steady-state.That is, most queueing models assume that the system has been operatingwith the same arrival, service time and other characteristics for a sufficientlylong time that the probability distribution for the queue length and customerdelay is independent of time. Clearly, there are many service systems,including health care systems, for which there are time-of-day, day-of-weekor seasonality affects. In this section, we will assume that we are looking atsystems in steady-state and in subsequent sections, we will discuss how todeal with systems that have some time-varying characteristics.
2.1 Delays, Utilization and System Size
In queueing theory, utilization, defined as the average number of busyservers divided by the total number of servers times 100, is an importantmeasure. From a managerial perspective, utilization is often seen as ameasure of productivity and therefore it is considered desirable for it to behigh. For example, in hospital bed planning, utilization is called occupancylevel and historically, an average hospital occupancy level of 85 percent hasbeen used as the minimum level for the states to make a determination underCertificate of Need (CON) regulations that more beds might be needed (seeBrecher and Speizio 1995). Since the actual average occupancy rate for
Easy PDF Creator is professional software to create PDF. If you wish to remove this line, buy it now.

11. Queueing Analysis in Healthcare 5
nonprofit hospitals has recently been about 66 percent, there has been awidely held perception in the health care community that there are too manyhospital beds. Largely because of this perception, the number of hospitalbeds has decreased almost 25 percent in the last 20 years.
But determining bed capacity based on occupancy levels can result invery long waiting times for beds (Green 2003). In all queueing systems, thehigher the average utilization level, the longer the wait times. However, it isimportant to note that this relationship is nonlinear. This is illustrated inFigure 1 which shows the fundamental relationship between delays andutilization for a queueing system. There are three critical observations wecan make from this figure. First, as average utilization (e.g. occupancy rate)increases, average delays increase at an increasing rate. Second, there is an“elbow” in the curve after which the average delay increases moredramatically in response to even small increases in utilization. Finally, theaverage delay approaches infinity as utilization approaches one. (It’simportant to note that this is assuming that there is no constraint on how longthe queue can get and that customers continue to join and remain in thequeue.)
The exact location of the elbow in the curve depends upon two criticalcharacteristics of the system: variability and size. Variability generally existsin both the time between arrivals and the duration of service times and isusually measured by the ratio of the standard deviation to the mean, calledthe coefficient of variation (CV). The higher the degree of variability in thesystem, the more to the left the elbow will be so that delays will be worse forthe same utilization level. System size is defined as the ratio of the averagedemand over the average service time, which is a determinant of the numberof servers needed. The larger the system, the closer the elbow will be to100%, so that delays will be smaller for the same utilization level.
Easy PDF Creator is professional software to create PDF. If you wish to remove this line, buy it now.

6 Chapter 11
Figure 11-1 Tradeoff between average delay and utilization in a queueingsystem
Easy PDF Creator is professional software to create PDF. If you wish to remove this line, buy it now.
11. Queueing Analysis in Healthcare 7
These basic queueing principles have several important implications forplanning or evaluating capacity in a service system. First, the average totalcapacity, defined as the number of servers times the rate at which eachserver can serve customers, must be strictly greater than the average demand.In other words, unless average utilization is strictly less than 100%, thesystem will be “unstable” and the queue will continue to grow. Though thisfact may appear counter-intuitive on the surface, it has been well known byoperations professionals for decades. So if an emergency room has 10patients arriving per hour on average and each healthcare provider(physician or physician assistant) can treat 2 patients per hour, a minimum of6 providers is needed. (Of course, in many contexts, if arrivals see a longqueue they may not join it or they may reneg after waiting a long time. If so,it may be possible to have stability even if the average demand exceeds theaverage capacity.) Second, the smaller the system, the longer the delays willbe for a given utilization level. In other words, queueing systems haveeconomies of scale so that, for example, larger hospitals can operate athigher utilization levels than smaller ones yet maintain similar levels ofcongestion and delays. Finally, the greater the variability in the service time(e.g. length-of-stay), the longer the delays at a given utilization level. So aclinic or physician office that specializes in e.g. vision testing ormammography, will experience shorter patient waits than a university basedclinic of the same size and with the same provider utilization that treats abroad variety of illnesses and injuries. These properties will be morespecifically illustrated when we discuss applications of queueing models.
2.2 Some simple but useful queueing models
2.2.1 The Poisson process
In specifying a queueing model, we must make assumptions about theprobabilistic nature of the arrival and service processes. The most commonassumption to make about arrivals is that they follow a Poisson process. Thename comes from the fact that the number of arrivals in any given timeperiod has a Poisson distribution. So if N(t) is the number of arrivals during atime period of duration t and N(t) has a Poisson distribution,
Probability {N(t) = n} = e-ët (ët)n / n!
where ë is called the rate and is the expected number of arrivals per unittime. For example, if ë = 10 customers per hour, then the expected numberof arrivals in any 60 minute interval is 10 and the expected number to arrivein a 15 minute interval is 2.5. Notice that these are averages so that ë need
Easy PDF Creator is professional software to create PDF. If you wish to remove this line, buy it now.

8 Chapter 11
not have an integer value. Another way to characterize the Poisson process isthat the time between consecutive arrivals, called the interarrival time, has anexponential distribution. So if IA is the interarrival time of a Poisson processwith rate ë,
Probability {IA t} = 1 – e –ët
and 1/ë is the average time between arrivals.An important property of the exponential distribution is that it is
“memoryless”. This means that the time of the next arrival is independent ofwhen the last arrival occurred. This property also leads to the fact that if thearrival process is Poisson, the number of arrivals in any given time intervalis independent of the number in any other non-overlapping time interval.Conversely, it can be shown analytically that if customers arriveindependently from one another, the arrival process is a Poisson process. Forthis reason, the Poisson process is considered the most “random” arrivalprocess.
In determining whether the Poisson process is a reasonable model forarrivals in a specific service system, it is useful to consider its three definingproperties:
1. Customers arrive one at a time.2. The probability that a customer arrives at any time is independent
of when other customers arrived.3. The probability that a customer arrives at a given time is
independent of the time.
In most contexts, customers generally do arrive one at a time. Thoughthere may be events, such as a major accident, that trigger multiplesimultaneous arrivals, this is likely to be an exceptional circumstance whichwill not significantly affect the effectiveness of this modeling assumption.Intuitively, the second property is also often a reasonable assumption. Forexample, in an emergency room, where the population of potential patients isvery large, it is unlikely that someone arriving with a broken arm hasanything to do with someone else’s injury or illness, or that the fact that thenumber of patients who arrived between 9am and 10am was four providesinformation about the number of patients that are likely to arrive between10am and 11am. Again, there may be occasional exceptions, such as a fluoutbreak, which violate this assumption, but in the aggregate, it’s likely to beadequate. However, the third property may be more suspect. More typically,the average arrival rate varies over the day so that, e.g., it is more likely foran arrival to occur in the morning than in the middle of the night. Certaindays of the week may be busier than others as well. However, we may be
Easy PDF Creator is professional software to create PDF. If you wish to remove this line, buy it now.

11. Queueing Analysis in Healthcare 9
able to use the standard Poisson process as a good model for a shorterinterval of time over which the arrival rate is fairly constant. We will discussthis in more detail in a subsequent section.
So the assumption of a Poisson process will generally be a good onewhen the three properties above are a reasonable description of the servicesystem in question. However, it is possible to perform more rigorous tests todetermine if it is a good fit. The simplest tests are based on the relationshipof the standard deviation to the mean of the two distributions involved in thePoisson process. Since the variance (square of the standard deviation) of thePoisson distribution is equal to its mean, we can examine the number ofarrivals in each fixed interval of time, (e.g. 30 minutes) and determinewhether the ratio of the mean to the variance is close to one. Alternatively,since the exponential distribution is characterized by its standard deviationbeing equal to its mean, we can look at the interarrival times and computethe ratio of the standard deviation to the mean to see if it’s close to one. Hall(1991) describes goodness of fit tests in greater detail.
Many real arrival and demand processes have been empirically shown tobe very well approximated by a Poisson process. Among these are demandsfor emergency services such as police, fire and ambulance, arrivals to banksand other retail establishments, and arrivals of telephone calls to customerservice call centers. Because of its prevalence and its assumption ofindependent arrivals, the Poisson process is the most commonly used arrivalprocess in modeling service systems. It is also a convenient assumption tomake in terms of data collection since it is characterized by a singleparameter – its rate ë. In healthcare, the Poisson process has been verified tobe a good representation of unscheduled arrivals to various parts of thehospital including ICUs, obstetrics units and EDs (Young 1965, Kim et al1999, Green et al 2005).
2.2.2 The M/M/s model
The most commonly used queueing model is the M/M/s or Erlang delaymodel. This model assumes a single queue with unlimited waiting room thatfeeds into s identical servers. Customers arrive according to a Poissonprocess with a constant rate, and the service duration (e.g. LOS or providertime associated with a patient) has an exponential distribution. (These twoassumptions are often called Markovian, hence the use of the two “M’s” inthe notation used for the model.)
One advantage of using the M/M/s model is that it requires only threeparameters and so it can be used to obtain performance estimates with verylittle data. Given an average arrival rate, ë, an average service duration, 1/µ,and the number of servers, s, easy-to-compute formulae are available to
Easy PDF Creator is professional software to create PDF. If you wish to remove this line, buy it now.
10 Chapter 11
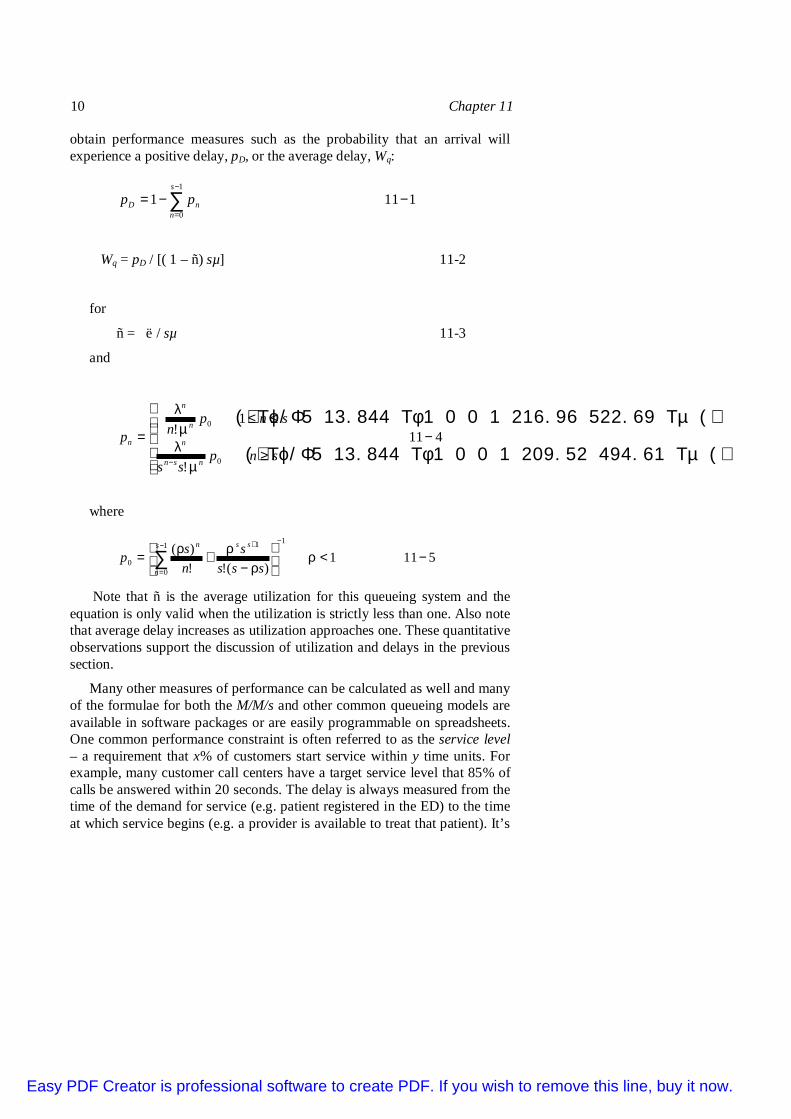
obtain performance measures such as the probability that an arrival willexperience a positive delay, pD, or the average delay, Wq:
11111
0
−−= ∑−
=
s
nnD pp
Wq = pD / [( 1 – ñ) sµ] 11-2
for
ñ = ë / sµ 11-3
and
()Τϕ/Φ5 13.844 Τφ1 0 0 1 216.96 522.69 Τµ ()
()Τϕ/Φ5 13.844 Τφ1 0 0 1 209.52 494.61 Τµ ()411
!
1!
0
0
−
≥
≤≤=
− snpss
snpnp
nsn
n
n
n
n
µλµλ
where
5111)(!!
)(11
0
1
0 −<
−
+=−−
=
+
∑ ρρ
ρρs
n
ssn
ssss
nsp
Note that ñ is the average utilization for this queueing system and theequation is only valid when the utilization is strictly less than one. Also notethat average delay increases as utilization approaches one. These quantitativeobservations support the discussion of utilization and delays in the previoussection.
Many other measures of performance can be calculated as well and manyof the formulae for both the M/M/s and other common queueing models areavailable in software packages or are easily programmable on spreadsheets.One common performance constraint is often referred to as the service level– a requirement that x% of customers start service within y time units. Forexample, many customer call centers have a target service level that 85% ofcalls be answered within 20 seconds. The delay is always measured from thetime of the demand for service (e.g. patient registered in the ED) to the timeat which service begins (e.g. a provider is available to treat that patient). It’s
Easy PDF Creator is professional software to create PDF. If you wish to remove this line, buy it now.
11. Queueing Analysis in Healthcare 11
important to note that the model’s delay predictions pertain only to waitingtimes due to the unavailability of the server.
2.2.3 Some useful extensions of the M/M/s model
There are several variations on the basic M/M/s queueing model. Oneimportant one for many healthcare organizations is the M/M/s with priorities.While the fundamental model assumes that customers are indistinguishableand are served FCFS, the priority model assumes that customers havediffering time-sensitivities and are allocated to two or more service classes i= 1,2,…N, and that customers are served in priority order with 1 being thehighest priority and N the lowest. Within any given class, customers areserved FCFS. But when there is a queue and a server becomes available, acustomer belonging to class i will be served only if there are no waitingcustomers of class 1,…,i-1. A priority queueing model would be appropriateif a facility is interested in identifying the capacity needed to assure atargeted service level for the highest priority customers. For examples, in anED, while many arriving patients would not incur any particular harm if theyhad to wait more than an hour to be seen by a physician, some fraction, whoare emergent or urgent, need a physician’s care sooner to prevent seriousclinical consequences. In this case, a priority queueing model could be usedto answer a question like: How many physicians are needed to assure that90% of emergent and urgent patients will be seen by a physician within 45minutes (see Green et al 2005)?
There are two types of priority queueing disciplines: preemptive and non-preemptive. In the preemptive model, if a higher priority customer arriveswhen all servers are busy and a lower priority customer is being served, thelower priority customer’s service will be interrupted (preempted) so that thehigher priority customer can begin service immediately. The preemptedcustomer must then wait for another server to become free to resume service.In the non-preemptive model, new arrivals cannot preempt customersalready in service. While priority queueing models are usually either purelypreemptive or non-preemptive, it is possible to model a service system thathas both preemptive and non-preemptive customer classes. This might beappropriate for a hospital ED where the normal triage system whichclassifies patients as emergent, urgent or non-urgent is usually assumed to benon-preemptive, but will use a preemptive discipline for certain urgentpatients whose conditions are extremely time-sensitive, such as strokevictims. In addition to the usual input parameters for the M/M/s model,priority models also require the fraction of customers in each of the priorityclasses.
Easy PDF Creator is professional software to create PDF. If you wish to remove this line, buy it now.

12 Chapter 11
Another common variant of the M/M/s model assumes a finite capacity K s and is notated as M/M/s/K. In this model, if a customer arrives whenthere are K customers already in the system (being served and waiting), thecustomer cannot join the queue and must leave. A common application ofthis would be a telephone trunk line feeding into a call center. Such a systemhas a finite number of spaces for calls being served or on hold and when anew call comes in and all the spaces are already taken, the new arrival hearsa busy signal and hangs up. A similar phenomenon might occur in a walk-inhealth clinic which has a waiting room with a fixed number of seats. Thoughsome patients may choose to wait even if there is no seat available uponarrival, many patients may leave and try to return at a less busy time.Customers who are “blocked” from joining the queue are called “lost” andmay show up again or never return. In these types of systems, queueinganalysis might be used to help determine how large the waiting or holdingarea should be so that the number of customers who are blocked is kept to anacceptably low level.
A specific special case of these finite capacity models is the one where K= s so that there is no waiting room for those who arrive when all servers arebusy. These are called pure “loss” models and they are often used to analyzeservice systems in which it is considered either impractical or veryundesirable to have any customers wait to begin service. For example,Kaplan, Sprung and Shmueli (2003) used a loss model to analyze the impactof various admissions policies to ICU facilities.
2.3 The M/G/1 and G/G/s models
An important characteristic of the exponential distribution used in theM/M/s is that the standard distribution equals the mean and so the CV of theservice time equals one. If the actual CV of service is a bit less than orgreater than one, the M/M/s will still give good estimates of delay. However,if the CV is substantially different than one, the M/M/s may significantlyunderestimate or overestimate actual delays. (Recall that if variability islower, the model will overestimate delays while the converse is true ifvariability is greater.) In this case, if the arrival process is Poisson, and thereis only one server, the average delay can still be calculated for any servicedistribution through use of the following formula for what is known as theM/G/1 system:
Wq = [ ëñ / (1 – ñ) ] [ ( 1 + CV2(S) ) / 2 ] 11-6
where CV2(S) is the square of the coefficient of variation of the service time.Clearly, this formula requires knowledge of the standard deviation of the
Easy PDF Creator is professional software to create PDF. If you wish to remove this line, buy it now.

11. Queueing Analysis in Healthcare 13
service time in addition to the mean in order to compute CV2(S). Thisformula also illustrates the impact of variability on delays. Notice that, asmentioned previously, as the coefficient of variation of the service timeincreases, so does the average delay.
Though there are no exact formula for non-Markovian multi-serverqueues, there are some good, simple approximations. One suchapproximation (Allen 1978) is given by:
Wq = Wq,M/M/s [CV2(A) + CV2(S)] / 2 11-7
where CV2(A) is the square of the coefficient of variation of the arrival timeand Wq,M/M/s is the expected delay for an M/M/s system, eq. (2). So thisformula requires the standard deviation of the interarrival time as well andagain demonstrates that more variability results in longer delays.
3. ANALYSES OF FIXED CAPACITY: HOW MANYHOSPITAL BEDS?
Many resources in health care facilities have a fixed capacity over a longperiod of time. These are usually “things” rather than people: beds, operatingrooms, imaging machines, etc. Queueing models are not always appropriatefor analyzing such resources. In particular, if the patients for a resource arescheduled into fixed time slots, there is little or no likelihood of congestionunless patients routinely come late or the time slots are not large enough toaccommodate most patients. An example of this would be a magneticresonance imaging (MRI) facility which is only used by scheduledoutpatients.
However, the difficulty of managing many healthcare facilities is that thedemand for resources is unscheduled and hence random, yet timely care isimportant. This is the case for many parts of a hospital that deal primarilywith non-elective admissions. In these cases, queueing models can be veryhelpful in identifying long-term capacity needs.
3.1 Applying the M/M/s model
To illustrate the use of a queueing model for evaluating capacity,consider an obstetrics unit. Since it is generally operated independently ofother services, its capacity needs, e.g. number of postpartum beds, can bedetermined without regard to other parts of the hospital. It is also one forwhich the use of a standard M/M/s queueing model is quite good. Mostobstetrics patients are unscheduled and the assumption of Poisson arrivalshas been shown to be a good one in studies of unscheduled hospital
Easy PDF Creator is professional software to create PDF. If you wish to remove this line, buy it now.

14 Chapter 11
admissions (Young 1965). In addition, the CV of length of stay is typicallyvery close to 1.0 (Green and Nguyen 2001) satisfying the service timeassumption of the M/M/s model.
A queueing model may be used either descriptively or prescriptively. Asan example of the descriptive case, we can take the current operatingcharacteristics of a given obstetrics unit: arrival rate, average LOS, andnumber of beds; and use these in equation (11-1) to determine theprobability that an arriving patient will not find a bed available. Let’s assumethat Big City Hospital’s obstetrics unit has an average arrival rate of ë = 14.8patients per day, an average LOS of 1/µ = 2.9 days, and s = 56 beds. Thenthe M/M/s formula for probability of delay (11-1) produces an estimate ofapproximately 4%. To use the M/M/s prescriptively to find the minimumnumber of beds needed to attain a target probability of delay, we can enterequation (11-1) in a spreadsheet and produce a table of results for a broadrange of bed capacities to find the one that best meets the desired target.Table 11-1 is a partial table of results for our example obstetrics unit.
Table 11-1 Probability of (Delay) and utilization for obstetrics unit
No. Beds Pr(Delay) Utilization45 0.666 0.95346 0.541 0.93347 0.435 0.91348 0.346 0.89449 0.272 0.87550 0.212 0.85851 0.163 0.84152 0.124 0.82553 0.093 0.80954 0.069 0.79455 0.051 0.78056 0.037 0.76657 0.026 0.75358 0.018 0.74059 0.013 0.72760 0.009 0.71561 0.006 0.70362 0.004 0.69263 0.003 0.68164 0.002 0.670
Easy PDF Creator is professional software to create PDF. If you wish to remove this line, buy it now.

11. Queueing Analysis in Healthcare 15
65 0.001 0.660
Though there is no standard delay target, Schneider (1981) suggested thatgiven their emergent status, the probability of delay for an obstetrics bedshould not exceed 1%. Applying this criterion, Table 11-1 indicates that thisunit has at least 60 beds. Table 11-1 also shows the utilization level for eachchoice of servers and that at 60 beds, this level is 71.5%. This is whathospitals call the average occupancy level and it is well below the 85% levelthat many hospitals and healthcare policy officials consider the minimumtarget level. It is also below the maximum level of 75% recommended by theAmerican College of Obstetrics and Gynecology (ACOG) to assure timelyaccess to a bed (Freeman and Poland 1992). So does this example show thatas long as an obstetrics unit operates below this ACOG occupancy level of75%, the fraction of patients who will be delayed in getting a bed will bevery low?
3.2 The problem with using target occupancy levels
Hospital capacity decisions traditionally have been made, both at thegovernment and institutional levels, based on target occupancy levels - theaverage percentage of occupied beds. Historically, the most commonly usedoccupancy target has been 85%. Estimates of the number of “excess” beds inthe United States, as well as in individual states and communities, usuallyhave been based on this “optimal” occupancy figure (Brecher and Speizio1995, p.55). In addition, low occupancy levels are often viewed as indicativeof operational inefficiency and potential financial problems. So hospitaladministrators generally view higher occupancy levels as desirable.However, as we saw previously in this chapter, higher occupancy levelsresult in longer delays and so basing capacity on target occupancy levels canlead to undesirable levels of access for patients.
In Green (2002), the basic M/M/s model is used to demonstrate theimplications of using target occupancy levels to determine capacity in bothobstetrics and ICU units in New York State. Figure 1 from that paper (shownbelow as Figure 11-2) shows the distribution of average occupancy rates for148 obstetrics units in New York State for 1997. These data, representingnearly all obstetrics units in New York, were obtained from InstitutionalCost Reports (ICRs), and unlike most other published data, reflect staffedbeds rather than certified beds. The graph shows that many maternity unitshad low average occupancy levels with the overall average occupancy levelfor the study hospitals was only 60%, which, based on the ACOG standard,would imply significant excess capacity. Applying this 75% standard to the
Easy PDF Creator is professional software to create PDF. If you wish to remove this line, buy it now.

16 Chapter 11
1997 data, 117 of the 148 New York state hospitals had “excess” beds, while27 had insufficient beds.
0%
2%
4%
6%
8%
10%
12%
14%
16%
18%
20%
22%
0-10 11-20 21-30 31-40 41-50 51-60 61-70 71-80 81-90 91-100 >100
Oc c upa n c y Ra t e ( %)
Figure 11- 2 Average Occupancy Rates of New York StateMaternity Units, 1997
However, if one considers a bed delay target as a more appropriatemeasure of capacity needs, the conclusions can be quite different. Now thenumber of beds in each unit becomes a major factor since, for a givenoccupancy level, delays increase as unit size decreases. While obstetricsunits usually are not the smallest units in a hospital, there are many smallhospitals, particularly in rural areas, and the units in these facilities maycontain only five to 10 beds. Of the New York state hospitals consideredhere, more than 50% had maternity units with 25 or fewer beds.
In the M/M/s model, probability of delay is a function of only twoparameters: s and ρ, which in our context is the number of beds andoccupancy level. Each of the three curves shown in Figure 11-3 represents aspecific probability of delay as a function of these two variables as generatedby equation (11-1). Thus, using the unit size and occupancy level reportedon the ICR report for a given maternity unit, we can determine from thisfigure if the probability of delay meets or exceeds any one of these targets.For example, if a maternity unit has 15 beds and an occupancy level of 45%,it would fall below all three curves and hence have a probability of delayless than .01 or 1%, meeting all three targets.
Easy PDF Creator is professional software to create PDF. If you wish to remove this line, buy it now.

11. Queueing Analysis in Healthcare 17
Doing this for every hospital in the database, 30 hospitals had insufficientcapacity based on even the most slack delay target of 10%. (It is interestingto note that two of the hospitals that would be considered over utilized underthe 75% occupancy standard had sufficient capacity under this delaystandard.) Tightening the probability of delay target to 5%, yields 48obstetrics units that do not meet this standard. And adopting a maximumprobability of delay of 1% as was suggested in the only publicationidentified as containing a delay standard for obstetrics beds (Schneider1981), results in 59, or 40%, of all New York state maternity units withinsufficient capacity.
How many hospitals in New York State had maternity units large enoughto achieve the ACOG-suggested 75% occupancy level and also meet aspecified probability of delay standard? Using Figure 11-3, we see that for a10% target, an obstetrics unit would need to have at least 28 beds, a size thatexists in only 40% of the state hospitals. For a 5% standard, the minimumnumber of beds needed is 41, a size achieved in only 14% of the hospitals;for a 1% standard, at least 67 beds are needed, leaving only three of the 148or 2% of the hospitals of sufficient size.
00.05
0.10.15
0.20.25
0.30.35
0.40.45
0.50.55
0.60.65
0.70.75
0.80.85
0.9
0 5 10 15 20 25 30 35 40 45 50 55 60 65 70 75 80 85
Number of Beds
Occ
upan
cyL
evel
pD = 10%pD = 5%pD = 1%
Figure 11-3 Probability of Delay (pD) by Occupancy and Size
Easy PDF Creator is professional software to create PDF. If you wish to remove this line, buy it now.
18 Chapter 11
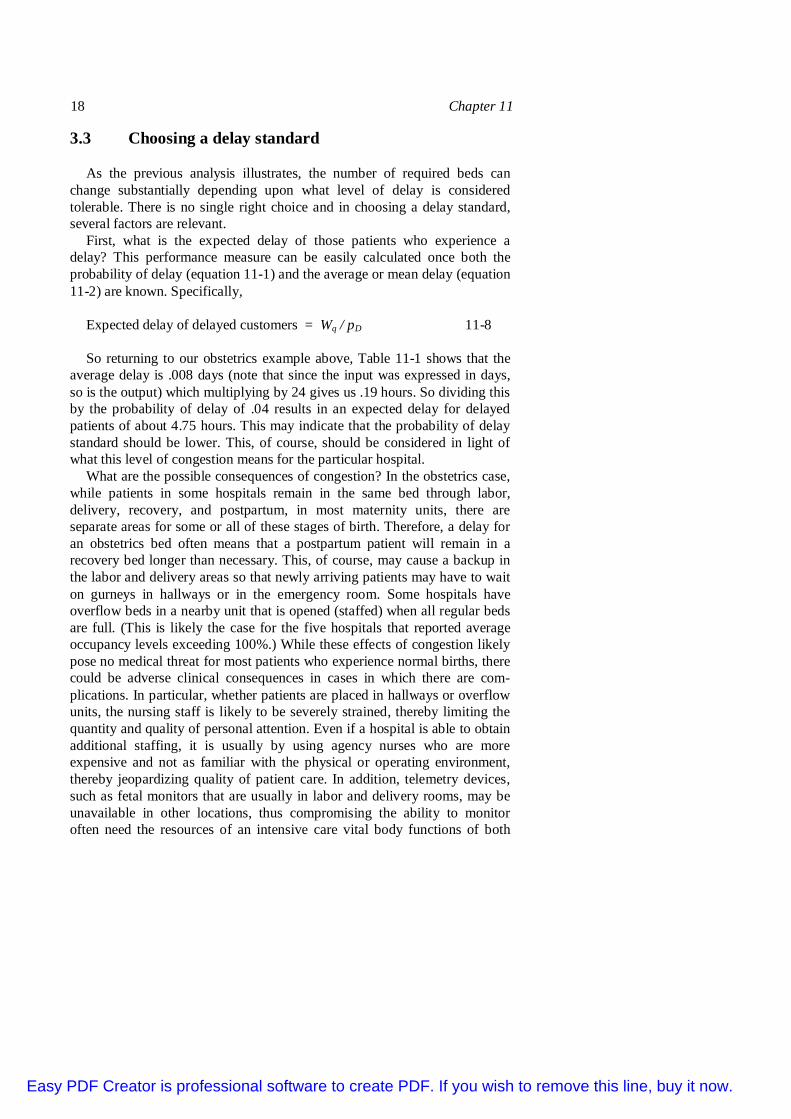
3.3 Choosing a delay standard
As the previous analysis illustrates, the number of required beds canchange substantially depending upon what level of delay is consideredtolerable. There is no single right choice and in choosing a delay standard,several factors are relevant.
First, what is the expected delay of those patients who experience adelay? This performance measure can be easily calculated once both theprobability of delay (equation 11-1) and the average or mean delay (equation11-2) are known. Specifically,
Expected delay of delayed customers = Wq / pD 11-8
So returning to our obstetrics example above, Table 11-1 shows that theaverage delay is .008 days (note that since the input was expressed in days,so is the output) which multiplying by 24 gives us .19 hours. So dividing thisby the probability of delay of .04 results in an expected delay for delayedpatients of about 4.75 hours. This may indicate that the probability of delaystandard should be lower. This, of course, should be considered in light ofwhat this level of congestion means for the particular hospital.
What are the possible consequences of congestion? In the obstetrics case,while patients in some hospitals remain in the same bed through labor,delivery, recovery, and postpartum, in most maternity units, there areseparate areas for some or all of these stages of birth. Therefore, a delay foran obstetrics bed often means that a postpartum patient will remain in arecovery bed longer than necessary. This, of course, may cause a backup inthe labor and delivery areas so that newly arriving patients may have to waiton gurneys in hallways or in the emergency room. Some hospitals haveoverflow beds in a nearby unit that is opened (staffed) when all regular bedsare full. (This is likely the case for the five hospitals that reported averageoccupancy levels exceeding 100%.) While these effects of congestion likelypose no medical threat for most patients who experience normal births, therecould be adverse clinical consequences in cases in which there are com-plications. In particular, whether patients are placed in hallways or overflowunits, the nursing staff is likely to be severely strained, thereby limiting thequantity and quality of personal attention. Even if a hospital is able to obtainadditional staffing, it is usually by using agency nurses who are moreexpensive and not as familiar with the physical or operating environment,thereby jeopardizing quality of patient care. In addition, telemetry devices,such as fetal monitors that are usually in labor and delivery rooms, may beunavailable in other locations, thus compromising the ability to monitoroften need the resources of an intensive care vital body functions of both
Easy PDF Creator is professional software to create PDF. If you wish to remove this line, buy it now.

11. Queueing Analysis in Healthcare 19
mother and baby. Finally, it is worth noting that such results of congestionmay negatively affect patients’ perceptions of service quality.
Of course, all major capacity decisions need to be made in light offinancial constraints, competing demands, and predictions concerning futuredemands for the service.
3.4 Planning for predictable changes in demand
When making capacity decisions about resources that will be used overseveral years, it is clearly necessary to consider how conditions may changeover that period of time. So in determining the choice of arrival rate oraverage LOS for a queueing analysis of a hospital unit, it would be importantto engage in analyses and discussion to gauge how these parameters maychange and then run the model to determine the sensitivity of capacity levelsto these changes.
However, what may not be so obvious is the need to consider the changesin the arrival rate that are likely to occur on a regular basis due to predictableday-of-week or time-of-year patterns. For example, obstetrics units oftenexperience a significant degree of seasonality in admissions. An analysisperformed on data from a 56-bed maternity unit at Beth Israel DeaconessHospital in Boston (Green and Nguyen 2001) revealed that the averageoccupancy levels varied from a low of about 68% in January to about 88% inJuly. As indicated by Figure 11-4, the M/M/s model estimate of theprobability of delay of getting a bed for an obstetrics patient giving birth inJanuary is likely to be negligible with this capacity. However, in July, thesame model estimates this delay to be about 25%. And if, as is likely, thereare several days when actual arrivals exceed this latter monthly average bysay 10%, this delay probability would shoot up to over 65%. The result ofsuch substantial delays can vary from backups into the labor rooms andpatients on stretchers in the hallways to the early discharge of patients.Clearly, hospitals need to plan for this type of predictable demand increaseby keeping extra bed capacity that can be used during peak times, or byusing “swing” beds that can be shared by clinical units that havecountercyclical demand patterns.
.0
.1
.2
.3
.4
.5
.6
.7
.8
.9
1.0
10.8 12.3 13.9 15.4 17.0 18.5 20.0
Arrivals per Day
Pro
babi
lity
ofD
elay
Eas
y P
DF
Cre
ator
is p
rofe
ssio
nal s
oftw
are
to c
reat
e P
DF.
If y
ou w
ish
to re
mov
e th
is li
ne, b
uy it
now
.

20 Chapter 11
Figure 11-4 Probability of Delay as a function of arrivals per day for a56 bed obstetrics unit
Most hospital units experience different arrival rates for different days ofthe week. For example, in one surgical intensive care unit, the averageadmissions per day over a six month period varied from a low of 1.44 forSundays to a high of 4.40 for Fridays. Using the average arrival rate over theweek of 3.34 in a queueing model would indicate that given the 12 bedcapacity of this unit, the probability of delay for a bed was about 39%,indicating serious congestion. However, this is very misleading becausedelays will be significantly greater in the middle of the week and quite smallearlier in the week due to the large differences in the admissions rates (Greenand Nguyen (2001). This illustrates a situation in which a steady-statequeueing model is inappropriate for estimating the magnitude and timing ofdelays and for which a simulation model will be far more accurate.
3.5 Using queueing models to quantify the benefits offlexibility
Healthcare facilities often have to make a choice as to the extent towhich resources should be dedicated to specific patient types. For example,should there be a imaging facility just for the use of inpatients, or foremergency patients? Should there be a “fast-track” unit in the emergencyroom to deal with simpler, non-urgent cases. How many distinct clinicalservice units should be used for hospital inpatients? In many of thesesituations, a queueing analysis can be useful in evaluating the potentialtrade-offs between more flexible and more specialized facilities.
For example, seriously ill patients arriving to a hospital ED oftenexperience serious delays in being admitted due to highly variable patientdemands and insufficient inpatient bed capacity. Yet, hospitals are oftenreluctant or unable to add capacity because of cost pressures, regulatoryconstraints, or a shortage of appropriate personnel. This makes it extremelyimportant to use existing capacity most efficiently. Increasing bed flexibilitycan be a key strategy in alleviating congestion. For example, hospitals varyin the degree to which they segregate patients by diagnostic type. While allhospitals have separate units for pediatrics, obstetrics and psychiatricpatients, some also have distinct units for clinical services such ascardiology, neurology, oncology, urology, neurosurgery, etc. Other
Easy PDF Creator is professional software to create PDF. If you wish to remove this line, buy it now.

11. Queueing Analysis in Healthcare 21
hospitals may make no such distinctions and simply designate all of these asmedical/surgical beds. What are the implications of these differing bedassignment policies on delays for beds?
As mentioned in section 2.1, service systems have economies of scaleand so in general, the less specialized the beds, the larger the pool of bedsthat can be used for any type of patient, and therefore the fewer beds shouldbe needed to achieve a given standard of delay. In other words, if onehospital has 100 general medical/surgical beds, and another has the same100 beds, but allocated into 10 distinct clinical services, each of which canonly be used for patients falling into the appropriate category, the secondhospital will likely have considerably longer delays for beds (which usuallyshow up as longer stays in the ED) and lower average occupancy levels thanthe first. This is pretty clear once you consider that by creating separatecategories of beds, there is the possibility of patients waiting for beds evenwhen beds are available if they are the “wrong” kind. This also happenswhen beds are distinguished by capability, for example, telemetry beds.
Clearly, there are many instances in which there are compelling clinicaland/or managerial reasons for maintaining particular patient types inspecialized units. From a medical perspective, there may be benefits derivedfrom having patients clustered by diagnostic categories in dedicated unitsmanaged and staffed by specialized nurses. These include shorter LOS,fewer adverse events and fewer readmits. Yet, many hospital managersbelieve that nurses can be successfully cross-trained and that increasing bedflexibility is ultimately in the best interests of patients by increasing speedyaccess to beds and minimizing the number of bed transfers. Byincorporating waiting times, percentage of “off-placements” and the effectson LOS, queueing models can be used to better evaluate the benefits ofgreater versus less specialization of beds or any other resource. This wouldbe done by simply modeling the general-use unit as a single multi-serverqueueing system fed and comparing the results to those from modeling eachdistinct service as an independent queue. In the latter case, the overall patientdelay can be obtained from an arrival rate weighted average of the individualqueue delays (see e.g. Green and Nguyen 2001).
4. ANALYSES OF FLEXIBLE CAPACITY:DETERMINING STAFFING LEVELS TO MEETTIME-VARYING DEMANDS
As mentioned previously, health care facilities generally experience verydifferent levels of demand over the day, over the week, and even over theyear. Many facilities adjust their staffing – e.g. physicians, nurses,
Easy PDF Creator is professional software to create PDF. If you wish to remove this line, buy it now.

22 Chapter 11
technician, housekeeping staff – in order to respond to the demands in atimely fashion at minimal cost. This is often done without the help of aquantitative model and can lead to an inefficient and ineffective allocation ofresources. Here we use the example of determining physician staffing levelsin an ED to illustrate how queueing models can be used to improveperformance in these types of situations.
4.1 Data collection and model choices
In order to use a queueing model to determine how to adjust staffing tomeet time-varying demands, it is first necessary to collect fairly detailed dataon the volume of demand that must be handled by that staff by time-of-dayand day-of-week. In collecting demand data, the goal is two-fold. First, andmost obviously, the data will be used to parameterize the queueing model.However, before that can be done, it must first be determined how manystaffing models are needed. That is, will staffing be identical for all days ofthe week or vary from day to day? For example, in a study conducted in theED of a mid-size urban hospital in New York City (Green et al 2005), theoverall volume varied from a low of 63 patients per day on Saturdays to ahigh of 72 per day on Monday. This degree of variation indicated that thethen-current policy of identical staffing levels for all days of the week waslikely suboptimal. However, it was deemed impractical to have a differentprovider schedule every day and so it was decided to use queueing analysesto develop two schedules: weekday and weekend. This required aggregatingED arrival data into these two groups. For each, demand data was thencollected for each hour of the day using the hospital’s admissions database tounderstand the degree of variation over the day (see Figure 11-5). This levelof detail also allows for the use of queuing analysis to determine the impactof different shift starting times on delays and/or staffing levels.
Easy PDF Creator is professional software to create PDF. If you wish to remove this line, buy it now.

11. Queueing Analysis in Healthcare 23
Average Arrival Patterns - 2002Weekdays compared with Weekends
0.0
1.0
2.0
3.0
4.0
5.0
6.0
1 2 3 4 5 6 7 8 9 10 11 12 13 14 15 16 17 18 19 20 21 22 23 24Hour of Day
Pat
ient
Arr
ival
spe
rH
our
WeekdaysWeekends
Figure 11-5 Average Arrival Patterns for the Allen Pavillion
Easy PDF Creator is professional software to create PDF. If you wish to remove this line, buy it now.
24 Chapter 11
A queueing model also requires an average provider service time perpatient, which must include the times of all activities related to a patient. Inthe ED, these activities include direct patient care, review of x-rays and labtests, phone calls, charting, and speaking with other providers or consults. Inmany, if not most, hospitals, these data are not routinely collected. At thetime of the study, provider service times were not recorded and had to beestimated indirectly from direct observation and historical productivity data.
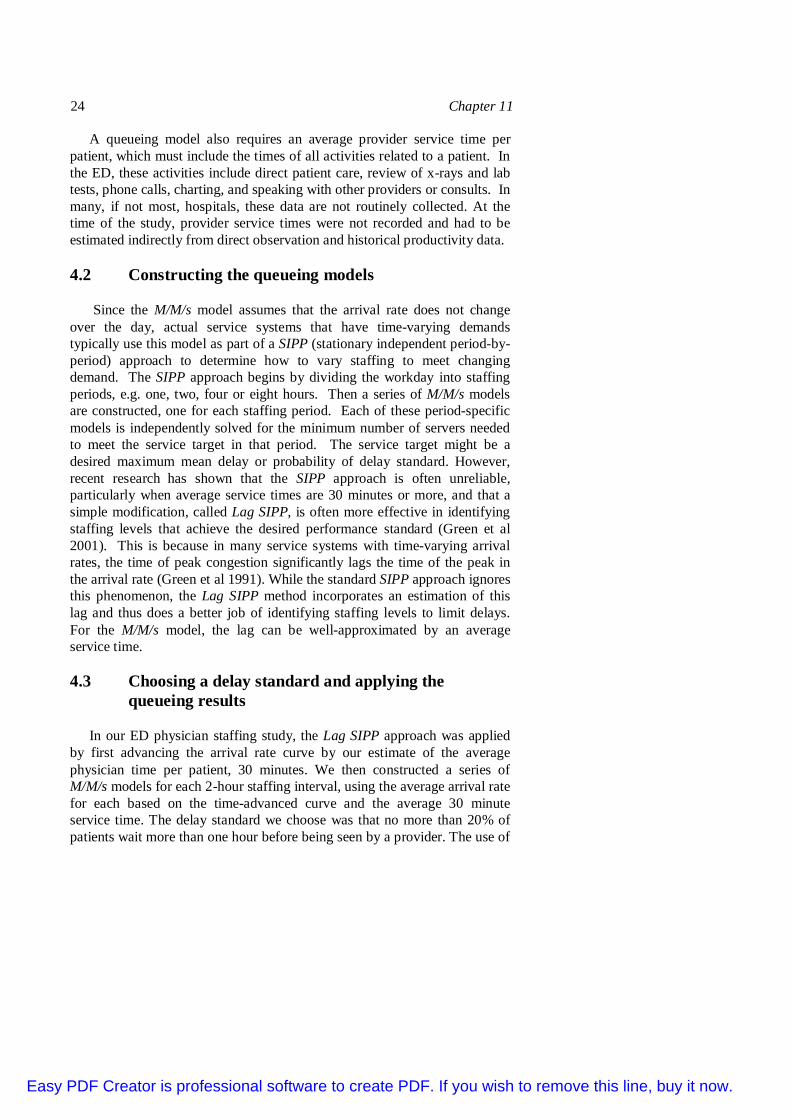
4.2 Constructing the queueing models
Since the M/M/s model assumes that the arrival rate does not changeover the day, actual service systems that have time-varying demandstypically use this model as part of a SIPP (stationary independent period-by-period) approach to determine how to vary staffing to meet changingdemand. The SIPP approach begins by dividing the workday into staffingperiods, e.g. one, two, four or eight hours. Then a series of M/M/s modelsare constructed, one for each staffing period. Each of these period-specificmodels is independently solved for the minimum number of servers neededto meet the service target in that period. The service target might be adesired maximum mean delay or probability of delay standard. However,recent research has shown that the SIPP approach is often unreliable,particularly when average service times are 30 minutes or more, and that asimple modification, called Lag SIPP, is often more effective in identifyingstaffing levels that achieve the desired performance standard (Green et al2001). This is because in many service systems with time-varying arrivalrates, the time of peak congestion significantly lags the time of the peak inthe arrival rate (Green et al 1991). While the standard SIPP approach ignoresthis phenomenon, the Lag SIPP method incorporates an estimation of thislag and thus does a better job of identifying staffing levels to limit delays.For the M/M/s model, the lag can be well-approximated by an averageservice time.
4.3 Choosing a delay standard and applying thequeueing results
In our ED physician staffing study, the Lag SIPP approach was appliedby first advancing the arrival rate curve by our estimate of the averagephysician time per patient, 30 minutes. We then constructed a series ofM/M/s models for each 2-hour staffing interval, using the average arrival ratefor each based on the time-advanced curve and the average 30 minuteservice time. The delay standard we choose was that no more than 20% ofpatients wait more than one hour before being seen by a provider. The use of
Easy PDF Creator is professional software to create PDF. If you wish to remove this line, buy it now.

11. Queueing Analysis in Healthcare 25
one hour is consistent with the time standards associated with emergent andurgent patient groups used in the National Hospital Ambulatory MedicalCare Survey (McCaig and Burt 2002). The 20% criterion reflects theapproximate percentage of non-urgent arrivals at the study institution.
The modeling results gave the number of ED physicians needed in eachof the 2-hour staffing intervals to meet the delay standard. In total, 58physician-hours were needed on weekdays to achieve the desired servicestandard, which represented an increase of 3 hours over the existing staffinglevel of 55 hours. Model runs for the weekend indicated that the targetperformance standard could be achieved with a total of 53 provider-hours.In both these cases, the queueing analyses suggested that some physicianhours should be switched from the middle of the night to much earlier in theday. A more subtle change suggested by the model was that the increase instaffing level to handle the morning surge in demand needed to occur earlierthan in the original schedule. Though resource limitations and physicianavailability prevented the staffing suggested by the queueing analyses frombeing implemented exactly, the insights gained from these analyses wereused to develop new provider schedules. More specifically, as a result of theanalyses one physician was moved from the overnight shift to an afternoonshift, 4 hours were moved from the weekends and added to the Monday andTuesday afternoon shifts (since these were the two busiest days of the week)and a shift that previously started at noon was moved to 10 AM. Thesechanges led to shorter average delays and a reduced fraction of patient thatleft before being seen by a physician.
5. USING QUEUEING MODELS TO IMPROVEHEALTHCARE DELIVERY: OPPORTUNITIESAND CHALLENGES
As this chapter has illustrated, service systems are very complex due toboth predictable and unpredictable sources of variability in both the demandsfor service and the time it takes to serve those demands. In healthcarefacilities, decisions on how and when to allocate staff, equipment, beds, andother resources in order to minimize delays experienced by patients are ofteneven more difficult than in other service industries due to cost constraints onthe one hand and the potentially serious adverse consequences of delays onthe other hand. Therefore, it is imperative that these decisions should be asinformed as possible and rely upon the best methodologies available to gaininsights into the impact of various alternatives.
Queueing theory is a very powerful and very practical tool becausequeueing models require relatively little data and are simple and fast to use.
Easy PDF Creator is professional software to create PDF. If you wish to remove this line, buy it now.

26 Chapter 11
Because of this simplicity and speed, they can be used to quickly evaluateand compare various alternatives for providing service. Beyond the mostbasic issue of determining how much capacity is needed to achieve aspecified service standard, queueing models can also be useful in gaininginsights on the appropriate degree of specialization or flexibility to use inorganizing resources, or on the impact of various priority schemes fordetermining service order among patients.
On the other hand, though queueing models don’t require much data, thetype of operational data needed as input to a queueing model is oftenunavailable in healthcare settings. Specifically, though demand or arrivaldata are often recorded, service times are usually not documented. So aqueueing analysis might require a data collection effort to estimate, forexample, the time that a care provider spends with a patient. However, asinformation technology systems become more prevalent in healthcare, thistype of data will be increasingly available.
In developing the data inputs for a model, it’s also very important tomake sure that all of the data needed for the model is collected and/orestimated. On the demand side, this means including all demands for care,including the ones that may not have been met in the past because ofinadequate capacity. For example, in a hospital ED, some patients who areforced to wait a long time before seeing a physician leave the ED beforebeing seen. If these are not captured in the data collection system that isbeing used to measure demands, the model will underestimate the capacityneeded to meet the desired performance standard. On the service side, it’simportant to include all of the time spent by the servers that is directlyassociated with caring for the patient. For a physician, this may includereviewing medical history and test results in addition to direct examinationof the patient.
In addition to data, a queueing analysis of a particular healthcare systemrequires the identification of one or more delay measures that are mostimportant to service excellence for that facility. These measures shouldreflect both patient perspectives as well as clinical realities. For example,though hospital ED arrivals with non-urgent problems may not require carewithin an hour or so from a clinical perspective, clearly very long waits tosee a physician will result in high levels of dissatisfaction, and perhaps evendeparture, which could ultimately lead to lost revenue. Trying to decide onwhat might be a reasonable delay standard in a specific healthcare facility isnot trivial due to a lack of knowledge of both patient expectations as well asthe impact of delays on clinical outcomes for most health problems.
In summary, healthcare managers are increasingly aware of the need touse their resources as efficiently as possible in order to continue to assurethat their institutions survive and prosper. This is particularly true in light of
Easy PDF Creator is professional software to create PDF. If you wish to remove this line, buy it now.

11. Queueing Analysis in Healthcare 27
the growing threat of sudden and severe demand surges due to outbreaks ofepidemics such as SARS and avian flu, or terrorist incidents. As this chapterhas attempted to demonstrate, effective capacity management is critical tothis objective as well as to improving patients’ ability to receive the mostappropriate care in a timely fashion. Yet, effective capacity managementmust deal with complexities such as tradeoffs between bed flexibility andquality of care, demands from competing sources and types of patients, time-varying demands, and the often differing perspectives of administrators,physicians, nurses and patients. All of these are chronic and pervasivechallenges affecting the ability of hospital managers to control the cost andimprove the quality of healthcare delivery. To meet these challenges,managers must be informed by operational and performance data and usethese data in models to gain insights that cannot be obtained from experienceand intuition alone. Queueing analysis is one of the most practical andeffective tools for understanding and aiding decision-making in managingcritical resources and should become as widely used in the healthcarecommunity as it is in the other major service sectors.
6. REFERENCES
Allen, A.O., 1978, Probability, statistics and queueing theory, with computer scienceapplications. New York, Academic Press.
Brecher, C. and Speizio, S., 1995, Privatization and Public Hospitals, Twentieth CenturyFund Press, N.Y.
Brewton, J.P., 1989, Teller staffing models, Financial Manager's Statement, July-August: 22-24.
Brigandi, A.J., Dargon, D.R., Sheehan, M.J. and Spencer III, T., 1994, AT&T's callprocessing simulator (CAPS) operational design for inbound call centers, Interfaces 24: 6-28.
Brockmeyer, E., Halstrom, H.L., and Jensen, A., 1948, The life and works of A.K. Erlang,Transactions of the Danish Academy of Technical Science 2.
Brusco, M.J., Jacobs, L.W., Bongiorno, R.J., Lyons, D.V. and Tang, B., 1995, Improvingpersonnel scheduling at airline stations, Operations Research, 43: 741-751.
Chelst, K. and Barlach, Z., 1981, Multiple unit dispatches in emergency services,Management Science, 27: 1390-1409.
Cobham, A., 1954, Priority assignment in waiting line problems, Operations Research, 2: 70-76.
Freeman, R.K., and Poland, R.L., 1997, Guidelines for Perinatal Care, 4th ed., AmericanCollege of Obstetricians and Gynecologists, Washington, D.C.
Green, L.V., Giulio, J., Green, R., and Soares, J., 2005, Using queueing theory to increase theeffectiveness of physician staffing in the emergency department, Academic EmergencyMedicine, to appear.
Green, L.V., 2003, How many hospital beds? Inquiry, 39: 400-412.Green, L.V., Kolesar, P.J., Svoronos, A., 2001, Improving the SIPP approach for staffing
service systems that have cyclic demands, Operations Research, 49: 549-564.
Easy PDF Creator is professional software to create PDF. If you wish to remove this line, buy it now.

28 Chapter 11
Green, L.V. and Nguyen, V., 2001, Strategies for cutting hospital beds: the impact on patientservice. Health Services Research, 36: 421-442.
Green, L.V., Kolesar, P.J., and Svoronos, A., 1991, Some effects of nonstationarity on multi-server Markovian queueing systems. Operations Research, 39: 502-511.
Green, L.V., and Kolesar, P.J., 1984, The feasibility of one-officer patrol in New York City,Management Science 20: 964-981.
Hall, R.W., 1990, Queueing Methods for Service and Manufacturing. New Jersey: PrenticeHall.
Holloran, T. J. and Byrne, J.E., 1986, United Airlines station manpower planning system,Interfaces, 16: 39-50.
Green, L.V., 2003, How many hospital beds? Inquiry, 39: 400-412.Institute of Medicine, Committee on Quality of Health Care in America, 2001, Crossing the
quality chasm: a new health system for the 21st century. Washington, D.C.: NationalAcademy Press.
Kaplan, E.H., Sprung, C.L., Shmueli, A., and Schneider, D., 1981. A methodology for theanalysis of comparability of services and financial impact of closure of obstetrics services.Medical Care, 19: 395-409.
Kim, S., Horowitz, I., Young, K.K., and Buckley, T.A., 1999, Analysis of capacitymanagement of the intensive care unit in a hospital, European Journal of OperationalResearch 115: 36-46.
Kolesar, P.J., Rider, K., Crabill, T., and Walker, W., 1975, A queueing linear programmingapproach to scheduling police cars, Operations Research, 23: 1045-1062.
Larson, R.C., 1972, Urban Police Patrol Analysis, MIT Press, Cambridge.McCaig, L.F., and Burt, C.W., 2004, National hospital ambulatory medical care survey: 2002
emergency department summary. Advance Data from Vital and Health Statistics, 340: 1-35.
Stern, H.I. and Hersh, M., 1980, Scheduling aircraft cleaning crews, Transportation Science,14: 277-291.
Taylor, P.E. and Huxley, S.J., 1989, A break from tradition for the San Francisco police:patrol officer scheduling using an optimization-based decision support system, Interfaces,19: 4-24.
Worthington, D.J., 1987, Queueing models for hospital waiting lists. Journal of theOperations Research Society, 38: 413-422.
Young, J.P., 1965, Stabilization of inpatient bed occupancy through control of admissions,Journal of the American Hospital Association, 39: 41-48.
Easy PDF Creator is professional software to create PDF. If you wish to remove this line, buy it now.