Embed Size (px)
Citation preview
QUEENSLAND UNIVERSITY OF TECHNOLOGY
SCHOOL OF NURSING
An examination of the relationships between lifestyle factors and mental health
among Australian midlife and older women
by
Qunyan Xu
RN, BNurs, MNurs
A thesis submitted in fulfilment of the requirement for the degree of
Doctorate of Philosophy
School of Nursing and Midwifery
Queensland University of Technology
2010


I
KEYWORDS
Lifestyle factors, BMI, smoking, alcohol use, physical activity, mental health,
anxiety, depression, midlife and older women, diabetes, longitudinal

II
STATEMENT OF ORIGINAL AUTHORSHIP
The work contained in this thesis has not been previously submitted to meet
requirement for an award at this or any other education institution. To the best of my
knowledge and belief, the thesis contains no materials previously published or
written by another person except where due reference is made.
Signature Date

III
RELATED PUBLICATIONS AND PRESENTATIONS
Portions of this thesis have been published in the following journal article:
Xu, Q., Anderson, D., & Courtney, M. (2010). A longitudinal study of the
relationship between lifestyle and mental health among midlife and older women in
Australia: findings from the Healthy Aging of Women Study. Health Care for
Women International,31(12), 1082-1096.
Xu, Q., Anderson, D., & Lurie-Beck, J. The effect of central obesity on
depression in general population: a systematic review and meta-analysis. Obesity
Research and Clinical Practice (under review).
Portions of this thesis have been presented at the following conferences:
Xu, Q., Anderson, D., & Barr, J. (2009). The relationships between mental
health and chronic disease risk factors among midlife and older women in Australia.
Paper presented at the 4th International Congress on Innovations in Nursing: Perth,
Australia.
Xu, Q., & Anderson, D. (2009). Psychological symptoms in cardiovascular
disease: a women’s study. Paper presented at Heart Foundation Conference:
Brisbane, Australia.
Xu, Q., & Anderson, D. (2009). Mental well-being and psychological factors
in relation to diabetes in midlife and older women: results from the Queensland
Healthy Ageing Women Study. Paper presented at the Australian Diabetes Educators
Associations, Queensland Branch Conference: Brisbane, Australia.
Xu, Q., Anderson, D., & Lang, C.P. (2010). The relationship between
diabetes and mental health in Australian midlife and older women. Paper presented
at Women’s Health 2010: the 18th Annual Congress: Washington D.C., America.

IV
Seminar presentation:
Xu, Q. (2008, Feb.). Mental health, quality of life and chronic disease in
midlife and older women: a literature review. Postgraduate Research Development
Forum, School of Nursing and Midwifery, Queensland University of Technology,
Brisbane.
Xu, Q. (2008, Jul.). Mental health, chronic disease and quality of life in
midlife and older women: methodology of the study. Postgraduate Research
Development Forum, School of Nursing and Midwifery, Queensland University of
Technology, Brisbane.

V
ACKNOWLEDGEMENT
My deepest gratitude goes first to my supervision team: principle supervisor,
Professor Debra Anderson, and associate supervisor, Professor Mary Courtney, for
their constant support and guidance at every stage of the PhD journey.
Second, I feel grateful to Queensland University of Technology and Chinese
Scholarship Council, who provided me with financial assistance to my doctoral
study. Without their support, studying a PhD would have been impossible.
Third, many thanks to my dear friends: Amy Mitchell, Amanda McGuire,
Cathryne Lang, Reimei Hong, Ralph Tramm and Yan Lou. I feel extremely fortunate
to have their company and moral support during the PhD journey.
Finally, my thanks would go to my beloved husband Yang for his loving
consideration through the three years.

VI
ABSTRACT
Background
It is well known that lifestyle factors including overweight/obesity, physical
inactivity, smoking and alcohol use are largely related with morbidity and mortality
of chronic diseases including diabetes and cardiovascular diseases. The effect of
lifestyle factors on people’s mental health who have a chronic disease is less defined
in the research. The World Health Organisation has defined health as “a state of
complete physical, mental and social well-being”. It is important, therefore to
develop an understanding of the relationships between lifestyle and mental health as
this may have implications for maximising the efficacy of health promotion in
people with chronic diseases.
Objectives
The overall aim of the research was to examine the relationships between
lifestyle factors and mental health among Australian midlife and older women.
Methodology
The current research measured four lifestyle factors including weight status,
physical activity, smoking and alcohol use. Three interconnecting studies were
undertaken to develop a comprehensive understanding of the relationships between
lifestyle factors and mental health. Study 1 investigated the longitudinal effect of
lifestyle factors on mental health by using midlife and older women randomly
selected from the community. Study 2 adopted a cross-sectional design, and
compared the effect of lifestyle factors on mental health between midlife and older
women with and without diabetes. Study 3 examined the mediating effect of
VII
self-efficacy in the relationships between lifestyle factors and mental health among
midlife and older women with diabetes. A questionnaire survey was chosen as the
means to gather information, and multiple linear regression analysis was conducted
as the primary statistical approach.
Results
The research showed that the four lifestyle factors including weight status,
physical activity, smoking and alcohol use did impact on mental health among
Australian midlife and older women. First, women with a higher BMI had lower
levels of mental health than women with normal weight, but as women age, the
mental health of women who were overweight and obese becomes better than that of
women with normal weight. Second, women who were physically active had higher
levels of mental health than those who were not. Third, smoking adversely impacted
on women’s mental health. Finally, those who were past-drinkers had less anxiety
symptoms than women who were non-drinkers as they age.
Women with diabetes appeared to have lower levels of mental health
compared to women without. However, the disparities of mental health between two
groups were confounded by low levels of physical activity and co-morbidities. This
finding underlines the effect of physical activity on women’s mental health, and
highlights the potential of reducing the gap of mental health by promoting physical
activity. In addition, self-efficacy was shown to be the mediator of the relationships
between BMI, physical activity and depression, suggesting that enhancing people’s
self-efficacy may be useful for mental health improvement.
VIII
Conclusions
In conclusion, Australian midlife and older women who live with a healthier
lifestyle have higher levels of mental health. It is suggested that strategies aiming to
improve people’s mental health may be more effective if they focus on enhancing
people’s self-efficacy levels. This study has implications to both health education
and policy development. It indicates that health professionals may need to consider
clients’ mental health as an integrated part of lifestyle changing process. Furthermore,
given that lifestyle factors impact on both physical and mental health, lifestyle
modification should continue to be the focus of policy development.

IX
TABLE OF CONTENTS
KEYWORDSKEYWORDSKEYWORDSKEYWORDS............................................................................................................................................................................................................................................................................................................................................................................................................................................................ IIII
STATEMENTSTATEMENTSTATEMENTSTATEMENT OFOFOFOF ORIGINALORIGINALORIGINALORIGINAL AUTHORSHIPAUTHORSHIPAUTHORSHIPAUTHORSHIP.................................................................................................................................................................................................................................................................... IIIIIIII
RELATEDRELATEDRELATEDRELATED PUBLICATIONSPUBLICATIONSPUBLICATIONSPUBLICATIONS ANDANDANDAND PRESENTATIONSPRESENTATIONSPRESENTATIONSPRESENTATIONS........................................................................................................................................................................................................................IIIIIIIIIIII
ACKNOWLEDGEMENTACKNOWLEDGEMENTACKNOWLEDGEMENTACKNOWLEDGEMENT........................................................................................................................................................................................................................................................................................................................................................................................VVVV
ABSTRACTABSTRACTABSTRACTABSTRACT............................................................................................................................................................................................................................................................................................................................................................................................................................................................VIVIVIVI
TABLETABLETABLETABLE OFOFOFOF CONTENTSCONTENTSCONTENTSCONTENTS............................................................................................................................................................................................................................................................................................................................................................................................IXIXIXIX
LISTLISTLISTLIST OFOFOFOF TABLESTABLESTABLESTABLES.................................................................................................................................................................................................................................................................................................................................................................................................................... XIIIXIIIXIIIXIII
LISTLISTLISTLIST OFOFOFOF FIGURESFIGURESFIGURESFIGURES........................................................................................................................................................................................................................................................................................................................................................................................................ XVIIXVIIXVIIXVII
LISTLISTLISTLIST OFOFOFOF APPENDICESAPPENDICESAPPENDICESAPPENDICES....................................................................................................................................................................................................................................................................................................................................................................................XIXXIXXIXXIX
ChapterChapterChapterChapter 1:1:1:1: IIIIntroductionntroductionntroductionntroduction................................................................................................................................................................................................................................................................................................................................................................................1111
OverviewOverviewOverviewOverview ofofofof thethethethe ResearchResearchResearchResearch............................................................................................................................................................................................................................................................................................................................................................................................1111
BackgroundBackgroundBackgroundBackground....................................................................................................................................................................................................................................................................................................................................................................................................................................................................................1111
DefinitionsDefinitionsDefinitionsDefinitions andandandand TermsTermsTermsTerms....................................................................................................................................................................................................................................................................................................................................................................................................................8888
AimsAimsAimsAims ofofofof thethethethe ResearchResearchResearchResearch................................................................................................................................................................................................................................................................................................................................................................................................................11111111
ResearchResearchResearchResearch PlanPlanPlanPlan............................................................................................................................................................................................................................................................................................................................................................................................................................................................ 11111111
SignificanceSignificanceSignificanceSignificance ofofofof thethethethe ResearchResearchResearchResearch.................................................................................................................................................................................................................................................................................................................................................................... 12121212
StructureStructureStructureStructure ofofofof thethethethe ThesisThesisThesisThesis........................................................................................................................................................................................................................................................................................................................................................................................................12121212
ChapterChapterChapterChapter SummarySummarySummarySummary....................................................................................................................................................................................................................................................................................................................................................................................................................................13131313
ChapterChapterChapterChapter 2:2:2:2: LiteratureLiteratureLiteratureLiterature ReviewReviewReviewReview.................................................................................................................................................................................................................................................................................................................................... 15151515
BriefBriefBriefBrief IntroductionIntroductionIntroductionIntroduction.................................................................................................................................................................................................................................................................................................................................................................................................................................... 15151515
WomenWomenWomenWomen andandandandMentalMentalMentalMental HealthHealthHealthHealth........................................................................................................................................................................................................................................................................................................................................................................ 15151515
TheoreticalTheoreticalTheoreticalTheoretical BackgroundBackgroundBackgroundBackground................................................................................................................................................................................................................................................................................................................................................................................................18181818
ConceptualConceptualConceptualConceptual andandandand TheoreticalTheoreticalTheoreticalTheoretical FrameworkFrameworkFrameworkFramework............................................................................................................................................................................................................................................................................................ 21212121Health Promotion.................................................................................................................. 21The Health Belief Model........................................................................................................ 23The Theory of Planned Behaviour.......................................................................................... 25The Transtheoretical Model................................................................................................... 27The Social Cognitive Theory................................................................................................... 29Appraisal of Social Cognitive Theory and Other Psychological Models.................................... 34
MultipleMultipleMultipleMultiple LifestyleLifestyleLifestyleLifestyle Factors,Factors,Factors,Factors, DiabetesDiabetesDiabetesDiabetes andandandandMentalMentalMentalMental HealthHealthHealthHealth............................................................................................................................................................................................ 36363636Obesity and Mental Health.................................................................................................... 38Physical Activity and Mental Health....................................................................................... 46Smoking and Mental Health...................................................................................................52Alcohol Use and Mental Health..............................................................................................57Diabetes and Mental Health...................................................................................................63
ExaminingExaminingExaminingExamining thethethethe LimitationsLimitationsLimitationsLimitations ofofofof thethethethe PreviousPreviousPreviousPrevious ResearchResearchResearchResearch................................................................................................................................................................................................................ 67676767
ConceptualConceptualConceptualConceptual FrameworkFrameworkFrameworkFramework....................................................................................................................................................................................................................................................................................................................................................................................................69696969

X
AimsAimsAimsAims ofofofof thethethethe ResearchResearchResearchResearch................................................................................................................................................................................................................................................................................................................................................................................................................70707070Aim 1: The Relationships Between Lifestyle Factors and Mental Health.................................. 70Aim 2: Examining the Mediating Role of Self-efficacy............................................................. 71
ResearchResearchResearchResearch QuestionsQuestionsQuestionsQuestions........................................................................................................................................................................................................................................................................................................................................................................................................................ 72727272
ChapterChapterChapterChapter SummarySummarySummarySummary....................................................................................................................................................................................................................................................................................................................................................................................................................................72727272
ChapterChapterChapterChapter 3:3:3:3: MethodologyMethodologyMethodologyMethodology................................................................................................................................................................................................................................................................................................................................................................75757575
IntroductionIntroductionIntroductionIntroduction........................................................................................................................................................................................................................................................................................................................................................................................................................................................................75757575
AnAnAnAn OverviewOverviewOverviewOverview ofofofof thethethetheWomenWomenWomenWomen’’’’ssss HealthHealthHealthHealth StudiesStudiesStudiesStudies............................................................................................................................................................................................................................................................75757575
LinkageLinkageLinkageLinkage ofofofof thethethethe CurrentCurrentCurrentCurrent ResearchResearchResearchResearchWithWithWithWith HOW,HOW,HOW,HOW,WWPWWPWWPWWPandandandand CDWWPCDWWPCDWWPCDWWP.................................................................................................................................... 77777777
MethodologyMethodologyMethodologyMethodology ofofofof StudyStudyStudyStudy 1111............................................................................................................................................................................................................................................................................................................................................................................................ 78787878Design................................................................................................................................... 78Sample.................................................................................................................................. 78Ethical Clearance................................................................................................................... 80Measures...............................................................................................................................80Statistical Analysis..................................................................................................................89
MethodologyMethodologyMethodologyMethodology ofofofof StudyStudyStudyStudy 2222............................................................................................................................................................................................................................................................................................................................................................................................ 91919191Design................................................................................................................................... 91Sample.................................................................................................................................. 91Ethical Clearance................................................................................................................... 92Measures...............................................................................................................................93Statistical Analysis..................................................................................................................97
MethodologyMethodologyMethodologyMethodology ofofofof StudyStudyStudyStudy 3333............................................................................................................................................................................................................................................................................................................................................................................................ 99999999Design................................................................................................................................... 99Sample.................................................................................................................................. 99Ethical Clearance................................................................................................................... 99Measures.............................................................................................................................100Statistical Analysis................................................................................................................106
ChapterChapterChapterChapter SummarySummarySummarySummary............................................................................................................................................................................................................................................................................................................................................................................................................................109109109109
ChapterChapterChapterChapter 4444 RRRResultsesultsesultsesults ofofofof StudyStudyStudyStudy 1:1:1:1: thethethethe relationshipsrelationshipsrelationshipsrelationships betweenbetweenbetweenbetween lifestylelifestylelifestylelifestyle factorsfactorsfactorsfactors andandandandmentalmentalmentalmental healthhealthhealthhealth amongamongamongamong AustralianAustralianAustralianAustralian midlifemidlifemidlifemidlife andandandand olderolderolderolder womenwomenwomenwomen................................................................................................................................ 111111111111
IntroductionIntroductionIntroductionIntroduction................................................................................................................................................................................................................................................................................................................................................................................................................................................................111111111111
ResultsResultsResultsResults ofofofof StudyStudyStudyStudy 1111............................................................................................................................................................................................................................................................................................................................................................................................................................ 111111111111Characteristics of Sample.....................................................................................................112The Correlations Among Lifestyle Factors.............................................................................115Multiple Linear Regressions: Lifestyle Factors Predicting Mental Health at Baseline..............117Multiple Linear Regressions: the Prospective Relationships Between Lifestyle Factors andMental Health......................................................................................................................128Reflection on Research Questions........................................................................................ 142
ChapterChapterChapterChapter 5555 RRRResultsesultsesultsesults ofofofof StudyStudyStudyStudy 2:2:2:2: thethethethe relationshipsrelationshipsrelationshipsrelationships betweenbetweenbetweenbetween lifestylelifestylelifestylelifestyle factorsfactorsfactorsfactors andandandandmentalmentalmentalmental healthhealthhealthhealth amongamongamongamong AustralianAustralianAustralianAustralian midlifemidlifemidlifemidlife andandandand olderolderolderolder womenwomenwomenwomen withwithwithwith andandandand withoutwithoutwithoutwithoutdiabetesdiabetesdiabetesdiabetes............................................................................................................................................................................................................................................................................................................................................................................................................................................................ 145145145145
IntroductionIntroductionIntroductionIntroduction................................................................................................................................................................................................................................................................................................................................................................................................................................................................145145145145
ResultsResultsResultsResults ofofofof StudyStudyStudyStudy 2222............................................................................................................................................................................................................................................................................................................................................................................................................................ 146146146146Description of Sociodemographic Characteristics of the Sample........................................... 146Number of Co-morbidities................................................................................................... 150

XI
The Description and Comparison of Mental Health and Lifestyle Factors of WomenWith andWithout Diabetes.................................................................................................................150The Difference of Eight Scales and Composite Score in SF-36 Between WomenWith andWithout Diabetes.................................................................................................................157The Binary Analysis Between Independent Variables and Dependent Variables.................... 160Predicting Mental Health: Hierarchical Regression Analysis.................................................. 165Reflection on Research Questions........................................................................................ 175
ChapterChapterChapterChapter 6666 RRRResultsesultsesultsesults ofofofof StudyStudyStudyStudy 3:3:3:3: analysisanalysisanalysisanalysis ofofofof tttthehehehe mediationmediationmediationmediation ofofofof self-efficacyself-efficacyself-efficacyself-efficacy inininin thethethetherelationshipsrelationshipsrelationshipsrelationships betweenbetweenbetweenbetween liefstyleliefstyleliefstyleliefstyle factorsfactorsfactorsfactors andandandand mentalmentalmentalmental healthhealthhealthhealth inininin midlifemidlifemidlifemidlife andandandand olderolderolderolderwomenwomenwomenwomen withwithwithwith diabetesdiabetesdiabetesdiabetes........................................................................................................................................................................................................................................................................................................................................................................ 177177177177
IntroductionIntroductionIntroductionIntroduction................................................................................................................................................................................................................................................................................................................................................................................................................................................................177177177177
ResultsResultsResultsResults ofofofof StudyStudyStudyStudy 3333............................................................................................................................................................................................................................................................................................................................................................................................................................ 179179179179The Correlations Between Mental Health and Lifestyle Factors.............................................179The Correlations Between Mental Health and Self-Efficacy in Managing Chronic Disease......180Associations Between Self-Efficacy in Managing Chronic Disease and Lifestyle Factors......... 190The Associations of Self-EfficacyWith Sociodemographic Factors and Other Confounders....192Mediation Analysis...............................................................................................................194Reflection on the Research Questions.................................................................................. 201
ChapterChapterChapterChapter 7:7:7:7: DiscussionDiscussionDiscussionDiscussion............................................................................................................................................................................................................................................................................................................................................................................203203203203
IntroductionIntroductionIntroductionIntroduction................................................................................................................................................................................................................................................................................................................................................................................................................................................................203203203203
TheTheTheThe LifestylesLifestylesLifestylesLifestyles ofofofof AustralianAustralianAustralianAustralianMidlifeMidlifeMidlifeMidlife andandandand OlderOlderOlderOlderWomenWomenWomenWomen............................................................................................................................................................................................203203203203
TheTheTheThe EffectEffectEffectEffect ofofofof LifestyleLifestyleLifestyleLifestyle FactorsFactorsFactorsFactors ononononMentalMentalMentalMental HealthHealthHealthHealth ininininMidlifeMidlifeMidlifeMidlife andandandand OlderOlderOlderOlderWomenWomenWomenWomen............................................206206206206Overweight and Obesity and Mental Health.........................................................................206Physical Activity and Mental health......................................................................................209Smoking and Mental Health.................................................................................................211Alcohol Use and Mental Health............................................................................................213Age and Mental Health........................................................................................................ 216
TheTheTheThe EffectsEffectsEffectsEffects ofofofof LifestyleLifestyleLifestyleLifestyle FactorsFactorsFactorsFactors onononon thethethetheMentalMentalMentalMental HealthHealthHealthHealth ofofofofWomenWomenWomenWomenWithWithWithWith andandandandWithoutWithoutWithoutWithoutDiabetesDiabetesDiabetesDiabetes........................................................................................................................................................................................................................................................................................................................................................................................................................................................................................216216216216
TheTheTheTheMediatingMediatingMediatingMediating EffectEffectEffectEffect ofofofof Self-Efficacy,Self-Efficacy,Self-Efficacy,Self-Efficacy, MentalMentalMentalMental HealthHealthHealthHealth andandandand LifestyleLifestyleLifestyleLifestyle FactorsFactorsFactorsFactors....................................................................219219219219
Self-Efficacy,Self-Efficacy,Self-Efficacy,Self-Efficacy, DurationDurationDurationDuration ofofofof DiabetesDiabetesDiabetesDiabetes andandandandUseUseUseUse ofofofof AntidepressantsAntidepressantsAntidepressantsAntidepressants.................................................................................................................................... 221221221221
TheoreticalTheoreticalTheoreticalTheoretical ReflectionReflectionReflectionReflection....................................................................................................................................................................................................................................................................................................................................................................................................222222222222
StrengthsStrengthsStrengthsStrengths andandandand LimitationsLimitationsLimitationsLimitations............................................................................................................................................................................................................................................................................................................................................................................227227227227
ChapterChapterChapterChapter 8:8:8:8: ConclusionsConclusionsConclusionsConclusions....................................................................................................................................................................................................................................................................................................................................................................231231231231
IntroductionIntroductionIntroductionIntroduction................................................................................................................................................................................................................................................................................................................................................................................................................................................................231231231231
SummarySummarySummarySummary ofofofof MajorMajorMajorMajor FindingsFindingsFindingsFindings................................................................................................................................................................................................................................................................................................................................................................231231231231Effect of Lifestyle Factors on Mental Health in Midlife and Older Women.............................231Effect of Lifestyle Factors on Mental Health in Midlife and Older WomenWith and WithoutDiabetes.............................................................................................................................. 232The Mediating Role of Self-Efficacy in the Associations Between Lifestyle Factors and MentalHealth AmongMidlife and Older WomenWith Diabetes...................................................... 233
ImplicationsImplicationsImplicationsImplications................................................................................................................................................................................................................................................................................................................................................................................................................................................................ 233233233233Implications of the Study..................................................................................................... 233Implications for Health Education........................................................................................ 235Implications for Policy Making..............................................................................................236Implications for Future Research..........................................................................................237

XII
ConclusionConclusionConclusionConclusionssss....................................................................................................................................................................................................................................................................................................................................................................................................................................................................238238238238
ReferencesReferencesReferencesReferences............................................................................................................................................................................................................................................................................................................................................................................................................................................ 240240240240
XIII
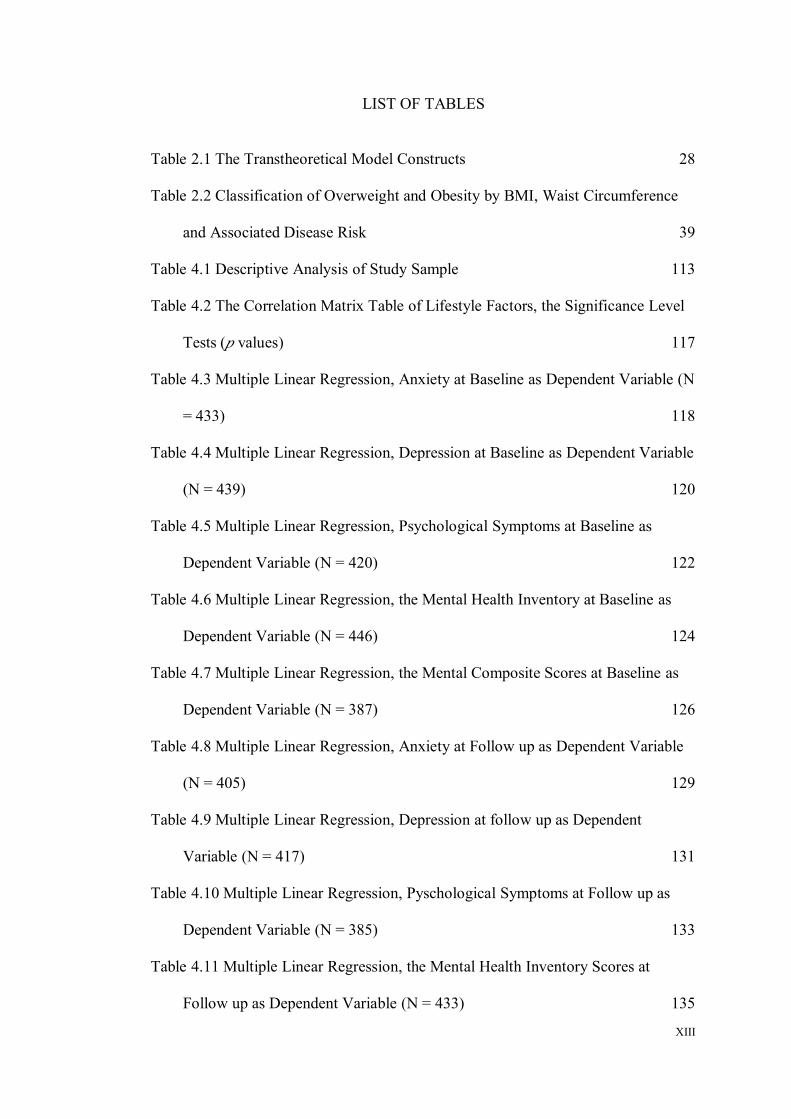
LIST OF TABLES
Table 2.1 The Transtheoretical Model Constructs 28
Table 2.2 Classification of Overweight and Obesity by BMI, Waist Circumference
and Associated Disease Risk 39
Table 4.1 Descriptive Analysis of Study Sample 113
Table 4.2 The Correlation Matrix Table of Lifestyle Factors, the Significance Level
Tests (p values) 117
Table 4.3 Multiple Linear Regression, Anxiety at Baseline as Dependent Variable (N
= 433) 118
Table 4.4 Multiple Linear Regression, Depression at Baseline as Dependent Variable
(N = 439) 120
Table 4.5 Multiple Linear Regression, Psychological Symptoms at Baseline as
Dependent Variable (N = 420) 122
Table 4.6 Multiple Linear Regression, the Mental Health Inventory at Baseline as
Dependent Variable (N = 446) 124
Table 4.7 Multiple Linear Regression, the Mental Composite Scores at Baseline as
Dependent Variable (N = 387) 126
Table 4.8 Multiple Linear Regression, Anxiety at Follow up as Dependent Variable
(N = 405) 129
Table 4.9 Multiple Linear Regression, Depression at follow up as Dependent
Variable (N = 417) 131
Table 4.10 Multiple Linear Regression, Pyschological Symptoms at Follow up as
Dependent Variable (N = 385) 133
Table 4.11 Multiple Linear Regression, the Mental Health Inventory Scores at
Follow up as Dependent Variable (N = 433) 135
XIV
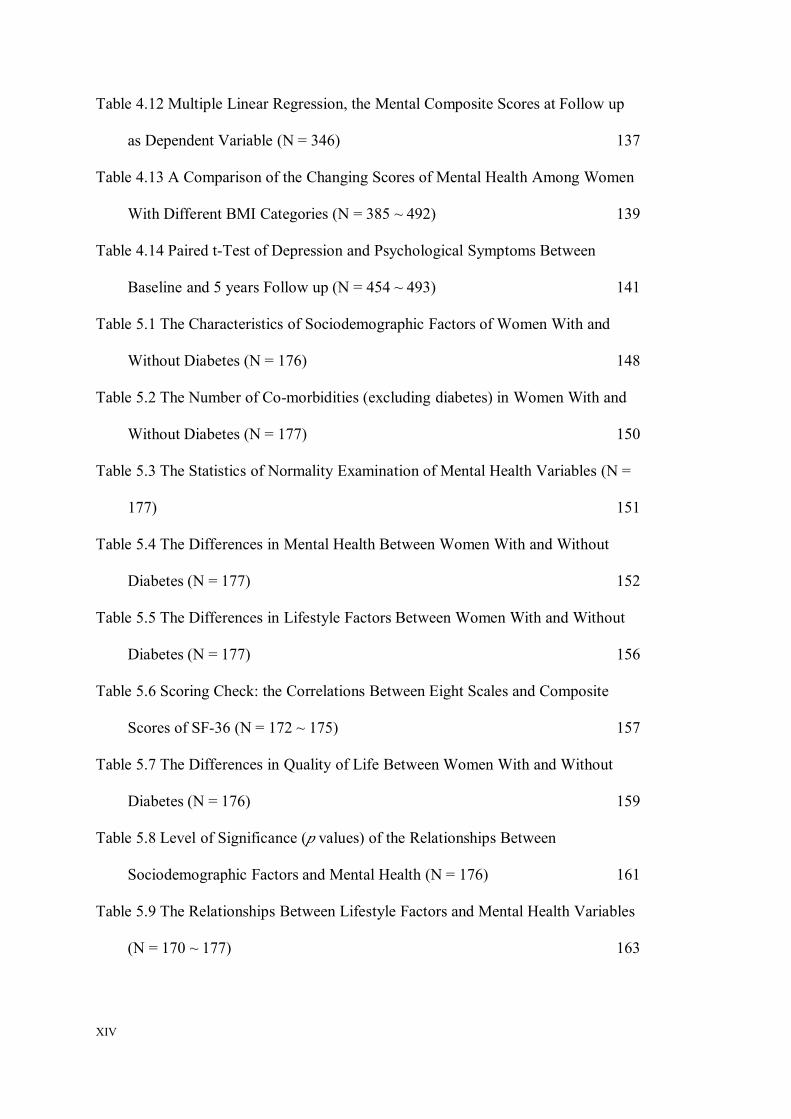
Table 4.12 Multiple Linear Regression, the Mental Composite Scores at Follow up
as Dependent Variable (N = 346) 137
Table 4.13 A Comparison of the Changing Scores of Mental Health Among Women
With Different BMI Categories (N = 385 ~ 492) 139
Table 4.14 Paired t-Test of Depression and Psychological Symptoms Between
Baseline and 5 years Follow up (N = 454 ~ 493) 141
Table 5.1 The Characteristics of Sociodemographic Factors of Women With and
Without Diabetes (N = 176) 148
Table 5.2 The Number of Co-morbidities (excluding diabetes) in Women With and
Without Diabetes (N = 177) 150
Table 5.3 The Statistics of Normality Examination of Mental Health Variables (N =
177) 151
Table 5.4 The Differences in Mental Health Between Women With and Without
Diabetes (N = 177) 152
Table 5.5 The Differences in Lifestyle Factors Between Women With and Without
Diabetes (N = 177) 156
Table 5.6 Scoring Check: the Correlations Between Eight Scales and Composite
Scores of SF-36 (N = 172 ~ 175) 157
Table 5.7 The Differences in Quality of Life Between Women With and Without
Diabetes (N = 176) 159
Table 5.8 Level of Significance (p values) of the Relationships Between
Sociodemographic Factors and Mental Health (N = 176) 161
Table 5.9 The Relationships Between Lifestyle Factors and Mental Health Variables
(N = 170 ~ 177) 163
XV
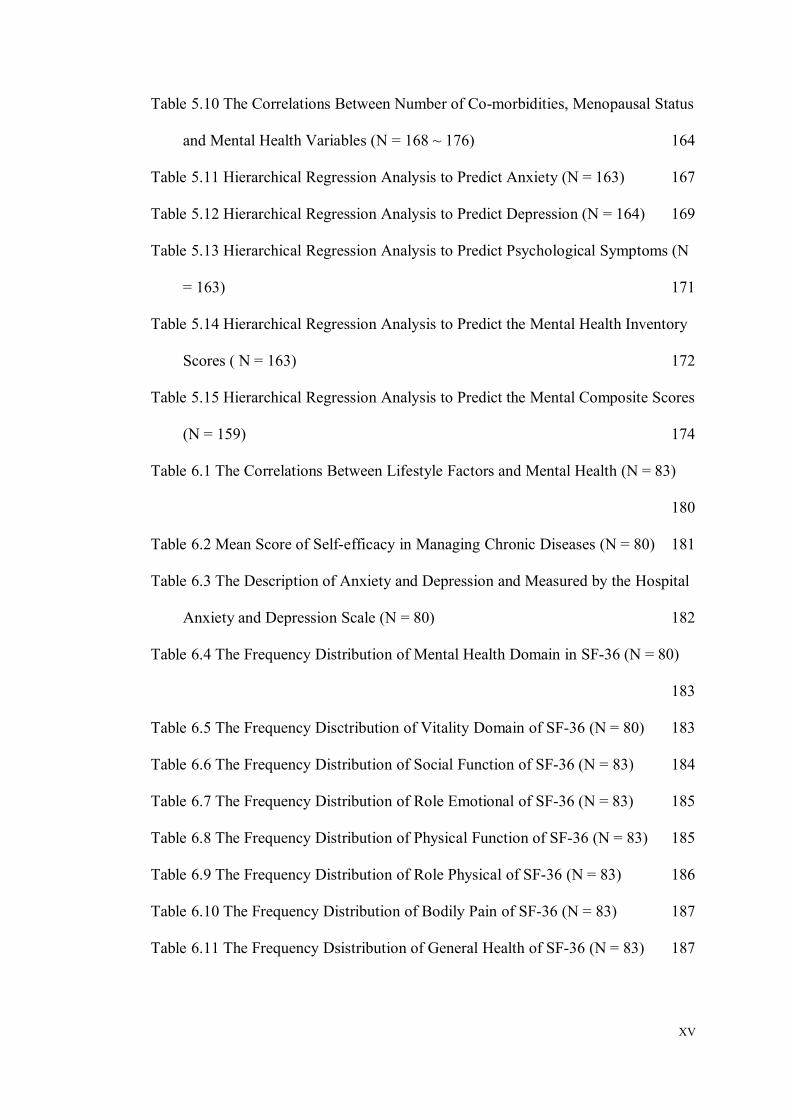
Table 5.10 The Correlations Between Number of Co-morbidities, Menopausal Status
and Mental Health Variables (N = 168 ~ 176) 164
Table 5.11 Hierarchical Regression Analysis to Predict Anxiety (N = 163) 167
Table 5.12 Hierarchical Regression Analysis to Predict Depression (N = 164) 169
Table 5.13 Hierarchical Regression Analysis to Predict Psychological Symptoms (N
= 163) 171
Table 5.14 Hierarchical Regression Analysis to Predict the Mental Health Inventory
Scores ( N = 163) 172
Table 5.15 Hierarchical Regression Analysis to Predict the Mental Composite Scores
(N = 159) 174
Table 6.1 The Correlations Between Lifestyle Factors and Mental Health (N = 83)
180
Table 6.2 Mean Score of Self-efficacy in Managing Chronic Diseases (N = 80) 181
Table 6.3 The Description of Anxiety and Depression and Measured by the Hospital
Anxiety and Depression Scale (N = 80) 182
Table 6.4 The Frequency Distribution of Mental Health Domain in SF-36 (N = 80)
183
Table 6.5 The Frequency Disctribution of Vitality Domain of SF-36 (N = 80) 183
Table 6.6 The Frequency Distribution of Social Function of SF-36 (N = 83) 184
Table 6.7 The Frequency Distribution of Role Emotional of SF-36 (N = 83) 185
Table 6.8 The Frequency Distribution of Physical Function of SF-36 (N = 83) 185
Table 6.9 The Frequency Distribution of Role Physical of SF-36 (N = 83) 186
Table 6.10 The Frequency Distribution of Bodily Pain of SF-36 (N = 83) 187
Table 6.11 The Frequency Dsistribution of General Health of SF-36 (N = 83) 187

XVI
Table 6.12 The Correlations Between Eight Scales of SF-36 and Two Composite
Scores (N = 83) 189
Table 6.13 Associations Between Self-efficacy in Managing Chronic Diseases and
Mental Health (N = 83) 190
Table 6.14 Associations Between Self-efficacy in Managing Chronic Diseases and
Lifestyle Factors (N = 80) 191
Table 6.15 The Differences of Self-efficacy in Managing Chronic Diseases in
Relation to Sociodemographic Factors and Other Confounders (N = 77 ~ 83)
193
Table 6.16 Multiple Linear Regression, Using Depression to Predict Physical
Activity (N = 70) 197
Table 6.17 Multiple Linear Regression, Using Depression to Predict BMI (N = 70)
198
Table 6.18 Multiple Linear Regression, Using BMI to Predict Depression (N = 72)
200
Table 6.19 Multiple Linear Regression, Using Physical Activity to Predict
Depression (N = 70) 201
XVII
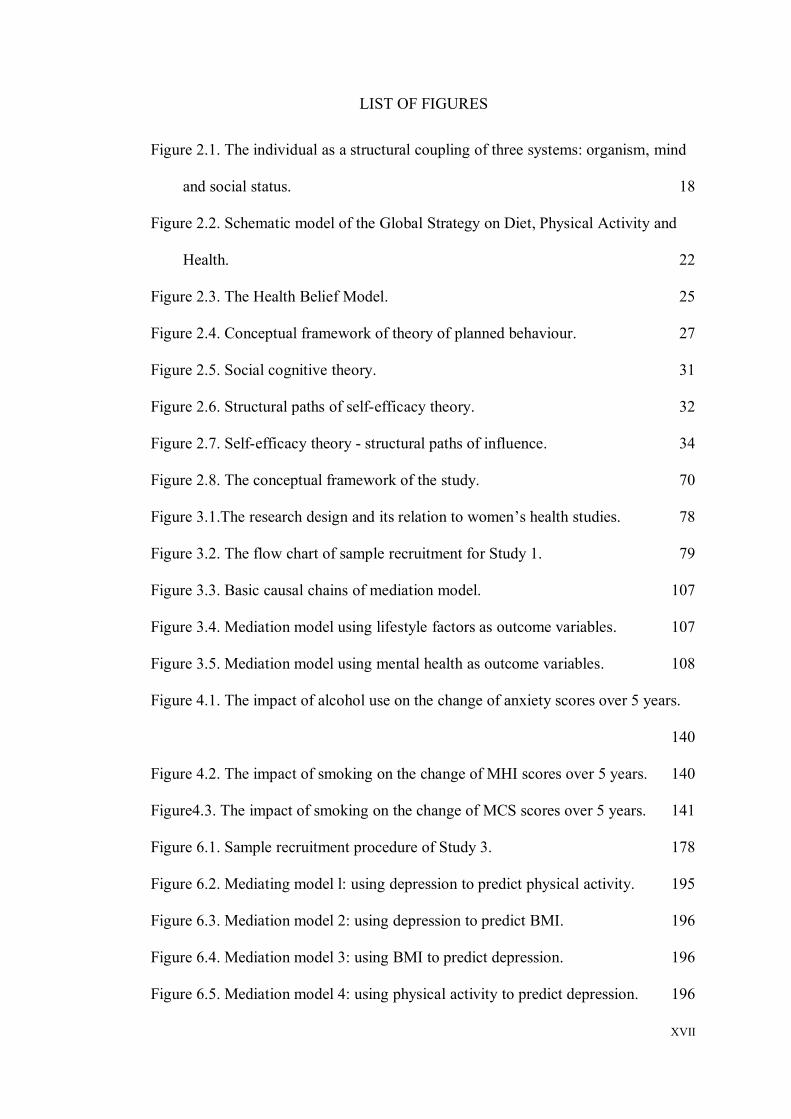
LIST OF FIGURES
Figure 2.1. The individual as a structural coupling of three systems: organism, mind
and social status. 18
Figure 2.2. Schematic model of the Global Strategy on Diet, Physical Activity and
Health. 22
Figure 2.3. The Health Belief Model. 25
Figure 2.4. Conceptual framework of theory of planned behaviour. 27
Figure 2.5. Social cognitive theory. 31
Figure 2.6. Structural paths of self-efficacy theory. 32
Figure 2.7. Self-efficacy theory - structural paths of influence. 34
Figure 2.8. The conceptual framework of the study. 70
Figure 3.1.The research design and its relation to women’s health studies. 78
Figure 3.2. The flow chart of sample recruitment for Study 1. 79
Figure 3.3. Basic causal chains of mediation model. 107
Figure 3.4. Mediation model using lifestyle factors as outcome variables. 107
Figure 3.5. Mediation model using mental health as outcome variables. 108
Figure 4.1. The impact of alcohol use on the change of anxiety scores over 5 years.
140
Figure 4.2. The impact of smoking on the change of MHI scores over 5 years. 140
Figure4.3. The impact of smoking on the change of MCS scores over 5 years. 141
Figure 6.1. Sample recruitment procedure of Study 3. 178
Figure 6.2. Mediating model l: using depression to predict physical activity. 195
Figure 6.3. Mediation model 2: using depression to predict BMI. 196
Figure 6.4. Mediation model 3: using BMI to predict depression. 196
Figure 6.5. Mediation model 4: using physical activity to predict depression. 196
XVIII
Figure 7.1. A conceptual framework for the relationships between lifestyle factors
and mental health among Australian midlife and older women. 226

XIX
LIST OF APPENDICES
Appendix A: A Comparison of Physical Activity Among Different BMI Categories
280
Appendix B: Medical Outcomes Study Short Form (SF-36) 281
Appendix C: Greene’s Climacteric Scale 284
Appendix D: The Hospital Anxiety and Depression Scale 285
Appendix E: Self-efficacy in Managing Chronic Diseases 287
Appendix F: The Seattle Physical Activity Questionnaire 288
Appendix G: Ethical Approval 289

1
CHAPTER 1: INTRODUCTION
Overview of the Research
The goal of this research is to develop a comprehensive understanding about
relationships between lifestyle risk factors and mental health among Australian
women in midlife and older. Popular understanding variably places ‘midlife’ at 45 to
64 years of age, ‘old’ at 65 to 84 years and ‘oldest old’ at 85 years and beyond. In
the current research, the sample population are mostly consisted of women at their
middle life, and it also incorporates a small percentage of old women. It is expected
that the knowledge generated from this research will contribute to the development
of strategies that are effective in facilitating change of unhealthy lifestyle for such
women.
Background
The last century witnessed a considerable increase in the proportion of
mature age Australians (defined as 50 to 59 years of age) amongst the overall
national population. As revealed by the sixth edition of Australian Social Trend
(People in their 50s: then and now, p. 7): the number of middle aged Australians has
climbed up from 1.5 million to 2.2 million, with an equivalent increase rate for men
and women (Australian Bureau of Statistics, 2006d). In Australia, due to the low
fertility rate and increased life expectancy, the number of Australians within this age
group is projected to increase continuously. The life expectancy of women at age 50
has increased by 4 years in 2002-2004, up from 81 years in 1980-1982 (Australian
Bureau of Statistics, 2006d); however, the life expectancy without disability has not
increased proportionally (Australian Institute of Health and Welfare, 2004). The

2
above described circumstances make middle aged population significant in
government policy development in terms of promoting healthy ageing of the society.
Prior to the description of relevant health issues among midlife and older
women, a brief overview of the socioeconomic context where these women live is
provided to allow a rich understanding of their health profile. Along with the overall
improvement of Australians’ qualifications, midlife women have also become better
educated. The proportion of midlife women holding a bachelor’s degree and beyond
has increased from 3% in 1984 to 17% in 2005 (Australian Bureau of Statistics,
2006d). The advancement of women’s education levels certainly has a profound
impact on their participation in work force, and subsequently on their income and
wealth. In 1984, it was reported that 37% midlife women were in employment, and
by 2005, the corresponding figure goes up to 47%. With respect to financial
circumstance, the Australian Survey of Income and Housing 2003-2004 indicated
that middle aged group (45-54 years) had the highest income of $1,400 per week in
all age groups and gradually levelled off as people get older. In spite of this,
household net wealth continued to increase until reaching the summit of $740,000 in
people aged from 60 to 64 years of age (Australian Bureau of Statistics, 2006d, see p.
146). In short, middle aged women live in a financially stable environment which
allows them to have better access to services and products required in daily life.
The prevalence of chronic diseases has been increasing with an alarming rate
among the aged population. As revealed by the National Health Survey (2007-2008),
the average number of the National Health Priority Area (NHPA) conditions, which
include arthritis and osteoporosis, asthma, cancer, diabetes, cardiovascular disease,
injury, mental health and obesity, increased steadily from 0.2 within the cohort aged
from 0 to 14 years to 2.7 in the age group of 75 years and over (Australian Bureau of
3
Statistics, 2006f). Cardiovascular disease, cancer and neurological diseases account
for half of the disease of burden amongst adults aged from 45 to 64 years (Begg, Vos,
Barker, Stevenson, Stanley, & Lopez, 2007). Thus, how to tackle the health
problems or delay the occurrence of diseases among middle aged population
becomes critically important to the health practice of older population (Healy, 2004).
As reported by the World Health Organisation (WHO), chronic diseases
including cardiovascular disease, diabetes, obesity, certain types of cancer and other
chronic respiratory diseases accounted for 60% of the 58 million deaths in 2005
worldwide (World Health Organisation, 2005b). Non-communicable diseases are
strongly related with unhealthy lifestyle factors, constitute a significant financial
burden to the health system and largely impair people’s health related quality of life.
Type 2 diabetes is one of the typical lifestyle diseases that affect a large number of
individuals. The statistics revealed that the prevalence of Type 2 diabetes in
Australia is 7% based on measured blood sugar level, and 3% on self-report
diagnosis (Australian Bureau of Statistics, 2006e; Australian Institute of Health and
Welfare, 2008). In addition, the prevalence of Type 2 diabetes keeps increasing with
an annual increase rate of 0.8% (Barr et al., 2005). Studies consistently show that the
incidence of Type 2 diabetes is strongly related with unhealthy lifestyle factors.
Physical inactivity is found to increase the risk of developing Type 2 diabetes by
86% among black women (Krishnan, Rosenberg, & Palmer, 2009), while people
who perform regular physical activity have 30% less risk of having this chronic
condition (Jeon, Lokken, Hu, & Van Dam, 2007). In terms of weight status, the risk
of having Type 2 diabetes is over four times for people with obesity as that of those
with normal weight (Cameron et al., 2009; Guh et al., 2009). Smoking is another
strong risk factor, which presents a positive dose-response relationship with the risk
4
of having Type 2 diabetes (Patja et al., 2005). It is revealed that the increased risk
ranges from 23% for past smokers to 61% for heavy current smokers (> 20 cigarettes
per day) (Willi, Bodenmann, Ghali, Faris, & Cornuz, 2007). Healthy lifestyle is not
only related with incidence of chronic disease, but also associated with better quality
of life, less disability (Motl & McAuley, 2010), and lower mortality (Capewell et al.,
2009). Lifestyle modification is; therefore, ultimately important for both general and
clinical populations.
In the past two decades, many studies have been carried out to modify
people’s lifestyles and improve their health related quality of life, yet, the results of
the efficacy of interventions (normally including dietary advice and instruction about
physical activity) on reducing multiple lifestyle risks are mixed (Ebrahim, Beswick,
Burke, & Davey Smith, 2009; Orozco et al., 2008). At the population level, the
increasing prevalence of overweight or obese people continues showing no sign of
reduction. As reported by the Australian Bureau of Statistics, the percentage of
people who are overweight or obese has actually risen by 7% from 57.9% in 1995 to
62% between 2007-2008, and studies also show that the trend of increasing
proportion of overweight and obese people trend is significantly driven by a rising
proportion of obesity, which poses a greater risk of chronic diseases (Australian
Bureau of Statistics, 2009). In terms of physical activity, the proportion of people
with a sedentary or low exercise level climbed up from 69.4% in 2001 to 72.8%
(Australian Bureau of Statistics, 2009). In addition, number of deaths with diabetes
as an underlying cause has doubled from 1984 to 2004 (Australian Bureau of
Statistics, 2006e; Barr et al., 2005). These data clearly show that unhealthy lifestyle
factors not only increase the incidence of Type 2 diabetes, but also the mortality of
people with this disease (Al-Delaimy, Willett, Manson, Speizer, & Hu, 2001; Hu et

5
al., 2005; Tanasescu, Leitzmann, Rimm, & Hu, 2003). Therefore, concerted effort is
required to continue exploring the most effective strategies in improving unhealthy
lifestyle for both people who have and have not developed Type 2 diabetes.
The existing research has demonstrated that the process of lifestyle changing
involves complicated psychological adjustments, and a balance between logical
decision making and emotional fluctuation (Prochaska & Velicer, 1997; Prochaska et
al., 1994). In addition, a proportion of people living with an unhealthy lifestyle may
have already suffered from psychological problems before behavioural change under
the pressure of societal perceptions (Wott & Carels, 2010). Therefore, understanding
the psychological features of people living with an unhealthy lifestyle may be critical
in terms of providing a psychological perspective to lifestyle intervention, especially
for those having the greatest challenge of changing (e.g. the morbidly obese).
The literature has included discussions about the psychological features of
people who live with an unhealthy lifestyle. Studies examining the correlations
between lifestyle risk factors and common mental health problems, including
depression and anxiety, provided valuable information in this regard. For example,
some studies found that women who are overweight or obese tend to have a higher
risk of depression or depressive symptoms (Eunkyung, 2009; Heo, Pietrobelli,
Fontaine, Sirey, & Faith, 2006; Scott et al., 2008). Physically active women have
fewer mental health problems than those who do not perform physical activity, and
physical activity is also used as a conjunctive therapy for depression (De Moor,
Beem, Stubbe, Boomsma, & De Geus, 2006; Galper, Trivedi, Barlow, Dunn, &
Kampert, 2006). Furthermore, smoking has long been connected to having more
depressive and anxiety symptoms within women (Khaled, Bulloch, Exner, & Patten,
2009), even after controlling for alcohol consumption (Massak & Graham, 2008).
6
Apart from these, patterns of alcohol consumption and dietary habits have also been
researched, although inconsistent results were yielded (Sanchez-Villegas, Henriquez,
Bes-Rastrollo, & Doreste, 2006).
The majority of the studies have the advantages of using a large and
representative study sample with a broad age scope from 18 and beyond, which
provides more confidence in the ability to generalise research findings. But on the
other hand, the epidemiology of the relationships between lifestyle factors and
mental health for different age groups cannot be extracted due to a lack of reporting
on age-stratified results. Understanding age specific characteristics is essential in
developing tailored lifestyle intervention programs for different age groups, as the
prevalence rates of both lifestyle risk factors and mental health varies with age
(Australian Bureau of Statistics, 2007, 2009). What is more, the socioeconomic
context where people live also differs largely among age groups, and has the
potential for affecting their choice of lifestyles. For example, young adults are often
confronted with stress from the pressures of career development, child raising, and
financial strain, while adults from middle age and beyond tend to have more spare
time for themselves, a stable income, and are free from the obligation of looking
after children.
Among women with Type 2 diabetes, an elevated risk of depression has been
demonstrated, suggesting that females with Type 2 diabetes have more depression
symptoms as compared to those without. Yet, many studies failed to control for
factors that are associated with depression as well, for example, one’s physical
condition and unhealthy lifestyle factors (Ali, Stone, Peters, Davies, & Khunti, 2006).
Therefore, whether the elevated risk of depression is contributed to by diabetes or
other potential factors remains unknown. If lifestyle factors are the factors that
7
contribute to the disparities, there is a large potential to improve mental health for
people with diabetes.
Furthermore, the literature in this area also reveals a shortage of studies on
anxiety and lifestyle risk factors, with a primary focus on the dimension of
depression. Although the adverse consequences of depression for multiple aspects of
health are well demonstrated, anxiety as the most common mental health disorder
(Kessler et al., 2005) was often overlooked by many of the previous researchers.
More importantly, results of some research have indicated a high likelihood of
depression and anxiety co-morbidity (Australian Bureau of Statistics, 1997;
Wolitzky-Taylor, Castriotta, Lenze, Stanley, & Craske, 2010), which suggests an
integrated research approach aimed at developing a better understanding of the
correlations between mental health and lifestyle risk factors. A French study (Bonnet
et al., 2005) included various risk factors and both anxiety and depression. In
exploring the relationships between lifestyle risk factors and mental health, the
authors created an unhealthy lifestyle index which was used to indicate to what
extent individuals’ habits deviated from the national recommendation. However, the
prerequisite of this approach is that the effects of lifestyle risk factors were equally
weighted against mental health, whereas this fact has not been proved.
Middle life is a significant time when women experience significant changes
in both biological and social perspectives (Ballard, Kuh, & Wadsworth, 2001), and it
is perceived as a great opportunity for the clinicians and researchers to promote a
healthy lifestyle, prevent occurrence of chronic diseases and improve the quality of
life. This research is dedicated to identifying the psychological aspects correlated
with lifestyle risk factors among different groups of midlife and older women in
Australia.
8
Definitions and Terms
Dictionaries define lifestyle as ‘the habit, attitudes, tastes, moral standards,
economic level, etc., that together constitute the mode of living of an individual or
group’. As seen from the definition, lifestyle is a very broad term in the sense of
covering multiple aspects of life, with health related lifestyle being one of the many.
While health related lifestyle seems to have a narrower meaning, health related
lifestyle can mean anything ranging from preventative behaviour (e.g. screening tests)
to daily activities affecting health such as diet and physical activity, depending on
the research context. In the area of chronic disease prevention and management,
several specific aspects of unhealthy lifestyles including weight status, physical
activity, smoking, alcohol drinking, and diet have received considerable attention
from researchers. The emergence of research is primarily driven by the strong
correlations between the above stated unhealthy lifestyle factors and chronic disease
development. Furthermore, these lifestyles are adopted, not preordained, which
implies the potential for them to be modified, thus improving the health outcomes
subsequently.
Different terms were used in the literature to refer to these five factors in
general for the purpose of conciseness. For example, lifestyle risk factor has been
used in the Lifescript Initiative by the Department of Health and Aging in Australia
(Department of Health and Ageing, 2008). In the Lifescript resources kit, lifestyle
risk factors included smoking, poor nutrition, alcohol misuse, physical inactivity,
and unhealthy weight. Research using lifestyle risk factors including the Lifescript
Initiative have a focus on the negative aspects of unhealthy lifestyles. For example,
overweight or obesity and physical inactivity were the areas of interest of the
research. Modifiable risk factor has also been a common term to emerge in the
9
literature: smoking, obesity and physical inactivity were combined with other risk
factors, and generally termed as modifiable risk factors (Yusuf et al., 2004). The
word modifiable is included to underline their potential for change, which is absent
for other chronic disease risk factors such as age and family history. Furthermore,
the use of lifestyle behaviour is not uncommon as well. Different from lifestyle risk
factors and modifiable risk factors, the term lifestyle behaviour means action and the
way of doing something. Smoking and alcohol drinking are behaviours, but being
overweight is a status, while losing weight is behaviour.
In the current research, the term lifestyle factor is chosen as the overall term
for the investigated variables, which included weight status, physical activity,
smoking, and alcohol drinking. The word ‘risk’ is not included because the purpose
of the current research is not only to examine the effects of an unhealthy lifestyle on
mental health, but also the protective effect of a healthy lifestyle against poor mental
health. In addition, factor is favoured to behaviour, as stated in the previous
paragraph, being overweight or obese is not an action, so it is not appropriate to refer
to it as behaviour.
In spite of the common use of ‘mental health’ in research, practice and
political areas, articulating the meaning of mental health in this research study is
somewhat challenging. It is helpful to review and compare different meanings of
mental health among previous studies before giving the definition for this research.
One definition of mental health (Gaylord, Gruener, Rodgers, & Zalice, 2008, p. 4) is
“an ability to see oneself as others do and to fit into the culture and society where
one lives”. The WHO (2005a) illustrated mental health as “a state of well-being in
which every individual realises his or her own potential, can cope with the normal
stresses of life, can work productively and fruitfully, and is able to make a
10
contribution to her or his community”. Although described somehow differently,
both definitions emphasise mental health as a concept of positive mental status,
which is characterised not only by the absence of mental illness, but also a presence
of psychological well-being. In contrast to mental health, mental illness is described
as “an inability to see oneself as others do and not having the ability to conform to
the norms of the culture and society”. Mental health and mental illness are viewed as
end points on a continuum, with movement back and forth through life (Gaylord, et
al., 2008, p.4).
However, within the literature, it is not uncommon to see that mental health
is used as a general term for mental status, without an indication of being negative or
positive. For example, there is a recent publication titled “Collective resources or
local social inequalities? The social determinants of mental health in rural areas”
(Riva, Bambra, Curtis, & Gauvin, 2010). Although the authors used the term, mental
health, in the title, what was investigated was common mental disorders. So, under
this situation mental health does not possess the meaning of an optimal status of
mental health or, in other words, well-being. Rather, it is a neutral term which is
used to describe mental status in contrast to physical health. Similarly, the Australian
Survey of Mental Health and Well-being, which was undertaken in 2007, had a
strong focus on the prevalence of mental disorders within adult Australians and
related factors (Australian Bureau of Statistics, 2007). While investigating these
mental disorders, some positive aspects of mental status were also examined in this
national survey. This is another example of using mental health as an unbiased term
to represent general mental status, which could convey either negative or positive
meanings, or sometimes both.

11
For the current research, the concept of mental health as a neutral term was
applied. This is because the main purpose of the research was to examine the
relationships between lifestyles and two common mental health problems, anxiety
and depression. Also, the overall mental health and its correlation with lifestyle
factors were investigated. In brief, mental health in this research does not mean
healthy mental status, but it is a general term describing mental status.
Aims of the Research
The research aimed to develop a comprehensive understanding about the
correlations between lifestyle risk factors and mental health among Australian
women in midlife and older. This broad aim was achieved by three individual studies
designed to describe the relationships, with different research approaches in both
general and clinical populations. Subsequently, the prospective relationships between
lifestyle risk factors and mental health in midlife women from the general population
was investigated first; then the differences of mental health between general and
diabetic populations was examined, together with the contribution of lifestyle factors
to mental health; and lastly, the mediating role of self-efficacy in the correlations
between lifestyle factors and mental health among midlife and older women with
diabetes was evaluated.
Research Plan
The relationships between lifestyle risk factors and mental health among
midlife and older women were investigated in both apparently healthy and clinical
populations using a number of research designs. Study 1 utilised a large sample of
midlife women from the community, and analysed the ability of baseline lifestyle
risk factors in predicting mental health status after five years of follow up. Study 2

12
was of cross-sectional design. It compared the correlation in women attending
diabetic clinics with those from the community, and particularly examined the effect
of diabetes on women’s mental health status. Study 3 expanded the research on the
basis of the previous two. This study examined the mediating effect of self-efficacy
in the relationships between lifestyle factors and mental health among midlife and
older women with diabetes by using a questionnaire survey. The varied research
designs with different study samples allow the understanding of the multiple aspects
of the association between lifestyle risk factors and mental health among midlife and
older women.
Significance of the Research
The research study is one of the few studies with a focus on health issues for
midlife and older women in Australia. Understanding the relationships between
lifestyle factors and mental health among midlife and older women and their
underlying mechanism is the central goal of the research. The research is undertaken
based on the social cognitive theory (Bandura, 1997, 2004), which not only allows
the examination of behavioural factors on personal factors, but also conveys the
implications of how to improve mental health. Therefore, this research has the
potential to enhance researchers’ and health professionals’ knowledge of individuals’
mental health in relation to lifestyle factors, and more importantly, has a strong
implication for the development of theoretically driven design.
Structure of the Thesis
This thesis has eight chapters. Chapter 1 is introduction of the research,
which lays out the background of the study, clarifies the definitions and terms, and
states the significance of the study. Chapter 2 is the literature review. This chapter

13
has a dual focus, one is the examination of theories on behaviour change in health
promotion, and the other is an overview of the studies on the correlations between
lifestyle factors and mental health.
Chapter 3 describes the methodology used in the research study. The data of
the current study is based on previous women’s health studies, so, the linkage of the
current study with these women’s health studies is explained. The current research
involves three studies: Study 1, Study 2 and Study 3. The design, sample and
measures of each study are outlined.
Chapters 4 to 6 present the results of Study 1, Study 2 and Study 3,
respectively. At the end of each study, a brief reflection of the study results as related
to the research questions is provided.
The discussion about the study results and further thoughts on study strengths
and limitations are presented Chapter 7. Finally, the conclusions of the research as
well as the implications generated from the study are described in Chapter 8.
Chapter Summary
This chapter introduced the broad background of this research, and
highlighted the importance of research in the area of chronic disease prevention and
lifestyle improvement. The ageing population combined with the increasing rate of
chronic diseases demand more research on this area. The changing of lifestyles (e.g.
physical inactivity) serves as a strong driver of the rising prevalence of chronic
disease, thus, it needs to be investigated. A better understanding of the relationships
between mental health and lifestyle factors may have the potential to contribute to
the development of effective strategies in solving these problems.
The aims of the research were briefly outlined (see Chapter 2 for detailed
research questions), followed with research plan. The key definitions and terms were

14
explained and clarified, which included listing of the four lifestyle factors examined
in the current study as well as the meaning of mental health. Finally, the structure of
the thesis was described. Chapter 2 begins with an overview of women and mental
health, continues with the examination of behavioural theories, and finishes with a
thorough literature review on lifestyle factors and mental health.

15
CHAPTER 2: LITERATURE REVIEW
Brief Introduction
This chapter has two aims: to examine the common theories in health
promotion, and to conduct a comprehensive review of the literature on lifestyle
factors and mental health. A brief description on women and mental health precedes
the review of theories. Common behavioural theories in the field of health promotion
were compared including the rationale for choosing social cognitive theory as a basis
for this research. Following the examination of theories, a constructive review about
the studies on the relationships between lifestyle factors and mental health was
presented to provide the context of the current research and to identify research gaps
in this particular area. For each lifestyle factor, the relevant literature on its
relationship with mental health was presented, and the modifying effect of gender on
the relationships was highlighted along the way.
Women and Mental Health
Gender appears to play a significant role when it comes to the issue of mental
health. National surveys in the U.S. and Australia show a higher prevalence of
affective and anxiety disorders in women, but lower substance use disorders as
compared to men (Australian Bureau of Statistics, 2007; Hasin, Goodwin, Stinson, &
Grant, 2005; Somers, Goldner, Waraich, & Hsu, 2006). Research from North
America revealed that among adults aged 18 years or over, the past-year and lifetime
prevalence rates of major depression were 5.28% and 13.23%, respectively between
2001 and 2002, and women were twice as likely as men to have major depression
(Hasin, et al., 2005). As revealed by the most recent Australian National Survey of
Mental Health and Well-being (Australian Bureau of Statistics, 2007), women

16
experienced higher rates of any 12-month mental disorder (anxiety disorder,
affective disorder & substance use disorder) than men (22% vs. 18%). Specifically,
women also experienced a higher rate of anxiety disorders (18% vs. 11%) and
affective disorder (7.1% vs. 5.3%) than men, but not substance use disorders.
The gender disparities in risk for mental illnesses was thought to stem from
both biological (Deecher, Andree, Sloan, & Schechter, 2008) and psychosocial
differences between men and women (Klose & Jacobi, 2004; Zender & Olshansky,
2009). Women have a different hormone profile from men and respond differently to
stressful activity. Moreover, the varying sexual hormone levels and hormone
secretion patterns across women’s lifespan also contribute to women's vulnerability
to mental disorders. Endocrine change occurs during the major reproductive periods,
which include premenstrual, postpartum, and perimenopausal periods (Zender &
Olshansky, 2009).
Anxiety has been commonly reported among women experiencing
menopausal transition. 24% of women in early menopausal transition reported
having anxiety symptoms, as compared to 19% among women in premenopause
(Freeman, Sammel, Lin, Gracia, & Kapoor, 2008). In the Study of Women's Health
Across the Nation (U.S.A.), 52% of women presented anxiety symptoms described
as “feeling tense” (Avis et al., 2001). The risk factors of having anxiety during the
menopausal stage were identified as being associated with premenstrual syndrome,
history of depression, higher perceived stress (Maki, 2008) and sleep disturbance
(Parry, 2007).
The issue of depression in relation to menopause seems rather controversial.
The Harvard Study of Moods and Cycles followed 420 non-depressed women aged
from 36 to 45 years for 6 years (Cohen, Soares, Vitonis, Otto, & Harlow, 2006).
17
Using telephone interviews and questionnaires, the authors found that women
entering perimenopause were nearly twice as likely to develop clinical depression as
compared to those remaining in premenopause, regardless of age and negative life
events. Likewise, in the study by Freeman and his colleagues, an increased risk of
depressive symptoms during the transition to menopause was detected after
controlling for important confounders including age, history of depression, sleep
quality and sociodemographic factors (Freeman et al., 2004). This study additionally
pointed out that after menopause, the risk of depression diminished.
However, studies suggesting a non significant relationship between
depression and menopausal status are not uncommon (Gallicchio, Schilling, Miller,
Zacur, & Flaws, 2007; Kaufert, Gilbert, & Tate, 2008; Lu, Tseng, Lin, Luh, & Shu,
2009; Smith-DiJulio, Woods, & Mitchell, 2008). These studies commonly indicated
that depression in menopause is more likely to be contributed to by health habits (e.g.
smoking and physical inactivity) and the number of menopausal symptoms
(Gallicchio et al., 2007; Lu et al., 2009), negative life events (Lu et al., 2009;
Smith-DiJulio et al., 2008) and health status including the number of chronic
diseases (Kaufert et al., 2008). Nevertheless, the literature on menopause and mental
health problems suggested that many women do not develop mental health problems
at this particular stage, but there may be a subset of women who are at an elevated
risk of depression and anxiety. The association between menopausal status and
mental health remains unclear.
18
Theoretical Background
The WHO constitution (1948) proposed that “health is a state of complete
physical, mental and social well-being and not merely the absence of disease or
infirmity”. As described, health has multiple dimensions and these are inseparable
and interlinked components of the totality when describing health. Based on the
WHO’s definition of health and some other social theories, Pelican demonstrated
that an individual person must be understood as the structural and operational
coupling of three different kinds of systems (Pelican, 2007), which are the body or
organism, the mind or mental system, and the social status of a person (Figure 2.1).
The interaction between these three systems is illustrated, suggesting that the
organism and social status of the person can have an impact on the mind, but equally
the mind can also influence the organism and social status of the person. Therefore,
exploring the effect of lifestyle factors on individuals’ mental health can also be
essential in terms of developing a comprehensive understanding of lifestyle factors
on health as a whole.
Figure 2.1. The individual as a structural coupling of three systems: organism, mind
and social status. Information source: Pelican, J. M. (2007). Understanding
differentiation of health in late modernity by use of sociological systems theory. In D.
V. McQueen, I. Kickbusch & L. Potvin, Health and modernity: the role of theory in
health promotion. New York: Springer.
This figure is not available online.Please consult the hardcopy thesisavailable from the QUT Library.

19
At the time when chronic diseases have increasingly become the challenge of
health promotion, the role of lifestyle factors in the development of various chronic
diseases and some kinds of cancers has attracted considerable attention from
researchers and clinicians. While the understanding of the relationships between
lifestyle factors and chronic diseases is well established and most people know that
maintaining a healthy lifestyle helps them to live longer and in better health, the
proportion of people who are committed to habit or behaviour change might be
lower than anticipated. Among a group of well-functioning, community dwelling
elderly people (N = 2,708), 67% had an indication of the need to lose weight, yet
only 27% participants reported an intention to do so (Lee et al., 2004). In 2004-2005,
70% of Australians aged 15 years and over were still classified as sedentary or
having low exercise levels (Australian Bureau of Statistics, 2006g), and this number
has not changed in the past ten years. These data probably convey the information
that behaviour change is not a simple and linear process. It involves social and
psychological factors which can be critical in designing effective lifestyle
intervention. However, when compared to the volume of studies examining the
effect of lifestyle factors on people’s physical condition, the research in regards to
the correlations between lifestyle factors and mental health is relatively limited.
Investigating the associations between lifestyle factors and mental health provides
health professionals and researchers with information that may contribute to
effective behaviour modification programs in the future.
Based on the model, it is thought that one’s mental health can be influenced
by lifestyle factors in two potential pathways. Firstly, lifestyle factors may alter
mental health via the latter’s influence on physical health. For example, while doing
exercise, the human brain is stimulated to release endorphin, a natural pain killer,
20
and thus boosts a sense of well-being and pleasance (Bender et al., 2007). Secondly,
an individual’s lifestyle in relation to health-promoting factors is socially embedded.
Making a lifestyle choice is the process that frequently engages self-comparison with
other people. As demonstrated by the theory of planned behaviour (Ajzen, 1991), the
motivation of meeting the “social norm” of a particular behaviour is one of the
important factors in predicting behaviour. By doing so, a sense of belonging is
fulfilled and thus a better status of mental health is created, as the WHO’s definition
of health suggests. In the current society where slimness is highly regarded, being
overweight or obese deviates from the social norm. Research has shown that people
with obesity are stigmatised and suffer from enormous social and psychological
stress (Carr & Friedman, 2005; Rogge, Greenwald, & Golden, 2004).
In all, health is a comprehensive concept. In health promotion, it is essential
that people not only research the effect of lifestyle factors on physical health but also
investigate the mental health sphere. Considering the well-established effect of
lifestyle factors on chronic conditions and the fact that the high prevalence of
unhealthy lifestyles is continuing, it may be worthwhile to examine mental health
status in relation to lifestyle factors. A number of common theories in the field of
health promotion were introduced and compared to select the most suitable theory as
the conceptual framework for this research. It is expected that the knowledge
generated from this study would enhance people’s understanding of the effect of
lifestyle factors on individuals’ mental health. In addition, it is also anticipated that a
model be produced upon which more effective lifestyle intervention could be
developed.

21
Conceptual and Theoretical Framework
Health Promotion
Health promotion is initially defined by the WHO as “the process of enabling
people to increase control over the determinants of health and thereby improve their
health” (World Health Organisation Regional Office for Europe, 1986). Confronted
with the increasing prevalence of chronic and non-communicable diseases in most
developed countries and more recently in some developing countries, modification
of individuals’ unhealthy lifestyle factors that are related to premature mortality, and
total burden of disease has drawn enormous attention since the 1970s. It is reported
by the WHO (2005b) that 80% of heart disease, stroke, and Type 2 diabetes can be
prevented by appropriate intervention on aetiological factors like unbalanced diet
and physical inactivity. Hence, modifying lifestyle factors is considered as the most
efficient way of preventing disease morbidity and premature mortality. A number of
health promotion programs have been conducted within a broad spectrum, such as
smoking cessation, cancer screening, and lifestyle change. From a global perspective,
the WHO (2005b) developed a model of Global Strategy on Diet, Physical Activity
and Health (DPAS) aiming to guide efforts across the world in the field of chronic
disease prevention (Figure 2.2).

22
Figure 2.2. Schematic model of the Global Strategy on Diet, Physical Activity and
Health (WHO, 2006b).
This model highlights the role of social and environmental factors in the
effectiveness of health promotion, and specifies that supportive environment,
policies and programs should be developed to facilitate behaviour change at the level
of the individual. In spite of the emphasis on external factors that influence the
effectiveness of health promotion, a person’s behaviour change remains the critical
component in this model. This change is affected by external factors and further
affects a variety of outcomes in social, economic and heath domains. Therefore, the
understanding of the factors that influence an individual’s behaviour cannot be
overemphasised.
A substantial amount of work has been undertaken to understand the
phenomenon of behaviour change by the development and application of theoretical
models in order to achieve maximal health gain (Lorig, Doak, Doak, & Giloth, 2001).
These theories can be classified into individual, interpersonal and community
23
categories in terms of their operating levels. Theories operating at the individual
level include, but are not limited to the health belief model, the theory of planned
behaviour, and the transtheoretical model. Those incorporating social and
environmental factors as well as the personal ones include the social cognitive theory
(Bandura, 2004). In this section, a close examination of commonly applied
behavioural theories was conducted in combination with the research questions of
this research. This process allowed the emergence of an appropriate theoretical
framework for the current research study.
The Health Belief Model
The health belief model originated in the 1950s and is the oldest model in
health promotion. It was developed by a group of U.S. social psychologists who
attempted to work out the factors that motivated people to attend a free tuberculosis
screening program. In the early formulation of this theory, the core concept was that
individuals’ health behaviour was motivated by four factors, which are: 1) perceived
susceptibility, the degree to which a person feels at risk for a health problem; 2)
perceived severity, the degree to which a person believes the consequence of the
health problem will be severe; 3) perceived benefits of an action, the positive
outcomes a person believes will result from the action; and 4) perceived barriers to
taking that action, the negative outcomes that a person believes will result from the
action (Rosenstock, 1974). As more research was carried out and the utility of the
health belief model was increasingly examined, two new components were added
into the original framework to enhance its ability to predict behaviours (Cummings,
Jette, & Rosenstock, 1978). The latterly introduced two components are: 1) cues to
action, an external or internal event that motivates a person to act (e.g. a
consultation), and 2) self-efficacy, a person’s belief in his or her ability to take action.
24
It was considered at the time that a person needs something external or internal to
make them start thinking about behaviour change. If such an event is absent, the
reasoning and balancing process may not be executed. Furthermore, a person’s
confidence in actually being able to carry out the task is also valued, because even
when a person favours a healthy behaviour and is fully aware of the risk of an
unhealthy behaviour, she/he may not perform this action due to low confidence in his
or her ability to do so. As shown in Figure 2.3, the health belief model assumes that
individuals’ behaviour can be changed if their health beliefs are modified
accordingly by the provision of necessary information. Despite its long history, the
application of this theory has not always been successful (Medina-Shepherd, 2008).
This model well identifies the factors affecting an individual’s internal process of
decision making; however, it does not take much consideration of external factors
(e.g. other beliefs), which can equally influence people’s behaviours. In addition,
research being conducted recently has shown that belief formation does not always
precede behaviour modification. In some situations, they are actually formed after a
behavioural change (DiClemente, Crosby, & Kegler, 2009).
25
Figure 2.3. The Health Belief Model in Glanz K., Lewis F.M., & Rimer B.K., (Eds.).
Health Behavior and Health Education: Theory, Research and Practice. San
Francisco: Jossey-Bass.
The Theory of Planned Behaviour
The theory of planned behaviour is an extension of reasoned action theory,
which was developed by Fishbein and Ajzen in the early 1980s (Ajzen & Fishbein,
1980; Fishbein & Ajzen, 1975). This theory has been applied not only in health
promotion, but has also been used widely in other social activities such as
advertising, parenting and so forth. The theory of planned behaviour assumes that a
person’s intention to perform certain behaviour is the immediate factor that can
predict that action mostly accurately. Therefore, the theory of planned behaviour has
a strong focus on the predictors that form the intention. According to theory of
planned behaviour, an individual’s intention is a function of two factors: 1) a
person’s attitude towards a specific behaviour; and 2) his/her perception of the
subjective norms associated with that behaviour. A person’s attitude to a specific
behaviour is the degree to which performance of the behaviour is positively or
negatively valued. Subjective norm is the perceived social pressure to engage or not
to engage in a behaviour. Based on this model, an individual’s intention of carrying
This figure is not available online.Please consult the hardcopy thesisavailable from the QUT Library.

26
out a specific behaviour could be well explained by one’s attitudes and subjective
norms related with that behaviour, if there are no other barriers that are likely to stop
intention from transferring to behaviour.
But in the real world, it is common that one’s intention to undertake certain
action is interrupted by unexpected factors that are not under one’s control.
Therefore, the model with two elements of attitude and subjective norm may not be
predictive to behaviours in some situations. To address this problem, a new element,
perceived behavioural control, was added to the theory of planned behaviour under
the influence of self-efficacy theory (Ajzen, 1991). Perceived behavioural control
refers to people's perceptions of their ability to perform a given behaviour. In brief,
the theory of planned behaviour explains human behaviour by investigating the
factors that are likely to determine the intention to conduct that behaviour. It is
hypothesised that behavioural intention is formed under the interactive influence of a
person’s attitude, subjective norms, and perceived behavioural control (Figure 2.4).
One criticism that theory of planned behaviour often receives is that behavioural
intention does not necessarily lead to behaviour change, as something unexpected
could occur ahead of subsequent behaviour and alter the intention. Furthermore, the
theory of planned behaviour assumes the process of decision making is cognitive and
rational, which overlooks the effect of emotion. The systematic review by Hardeman
et al. found that among interventions developed by using the theory of planned
behaviour, in half of them change in intention was reported and in two thirds change
in behaviour was reported (Hardeman et al., 2002).The effect sizes were general
small, which may be attributable to the limitations.

27
This figure is not available online.Please consult the hardcopy thesisavailable from the QUT Library.
Figure 2.4. Conceptual framework of theory of planned behaviour. Source: Ajzen, I.
(1991). The Theory of Planned Behaviour Organizational Behaviour and Human
Decision Processes, 50(2), 179-211.
The Transtheoretical Model
The transtheoretical model was initially developed in the early 1980s,
primarily applied in the area of smoking cessation. The most distinctive feature in
which the transtheoretical model differs from other theories (e.g. health belief model
and the theory of planned behaviour) is its emphasis on behaviour change as a
dynamic process of change involving multiple stages, rather than an event at one
time point (Prochaska & Velicer, 1997; Prochaska et al., 1994). The key concept of
this model is that people complete behaviour change by several stages, where
different psychological processes are presented. This argument suggests that not
everyone is ready to make a behaviour change, thus, interventions must take the
stages into account to be able to address people’s needs to the largest extent possible.
The stage of change does not constitute the transtheoretical model alone, along with
it decisional balance, process of change and self-efficacy also serve as crucial
components in this model, co-occurring dynamically at different stages of change
(Table 2.1).
28
Table 2.1
The Transtheoretical Model Constructs
The proposed stages of change are: pre-contemplation, contemplation,
preparation, action, maintenance and termination. Moving from one stage to the next
involves different processes of change. In brief, people in the first stage,
pre-contemplation, are not yet at the point that they think of a specific behaviour
change, which suggests they have not considered change or they think change is not
necessary (Resnicow, McCarty, & Baranowski, 2003). When people move from
pre-contemplation to contemplation, they begin to think about assuming a behaviour
change. This could be triggered by any number of cues, such as conversation with
friends or the TV news. Once people make the decision to change, the stage of
preparation follows. People normally do lots of preparatory work during this short
period to get them ready for real action. After preparation is completed and people
begin to perform certain actions (e.g. exercise), they are considered to be at the stage
of action. At this time, people work actively to modify the problem they think needs
to be addressed. In the maintenance stage, people have made considerable change to
This table is not available online.Please consult the hardcopy thesisavailable from the QUT Library.

29
a specific behaviour and struggle to keep that behaviour going and to prevent
regression. This is a process which often requires substantial hard work, as it is very
likely that they will encounter negative factors that will stop them from carrying out
that action. In addition, this is also the stage where self-efficacy becomes largely
important in determining the outcomes of maintenance. If a person has high
self-efficacy, he/she is more likely to persist in behaviour change; otherwise he/she
is at high risk of regressing to early stages. But meanwhile, self-efficacy is also
influenced by many other factors. It could be a preceding factor of behaviour change,
but also a result of concrete behaviour change. Nevertheless, successful completion
of the maintenance stage leads people to the final stage of contemplation. At this
point, people are regarded to have finished the whole process of behaviour change
and command a high level of self-efficacy.
As mentioned in the beginning of this section, the transtheoretical model
recognises people could be at different stages of change, thus research intervention
should target those people’s needs in a manner that matches the stages they are at.
Research has reported the efficacy of transtheoretical model based programs in
enhancing participants’ adherence to treatment regimens (Johnson et al., 2006),
however, accurately differentiating each stage has often been a difficult issue for
many researchers (Plotnikoff et al., 2009).
The Social Cognitive Theory
The social cognitive theory was developed by Albert Bandura in the 1970s,
and has produced a significant effect in the discipline of psychology. As the name
suggests, the social cognitive theory proposes that the cognitive process is the
mechanism of learning. Before that, the view of behaviourism was pervasive at that
time. Many behaviourists believed that a new behaviour was shaped by its

30
performance effects (stimuli), which could either be reinforcement or punishment. In
contrast to the mainstream of behavioural psychology, Bandura presented a view in
his early publication that changes were achieved by different methods derived from a
common cognitive mechanism (Bandura, 1977). Meanwhile, he commented that a
person’s cognitive ability is not only a product of the environment, but also the
producer of the environment. Later in 1986, he further emphasised the fact that
human functioning is explained in terms of a model of triadic reciprocality in which
behaviour, cognition, and other personal and environmental factors operate as
interacting determinants of each other (Bandura, 1986).
This triadic reciprocal determinism is an essential feature in which the social
cognitive theory differs from many other theories described above. Those theories
attempted to explain human behaviour as an outcome of a number of personal or
environmental factors, which depicts a unidirectional relationship from personal
and/or environmental factors to behaviour. This approach denies a person’s proactive
capacity in influencing environment and other personal factors such as education. As
shown in Figure 2.5, the reciprocal determinism acknowledges a constant interplay
between these three dimensions, yet, reciprocality does not mean symmetry in the
strength of bidirectional influences, nor is the patterning and strengths of mutual
influences fixed in reciprocal causations.
31
Figure 2.5. Social cognitive theory, Bandura, A. (1977). Self-efficacy: toward a
unifying theory of behavioural change. Psychology Reviews, 84(2), 191-215.
The social cognitive theory also specifies a core set of determinants, which
includes knowledge of health risks and benefits of different health practices,
perceived self-efficacy that one can exercise control over one’s health habits,
outcome expectations about the expected costs and benefits for different health
habits, the health goals people set for themselves and the concrete plans and
strategies for realising them, and the perceived facilitators and social and structural
impediments to the changes they seek (Bandura, 2004). As seen from Figure 2.6, a
person’s outcome expectation has a direct impact on behaviour. If people think
changing behaviour will not produce much benefit for them, then the possibility of
adopting a new pattern of behaviour is low. Goals setting procedure also play an
important role. By self-evaluating one’s behaviour against some standards, people
will be motivated to make the next step, thus moving towards completion of
behaviour change. In this model of causal structure, self-efficacy is at the central
position, because it not only influences behaviour directly, but also shapes other
factors that affect behaviour.
This figure is not avaible online.Please consult the hardcopy thesisavailable from the QUT Library.
32
Figure 2.6. Structural paths of self-efficacy theory (Bandura, 2004).
With regard to the concept of self-efficacy itself, it is recognised that
self-efficacy is a multifaceted conception which contains three dimensions including
magnitude, generality and strength (Bandura, 1997). Magnitude means the level of
task difficulty that a person believes that they are capable of completing. Generality
refers to the extent that self-efficacy expectancy can be generalised into another
similar area. Strength reflects the degree of confidence with which one can perform
the tasks. Despite its property of generality, self-efficacy under many situations is a
situation specific variable. A high sense of self-efficacy in one domain is not
necessarily accompanied by high self-efficacy in another realm (Perkins & Jenkins,
1998). For example, a person who has a high level of self-efficacy in refraining from
alcohol misuse will not necessarily be equally confident in smoking cessation.
Therefore, although self-efficacy is regarded as an important factor in influencing
behaviour change, a global estimate of self-efficacy is likely to sacrifice its power of
predicting behaviour.
In his later publication (Bandura, 1986), it was proposed that self-knowledge
about one’s self-efficacy relied on four primary sources of information, whether or
This figure is not available online.Please consult the hardcopy thesisavailable from the QUT Library.
33
not one’s perceived self-efficacy was accurate or faulty. These terms regarding the
four sources of information were modified slightly in a later publication (Bandura,
1997). They are enactive mastery experiences, described as the most influential
source of self-efficacy information; vicarious experiences that alter self-efficacy
belief through transmission of competencies and comparison with the attainments of
others; verbal persuasion and allied types of social influences reflecting the view
that one possesses certain capabilities (e.g. consultation with health professionals);
and self-appraisal from which people judge their capability, strength, and
vulnerability to dysfunction.
In 2005, Bandura’s models published in 1997 and 2004 were adapted and
combined into one, which is presented in Figure 2.7. As described in the model,
personal characteristics are related with self-efficacy, which partially influences
outcome expectation and socio-structural factors. Meanwhile, self-efficacy’s direct
effect on the control of behaviour change is also recognised. The course of forming a
new patterning of behaviour is then accomplished via a procedure of gradual goal
setting, which is co-influenced by self-efficacy, outcome expectations and
socio-structural factors. In turn, the result of behaviour change, regardless of success
or failure, contributes significantly to the continuing self-efficacy as an important
information source. Moreover, the effect of behaviour change also spreads to
personal factors and outcome expectations, which produces an effect on behaviour
change in a reciprocal manner.

34
This figure is not available online.Please consult the hardcopy thesisavailable from the QUT Library.
Figure 2.7. Self-efficacy theory - structural paths of influence (adapted from
Bandura, 1977, 2004).
Appraisal of Social Cognitive Theory and Other Psychological Models
The above theories pay considerable attention to the role of psychological
variables in the process of behaviour change. In particular, the concept of
self-efficacy has been constantly thought to be critical to fostering health related
behaviour change (Shortridge-Baggett, 2001). Although named differently, the
concept of perceived control integrated in the theory of planned behaviour overlaps
with self-efficacy, as commented by Bandura himself (2004). Moreover, the
expectation of behavioural change outcome has also been split into seemingly
different determinants across various models. In the health belief model, perceived
benefits toward behaviour change are positive outcome expectations, while perceived
barriers are negative outcome expectations. In the theory of planned behaviour or
reasoned action, one of the key elements that influence behaviour is attitudes, which
are actually formed by a person’s assessment and his/her expectation of the outcome
resulting from behaviour change. Similarly, subjective norms result from society’s
expectations of the individual to perform a specific behaviour and how keen that
person is to comply with that expectation. In this case, both attitude and subjective
norms are outcome expectations. So, attitude refers more to the expectation of a
35
physical outcome, while subjective norms are social outcomes of behaviour
according to Bandura’s social cognitive theory (Bandura, 2004). In all, these
psychological models largely overlap in their essential constructs. Research has also
shown that after considering self-efficacy and self-evaluation, other psychological
factors made trivial contributions in explaining behaviour change (Dzewaltowski,
Noble, & Shaw, 1990).
Based on the reciprocal mechanism between personal, environmental and
behavioural factors, the social cognitive theory not only provides a framework in
explaining behaviour change, but more importantly, it presents guidance for
modifying behaviours in an effective way. The Chronic Disease Self-Management
Program developed by the Stanford Patient Education Research Centre is a
successful example of a peer-led program which has also been applied in many
countries outside the United States. By teaching participants the skills of problem
solving and using modelling strategies, people’s self-efficacy is greatly enhanced,
which permitted them in turn to achieve a satisfactory level of self-management
(Lorig, Ritter, Laurent, & Plant, 2006; Mancuso, Rincon, McCulloch, & Charlson,
2001; Roach et al., 2003). In particular, it was revealed that participants in the
program had a significant reduction of HA1C level (-0.4%), health distress, hypo-
and hyper-glyceamia symptoms and an increase in self-efficacy enhancement (p
<0.05) (Lorig, Ritter, Villa, & Piette, 2008).
Taken all together, social cognitive theory was chosen as the theoretical
model for the current research for two reasons. First, social cognitive theory
recognises the reciprocal relationships between personal, behavioural and
environmental factors. This provides the research study with theoretical support for
the examination of the associations between lifestyle factors (behavioural factors)

36
and mental health (personal factors). This assumption aligns with the DPAS
proposed by the WHO in terms of the awareness of the role that environmental
factors play in facilitating or impeding behaviour change. Second, the key constructs
in other psychological models overlap with the concept of self-efficacy and outcome
expectation in the social cognitive theory. It is hypothesised in the current research
that self-efficacy acts as a mediating factor in the relationships between lifestyle
factors and mental health. If approved, corresponding strategies may be implemented
to promote self-efficacy, with the additional consideration of individuals’ mental
health level.
Multiple Lifestyle Factors, Diabetes and Mental Health
It is well known that unhealthy lifestyle factors including the condition of
being overweight or obese, physical inactivity, smoking and alcohol over
consumption contribute substantially to the burden of disease in Australia (Bauman
& Owen, 1999; Social Research Centre, 2006; Thorburn, 2005). A large scale (N =
16, 043) and cross-sectional study undertaken in Spain pointed out that women with
four lifestyle risk factors were about 3 times more likely to experience
non-compliance of blood pressure and cholesterol assessment, 6 times more likely
not to perform cytology, and 10 times more likely not to have a mammography
screen (Galán et al., 2006). It is known that lifestyle risk factors are not only related
with physical health, but also mental health.
Studies in this field generally illustrate a positive relationship between a
healthy lifestyle and mental health (Bonnet et al., 2005; Rohrer, Rush Pierce, &
Blackburn, 2005). For example in a study conducted in France, individuals’ cigarette
smoking, diet and physical activity habits were contrasted against corresponding
guidelines to generate a score, which indicated the extent of deviation of the

37
individual’s lifestyle from established guidelines. The results showed that people
living with unhealthy lifestyles presented significantly more symptoms of depression
and anxiety (Bonnet et al., 2005). For people living with chronic diseases (e.g. Type
2 diabetes), unhealthy lifestyle factors are even more prevalent. Given the adverse
effect of these factors on the clinical outcomes of people with Type 2 diabetes,
investigating the relationships between lifestyle factors and mental health among this
population is important. One advantage of this study was that it examined lifestyle
factors as a whole group, recognising the correlations among lifestyle factors
themselves. This was regarded to be important in examining the relationship between
lifestyle factors and mental health, as the interactive effect among lifestyle factors
may confound their individual relationships with mental health (Pisinger, Toft,
Aadahl, Glümer, & Jørgensen, 2009).
A growing body of evidence suggests that unhealthy lifestyle factors often
are combined together in one individual, with 60% of the populations having two or
more unhealthy lifestyle factors (Fine, Philogene, Gramling, Coups, & Sinha, 2004;
Poortinga, 2007). In women aged from 18 to 55 years (N = 394), 80% of overweight
women had multiple lifestyle risk behaviours including physical inactivity,
percentage of calories from fat, insufficient daily servings of fruit and vegetables,
and daily sedentary time (Sanchez et al., 2008). Previous studies also showed that
people leading a sedentary lifestyle are twice as likely to be in the obesity category,
however defined (BMI or waist circumference). In addition, a dose-response
relationship between relative weight and physical activity was identified (Stamatakis,
Hirani, & Rennie, 2009). A positive correlation between extra weight gain and
alcohol consumption has again been illustrated in the literature (Wannamethee &
Shaper, 2003), as well as an inverse relationship between physical activity and

38
smoking (Kaczynski, Manske, Mannell, & Grewal, 2008). The co-occurrence of
smoking and alcohol (Degenhardt & Hall, 2003), and less intake of vegetables and
fruit in smokers (McClure et al., 2009) were demonstrated. Concerning the
modifiable effect of one lifestyle factor on the other, Widome et al. (2009) examined
the role of BMI categories in the association between depression and smoking. This
study only found a significant relationship between smoking and depression among
the obesity category, but not other categories.
Obesity and Mental Health
Epidemiology of Obesity
Obesity is a disease in which excess body fat has accumulated to such an
extent that health may be negatively affected (World Health Organisation, 2000b).
There are two common ways of assessing an individual’s relative body weight,
which are the body mass index (BMI) and waist circumference (WC). The former
reflects one’s overall body fat distribution, while the latter is a better indicator of
abdominal fat (Janssen, Katzmarzyk, & Ross, 2002).
BMI is calculated by dividing weight in kilogram (kg) by height in meters
squared. This measure is strongly correlated with total body fat content, yet is not the
direct way of measuring body fat. Therefore, it has the limitation of differentiating
muscle content from fat tissue in special populations such as when one is an athlete
(National Heart Lung and Blood Institutes, 1998). WC or waist-to-hip ratio (WHR)
is a good indicator for abdominal fat intensity. The National Cholesterol Education
Program’s Adult Treatment Panel III Standard (NCEP-ATPIII) defined abdominal
obesity as a WC greater than 88 cm in women and 102 cm in men. It is measured as
the circumference at the middle way between the iliac crest (hip bone) and the costal
margin (lower rib). WC has been identified as an independent risk factor of chronic
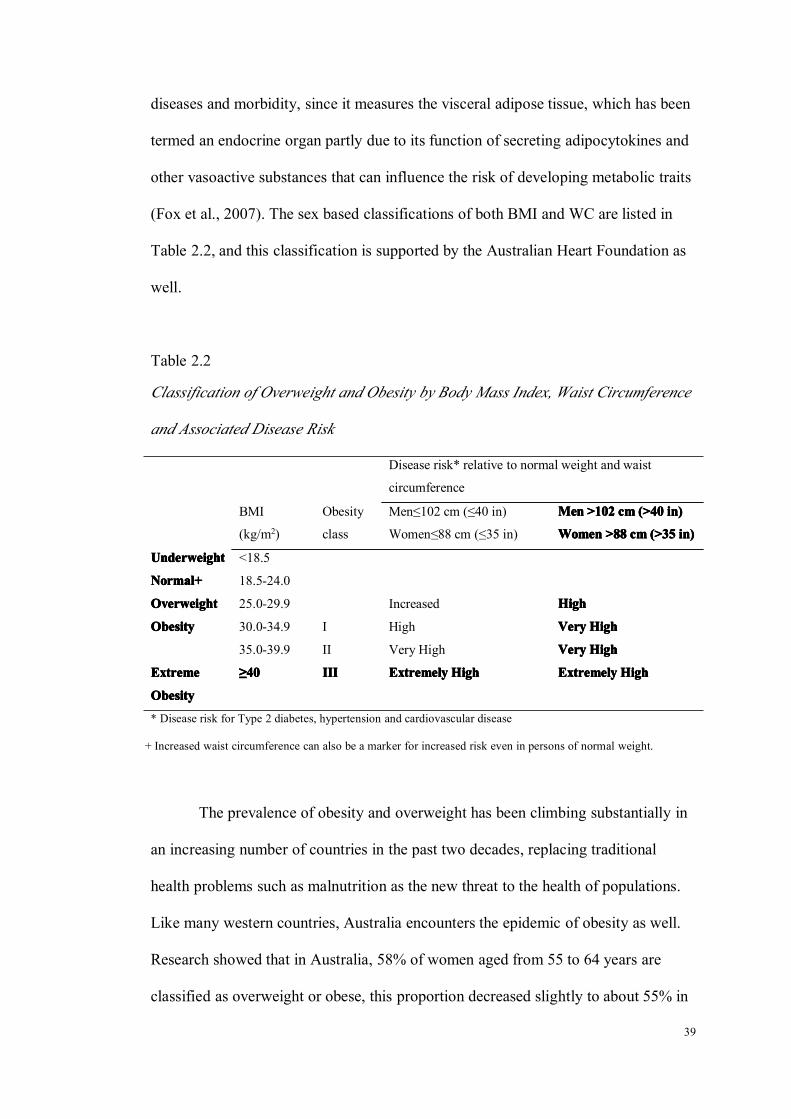
39
diseases and morbidity, since it measures the visceral adipose tissue, which has been
termed an endocrine organ partly due to its function of secreting adipocytokines and
other vasoactive substances that can influence the risk of developing metabolic traits
(Fox et al., 2007). The sex based classifications of both BMI and WC are listed in
Table 2.2, and this classification is supported by the Australian Heart Foundation as
well.
Table 2.2
Classification of Overweight and Obesity by Body Mass Index, Waist Circumference
and Associated Disease Risk
Disease risk* relative to normal weight and waist
circumference
BMI
(kg/m2)
Obesity
class
Men≤102 cm (≤40 in)
Women≤88 cm (≤35 in)
MenMenMenMen >102>102>102>102 cmcmcmcm (>40(>40(>40(>40 in)in)in)in)
WomenWomenWomenWomen >88>88>88>88 cmcmcmcm (>35(>35(>35(>35 in)in)in)in)
UnderweightUnderweightUnderweightUnderweight <18.5
Normal+Normal+Normal+Normal+ 18.5-24.0
OverweightOverweightOverweightOverweight 25.0-29.9 Increased HighHighHighHigh
ObesityObesityObesityObesity 30.0-34.9 I High VeryVeryVeryVery HighHighHighHigh
35.0-39.9 II Very High VeryVeryVeryVery HighHighHighHigh
ExtremeExtremeExtremeExtreme
ObesityObesityObesityObesity
≥≥≥≥40404040 IIIIIIIIIIII ExtremelyExtremelyExtremelyExtremely HighHighHighHigh ExtremelyExtremelyExtremelyExtremely HighHighHighHigh
* Disease risk for Type 2 diabetes, hypertension and cardiovascular disease
+ Increased waist circumference can also be a marker for increased risk even in persons of normal weight.
The prevalence of obesity and overweight has been climbing substantially in
an increasing number of countries in the past two decades, replacing traditional
health problems such as malnutrition as the new threat to the health of populations.
Like many western countries, Australia encounters the epidemic of obesity as well.
Research showed that in Australia, 58% of women aged from 55 to 64 years are
classified as overweight or obese, this proportion decreased slightly to about 55% in
40
women aged from 65 to 74 years, and dropped further to 44% among women who
are 75 years older (Australian Bureau of Statistics, 2008a). The statistics clearly
shows that midlife women were the heaviest among all of the female age groups
(Australian Bureau of Statistics, 2008a). A substantially increased cost relating to
obesity has been revealed by recent studies (Cai, Lubitz, Flegal, & Pamuk, 2010;
Colagiuri et al., 2010). It was claimed (Colagiuri et al., 2010) that the direct annual
cost (health & non-health) for people who are obese was $2,788 (95%CI,
$2542-$3035), which was nearly twice as much as that for people with normal
weight ($1,472, 95%CI, $1204-$1740). Obese midlife women (defined as 45 years
in the study) are found to incur significantly higher average lifetime Medicare
costs than normal weight midlife women if they survive to 65 years old (Cai et al.,
2010). Moreover, literature has been constantly showing that overweight/obesity is a
risk factor for cardiovascular disease, certain types of cancer, diabetes mellitus and
kidney diseases (Chu et al., 2007; Dhaliwal & Welborn, 2009; Emmanuel & Jatkin,
2007; Jee et al., 2006) and related with high mortality (Cai et al., 2010). The
literature about the effect of obesity on mental health is reviewed in the next section.
Obesity and Depression
Despite a higher prevalence of anxiety disorders than affective disorders
(14.4% vs. 6.2%) (Australian Bureau of Statistics, 2007), depression received much
more attention from researchers than anxiety. The research studies investigating the
effect of obesity on depression, both cross-sectional and longitudinal, have been
growing rapidly in the past decade. These studies commonly have a large sample
size (such as national surveys) and most of them cover a broad age range (e.g. 18+
41
years), thus providing valuable information on the effect of obesity and overweight
on depression.
Findings from cross-sectional studies have not been consistent, and the role
of gender in this correlation remains undetermined. Several studies found that people
with obesity had an increased risk of having depression as compared to people with
normal weight (Barry, Pietrzak, & Petry, 2008; Bruffaerts et al., 2008; Carpenter,
Hasin, Allison, & Faith, 2000; Chen, Jiang, & Mao, 2009; Dong, Sanchez, & Price,
2004; Eunkyung, 2009; Heo et al., 2006; Mather, Cox, Enns, & Sareen, 2009; Scott
et al., 2008; Zhao et al., 2009), while other studies found a non-significant
correlation between obesity and depression (Goldney, Dunn, Air, Dal Grande, &
Taylor, 2009; Hach et al., 2007; Hach, Ruhl, Klotsche, Klose, & Jacobi, 2006; Jorm
et al., 2003; Turley, Tobias, & Paul, 2006). As mentioned earlier, these studies
generally have large and nationally representative sample sizes. But important
confounders such as physical illnesses and lifestyle factors were not necessarily
controlled for.
It is noticed that controlling for important confounders was not as prevalent
in studies demonstrating a positive relationship than in studies discovering a
non-significant relationship (50% vs. 80%). For example, a study carried out in six
European countries found that people with obesity are 30% (95%CI, 1.0-1.8) more
likely to have mood disorder and 40% (95%CI, 1.0-2.2) more likely to have more
than one mental disorder (Bruffaerts et al., 2008). Yet, this study did not control for
physical health conditions, only sociodemographic factors. This may have masked
the true relationship between the two variables. In the fourteen reviewed
cross-sectional studies, eight studies found an increased risk of having depression
within women (Barry et al., 2008; Carpenter et al., 2000; Chen et al., 2009; Dong et

42
al., 2004; Eunkyung, 2009; Mather et al., 2009; Scott et al., 2008; Zhao et al., 2009),
while only three studies revealed similar findings in men (Barry et al., 2008; Dong et
al., 2004; Zhao et al., 2009). The moderating effect of gender is further complicated
when it was claimed that obesity had no association with depression in women, but
was a protective factor for depression in men, after adjusting for physical illnesses
and sociodemographic factors (Goldney et al., 2009). Nevertheless, a more robust
correlation between obesity and depression was seen in women, which lends support
to the explanation of a higher prevalence of depression in women than in men to
some extent.
The longitudinal prospective correlation between obesity and depression is
also debated. The most recent meta-analysis of longitudinal studies indicated that
both obesity and overweight at baseline increased the risk of depression at follow up
(OR, 1.55; 95% CI, 1.22-1.98; OR, 1.27; 95%CI, 1.07-1.51), with no gender
difference being found (Luppino et al., 2010). However, this meta-analysis (Luppino
et al., 2010) was only able to adjust for age and sex. As acknowledged by the authors
themselves, the inability of controlling for potential covariates such as medication
use may have inhibited uncovering of the true effects and magnitude of obesity on
depression. Several more longitudinal studies were published after this meta-analysis.
One used a cohort at the age range from 51 to 61 years, and followed participants for
6 years (Carroll, Blanck, Serdula, & Brown, 2010). The results of the study showed
that women who remained obese during follow up were 40% (95% CI, 1.07-1.76)
more likely to develop depression as compared to those who remained non-obese.
For men, a non-significant relationship was found (OR, 1.10; 95%CI, 0.79-1.51). A
range of significant confounders were controlled in the study (Carroll et al., 2010).
The other study was undertaken in elderly people (70-79 years), with a 5-year follow

43
up (N = 2,547). It was discovered that after adjusting for sociodemographic factors,
chronic diseases and medications, obesity increased the risk of depression by 20% in
men, but no effect was seen among women (Vogelzangs et al., 2010). The
correlation was debated even more when the results of the analysis of the National
Population Health Survey (NPHS) in Canada were published (Gariepy, Wang,
Lesage, & Schmitz, 2010). In this study, past-year major depression was measured
by the Composite International Diagnostic Interview-Short Form for Major
Depression (CIDI-SFMD), and the measurement of BMI was self-reported.
Controlling for sociodemographic, health and lifestyle variables, the authors found
that obesity at baseline did not predict subsequent depression in women (HR, 1.03,
95%CI, 0.84-1.26), but was a protective factor for depression in men (HR, 0.71,
95%CI, 0.51-0.98). What needs to be considered is that Gariepy et al. (2010),
combined normal and overweight groups as a reference group, with which obesity
was compared. Therefore, the results may not necessarily be comparable to other
longitudinal studies.
Taken all together, it is clear that previous studies examining the effect of
obesity on depression have the advantages of using a large and representative sample.
However, the evidence supporting the hypothesis of the association between obesity
and depression is still weak (Atlantis & Baker, 2008). For women in particular, it
was argued that the correlation between obesity and depression may vary with age.
This is because when people who are older than 65 years are analysed individually,
the significant correlation between obesity and depression among women
disappeared (Heo et al., 2006). In addition, when people are stratified into different
age groups, obesity is correlated with depression in women aged from 18 to 39 years
(OR, 1.67; 95% CI, 1.29-2.15), but not with depression in women at the 40 to 59

44
years age range (Chen et al., 2009). Last, when a cohort of older people is
investigated, no correlation is observed in women, but a significant one is found in
men (Vogelzangs et al., 2010).
Obesity and Anxiety
The prevalence of anxiety is higher in many developed countries; studies
examining the effect of obesity on anxiety were also identified. Researchers from
Canada conducted a systematic review and meta-analysis with regard to the
associations between obesity and anxiety disorders in adults from community
samples (Gariepy, Nitka, & Schmitz, 2009). This collection of review articles
included fourteen cross-sectional and two prospective studies. The pooled estimates
of cross-sectional studies was 1.4 (95% CI, 1.2-1.6), with no moderating effect of
gender being observed. However, it was highlighted by the authors that half of the
studies included in the review had a poor control of confounders (Gariepy et al.,
2009), which may artificially inflate the magnitude of the correlation. As stated in
the paper, the pooled estimate of good quality studies was 1.2 (95% CI, 1.1-1.5),
which was lower than that of poor quality studies (OR, 1.5; 95% CI, 1.3-1.8). One
study carried out in Australia was not included in the review (Jorm et al., 2003). This
study reported anxiety scores among obese and non-obese groups, adjusting for
physical ill health, lack of physical activity, social support, education and financial
difficulty. The results suggested that obese women had significantly lower anxiety
scores than women with normal weight. Meanwhile, no difference was found in men
(Jorm et al., 2003).
The findings from prospective studies have not been consistent, partly due to
a shortage of studies. The two prospective studies reviewed by Gariepy et al. (2009)
45
generated different results, particularly for women. Another study followed 544
child-bearing age women for three decades and controlled for chronic disease, social
support and socioeconomic factors in the analysis. Results showed that women who
are obese were 6 times (95% CI, 1.39-28.16) more likely to develop anxiety (Kasen,
Cohen, Chen, & Must, 2008). In contrast, a Norwegian study only found an
increased risk of having anxiety in men (OR, 1.50; 95% CI, 1.23-1.83), not in
women (OR, 0.99; 95% CI, 0.85-1.15). This study was on a large scale (N = 33,777),
and well controlled for other unhealthy lifestyle factors, medication use and
sociodemographic factors (Bjerkeset, Romundstad, Evans, & Gunnell, 2008).
In brief, cross-sectional studies generally supported a positive relationship
between obesity and anxiety and the strength of the relationship is generally mild.
Gender does not seem to have a modifiable effect on the relationship as suggested by
cross-sectional studies. However, most of the evidence was derived from
cross-sectional studies; no conclusion can be drawn in terms of the longitudinal
effect of obesity and anxiety.
Obesity and General Mental Health
The measure of general mental health is commonly included in health related
quality of life assessment, of which the Medical Outcomes Study short form (SF-36)
is a widely applied measurement. In relation to relative weight categories, the
literature has consistently revealed that as compared to people with normal weight,
the physical health of people who are obese was often compromised, however, their
general mental health remained undisturbed (Mond & Baune, 2009; Renzaho,
Wooden, & Houng, 2010; Vasiljevic et al., 2008; Wee, Wu, Thumboo, Lee, & Tai,
2010). All the studies adopted cross-sectional designs, used an adequate sample size
46
ranging from 2,732 to 9,771, and controlled for essential confounders such as
chronic condition, social support and family functioning. For example, the study by
Renzaho et al. (2010) from Australia found that in women, physical functioning
declined continuously as the BMI increased, but deterioration of general mental
health (both MHI & MCS) was only observed for morbidly obese women (BMI ≥40),
not other obesity categories (BMI, 30.00-39.99). The difference in general mental
health was not significant across all weight categories (p = .0356). In short, the
studies provided strong evidence that women with obesity have impaired physical
functioning, but their general mental health remained as good as those with normal
weight.
Physical Activity and Mental Health
Epidemiology of Physical Activity
Physical activity is defined as any bodily movement produced by skeletal
muscles that result in energy expenditure significantly beyond resting level,
particularly involving continuous actions of large muscles (Briffa et al., 2006). It has
been long regarded as a simple and inexpensive way to maintain individuals’ health,
functioning and quality of life. Evidence from epidemiological studies and clinical
trials demonstrates that physical activity reduces the risk of developing coronary
heart disease, diabetes mellitus, stroke, hypertension, cancer, metabolic syndromes,
falls and osteoporosis (Breslow, Ballard-Barbash, Munoz, & Graubard, 2001;
Knowler et al., 2002; Li et al., 2006; Ma et al., 2008; Parker, Jacobs Jr, Schreiner,
Schmitz, & Dengel, 2007; Rothenbacher, Koenig, & Brenner, 2006). While being
physically active has proved to be beneficial to individuals’ health, individuals
leading a sedentary lifestyle had a higher risk of all-cause mortality (Lee & Skerrett,
2001).

47
In spite of the well demonstrated benefits of physical activity, the prevalence
of physical inactivity (defined as sedentary lifestyle and low level of physical
activity) in Australian adults declined by only a little (Australian Bureau of Statistics,
2006g; Bauman & Owen, 1999). Globally, over 60% of adults are not active enough
to benefit their cardiac health (World Health Organisation, 2003). The proportion of
Australian adults who are sedentary or taking infrequent physical activities (these
levels were defined by an estimation of daily energy expenditure based on the
frequency and duration of reported physical activity) were 30% and 36%
respectively (Bauman & Owen, 1999), which was associated with 7% of disease
burden in the country (Mathers, Vos, Stevenson, & Begg, 2000). By gender, it
accounts for 6.0% of total disease and injury burden in males and 7.5% in females,
respectively. Some subgroups like women, the low-income, and the elderly are even
less likely to take part in physical activities which provide basic health benefits
(Mathers, Vos, & Stevenson, 1999).
Physical Activity and Depression
The correlation between physical activity and depression has been long
discussed. It was believed that physical activity has a protective effect against
depression based on both biological and psychosocial mechanisms (Donaghy, 2007).
Physical activity increases the blood flow to the brain, stimulating the release of
endorphins and other chemicals depleted during depression. Psychosocially, physical
activity improves mental well-being by enhancing self-esteem and improving
body-image through the process of making plans, setting goals and achieving them.
For women approaching, at or after menopausal transition, physical activity may be
of greater importance. As they were reported to be less active (Wen et al., 2002),

48
they are at the stage of life when the risk of having many chronic diseases may
increase (American Heart Association, 2010).
The finding of cross-sectional design studies mostly suggested a favourable
effect of physical activity on depression (De Moor et al., 2006; Galper et al., 2006;
Goodwin, 2003; Hassmén, Koivula, & Uutela, 2000; Taylor-Piliae et al., 2010;
Vallance, Murray, Johnson, & Elavsky, 2010), except for two studies (Jackson, 2006;
Rakovac, Baric, & Heimer, 2007). While controlling for potential covariates such as
chronic disease, in studies demonstrating positive findings social support and
sometimes lifestyle factors were frequently observed. Although most of the studies
agreed on the protective effect of physical activity, it was noticed that the variation
in the measurement of physical activity was fairly considerable. In addition, the
majority of studies reviewed actually measured physical activity as exercise, not
physical activity which did not involve exercise. For example, a postmenopausal
women study used both subjective (meeting a physical activity guideline,
self-reporting) and objective (pedometer) measurements of physical activity
(Vallance et al., 2010). It was found that women who met the physical activity
recommendation had a significantly lower score of depression (effect size d = .27, p
= .022) than those who did not, while women achieving 7,500 steps per day did not
have less depression symptoms (effect size d = .20, p = .078).
Galper et al. (2006) also measured physical activity in both subjective
(self-report of a physical activity inventory) and objective (treadmill) methods, but
the results yielded from the two methods showed both were beneficial (Galper, et al.,
2006). Other studies used questions to identify the frequency of exercise (Goodwin,
2003; Hassmén et al., 2000). One of the studies claiming a non-significant
relationship between physical activity and depression was flawed in failing to control
49
for any potential covariates (Rakovac et al., 2007). In addition, it defined physical
activity as going to the gym regularly for at least 5 years. This method does not
necessarily allow comparison between physically active and inactive women, as
women can do exercise outside of the gym (Rakovac et al., 2007).
Longitudinal prospective studies carried out in the U.S., Australia, the U.K.
and Japan provided additional support for the protective effect of physical activity
against depression (Bhui & Fletcher, 2000; Brown, Ford, Burton, Marshall, &
Dobson, 2005; Fukukawa et al., 2004; Strawbridge, Deleger, Roberts, & Kaplan,
2002; Van Gool et al., 2007). For instance, the last mentioned study found that
people who reported themselves as having more than 30 minutes light activity per
day had about 50% reduced risk of having depression within the six year period of
the study. A number of confounders were controlled during analysis. These included
age, marital status, education, function and number of chronic diseases (Van Gool et
al., 2007). In addition, in a study on Australian women in midlife it was reported that
compared to women who reported less than 60 minutes of moderate physical activity
per week, those who reported physical activity beyond this level had 30% to 40%
less risk of having depression within a five year period (Brown et al., 2005). A
Japanese study, however, suggested that the protective effect of physical activity
might be limited to age, as the study showed that walking had a protective effect
against depression for people aged from 65 to 79 years, but not for the mid-aged
(40-64 years) (Fukukawa et al., 2004). Furthermore, one study claimed that physical
activity only benefited men, but not women (Bhui & Fletcher, 2000).
In all, previous studies achieved agreement of the protective effect of
physical activity against depression. Men and women are equally likely to gain
psychological benefits from physical activity, while the moderating effect of age still
50
requires further research. However, it should be noted that most of the studies
examined physical activity as exercise; hence the relationship of depression with
physical activity unrelated to exercise remained unanswered.
Physical Activity and Anxiety
Evidence about the influence of physical activity on anxiety was primarily
drawn from cross-sectional studies, the results of which constantly showed a
beneficial effect of physical activity on anxiety (De Moor et al., 2006; Goodwin
2003; Rakovac et al., 2007; Vallance et al., 2010). For example, the study of 217
postmenopausal women showed that women whose physical activity level meeting
the guidelines reported significantly fewer symptoms of anxiety than those who did
not meet the guidelines by conducting a univariate ANOVA analysis (Vallance et al.,
2010). In addition, this result remained unchanged after adjusting for age, BMI and
co-morbidities.
Longitudinal studies in this area were rather limited as compared to
depression studies. One U.K. study undertaken in 2000 investigated anxiety by
means of a General Health Questionnaire (GHQ). The results showed that, after
adjusting for age, smoking, disability, income, employment and baseline GHQ score,
there was no relationship between exercise and anxiety in women, only a favourable
effect observed in men (Bhui & Fletcher, 2000). The relationship between physical
activity and anxiety has received much less attention when compared to the
relationship between physical activity and depression. Similar variance in the
measurement of physical activity existed in the literature on physical activity and
anxiety. Therefore, it was recognised that the beneficial effect of physical activity
mainly referred to exercise. No long-term effect of physical activity on anxiety could

51
be determined at this stage due to the lack of longitudinal prospective studies
(Martinsen, 2008).
Physical Activity and General Mental Health
As measured by the mental health scale or mental composite score of the
SF-36, all of the studies indicated a better general mental health in people who are
more physically active than inactive individuals (Aoyagi, Park, Park, & Shephard,
2010; Vallance et al., 2010). In postmenopausal women, it was also found that
women meeting the recommended guidelines of physical activity had a mental
composite scores (MCS) of 52.1 (SD = 6.8), which was significantly higher than that
of women who did not meet the guideline (49.8 ± 8.3, p = .011). The result of this
study was believed to be reliable, as the study took consideration of confounders
including socioeconomic factors, smoking, BMI and co-morbidities (Vallance et al.,
2010). A further study has made an additional contribution to the area, examining the
interaction between physical activity not involving exercise and physical activity as
exercise on general mental health (Aoyagi et al., 2010). In the end, the authors found
that after adjusting for the former and other confounders, older people engaging in
activity > 3 Metabolic Equivalent Tasks (MET) had a significant higher score on a
mental health scale as well as increased physical functioning, vitality and body pain,
in spite of the absence of gender specific results in this study report.
Longitudinal prospective effect of physical activity was less explored.
Australian researchers evaluated the correlation between physical activity and mental
health among midlife women over five years. Controlling for sociodemographic
factors, smoking, BMI, menopause and chronic conditions, the study found a
52
30%-40% lower risk of having a MCS score under 52 for women reporting more
than 60 minutes of moderate physical activity per week (Brown et al., 2005).
In general, it was believed that physical activity has a positive relationship
with general mental health, regardless of gender. What needs to be noted is that the
evidence was mainly based on cross-sectional studies; hence, further research is
required to permit exploration of the long-term effect of physical activity on general
mental health.
Smoking and Mental Health
Epidemiology of Smoking
Smoking is strongly correlated with morbidities and mortality (Majid Ezzati,
Henley, Lopez, & Thun, 2005; Ezzati & Lopez, 2004; Warren, Jones, Eriksen, &
Asma, 2006) and is also the leading preventable cause of death around the world,
including in Australia. In spite of the relatively stable downward trend of smoking
prevalence in Australia from 22.9% in 1997 to 18.4% in 2005 (Social Research
Centre, 2006), tobacco smoking was still responsible for 7.8% of the total burden of
disease and injury in the country in 2005 (Australian Bureau of Statistics, 2006b),
ranking as the first among all health risk factors. As revealed by the latest release of
smoking estimates from the WHO, in many developing countries, the prevalence of
current female smokers was much lower than that among males (Storr et al., 2010).
For example, in China, the percentage of current smokers was 55.5% for men and
5.5% for women. But, in Australia, women were almost equally likely to be a current
smoker. The prevalence of current smokers was 26% in men and 20% in women,
respectively (Keizer & Eytan, 2005). Therefore, reducing smoking should always be
a routine in chronic disease prevention among women. Research has shown that
smoking is a pertinent issue for individuals with mental disorders, with 33% of the
53
cigarettes being consumed by people with 12-month duration of mental disorders
(Tobias, Templeton, & Collings, 2008).
Smoking and Depression
It has been long regarded that there is a strong linkage between smoking and
depression in general populations, as indicated by a number of cross-sectional
studies (Hämäläinen et al., 2001; Husky, Mazure, Paliwal, & McKee, 2008; Khaled
et al., 2009; Lawrence, Mitrou, & Zubrick, 2009; Massak & Graham, 2008; Nakata
et al., 2008; Pasco et al., 2008; Pomerleau, Zucker, & Stewart, 2003; Trosclair &
Dube, 2010) , except for two studies that were undertaken in Norway (Mykletun,
Overland, Aarø, Liabø, & Stewart, 2008) and Chile (Araya, Gaete, Rojas, Fritsch, &
Lewis, 2007). Smoking status which was classified never, past (ex- or quitter), and
current, was commonly seen across the literature as a relevant indicator. Studies
usually targeted a broad age range of participants, and an even distribution of males
and females in sample population was observed. The sample sizes were fairly large,
ranging from 931 in an exclusively female study (Pomerleau et al., 2003) to 73, 024
in an American national survey (Trosclair & Dube, 2010).
Different effect sizes were seen among studies supporting a positive
correlation between smoking and depression. For instance, in one study, the authors
used both clinical interview and the Centre for Epidemiologic Study Depression
Scale (CESD) (Lewinsohn, Seeley, Roberts, & Allen, 1997) to measure depression
(Massak & Graham, 2008). After adjustment for age, education, alcohol and gender,
the analysis showed that the odds of having depression for current smokers were
1.10-3.24 as compared to non-smokers. In a Canadian study, among women older
than 12 years, the proportion of depression among current smokers was 14.8%,

54
which was much higher than 4.0% for the category of former smokers, and 4.6% for
those who have never smoked (Khaled et al., 2009). Scores on a depression scale
(CESD) were also reported, with a significantly higher depression score being found
in current smokers than non-smokers (13.63 ± 9.14 vs. 10.73 ± 9.75, p < .001). The
difference accounted for several confounders including age, education and marital
status (Pomerleau et al., 2003). Regardless of the effect sizes expressed in these
studies, smoking is believed to be a risk factor for depression in most of the studies.
In addition, being a female was indicated to be another strong risk factor for
depression, beyond the effect of smoking (Hämäläinen et al., 2001).
However, in some cultures, smoking may not be a risk factor for depression.
The HUNT study (N = 60, 814) conducted in Norway did not find an elevated risk of
depression among current smokers as compared to non-smokers (OR, 1.10; 95% CI,
0.99-1.21), after adjusting for sociodemographic factors, somatic symptoms, alcohol,
physical activity and other covariates (Mykletun et al., 2008). This study utilised the
Hospital Anxiety and Depression Scale (HADS) (Zigmond & Snaith, 1983) as the
instrument of depression measurement, and applied 8 points (in a range of 0 to 21) as
the cutoff score. Also in Chile, when adults from a community sample were studied
(N = 3,870), the odds of having depression was also non-significant (OR, 1.49; 95%
CI, 0.9-2.5), controlling for sociodemographic factors.
Despite the strong evidence from cross-sectional studies, whether smoking
initiates depression remains unclear. Some studies agree that smoking increased the
risk (2 to 4 times) of developing depression (Klungsoyr, Nygard, Sorensen, &
Sandanger, 2006; Pasco et al., 2008), some do not agree (Cuijpers, Smit, Ten Have,
& De Graaf, 2007; Takeuchi, Nakao, & Yano, 2004), and some authors argued the
risk only existed in males (Korhonen et al., 2007). It was noticed that all the
55
longitudinal studies performed a good control of potential confounders including
sociodemographic factors, somatic diseases and sometimes lifestyle factors;
therefore, it was less likely that the true association was biased. The length of follow
up did vary to a large extent, ranging from one year to eleven years. Given the effect
of smoking on the human body usually accommodated by the body’s homeostatic
response, long-term sequelae such as depression may only be reliably demonstrated
over an extended time frame (Pasco et al., 2008). However, the role of gender in
cohort studies remained unclear.
Smoking and Anxiety
The U.S. National Survey on Drug Use and Health surveyed the prevalence
of smoking among individuals with various mental disorders between 2005 and 2006
(Trosclair & Dube, 2010). The prevalence of smoking was highest among
individuals with both anxiety and depression (41.3%), followed by those having
anxiety 35.2%, and was lowest among those having depression (29.9%). But the
correlation between smoking and anxiety was less examined than that between
smoking and depression. Nevertheless, all of the existing literature suggested a
positive relationship between anxiety and smoking, regardless of the study design
and measurement of anxiety (Araya et al., 2007; Cuijpers et al., 2007; Mykletun et
al., 2008; Tselebis, Panaghiotou, Theotoka, & Ilias, 2001).
The previously listed study also examined anxiety using the HADS.
Although they failed to find a non-significant association of smoking in relation to
depression, results of the study did suggest an increased risk of having anxiety
among current smokers (OR, 1.22; 95% CI, 1.13-1.30), as compared to non-smokers.
A significant, though lower risk of anxiety was also found among quitters (OR, 1.08;
95%CI, 1.00-1.62) (Mykletun et al., 2008). The other study of 114 female nurses
56
(mean age: 33 ± 6 years) used the State Trait Anxiety Inventory (STAI) to compare
anxiety symptoms according to smoking status. Authors found a significantly higher
anxiety score in current smokers than in non-smokers (43.04 ± 8.48; 38.94 ± 6.45, p
< .02), although confounding control was missing (Tselebis et al., 2001).
A prospective study from The Netherlands examined whether baseline
smoking predicted depression in two years (Cuijpers et al., 2007). In this study,
mental disorders were assessed by the Composite International Diagnostic Interview
(CIDI) (Patten, Brandon-Christie, Devji, & Sedmak, 2000). In relation to anxiety, it
was found that the risk of developing any anxiety disorder was increased by 70%
(95%CI, 1.10-2.86). More importantly, the risk of having general anxiety disorder
was the highest, being nearly four times (IRR, 3.80, 95% CI, 1.09-13.21).
Due to being limited to the number of studies on the association between
anxiety and smoking, the effect of gender could not be determined based on the
current literature. In all, it was considered that people who are current smokers have
a higher risk of anxiety than non-smokers, yet more longitudinal research is
warranted to validate the longitudinal relationship and possibly, to investigate the
role of gender.
Smoking and General Mental Health
The correlation between smoking and general mental health has achieved less
consistency, particularly in the longitudinal correlation. An Iranian study examined
water pipe smoking and health related quality of life in a general population (N =
1,675) via a cross-sectional design (Tavafian, Aghamolaei, & Zare, 2009). The
authors compared the odds of having poor mental health (MCS < 50) for water pipe
smokers and non-smokers. The results showed that current smokers were twice as
likely to have poor mental health (OR, 1.88; 95% CI, 1.36-2.60). Sociodemographic

57
factors including age, education and employment were adjusted for in the analysis,
and being female increased the risk of having poor mental health as well (OR, 2.26;
95% CI, 1.55-3.30). These results corresponded to an earlier Japanese study (Mino et
al., 2001).
However, the long-term effect of smoking on general mental health was less
clear. The Japanese study incorporated a prospective design with a follow up period
of two years. As measured by the General Health Questionnaire, mental health was
constantly found to be worse among current smokers over 24 months, particularly in
women (Mino et al., 2001). The Nurses’ Health Study in America was comprised of
158,736 nurses aged from 29 to 71 years. The relationship between smoking and
mental health (SF-36) was investigated in 1992/1993 and 2000/2001 (Sarna, Bialous,
Cooley, Jun, & Feskanich, 2008). The baseline analysis showed that current smokers
had a significantly worse general mental health than non-smokers (MCS -2.0; MHI
-3.7) after adjustment for age, BMI, physical activity, living alone and
co-morbidities. Moreover, it was found in this nursing cohort that nurses’ mental
health improved steadily as they age across all smoking statuses, but the disparities
of mental health as related to smoking status remained (Sarna et al., 2008). These
studies may suggest that smoking does have a strong negative impact on people’s
general mental health, yet further research is required to verify the correlation.
Alcohol Use and Mental Health
Epidemiology of Alcohol Use
A rise in alcohol consumption is seen around the world, especially in many
developing countries (World Health Organisation, 2008). In Australia, alcohol
dependence and harmful use was ranked 17th in the 20 leading causes of the burden
58
of disease and injury in 2003. The proportion of people drinking at a high risk level
has kept increasing over the last three National Health Surveys, from 8.2% in 1995
to 10.8% in 2001 and 13.4% in 2004-2005, with greater increases in women than in
men, after adjustment for age differences (Australian Bureau of Statistics, 2006c).
Globally, alcohol causes 3.2% of total deaths and contributes to 4% of the disease
burden (World Health Organisation, 2008). Varied detrimental health effects of high
risk alcohol use have been identified, ranging from long-term risk like the
development of chronic diseases to short-term consequences including an increasing
number of hospital admissions (Hart & Smith, 2009). Alcohol consumption not only
affects physical health, but also mental health status too. Some research studies on
alcohol consumption and mental health are detailed in the next few sections. This
review focused on alcohol consumption rather than alcohol dependence or
alcoholism.
Alcohol Use and Depression
Summarising the correlation between alcohol consumption and depression is
somewhat challenging. Unlike alcohol dependence, which could be diagnosed by
CIDI or another standardised instrument, there is the lack of a standard means for
measuring alcohol consumption. In the literature, the measurement of alcohol varied
considerably, which contributed to the difficulty of effective comparison of the
studies. In general, the cross-sectional studies suggested a correlation between
alcohol consumption and depression. For example, Chan and his colleagues
conducted a study in 1,594 middle-class people aged 50-97 years in the U.S., and
they measured alcohol consumption by quantifying the number of drinks in the past
two weeks and the frequency of drinking in the last week (Chan, Von Muhlen,
59
Kritz-Silverstein, & Barrett-Connor, 2009). Controlling for age, chronic diseases and
lifestyle factors, the results indicated that in females, the prevalence of depression
decreased gradually as the alcohol consumption increased (non-drinkers: 15.4%;
occasional: 8.3%; light: 7.3%; moderate: 2.4%, p<0.001), yet the results were
non-significant in males (Chan et al., 2009). This negative and linear relationship
actually suggested that alcohol drinking was protective against depression, however,
it should be noticed that among this midlife and older population, the prevalence of
alcohol abuse was very low, the adverse effect of which may therefore be difficult to
detect.
However in an Australian study, a U-shaped correlation was found in 2,725
adults, both male and female (Rodgers et al., 2000). In this study, participants were
categorised into five levels including non-drinking, occasional, low-level, high-level
and hazardous drinking based on the Australian National Health and Medical
Research Council. The analysis showed that women drinking at a low level (< 7
standard drinks per week) had the least depression symptoms (Rodgers et al., 2000)
after adjustment for sociodemographic factors, childhood adversity, social support
and personality factors.
In addition, another Australian study, which classified young adults (20-24
years) into light, moderate, hazardous and harmful drinking levels, found a linear
one in women controlling for similar confounders as in the study by Rodgers was
found (Caldwell et al., 2002). These two studies paralleled in study design,
measurement of alcohol and confounding effect control, only the age of the samples
differed. Therefore, this may suggest that the pattern of the correlation varies in the
course of a life time (Alati et al., 2005), as the prevalence of alcohol consumption is
lower in older people (Australian Bureau of Statistics, 2006c). Lastly, analysis based

60
on the Norwegian HUNT study revealed a U-shaped correlation too, without
identifying a gender effect (Skogen, Harvey, Henderson, Stordal, & Mykletun,
2009).
The temporal association between alcohol consumption and depression also
remained uncertain. Canadian researchers conducted a follow up study over the
duration of two years in a national general population sample (Wang & Patten, 2001).
This study used four different ways to differentiate levels of alcohol consumption.
Basically, no difference was detected with regard to the incidence rate of depression
regardless of the measurements of alcohol. Only women who reported having more
than five drinks on a drinking occasion had a higher incidence rate of depression
than those who drank less than this level (6.4% vs. 3.7%). Furthermore, it has been
demonstrated that excessive and hazardous drinking was not related with the onset of
depression, and abstinence was associated with a reduced risk of developing
depression (Haynes et al., 2005). The follow-up of the study was one and half years
and important confounders included sociodemographic factors, life events, social
support, smoking and mental health at baseline. It was noticed that both studies
followed participants for no more than two years, which may not be long enough for
depression to occur.
In brief, evidence from cross-sectional studies confirmed the correlation
between alcohol consumption and depression, despite a substantial variance in the
measurement of alcohol consumption. The pattern and significance level of the
correlation may be affected by age and gender. No conclusion can be drawn
regarding the longitudinal effect of alcohol on depression.
61
Alcohol Use and Anxiety
The issue of alcohol measurement remained among studies examining its
effect on anxiety. The study by Rodgers et al. described above also examined
depression in 2,725 Australian aged from 18-59 years, finding a U-shaped
relationship between alcohol use and anxiety assessed by the Goldberg Depression
and Anxiety scale (GDAS) in both men and women after controlling for
sociodemographic factors, childhood adversity, social support and personality
(Rodgers et al., 2000). In addition, in women at child-bearing age, a variation of the
correlation was observed: a J-shaped relationship when women were in their 30s,
and a linear relationship when women were at 25 and 40 years (Alati et al., 2005).
Furthermore, a study from Norway also defined a U-shaped relationship among
abstainers and low-level alcohol consumers. The results suggested that abstention
was related to an increased chance of anxiety (OR, 1.34; 95% CI, 1.19-1.52) as
compared to people drinking moderately, after controlling for socioeconomic status,
social network, somatic illness and gender (Skogen et al., 2009).
For the prospective association, only a study from the U.K. was found
(Haynes et al., 2005). The results of the study did not support a significant
correlation between baseline excessive alcohol use and anxiety, while for frequency
of binge drinking, the men who binge drank weekly were found to be three times
more likely to have anxiety as compared to those with less than monthly bingeing
(OR, 3.14; 95% CI, 1.07-9.26).
In short, the existing literature revealed a significant linkage between alcohol
consumption and anxiety. The studies had the strength of using a large-scale sample
size and controlling for potential confounders, however, the lack of consistent
measurement of alcohol consumption inhibited comparison among studies.

62
Alcohol Use and General Mental Health
A six year long study examined a cohort of old women aged from 70 to75
years (N = 12,432) from 1996 to 2002 to investigate the alcohol use effect on
mortality and health- related quality of life (Byles, Young, Furuya, & Parkinson,
2006). Interestingly, the authors found that women consuming a moderate intake of
alcohol (1-2 drinks/day on 3-6 days) had better mental health (measured by the
SF-36-MHI) compared to non-drinkers (78 vs. 75, p < .005), and were less likely to
die as compared to non-drinkers. While in the study by Chan et al. (2009), mental
health (SF-36, MCS) was not significantly related with the number of drinks
consumed in the past week in women (β = .154, p = .19), it was positively related in
men (β = .220, p = .01), after adjustment for age, BMI, current smoking, exercise
and current use of estrogen in women. Although Chan and colleagues did not find a
significant benefit of alcohol consumption on general mental health, their study did
discover that the number of alcoholic drinks was negatively related with depression.
Therefore, it was considered that essentially the study by Byles et al. (2006) and
Chan et al. (2009) provided some evidence of moderate alcohol consumption’s effect
on general mental health, particularly in women. It is important to note that these
findings were drawn from older populations, who are less likely to have drinking
problems; therefore, the ability to apply the findings to a younger population remains
uncertain.
63
Diabetes and Mental Health
Epidemiology of Diabetes
Diabetes is a serious chronic illness with multiple complications and
premature mortality (World Health Organisation, 2006). In Australia, 3.6% of the
whole population has diabetes, which equals approximately 700,000 persons; of all,
83% are Type 2 diabetes (Australian Bureau of Statistics, 2006e). Type 2 diabetes is
likely to develop after 40 years of age, and is strongly associated with obesity,
physical inactivity, and unhealthy diet. For example, the Nurses’ Health Study (N =
78,419), applying a longitudinal analysis, concluded that obesity or weight gain was
a significant risk factor of diabetes (Shai et al., 2006). The study showed that for
non-indigenous Americans, each 5-unit increment in BMI resulted in a twofold
increase in the risk of having diabetes. Additionally, it was found that for each 5 kg
of weight gain, the risk of diabetes was increased by 50% (95% CI, 26%-63%). The
adjusted relative risk (RR) of diabetes ranged from 1.55 to 2.36. Apart from obesity,
physical inactivity was also shown to be a critical risk factor, with an adverse effect
independent from obesity (Sullivan, Morrato, Ghushchyan, Wyatt, & Hill, 2005).
Using a nationally representative sample, Sullivan and colleagues (2005) found that
compared to active people of normal weight , inactive individuals of normal weight
had 50% increased risk of having diabetes (95% CI, 1.25-1.86), while the increased
risk for overweight and inactive ones was 1.65 (95% CI, 1.40-1.96).
Given the strong correlation between obesity and physical inactivity for
diabetes, and the pervasive obesity and physical inactivity, it was projected that the
prevalence of diabetes would be doubled in 2030 from a prevalence rate of 2.8% in
2000, if no urgent action were taken. In fact in Australia, it was estimated that every
64
year, 0.8% of Australian adults were developing diabetes, which equalled 275 new
diabetic patients every day (Barr et al., 2005).
The body of research studies on diabetes complications is expanding fast. For
example, diabetes was found to increase the risk of developing heart diseases (Lafitte
et al., 2010), and furthermore, to correspond to a climbing incidence rate of Type 2
diabetes-related amputations (Vamos, Bottle, Majeed, & Millett, 2010). More
importantly, when mental health problems co-exist with diabetes, it is likely to
further worsen the prognosis. In patients with diabetes, depression has been
associated with worsened glycaemia control (Lustman et al., 2000), non-adherence
to treatment (Ciechanowski, Katon, & Russo, 2000), higher disability bed days
(Egede, 2004) and increased mortality (Ismail, Winkley, Stahl, Chalder, & Edmonds,
2007). Anxiety was significantly associated with poor hyperglycaemia control
(Anderson et al., 2002). A recent large-scale study examined panic episodes among
4385 diabetic patients (95% were Type 2 diabetes) and they reported panic episodes
that were associated with poor glycaemia control, increased diabetic complication,
greater disability and lower self-rated health and social and emotional functioning
(Ludman et al., 2006). Research findings about the correlation between diabetes and
two common mental health problems, depression and anxiety, is detailed in the
following sections.
Diabetes and Depression
A growing number of research articles agree that depression is much more
prevalent in patients with Type 2 diabetes. Evidence from systematic reviews and
meta-analysis (Ali, Stone, Peters, Davies, & Khunti, 2006; Anderson, Freedland,
Clouse & Lustman, 2001) demonstrated that the risk of depression among people
with Type 2 diabetes was 60% (95% CI, 1.2-2.0) as compared to those without
65
diabetes. Despite the advantages of this meta-analysis, which enables a more
objective and accurate estimation of the correlation, it was believed that the true
correlation between diabetes and depression may be skewed. This was because in
most studies, patients with diabetes differed from those without it in many factors
that are associated with depression, such as obesity. This weakness was highlighted
by the authors themselves (Ali et al., 2006). In addition, these systematic reviews
were based on cross-sectional studies, hence providing no clue to the impact of
diabetes on depression over an extended time frame.
In 2008, Mezuk and colleagues conducted a meta-analysis on the longitudinal
correlation between Type 2 diabetes and depression. The estimation of Type 2
diabetes predicting depression was based on seven longitudinal studies. The pooled
relative risk (RR) of depression among those with Type 2 diabetes was shown to be
1.15 (95% CI, 1.02-1.30), which indicated an association of modest magnitude
(Mezuk, Eaton, Albrecht, & Golden, 2008). Meta-analysis is not without limitations.
When extracting the data from the original studies, the authors only obtained the
estimates that were most closely adjusted for sociodemographic factors (Mezuk et al.,
2008).
Although this approach allows effective comparison among studies, it does
artificially alter the correlation between Type 2 diabetes and depression due to the
failure of including fully adjusted estimates. For example, one (De Jonge, Roy, Saz,
Marcos, & Lobo, 2006) of the studies included in this review (De Jonge et al., 2006)
followed an older community population (≥ 55 years) for five years using a standard
interview to assess depression. The age and sex adjusted chance of depression was
1.42 (95% CI, 1.04-1.93); however, after controlling for a full range of confounders
including sociodemographic factors, somatic illnesses and cognitive functioning, the
66
strength of the association was attenuated and became non-significant (OR, 1.26;
95% CI, 0.90-1.77). In contrast, in the meta-analysis (Mezuk et al., 2008), the cruder
estimate was analysed.
In all, the current literature provided some evidence that people with diabetes
are more likely to present and develop depression. However, as mentioned by
authors of systematic reviews, the reliability of the estimated risk of depression
among diabetes may be compromised due to a lack of good control of important
confounding factors including unhealthy lifestyle factors. Given the strong linkage
between unhealthy lifestyle factors and Type 2 diabetes, and their (unhealthy
lifestyle factors’) impact on depression, controlling for lifestyle factors was
considered to be fundamental for the effective comparison of depression between
diabetic and non-diabetic individuals.
Diabetes and Anxiety
The co-occurrence of anxiety and diabetes has also been researched, although
the amount of literature seemed to be less than that on depression. Nevertheless,
previous studies in this area indicated a higher prevalence of anxiety among people
with diabetes than those without. For example, the German National Health
Interview and Examination, which was a cross-sectional study involving 4,169
individuals from the community (Kruse, Schmitz, & Thefeld, 2003), found that
patients with diabetes were much more likely to have anxiety disorder when
compared with the non-diabetic population (OR, 1.93; 95% CI, 1.19-3.14) after
controlling for age, sex, marital status, and socioeconomic status. A modified version
of the CIDI was used in the study to diagnose mental disorders (Kruse et al., 2003).
Systematic reviews were located on the prevalence of anxiety among people
with diabetes (Grigsby, Anderson, Freedland, Clouse, & Lustman, 2002), and it was

67
revealed that 40% of diabetic patients had elevated anxious symptoms, with a higher
prevalence in women compared to men (55.3% vs. 32.9%, p <.001). However, the
increased risk of anxiety among people with diabetes in contrast to the general
population was not able to be obtained as a result of the limited number of controlled
studies (Grigsby et al., 2002). After the publication of this systematic review,
Hermanns et al. (2005) claimed that the frequency of criteria-based anxiety disorders
was lower in diabetic patients compared with a non-diabetic reference sample (5.9%
vs. 9.0%). However in that study, a control group was not clearly identified and no
information on reference sources was available, hence, the conclusion of this study
was questionable. In all, it was considered that the cross-sectional studies provided
useful information on the risk of anxiety among people with diabetes, especially
when there was dearth of longitudinal studies at this stage. Further research
investigating the correlation between anxiety and diabetes may need to take lifestyle
factors into consideration.
Examining the Limitations of the Previous Research
This review of previous studies on the correlations between the four lifestyle
factors including overweight/obesity, physical activity, smoking and alcohol use and
mental health identified several limitations. First, much of the above described
research used large numbers of the general population as study samples with an age
range of 18 years and beyond, and a good number of them had an adequate control
of confounding variables. While intended to provide knowledge about the overall
correlations between lifestyle factors and mental health, the conflicting results
suggested that the correlations might not be homogenate. It is known that the
prevalence of mental health problems varies between different age groups, so do
68
lifestyle factors. Therefore, it is likely that the conflicting results are probably related
with age and gender, which underlines the importance of examining some specific
age and gender groups.
Second, when examining the individual relationships between lifestyle
factors and mental health, there is still a lack of adjustment for other lifestyle factors
in the literature. Given the strong associations among lifestyle factors themselves,
controlling for the interacting effect among lifestyle factors may be an important step
to permit reliable results in this regard.
Third, among studies investigating the impact of diabetes on mental health,
most of the studies were limited in the adjustment of potential confounders that
could interfere with the correlation between these two variables. Therefore, this may
have prevented exploration of unbiased relationships. Also, the literature search
identified a considerable number of studies evaluating the mental health in patients
with diabetes, but their general mental health in comparison with that of the general
population requires further research.
Finally, the lack of a theory-based approach is also noticeable among the
literature. Although the empirical studies in this field underscores the necessity of
developing corresponding strategies to enhance mental health related with lifestyle
factors, knowledge about how to improve mental health remains limited. As
discussed, the social cognitive theory recognises the reciprocal relationships between
personal and behavioural factors; therefore, it permits examination of the
associations between lifestyle factors (behavioural factors) and mental health
(personal factors). Furthermore, the social cognitive theory regards self-efficacy as
the central mediator that initiates behaviour change. The significance of self-efficacy
in predicting behaviour change has also been emphasised in many other theories.

69
Therefore, this study does not only aim to investigate the empirical correlations
between lifestyle factors and mental health, but also to examine the usefulness of
social cognitive theory in explaining any particular associations. If self-efficacy is
proved to be the mediator between lifestyle factors and mental health, corresponding
strategies may be implemented to promote self-efficacy, taking into account
consideration of individuals’ mental health level.
Conceptual Framework
To reiterate, the social cognitive theory was chosen as the foundation of
conceptual framework of the current research. The social cognitive theory is a broad
framework which depicts the reciprocal relationships between personal, behavioural
and environmental factors. The central position of self-efficacy in behavioural
change process is also illustrated clearly.
The current research focused on part of the social cognitive theory, which
included the linkage between behavioural factors (lifestyle factors) and personal ones
(mental health), and the mediating role of self-efficacy in this relationships. The
conceptual framework for the research study is depicted in Figure 2.8. The primary
elements in this conceptual framework are: 1) mental health, 2) self-efficacy, and 3)
four lifestyle factors: overweight/obesity, physical activity, smoking and alcohol use.
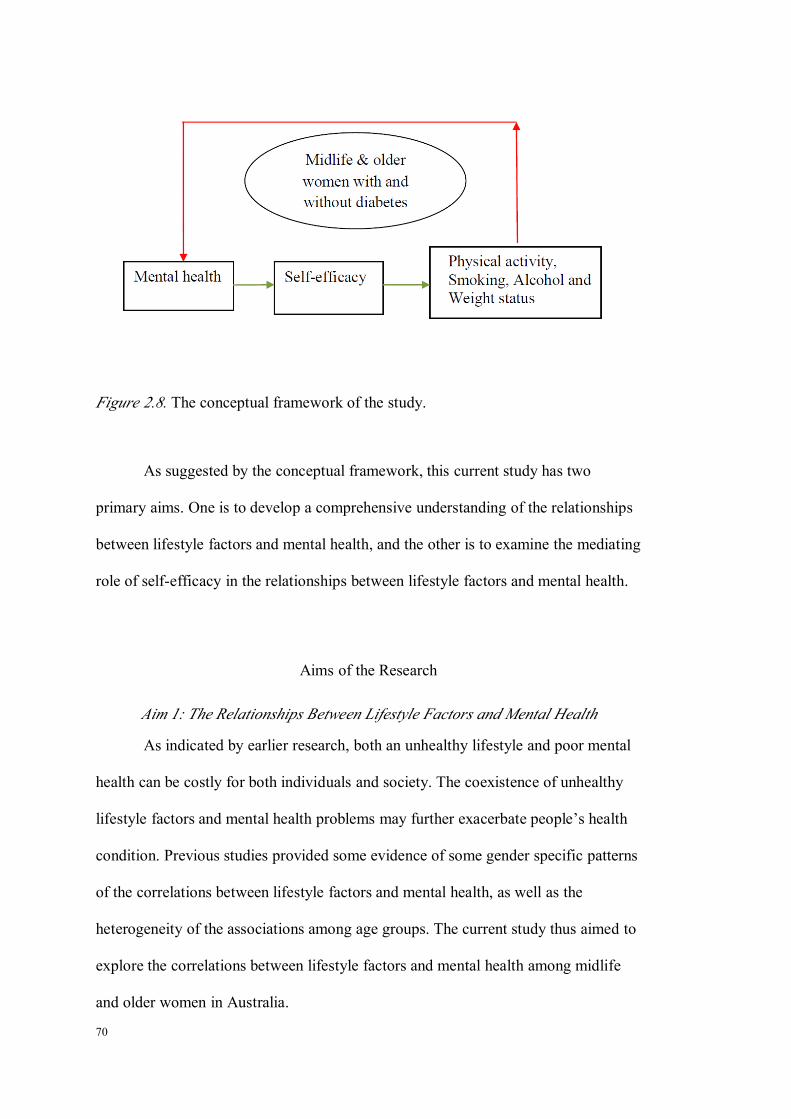
70
Figure 2.8. The conceptual framework of the study.
As suggested by the conceptual framework, this current study has two
primary aims. One is to develop a comprehensive understanding of the relationships
between lifestyle factors and mental health, and the other is to examine the mediating
role of self-efficacy in the relationships between lifestyle factors and mental health.
Aims of the Research
Aim 1: The Relationships Between Lifestyle Factors and Mental Health
As indicated by earlier research, both an unhealthy lifestyle and poor mental
health can be costly for both individuals and society. The coexistence of unhealthy
lifestyle factors and mental health problems may further exacerbate people’s health
condition. Previous studies provided some evidence of some gender specific patterns
of the correlations between lifestyle factors and mental health, as well as the
heterogeneity of the associations among age groups. The current study thus aimed to
explore the correlations between lifestyle factors and mental health among midlife
and older women in Australia.
71
To address Aim 1, three individual studies were undertaken. Study 1of the
research investigated the effect of lifestyle factors on mental health within a
population of Australian midlife and older women from the general community.
Study 1 aimed to generate knowledge that can be used in helping lifestyle
modification for the general population. Study 2 examined the difference of mental
health between midlife and older women with and without Type 2 diabetes, and
whether lifestyle factors contribute to the disparities. The findings of Study 2
extended the knowledge on effect of lifestyle factors on mental health and
underscored the importance of integrating mental health component in lifestyle
modification. Finally, Study 3 examined the effect of lifestyle factors on mental
health among midlife and older women with Type 2 diabetes. The profile of the
relationships may be useful in developing further intervention programs for a clinical
population.
Aim 2: Examining the Mediating Role of Self-efficacy
The efficacy of social cognitive theory in facilitating midlife and older
women from the general community to make positive lifestyle changes has been
confirmed (Anderson, Mizzari, Kain, & Webster, 2006). In Study 3 of the current
research, the mediating role of self-efficacy in the correlations between lifestyle
factors and mental health was examined in midlife and older women with a chronic
disease. A cross-sectional design and a clinical sample of midlife and older women
with diabetes were applied. Because of the reciprocal nature of the correlations
between lifestyle factors and mental health, the mediating role of self-efficacy was
examined in two directions. One is whether self-efficacy mediates the effect of
mental health on lifestyle factors, and the other is whether self-efficacy mediates the
72
effect of lifestyle factors on mental health. Seven research questions were created,
and presented as below.
Research Questions
1. What is the effect of lifestyle factors on mental health among midlife and
older women?
2. What is long term effect of lifestyle factors on mental health among midlife
and older women?
3. What is the difference in mental health between midlife and older women
with and without diabetes?
4. What are the contributing factors to the differences in mental health between
midlife and older women with and without diabetes?
5. Does self-efficacy mediate the effect of mental health on lifestyle factors
among midlife and older women with diabetes?
6. Does self-efficacy mediate the effect of lifestyle factors on mental health
among midlife and older women with diabetes?
Chapter Summary
The chapter started with a brief review on women and mental health, and
subsequently described the background of health promotion. Findings from the
literature suggest that women seem to be more vulnerable to mental health problems,
and highlight the importance of research on women at several reproductive stages
including menopause. Furthermore, a greater emphasis was placed on the physical

73
effect of lifestyle factors in the existing literature. Despite their well-known adverse
effects, the prevalence rate of unhealthy lifestyle factors shows no sign of reduction.
This contrast in the research suggests a shift of focus from physical health to mental
health.
To enable the examination of the relationships between lifestyle factors and
mental health, as well as producing knowledge for interventions aimed at improving
mental health, an appropriate behavioural theory is essential. Behavioural theories in
the field of health promotion were reviewed and contrasted. In the end, the rationale
for using social cognitive theory for the study was provided. Social cognitive theory
was chosen because of its ability to recognise the reciprocal correlations between
personal and behavioural factors.
Following this theoretical review, the literatures on the relationships between
the four lifestyle factors and mental health was detailed. This section can be viewed
as two parts: one is the relationship of each lifestyle factor with mental health in the
general population, and the other is the difference in mental health between people
with and without diabetes.
The limitations of previous studies were outlined after the literature review.
Finally, the conceptual framework and research questions of the study were
presented. The details on the methodology for the research study will be introduced
in Chapter 3.

74
75
CHAPTER 3: METHODOLOGY
Introduction
As discussed in Chapter 2, the two main aims of the current research were to
investigate the relationships between lifestyle factors and mental health among
midlife and older women from both community and diabetic clinics, and to explore
the mediating effect of self-efficacy in the relationships between lifestyle factors and
mental health within midlife and older women with diabetes. Both prospective and
cross-sectional designs were implemented and general and clinical samples were
utilised to address the aims. As mentioned, the current research has three individual
studies: Study 1, Study 2 and Study 3. Prior to presenting the methodology of the
studies, a brief review of a series of women’s health studies, on which the current
research was based, is undertaken. In addition, the linkage between the current
research and these women’s health projects is explained. Following this, the
methodology of each study of the research is described, which primarily includes the
design, the sampling, the measurement of variables and statistical analysis.
An Overview of the Women’s Health Studies
The women’s health studies upon which the current research study was built
were: the Healthy Ageing of Women Study (HOW), the Women’s Wellness Program
(WWP) and the chronic disease Women’s Wellness Program (CDWWP). Professor
Debra Anderson is the chief investigator of these projects.
The HOW study is a prospective, cross-cultural study comparing the
menopausal status, health related quality of life, as well as lifestyles between
Australian and Japanese midlife women. The data collection of the study occurred at
76
two sites, which were Queensland in Australia and Nagano in Japan, respectively.
The baseline study of the HOW was conducted in 2001, and its follow up study was
undertaken in 2006. The effect of country site of residence on menopausal status and
symptoms (Anderson, Yoshizawa, Gollschewski, Atogami, & Courtney, 2004), and
the difference in health related quality of life between women from these two
countries have been published earlier (Anderson & Yoshizawa, 2007). These
publications were based on the first wave of data collection. The longitudinal
relationships between lifestyle factors on mental health have not been explored
before this PhD study. For the current research, the Australian branch data from
2001 to 2006 were analysed.
The WWP study was designed following the HOW study. It utilised a
randomised controlled trial (RCT) design to evaluate the efficacy of a lifestyle
intervention for women living in the community. The sample of the WWP was
randomly selected from the HOW; therefore, it could be seen as an extension study
from the HOW. The intervention was of three-month duration, and has been proved
to be effective in improving women’s lifestyle and quality of life (Anderson et al.,
2006). Furthermore, it was also shown to have a sustainable effect in maintaining
positive lifestyle change (Smith-DiJulio & Anderson, 2009).
Extending from the WWP, which examined the treatment effect of a lifestyle
intervention for women from the general population, the CDWWP attempted to
replicate the lifestyle intervention with midlife and older women with a chronic
disease. As well, the CDWWP is a RCT, it has an intervention running over a period
of three months and is led by nurses. Up to the time of writing, the data collection of
the CDWWP was still ongoing; therefore, the efficacy of the intervention was yet to
be evaluated. A comparison of sociodemographic factors, lifestyle factors and
77
chronic conditions between women with and without Type 2 diabetes was presented
in the Women’s Health 2010: The 18th Annual Congress (Anderson, Lang, & Xu,
2010).
From the description, it can be seen that there is continuity among these
women’s health studies themselves in the sense of applying the knowledge obtained
from previous studies into the next. Based on the women’s health studies, the current
research specifically examined the data in terms of the relationships between
lifestyle factors and mental health in this population, which has not been studied in
this population prior to this research. The next section describes the design of the
current study, along with an explanation of the linkage between the current study and
these women’s health studies.
Linkage of the Current Research With HOW, WWP and CDWWP
The correlations between studies in the current research and these women’s
health projects are depicted in Figure 3.1. As can be seen from the graph, Study 1
was based on the HOW study; Study 2 was built on the WWP and CDWWP; and
Study 3 study was undertaken with the CDWWP.

78
Figure 3.1.The research design and its relation to women’s health studies.
Methodology of Study 1
Design
Study 1 used the Australian branch data of the HOW study and consequently
adopted a prospective longitudinal design. The first wave data (baseline) was
collected in 2001, and in 2006, women participating in the study in 2001 were
invited to take part in the second round of the survey (follow up).
Sample
Women who took part in both waves of the HOW study, were selected as the
study sample of Study 1. The sampling procedure of Study 1 (HOW) is described
below. In 2001, six postcode areas in South East Queensland, Australia were
selected as the districts of sampling. A balanced sample from both rural and urban
areas was obtained. Broad inclusion criteria were applied, which were: 1) female; 2)
45 to 60 years of age; and 3) being able to communicate in English. This initial
procedure identified 10,923 eligible women in total, and of those, 1,500 women were
randomly selected and invited to participate in the HOW study. Eventually, 886
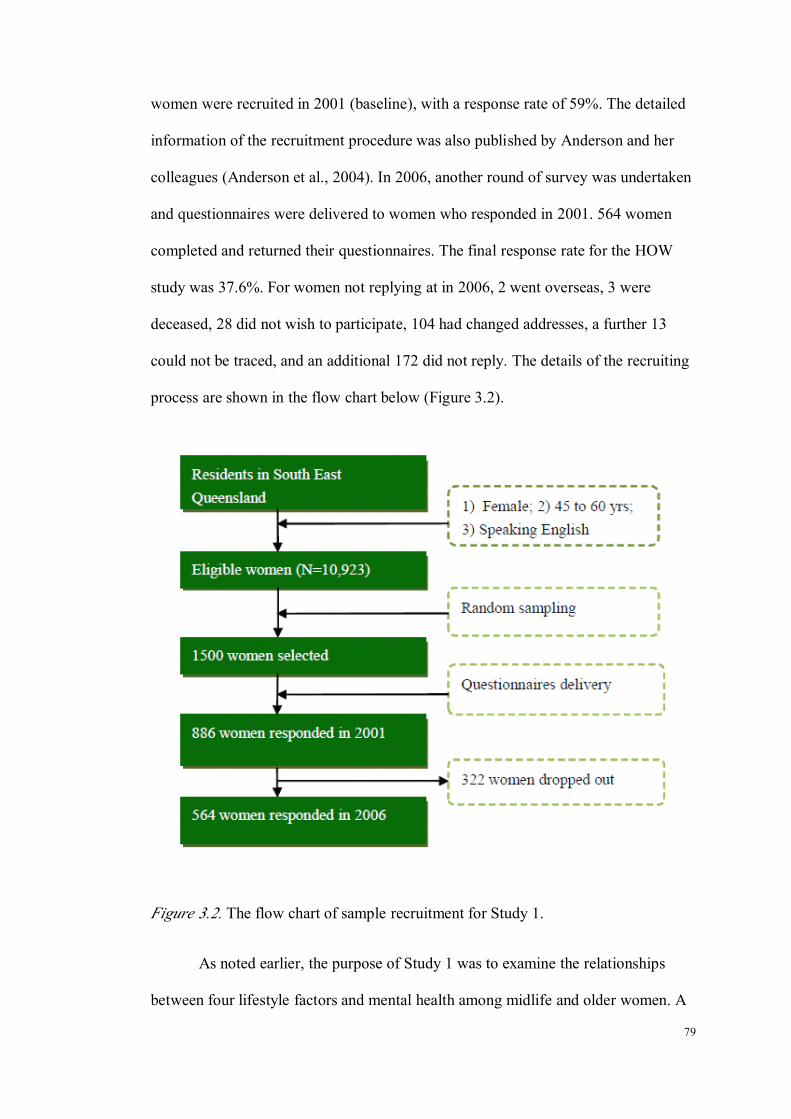
79
women were recruited in 2001 (baseline), with a response rate of 59%. The detailed
information of the recruitment procedure was also published by Anderson and her
colleagues (Anderson et al., 2004). In 2006, another round of survey was undertaken
and questionnaires were delivered to women who responded in 2001. 564 women
completed and returned their questionnaires. The final response rate for the HOW
study was 37.6%. For women not replying at in 2006, 2 went overseas, 3 were
deceased, 28 did not wish to participate, 104 had changed addresses, a further 13
could not be traced, and an additional 172 did not reply. The details of the recruiting
process are shown in the flow chart below (Figure 3.2).
Figure 3.2. The flow chart of sample recruitment for Study 1.
As noted earlier, the purpose of Study 1 was to examine the relationships
between four lifestyle factors and mental health among midlife and older women. A

80
multiple linear regression model was chosen as the statistical approach. Lifestyle
factors together with other sociodemographic factors were treated as independent
variables. Categorical independent variables were coded as dummy variables before
being entered into the regression model. The total number of predictors was 25 for
the baseline analysis and 26 for the follow-up analysis, individually.
Based on Cohen’s (1988) calculation, the sample size to detect a medium to
large effect for regression equals to ‘50+8k’ (where k is the number of predictors)
for 80% power and at 0.05 significance level, if testing model is the primary aim; or
equals to ‘104+k’ if examining the effect of individual predictor is the goal. Study 1
aimed to test both model fitness and individual effect; therefore, the larger sample
size generated by the given formulas was chosen as the minimal number of women
required for Study 1 to produce reliable results. Having stated the number of
predictors, the minimal adequate sample size was 250 for baseline analysis and 258
for follow-up analysis, respectively. The real sample size of Study 1 was 564, which
was well over the targeted number.
Ethical Clearance
The Queensland University of Technology Human Research Ethics
Committee approved the Study 1.
Measures
Sociodemographic Factors
The measured sociodemographic factors in Study 1 were: age, marital status,
country of birth, ethnic origin, language spoken at home other than English,

81
education level, employment status and annual household income. All of the
variables were self-reported.
For marital status, women were categorised into three groups: married,
separated and single. With reference to multicultural background, women were also
asked about their countries of birth, whether it was Australia or other countries.
Women were also asked “do you identify yourself as an Aboriginal, Torres Strait or
South Sea Islander”. A ‘yes’ or ‘no’ answer was required. Then a question about
whether they speak another language rather than English at home followed, provided
with ‘yes’ or ‘no’ optional answers as well. With regard to education level, women
were given four options, which were junior school or under junior school, senior
school, university or technological institutes, and other. There were three categories
under employment status in Study 1, which included full-time paid employment,
part-time paid employment, and unemployed. Finally, the annual household income
of women was investigated. Women were offered three options, which were less
than or equal to $40,000, more than $40,000, and do not know.
Lifestyle Factors
As discussed in Chapter 2, four lifestyle factors were examined in the current
research study. The measurement of each lifestyle factor in Study 1 is detailed
below.
Weight status
In this research, weight status was measured with BMI, which is a very
widely applied instrument in the field of obesity research (Atlantis & Baker, 2008;
Cassidy et al., 2005; Flegal, Graubard, Williamson, & Gail, 2007; Gariepy et al.,
82
2009). The threshold of BMI, as proposed by the WHO is classified as follows: less
than or equal to 18.49 is underweight; 18.5 to 24.9 is normal weight, from 25.0 to
29.9 is overweight, and equal to or more than 30 is obese (World Health
Organisation, 2000a). This research study used this classification standard to define
women’s weight status. Despite wide acceptance of the classification standard of
BMI among researchers, it is believed that BMI is a continuous variable by nature. In
addition, analysing BMI as a continuous variable offers a few statistical advantages.
First treating BMI as a continuous variable increases precision of results due to
greater statistical power; second, results will be more informative and easier to
interpret than when using it as a categorical variable; and third, there will be greater
parsimony in the statistical model because of reduced number of indicators (Stanley,
2008).
A self-report method of height and weight was applied in all of the women’s
health studies and thus was chosen as the method for the current research study. In
terms of the reliability of self-reported height and weight, research found people tend
to over report their height, and under report their weight, intentionally or not;
therefore the value of BMI is underestimated. Consequently, the prevalence of
overweight and obesity is under estimated (Elgar & Stewart, 2008; Gorber,
Tremblay, Moher, & Gorber, 2007). Nevertheless, self-reported height and weight is
still a common method seen in much research, as it is relatively easy to obtain (Elgar
& Stewart, 2008). Despite the prevalence of unreliable self-reporting, one women’s
study showed that there was substantial agreement between self-reported and
measured BMI, except for women who are pregnant, older than 75 years or without
visit to a physician, and well-educated (Craig & Adams, 2009).
83
Physical activity
In Study 1, which is based on the HOW project, physical activity was
measured by asking the women a single question, which was “how often do you
exercise (including tai chi, fitness, yoga, walking, swimming) every week to improve
your health?” Four options were given, which included “none”, “1-2 times/week”,
“3-4 times/week” and “5-6 times /week” to indicate these women’s level of exercise.
As can be seen from the question, what was measured was essentially exercise,
rather than physical activity. The definition of physical activity is any bodily
movement produced by skeletal muscles that result in energy expenditure
significantly beyond resting level, particularly involving continuous actions of large
muscles (Briffa et al., 2006). Exercise is only a type of physical activity carried out
for a specific purpose. Therefore, although universally cited as physical activity, it
should be noted that in Study 1, physical activity actually was a reflection of
exercise.
Alcohol use
In Study 1, women’s alcohol use was evaluated by asking women a single
question, which was “have you ever drunk alcohol-containing beverages?” Four
choices were given, which were “never”, “drank in the past”, “occasionally” and
“regularly”.
Smoking
In the current study, smoking status was self-reported, and classified into
“non-smoker”, “past-smoker” and “current smokers”.
84
Confounders
For Study 1, in addition to the sociodemographic factors described above,
women’s menopause status was examined, and was included in the analysis for its
potential confounding effect.
Menopausal status
Menopause status was identified by asking women questions about their
menstruation period in consecutive order. The questions were 1) “Have you had a
hysterectomy, an operation to remove your uterus or womb?” 2) “Have you had both
ovaries removed?” 3) “Have you had a menstrual period in the past 12 months?” 4)
“Have you had a menstrual period in the past 3 months?” and 5) “Compared to a
year ago, has the number of days between menstrual periods become less
predictable?”
It was intended that, based on the response to these questions, women were
going to be classified into the four stages as described below. If a woman answered
yes to Question 1 or 2, then she would be regarded as in surgical menopause, which
means this woman had had a hysterectomy or ovaries moved. If a woman answered
yes to Questions 3 and 4, but no to Question 5, then she was thought to be
premenopausal, which was characterised as having no irregularity in her periods in
the previous 12 months and menstruating in the previous 3 months. Furthermore, if a
woman answered no to Question 3 then she would be considered to be
postmenopausal (naturally), which featured no menses for 12 or more months
without having had a hysterectomy and ovaries removed. Besides the three stages of
surgical menopause, premenopause and postmenopause, if a woman answered yes to
Question 3 she was considered to be in perimenopause. Menopausal status was

85
assessed in all the women’s health studies and hence was a measurable variable for
the current study too.
Mental Health
In the current research, the mental health measured was general mental health
and two common psychological problems which were depression and anxiety. The
measurement for each variable is detailed as below.
General mental health measurement
The measurement of general mental health for this study was derived from
the SF-36 (see Appendix B). SF-36 itself is a well validated and widely used quality
of life measurement tool, and consisted of eight scales entitled physical function (PF),
role physical (RP), bodily pain (BP), general health (GH), vitality (VT), social
function (SF), role emotional (RE) and mental health (MH), which in total were
eight scales. One of the eight scales measuring mental health was the Mental Health
Inventory (MHI), which contains 5 items. The norm values of the eight scales for
various populations were published (Ware, Kosinski, & Gandek, 2000b). SF-36
could also be aggregated into two composite scores based on the values of the eight
scales, which are the physical composite score (PCS) and mental composite score
(MCS). In the current study, both MHI and MCS were used to describe women’s
general mental health.
Mental Health Inventory
The MHI is a short version of the original MHI, which contained 38 items.
MHI was constructed from the 5 items that best predicted the summary score for the
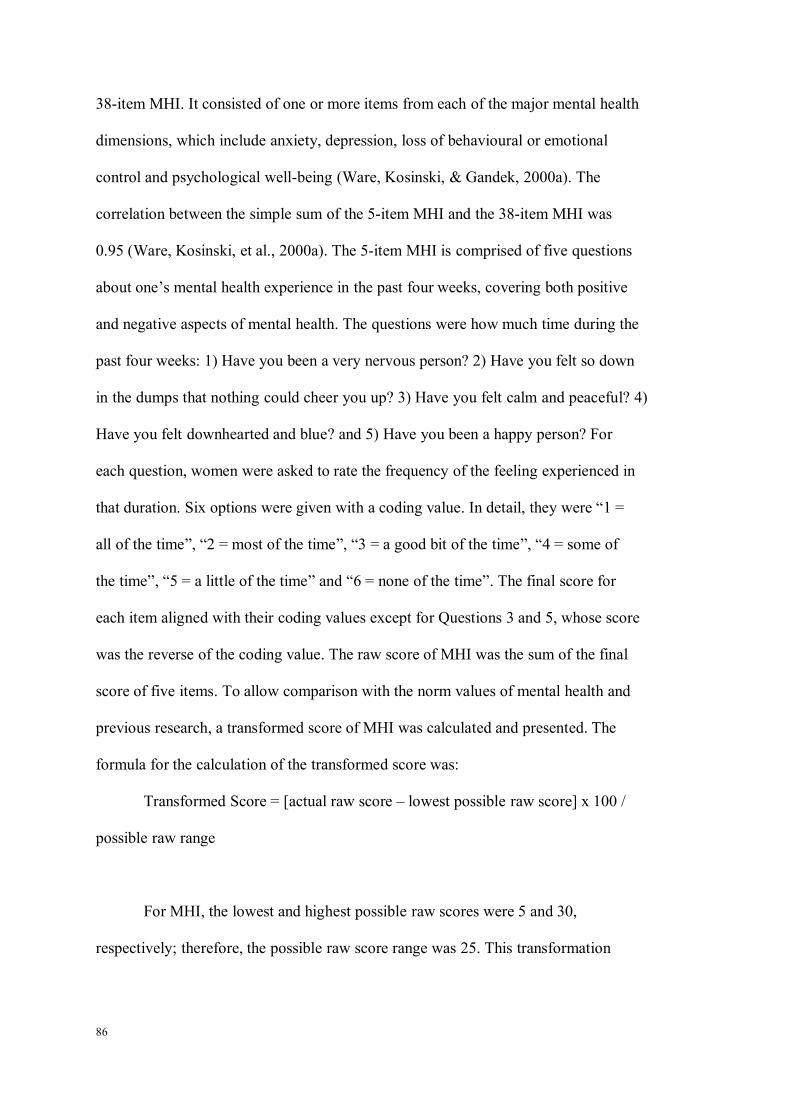
86
38-item MHI. It consisted of one or more items from each of the major mental health
dimensions, which include anxiety, depression, loss of behavioural or emotional
control and psychological well-being (Ware, Kosinski, & Gandek, 2000a). The
correlation between the simple sum of the 5-item MHI and the 38-item MHI was
0.95 (Ware, Kosinski, et al., 2000a). The 5-item MHI is comprised of five questions
about one’s mental health experience in the past four weeks, covering both positive
and negative aspects of mental health. The questions were how much time during the
past four weeks: 1) Have you been a very nervous person? 2) Have you felt so down
in the dumps that nothing could cheer you up? 3) Have you felt calm and peaceful? 4)
Have you felt downhearted and blue? and 5) Have you been a happy person? For
each question, women were asked to rate the frequency of the feeling experienced in
that duration. Six options were given with a coding value. In detail, they were “1 =
all of the time”, “2 = most of the time”, “3 = a good bit of the time”, “4 = some of
the time”, “5 = a little of the time” and “6 = none of the time”. The final score for
each item aligned with their coding values except for Questions 3 and 5, whose score
was the reverse of the coding value. The raw score of MHI was the sum of the final
score of five items. To allow comparison with the norm values of mental health and
previous research, a transformed score of MHI was calculated and presented. The
formula for the calculation of the transformed score was:
Transformed Score = [actual raw score – lowest possible raw score] x 100 /
possible raw range
For MHI, the lowest and highest possible raw scores were 5 and 30,
respectively; therefore, the possible raw score range was 25. This transformation
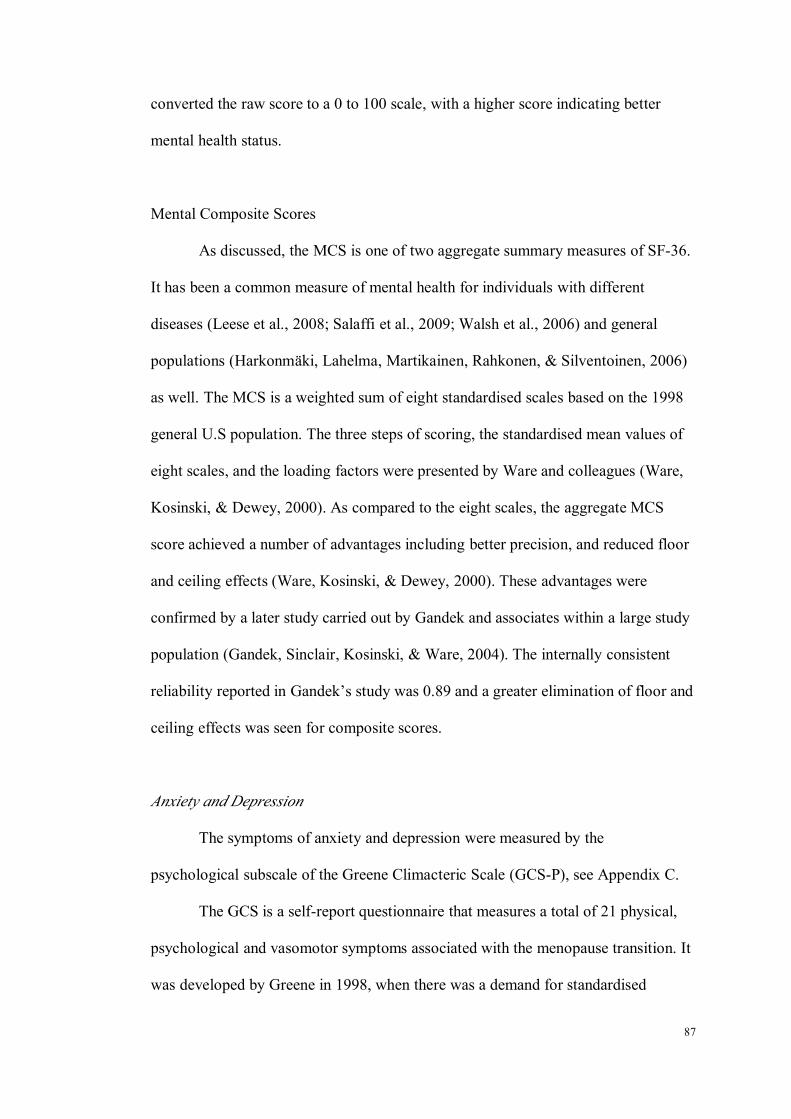
87
converted the raw score to a 0 to 100 scale, with a higher score indicating better
mental health status.
Mental Composite Scores
As discussed, the MCS is one of two aggregate summary measures of SF-36.
It has been a common measure of mental health for individuals with different
diseases (Leese et al., 2008; Salaffi et al., 2009; Walsh et al., 2006) and general
populations (Harkonmäki, Lahelma, Martikainen, Rahkonen, & Silventoinen, 2006)
as well. The MCS is a weighted sum of eight standardised scales based on the 1998
general U.S population. The three steps of scoring, the standardised mean values of
eight scales, and the loading factors were presented by Ware and colleagues (Ware,
Kosinski, & Dewey, 2000). As compared to the eight scales, the aggregate MCS
score achieved a number of advantages including better precision, and reduced floor
and ceiling effects (Ware, Kosinski, & Dewey, 2000). These advantages were
confirmed by a later study carried out by Gandek and associates within a large study
population (Gandek, Sinclair, Kosinski, & Ware, 2004). The internally consistent
reliability reported in Gandek’s study was 0.89 and a greater elimination of floor and
ceiling effects was seen for composite scores.
Anxiety and Depression
The symptoms of anxiety and depression were measured by the
psychological subscale of the Greene Climacteric Scale (GCS-P), see Appendix C.
The GCS is a self-report questionnaire that measures a total of 21 physical,
psychological and vasomotor symptoms associated with the menopause transition. It
was developed by Greene in 1998, when there was a demand for standardised

88
measurement of climacteric symptoms (Greene, 1998). In application, women were
asked to give immediate response to the items according to their feeling at that
moment. This scale has been validated in a number of different populations, with a
Cronbach’s α of 0.91 (Chen, Davis, Wong, & Lam, 2010; Travers, O'Neill, King,
Battistutta, & Khoo, 2005). It has been used as a tool in studies to detect the efficacy
of intervention on climacteric symptoms (Ziaei, Moghasemi, & Faghihzadeh, 2010)
and to monitor the progress of climacteric symptoms resulting from surgery (Collaris,
Sidhu, & Chan, 2010). With regard to the GCS-P, which was the subscale of interest
of the current study, its two week test-retest reliability was 0.87 (Greene, 1998), and
the internal consistency was from 0.87 to 0.90 (Chen et al., 2010; Travers et al.,
2005). For the anxiety and depression scale, the internal consistency was 0.83 and
0.82, respectively. Scoring of GCS was simple. Each item of the GCS is rated by the
participant according to its severity using a four-point scale ranging from “0 = not at
all” to “3 = extremely”. The final score of each subscale is the sum of all the items
under that subscale. The GCS-P contains eleven items, with items 1 to 6 measuring
anxiety and items 7 to 11 measuring depression. Therefore, the possible score range
was 0-18 for anxiety, and 0-15 for depression, respectively. A higher score means
more severe anxiety and depression symptoms. In addition, the use of a total score of
GCS-P was also applied, and a higher total suggests more psychological symptoms.
It was suggested by Greene that the GCS-P could be used to identify menopausal
women who are severely anxious or have clinical anxiety and/or depression using a
cutoff point of 10, which has been contrasted with the HADS (Greene, n.d.).

89
Statistical Analysis
In Study 1, as well as the following Study 2 and 3, the Statistical Package for
the Social Sciences (SPSS), version 16.0 was used for data entry and analysis.
Imputation of missing values was not attempted. The analysis was
undertaken among participants who did not have missing values on relevant
variables. Assumptions of relevant parametric statistical analysis were examined. A
descriptive analysis of sociodemographic factors, lifestyle factors and mental health
was undertaken first. Women who were analysed in Study 1 were compared to those
who dropped out in 2006. When comparing these two groups, an independent
sample t-test was used to detect the differences of continuous variables, such as BMI
and age, and a Chi-square analysis for categorical variables like country of birth.
Then the relationships among lifestyle factors were investigated. One-way
ANOVA analysis was used for the examination of the relationships between
continuous variables and categorical variables; and Chi-square analysis was applied
for the examination of two categorical variables.
Following this, a cross-sectional analysis of the relationships between
lifestyle factors and mental health was conducted. A multi linear regression analysis
(entered approach) was used to explore the correlations, controlling for
sociodemographic factors and menopause status. Categorical independent variables
were coded as dummy variables before entering the regression models.
Finally, a longitudinal prospective analysis about the long-term effect of
lifestyle factors on mental health was undertaken using multi linear regression
analysis, adjusting for baseline mental health. In this analysis, women’s mental
health in 2006 was the dependent variable, and lifestyle factors at baseline were
independent variables. Other confounders including sociodemographic factors and

90
menopausal status were adjusted. Alpha less than .05 was considered to be
significant.
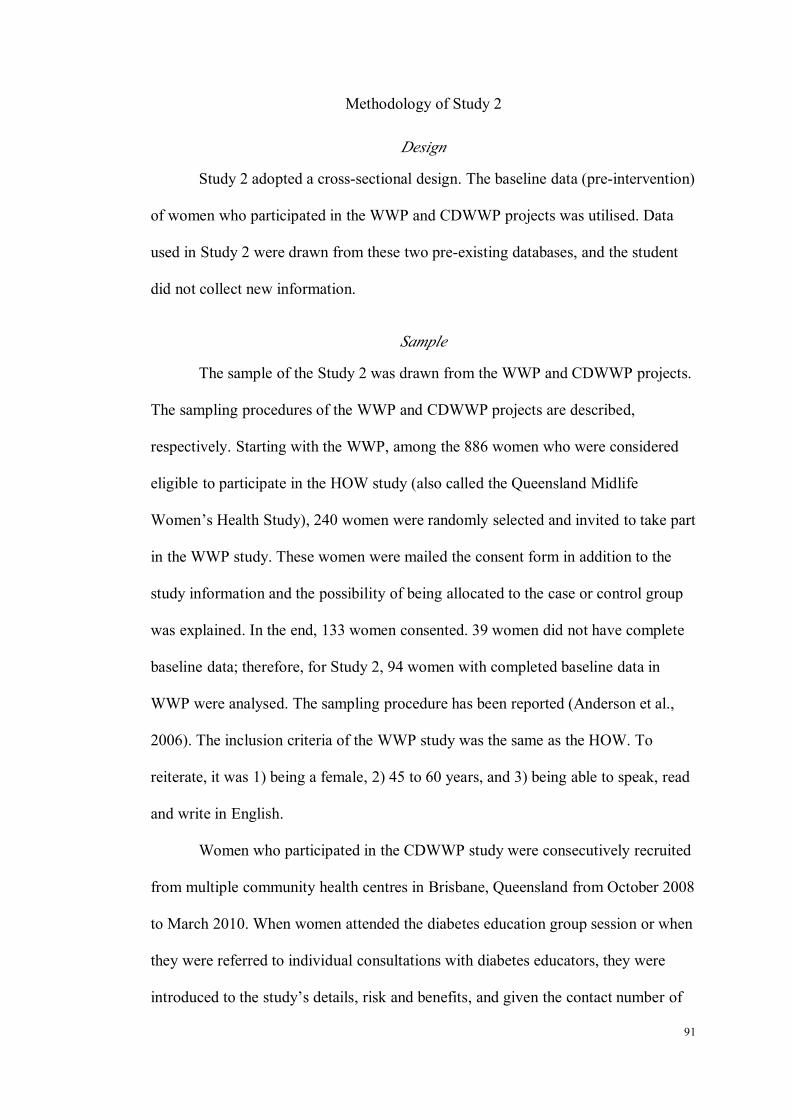
91
Methodology of Study 2
Design
Study 2 adopted a cross-sectional design. The baseline data (pre-intervention)
of women who participated in the WWP and CDWWP projects was utilised. Data
used in Study 2 were drawn from these two pre-existing databases, and the student
did not collect new information.
Sample
The sample of the Study 2 was drawn from the WWP and CDWWP projects.
The sampling procedures of the WWP and CDWWP projects are described,
respectively. Starting with the WWP, among the 886 women who were considered
eligible to participate in the HOW study (also called the Queensland Midlife
Women’s Health Study), 240 women were randomly selected and invited to take part
in the WWP study. These women were mailed the consent form in addition to the
study information and the possibility of being allocated to the case or control group
was explained. In the end, 133 women consented. 39 women did not have complete
baseline data; therefore, for Study 2, 94 women with completed baseline data in
WWP were analysed. The sampling procedure has been reported (Anderson et al.,
2006). The inclusion criteria of the WWP study was the same as the HOW. To
reiterate, it was 1) being a female, 2) 45 to 60 years, and 3) being able to speak, read
and write in English.
Women who participated in the CDWWP study were consecutively recruited
from multiple community health centres in Brisbane, Queensland from October 2008
to March 2010. When women attended the diabetes education group session or when
they were referred to individual consultations with diabetes educators, they were
introduced to the study’s details, risk and benefits, and given the contact number of

92
research project officer for inquiry purposes. Women who met the following criteria
were considered eligible: 1) 45 years and older, 2) being able to communicate in
English, 3) without a diagnosis of breast cancer, 4) not currently receiving palliative
care, and 5) having no other contraindications of participating in this program. If
women were willing to take part in the research, they were asked to post the consent
form back with the provided pre-paid envelope, along with their contact information.
When the consent form was received, the baseline questionnaire was posted to
women with a pre-paid envelope for return purposes. 83 women completed and
returned the baseline questionnaires of the CDWWP, and these were used as part of
the study sample of Study 2.
Cohen’s power calculation (1988) strategy was applied in Study 2. As stated
early, the minimal sample size required to observe a medium to large effect for 80%
power at 0.05 significance level is 50+8k. Based on the findings of Study 1, it was
estimated that the number of predictors in Study 2 would be around 10; therefore, the
minimal sample size was 130. The real sample size of 177 in Study 2 surpassed the
expected number, hence was believed to be adequate to produce reliable study
findings.
Ethical Clearance
All the procedures and interventions of the WWP were approved by the
Queensland University of Technology Ethics Committee prior to the study beginning.
For CDWWP, the Queensland University of Technology Human Research Ethics
Committee and Human Research Ethics Committees at the Prince Charles Hospital
approved the implementation of the study (see Appendix G). Women who
participated in both programs had the right to withdraw from the study after they had
consented. No penalty or consequences were applied.

93
Measures
Sociodemographic Factors
The sociodemographic factors measured in Study 2 were: age, marital status,
country of birth, ethnic origin, language spoken at home other than English,
education level, employment status and annual household income.
Due to the relatively small sample size, the marital status in Study 2 was
combined and re-categorised into two categories, which were being married and
unmarried. Country of birth was a dichotomous variable, divided into being born in
Australia or other countries. Women were also asked “Do you identify yourself as an
Aboriginal, Torres Strait or South Sea Islander”. A yes/no option was provided. This
question was followed by the one about language. Women were asked whether they
spoke a language other than English at home and provided with ‘yes’ or ‘no’ options
as well. With regard to education level, women were given three options, which were
junior school or less than junior school, senior school, and university or
technological institutes. Employment status was also a dichotomous variable, which
included being in paid employment and unpaid/unemployed. Finally, the annual
household income of women was investigated. Women were offered three options,
which were less than or equal to $40,000, more than $40,000, and do not know.
Lifestyle Factors
In the same way as in Study 1, four lifestyle factors: relative body weight,
physical activity, smoking and alcohol use were included in Study 2. The details of
the measurement of each of these lifestyle factors have been provided in Study 1 (see
p. 81-83).

94
Weight status
BMI was again used as the instrument of measuring women’s weight status.
The standard classification of BMI proposed by the WHO was implemented in Study
2 too: less than or equal to 18.49 was underweight; 18.5 to 24.9 was normal weight,
from 25.0 to 29.9 was overweight, and equal to or more than 30 was obese (World
Health Organisation, 2000a). In addition, BMI was also treated as a continuous
variable in analysis, because of the advantages of doing so (see Study 1, p. 82)
The BMI in Study 2 was self-reported as well. The advantages and
disadvantages of self-reported BMI as compared to objective measurement have
been discussed for Study 1 and therefore are not repeated here (see p. 82).
Physical activity
In Study 2, physical activity was measured by the Seattle Physical Activity
questionnaire (SPA) (Smith-Dijulio, via personal contact, see Appendix F). This
questionnaire was initially developed by the researchers from the Seattle Women’s
Health Study. The SPA questionnaire is a self-report scale consisting of three
questions relating to general daily activity, exercise, and rating of overall level of
physical activity. General daily activities that were asked included, but were not
limited to, activities such as housework, caring for children, shopping and so forth,
but not exercise. Four options were provided to women to indicate their level of
general daily activity, which were: “very active”; “moderately active”; “mildly
active”; and “sedentary”. Following the general daily activity section, the
information about exercise was obtained. The question for exercise was: “How many
times did you exercise for at least 15 minutes at a time in the past month?” Examples
of various types of exercises were given, such as callisthenics, jogging, racquet
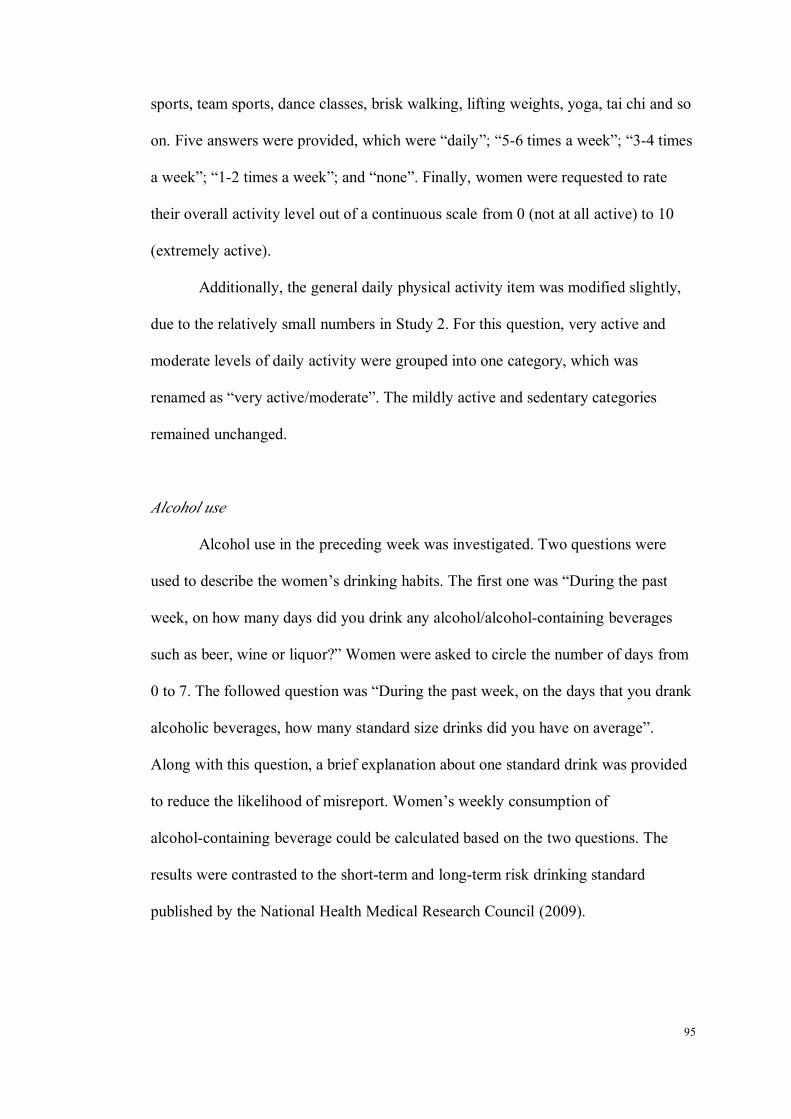
95
sports, team sports, dance classes, brisk walking, lifting weights, yoga, tai chi and so
on. Five answers were provided, which were “daily”; “5-6 times a week”; “3-4 times
a week”; “1-2 times a week”; and “none”. Finally, women were requested to rate
their overall activity level out of a continuous scale from 0 (not at all active) to 10
(extremely active).
Additionally, the general daily physical activity item was modified slightly,
due to the relatively small numbers in Study 2. For this question, very active and
moderate levels of daily activity were grouped into one category, which was
renamed as “very active/moderate”. The mildly active and sedentary categories
remained unchanged.
Alcohol use
Alcohol use in the preceding week was investigated. Two questions were
used to describe the women’s drinking habits. The first one was “During the past
week, on how many days did you drink any alcohol/alcohol-containing beverages
such as beer, wine or liquor?” Women were asked to circle the number of days from
0 to 7. The followed question was “During the past week, on the days that you drank
alcoholic beverages, how many standard size drinks did you have on average”.
Along with this question, a brief explanation about one standard drink was provided
to reduce the likelihood of misreport. Women’s weekly consumption of
alcohol-containing beverage could be calculated based on the two questions. The
results were contrasted to the short-term and long-term risk drinking standard
published by the National Health Medical Research Council (2009).
96
Smoking
Smoking status was self-reported, and classified into “non-smoker”,
“past-smoker” and “current smokers”. Nicotine dependence was not examined, as it
is beyond the scope of the research.
Confounders
Menopausal status
The set of questions used in Study 1 were also used in Study 2. As discussed,
according responses to questions, the sample was classified into four categories,
which were premenopause, perimenopause, postmenopause, and surgical
menopause (for detailed information, see p. 84-85).
Number of co-morbidities
The following chronic conditions were investigated in Study 2. There has
been a slight difference in some of the chronic health conditions between the WWP
and the CDWWP. For example, the WWP did not include “endometrial cancer”,
while the CDWWP did. Therefore, only the chronic health conditions investigated in
both projects were examined in Study 2. The investigated health conditions were:
headaches/migraine, stroke, high blood pressure, leaking urine when coughing or
sneezing (stress incontinence), back problems, coronary heart diseases (angina, heart
attack, bypass surgery, angioplasty), other heart diseases (irregular beat, heart
failure), irritable bowel problem, thyroid disorder, arthritis or rheumatism, diabetes,
breast cancer, ovarian cancer, cancer (any type), osteoporosis, bone or joint problems
other than arthritis or osteoporosis, and mental health problems. For each of the
conditions, women were asked to give a yes or no answer. The total number of

97
health conditions that a person has was calculated as an indicator of physical health
status.
Mental Health
Similarly to Study 1, mental health measured in Study 2 also included
general mental health, and two common psychological symptoms including anxiety
and depression. The measurement of these mental health measures followed the
same procedures as Study 1 (see p. 85-88).
Briefly speaking, general mental health was measured by the MHI and MCS
in SF-36, psychological symptoms including anxiety and depression were measured
by the GCS-P. This psychological subscale could be further divided to give measures
of anxiety and depression.
Statistical Analysis
Imputation of missing values in Study 2 was not performed either, given the
small number of missing values. Statistical analysis was performed on variables that
did not possess missing values. The assumptions of relevant statistical analysis were
tested prior to or after analysis. The statistical analysis of Study 2 involved three
steps. The first step was descriptive analysis of the sociodemographic factors,
lifestyle factors, mental health and confounders for the whole study sample, as well
as for women with and without diabetes separately. The difference of the
distributions of sociodemographic factors, lifestyle factors, mental health and
confounders between women with and without diabetes was compared. An
independent t-test was used to compare continuous and normal distributed variables
such as BMI; a Mann-Whitney analysis (non-parametric analysis) was used for
98
continuous but skewed data (e.g. number of co-morbidities); and a Chi-square
analysis was implemented for categorical variables such as employment status. The
aim of this step was to explore the factors that differed between women with and
without a diagnosis of diabetes. Factors differed between women with and without
diabetes were included in the final regression models.
Following that, an examination of the binary relationships between
dependent variables (mental health) and independent variables (sociodemographic
factors, lifestyle factors and confounding factors) was undertaken. A Pearson
correlation analysis was conducted for the examination of continuous independent
variables, and a one-way ANOVA was used to test the difference of mental health in
relation to categorical variables such as smoking and alcohol consumption. The
purpose of this step was to find out the significant factors influencing mental health.
These significant factors then were entered into a regression model together with the
ones indicated at the first step.
The third step was hierarchical regression analysis, with each measure of
mental health being a dependent variable. The predictors were generated from the
previous two steps and entered in the regression model subsequently. Categorical
variables were coded as dummy variables before entering the regression models. An
adjusted R2 was presented to indicate the contribution of different independent
variables to mental health. A significance level of having a p value less than .05 was
adopted.

99
Methodology of Study 3
Design
Study 3 was conducted with the CDWWP, and was of cross-sectional design.
Apart from the data collected by the CDWWP, the student introduced another two
measures to the program to allow the exploration of the mediating effect of
self-efficacy. One measure was for depression and anxiety, which was added to
enable effective comparison with other literature, and the other measure was
self-efficacy.
Sample
Study 3 used the same sample of the CDWWP, which gave totally 83 women.
The sampling strategies for Study 3 (CDWWP) have been described for Study 2 (see
p. 91-92) and are not repeated here.
According to the study findings of both Study 1 and Study 2, it was likely
that the number of predictors in regression model in Study 3 was 5. Study 3
primarily aimed to test models with self-efficacy as the potential mediator. Using
this estimation and Cohen’s (1988) formula for 80% power at the significance level
of 0.05, the expected minimal sample size for Study 3 was 90. As can be seen, the
power of Study 3 was slightly inadequate when compared to the expected sample
size, thus the results of Study 3 need to be interpreted with caution.
Ethical Clearance
The CDWWP was approved by the Queensland University of Technology
Human Research Ethics Committee and the Prince Charles Human Research Ethics
Committee (also see p. 92).
100
Measures
Sociodemographic Factors
The sociodemographic factors measured in the Study 3 were identical to
those of Study 2. To reiterate, the factors included were age, marital status, country
of birth, ethnic origin, language spoken at home rather than English, education level,
employment status and annual house income. Age was self-reported. Marital status
was classified into married and unmarried. Country of birth included two options:
Australia or other countries. Ethnicity was self-defined by women as being of
indigenous origin or not. Language spoken at home rather than English was set as a
‘yes’ or ‘no’ question. Education was grouped into three categories including junior
school or less than junior school, senior school and university or institute of
technology. Employment was divided into paid employment and unemployment.
Finally, annual household income was levelled into ≤ $40,000, > $40,000, and do
not know.
Lifestyle Factors
The four lifestyle factors examined in the previous two studies were also
examined in Study 3. They were relative body weight, physical activity, smoking
and alcohol use. The measurement of these variables is briefly listed in this section.
Weight status
Self reported BMI was used in Study 3. For detailed information, see Study 1
(p. 81-82).
101
Physical activity
The SPA questionnaire was also used in the Study 3. The description of the
scale has been provided in Study 2 (see p. 94-95), and hence is not detailed here. The
modified version of the SPA was applied in the Study 3, with three questions asking
about general daily activity, exercise frequency in the past month and rating of
overall physical activity.
Alcohol use
In Study 3, the same two questions inquiring about women’s alcohol
consumption in the past week were adopted (see p. 95). In addition, a third question
was added. This question was “Is the amount you drank last week more, about the
same or less than you would usually drink?” By asking this question, women’s
alcohol use in the past week as compared to their usual drinking level was able to be
described. In other words, the question provided information on validity of the
previous two questions in measuring accurate alcohol use in women.
Smoking
Smoking status was evaluated. As in the previous two studies, women were
classified into “non-smoker”, “past-smoker” and “current smoker” groups.
Confounders
Menopausal status
The same questions were used in Study 3 to identify women’s menopausal
stage (see p. 84-85). As mentioned before, women were grouped into four categories,

102
which were premenopause, perimenopause, postmenopause and surgical
menopause.
Number of co-morbidities
The investigated health conditions in Study 3 included: headaches/migraine,
stroke, high blood pressure, leaking urine when coughing or sneezing (stress
incontinence), back problem, coronary heart diseases (angina, heart attack, bypass
surgery, angioplasty), other heart diseases (irregular beat, heart failure), irritable
bowel problem, thyroid disorder, arthritis or rheumatism, diabetes, breast cancer,
ovarian cancer, endometrial cancer, cancer (any type), osteoporosis, bone or joint
problem other than arthritis or osteoporosis, clinical depression, anxiety disorder and
other mental health problem as specified. For each of the conditions, a ‘yes’ or ‘no’
answer was given. In addition, the year of diagnosis for each health condition was
requested. The number of chronic health conditions, excluding diabetes, was
calculated.
Duration of Diabetes
The period that women have had diabetes for since diagnosis was calculated
by deducting the year of diagnosis the women provided from the year 2009. The
duration was measured to the nearest year.
Use of Antidepressants
In Study 3, women were also asked to list the medications that they were
taking. Based on the information, the usage of taking antidepressants was identified,
and women were grouped into ‘use’ and ‘not use’ categories.
103
Mental Health
Like Study 1 and Study 2, the mental health of midlife and older women with
diabetes had two meanings: general mental health and psychological symptoms
which included anxiety and depression. General mental health was measured in the
same way as Study 1 and Study 2, therefore not repeated here. Depression and
anxiety were measured by using the HADS in Study 3 (for the scale, see Appendix
D).
Anxiety and depression
Anxiety and depression was measured by the HADS, which was developed
as a self-administered psychological scale to identify and quantify anxiety and
depression in medical patients (Zigmond & Snaith, 1983). It contains two subscales,
which were anxiety (HADS-A) and depression subscales (HADS-D), with each of
them containing seven items. Each of the psychological symptoms in the past week
was assessed using a four-point Likert scale ranging from 0 to 3. Based on the
scoring protocol, the possible total score range was from 0 to 21 for depression and
anxiety, respectively. One distinctive feature in which the HADS differs from other
psychological scales is that it excludes symptoms such as dizziness, headaches,
insomnia, and fatigue, which could give false positive results if they were actually
caused by physical disorders (Herrmann, 1997). In addition, the HADS was
developed to observe milder psychiatric symptoms, and therefore avoided a “floor
effect”.
Because of the above stated advantages of the HADS, it has been used
extensively in studies in examining the relationships between physical illnesses and
psychological symptoms (Alati et al., 2004; Collins, Corcoran, & Perry, 2009; Doyle,
104
McGee, De La Harpe, Shelley, & Conroy, 2006; Dunbar et al., 2008; Fu et al., 2007;
Hildrum, Mykletun, Midthjell, Ismail, & Dahl, 2009). Moreover, its psychometric
properties also have been tested in a variety of medical patients (Honarmand &
Feinstein, 2009; Singer et al., 2009; Untas et al., 2009). The results of the research
showed that HADS is easy to administer, well validated, and sensitive to identifying
anxiety and depression.
There is no single universal cutoff score of the two subscales to identify
anxiety and depression, rather, the cutoff score varied according to the populations
studied (Honarmand & Feinstein, 2009; Singer, et al., 2009). For the current research,
a cutoff score of 8 (8+) was chosen to identify cases of anxiety and depression, as
this threshold has been shown to give an optimal balance between sensitivity and
specificity as contrasted against the International Statistical Classification of
Diseases and Related Health Problems (ICD-9) (Bjelland, Dahl, Haug &
Neckelmann, 2002). The review by Bjelland also indicated that the average
Cronbach’s Alpha was 0.83 for HADS-A, and 0.82 for HADS-D. Moreover, the
specificity and sensitivity was approximately 0.8 when using 8 as a cutoff score.
Although widely used as a screening tool to identify anxiety and depression
cases, it is believed that, by its nature, the HADS score is a continuous variable, with
a higher score suggesting more severe mental symptoms .The norm values of HADS
based on gender and age have been published (Hinz & Schwarz, 2001).
Two reasons were considered when selecting the HADS as the measurement
of anxiety and depression. When the HOW and WWP projects were carried out, they
had a study sample consisting of women exclusively aged from 45 to 60 years, as
this is the age range where menopausal transition occurs. In that circumstance, GCS
was believed to be the most appropriate tool for measuring climacteric symptoms,
105
among which psychological symptoms were included as well. In contrast to the
HOW and WWP, which studied midlife and older women from the general
community, women who participated in the CDWWP were patients seeking
treatment in a diabetic clinic. Moreover, these women were much older, as can be
seen from the inclusion criteria of age (≥ 45 years). Seeking treatment and being of
an older age suggested that this group of women are likely to live with more adverse
physical conditions than their younger counterparts in the HOW and WWP projects.
To avoid the “noise” from physical illnesses, the HADS was added to the survey
because of its performance in this regard.
Self-Efficacy
In Study 3, the Self-Efficacy for Managing Chronic Disease 6-Item Scale
(SEMCD, see Appendix E) was chosen as the measurement tool of self-efficacy for
the current research. This scale was selected because it fitted the context of the
research into the perspective of chronic disease management. The psychometric
properties of the scale are detailed as below.
SEMCD was developed by the researchers from the Chronic Disease
Self-Management Program, Stanford University, to measure people’s confidence in
keeping common health related problems caused by chronic disease from interfering
with their daily life (Lorig, Sobel, Ritter, Laurent, & Hobbs, 2001). These items
cover several domains of diseases management tasks commonly seen in many
chronic diseases: symptom control, role function, emotional functioning and
communicating with physicians. For example, one of the items is “How confident
are you that you can keep the fatigue caused by your disease from interfering with
the things you want to do?” Each item was assessed from a 1 to 10 continuous scale,
106
with 1 meaning “not at all confident” and 10 meaning “totally confident”. The score
for the scale is the mean of the six items.
SEMCD has been tested in 605 patients with various chronic diseases such as
arthritis, diabetes or heart disease, and has been approved to an internal consistency
reliability of 0.91 (Stanford Patient Education Research Centre). The mean efficacy
score for that study sample was 5.17 (SD = 2.22). This scale has been used
frequently in a range of self-management programs designed by Lorig and her team
(Lorig, Ritter, & Plant, 2005; Lorig et al., 2006; Lorig et al., 2001).
Statistical Analysis
Missing data imputation was not performed in Study 3. All the statistical
analysis was based on variables that did not have missing values. Assumptions of
relevant statistics were examined as well. The mediating effect of self-efficacy in the
associations between mental health and lifestyle factors was examined by using
Baron and Kenny’s mediation analysis (Baron & Kenny, 1986). As suggested, four
assumptions need to be held to prove that a variable is the mediator of the
relationship between independent and outcome variables (see Figure 3.3). First, the
independent variable must affect the mediator (path a); second, the independent
variable must be shown to affect the outcome variable (path c); third, the mediator
must affect the dependent variable (path b), fourth, the effect of the independent
variable on the dependent variable is reduced when the mediator is controlled (path
c'). It is considered as a perfect mediation if the effect of the independent variable
disappears.
Based on these principles and the context of the current study, two analytical
models were formed to guide statistical analysis (see Figures 3.4 & 3.5).
107
Figure 3.3. Basic causal chains of mediation model.
Both models attempted to examine the mediating effect of self-efficacy in the
correlations between mental health and lifestyle factors. The difference was: the first
model treated lifestyle factors as outcome variables and mental health as predictors
(Figure 3.4); while the second model considered mental health as outcome variables
and lifestyle factors as predictors (Figure 3.5). In other words, the mediating effect of
self-efficacy in both directions of the relationship was tested.
Self-efficacy
Lifestylefactors
Mentalhealth
a b
c
c'
Figure 3.4.Mediation model using lifestyle factors as outcome variables.
This figure is not available online.Please consult the hardcopy thesisavailable from the QUT Library.

108
Self-efficacy
Mentalhealth
Lifestylefactors
a b
c
c'
Figure 3.5.Mediation model using mental health as outcome variables.
According to the analytical models above, the statistical analysis was carried
out in such an order. First, the correlations between mental health variables (anxiety,
depression, general mental health) and lifestyle factors (BMI, physical activity,
smoking and alcohol use) were analysed first (path c). The purpose of this step was
to confirm the relationships between lifestyle factors and mental health, so there is an
effect to be mediated. Several statistical techniques were used at this step:
independent sample t-test for dichotomous and continuous variables, one-way
ANOVA analysis for categorical and continuous variables, and a Pearson correlation
for two continuous variables. Second, the correlations between mental health and
self-efficacy (path a in Model 1 and path b in Model 2) were explored by using
Pearson correlation. Third, the associations between self-efficacy and lifestyle
factors were tested (path a in Model 2 & path b in Model 1). After these three steps,
the mental health variables and lifestyle factors that fulfilled all of the three
conditions were put into the mediation analysis (multiple linear regression) at the last
step, to examine whether self-efficacy mediates the effect of lifestyle factors on
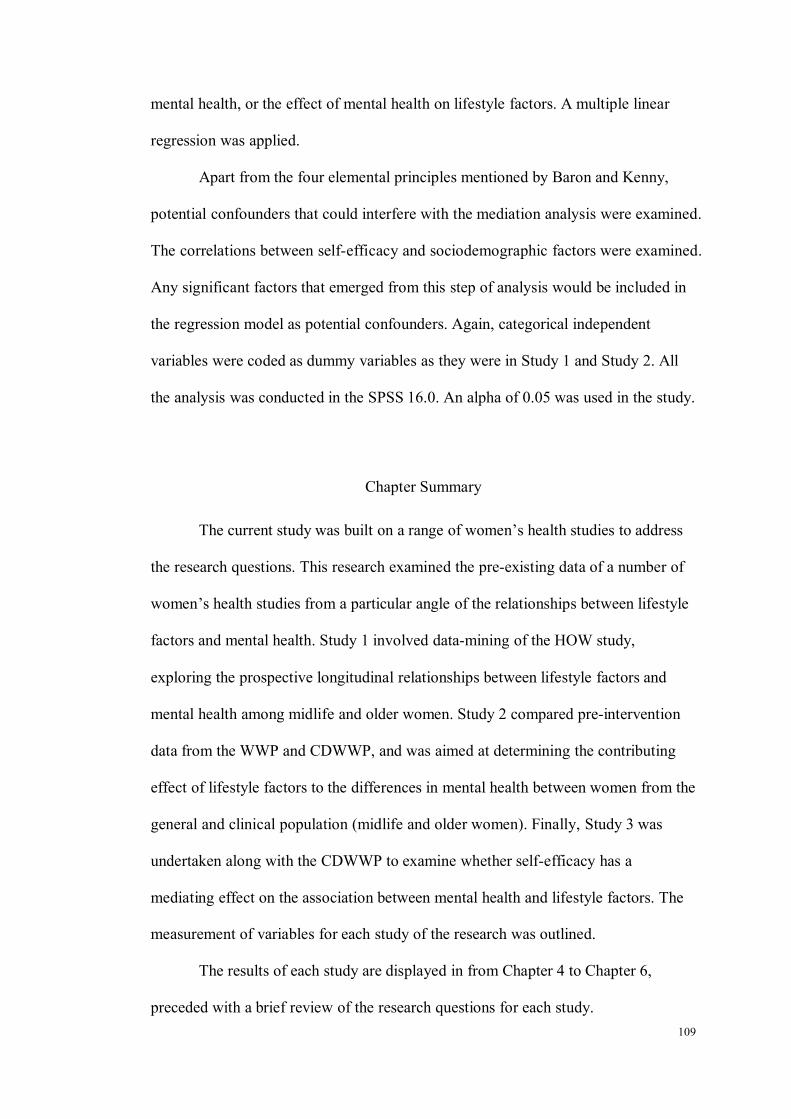
109
mental health, or the effect of mental health on lifestyle factors. A multiple linear
regression was applied.
Apart from the four elemental principles mentioned by Baron and Kenny,
potential confounders that could interfere with the mediation analysis were examined.
The correlations between self-efficacy and sociodemographic factors were examined.
Any significant factors that emerged from this step of analysis would be included in
the regression model as potential confounders. Again, categorical independent
variables were coded as dummy variables as they were in Study 1 and Study 2. All
the analysis was conducted in the SPSS 16.0. An alpha of 0.05 was used in the study.
Chapter Summary
The current study was built on a range of women’s health studies to address
the research questions. This research examined the pre-existing data of a number of
women’s health studies from a particular angle of the relationships between lifestyle
factors and mental health. Study 1 involved data-mining of the HOW study,
exploring the prospective longitudinal relationships between lifestyle factors and
mental health among midlife and older women. Study 2 compared pre-intervention
data from the WWP and CDWWP, and was aimed at determining the contributing
effect of lifestyle factors to the differences in mental health between women from the
general and clinical population (midlife and older women). Finally, Study 3 was
undertaken along with the CDWWP to examine whether self-efficacy has a
mediating effect on the association between mental health and lifestyle factors. The
measurement of variables for each study of the research was outlined.
The results of each study are displayed in from Chapter 4 to Chapter 6,
preceded with a brief review of the research questions for each study.

110
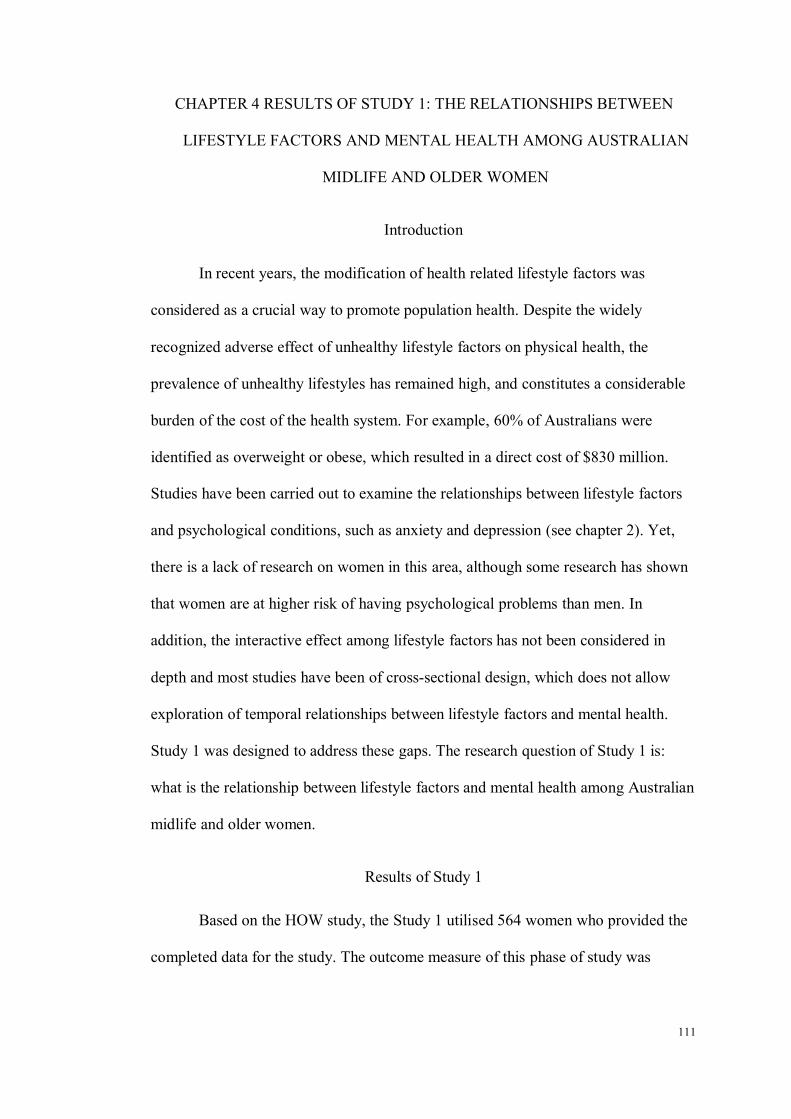
111
CHAPTER 4 RESULTS OF STUDY 1: THE RELATIONSHIPS BETWEEN
LIFESTYLE FACTORS AND MENTAL HEALTH AMONG AUSTRALIAN
MIDLIFE AND OLDER WOMEN
Introduction
In recent years, the modification of health related lifestyle factors was
considered as a crucial way to promote population health. Despite the widely
recognized adverse effect of unhealthy lifestyle factors on physical health, the
prevalence of unhealthy lifestyles has remained high, and constitutes a considerable
burden of the cost of the health system. For example, 60% of Australians were
identified as overweight or obese, which resulted in a direct cost of $830 million.
Studies have been carried out to examine the relationships between lifestyle factors
and psychological conditions, such as anxiety and depression (see chapter 2). Yet,
there is a lack of research on women in this area, although some research has shown
that women are at higher risk of having psychological problems than men. In
addition, the interactive effect among lifestyle factors has not been considered in
depth and most studies have been of cross-sectional design, which does not allow
exploration of temporal relationships between lifestyle factors and mental health.
Study 1 was designed to address these gaps. The research question of Study 1 is:
what is the relationship between lifestyle factors and mental health among Australian
midlife and older women.
Results of Study 1
Based on the HOW study, the Study 1 utilised 564 women who provided the
completed data for the study. The outcome measure of this phase of study was

112
mental health, and the predicting measures were lifestyle factors. Sociodemographic
factors and menopausal status were examined as confounders.
Characteristics of Sample
Totally, 564 women were analysed in Study 1. The mean age of the women
was 55 (SD = 2.76) years (see Table 4.1). Of the women, 78.1 % were married or in
a de facto relationship; 83.1% were born in Australia; 97.9% were non-aboriginal;
28.4% college educated; about 40.8% not in paid employment; 41.8% had a family
annual income of less than $40,000, and 77.5% were postmenopausal (49.4% natural
& 28.1% surgical). No significant differences were found between women who
completed the study and those who dropped out regarding sociodemographic
characteristics, with the exception of age (see Table 4.1). Data showed that women
who were lost to follow-up (54.36 ± 2.87 years) were slightly younger than those
who remained (54.95 ± 2.76 years) in the study, p = .003. Although the difference of
age was statistically significant, it was not believed that the difference of age would
produce a large effect on the outcome measures, as the absolute difference of age
was less than 1 year. In short, it was concluded that women who completed both
waves of the studies did not differ from those who dropped out, and hence were
representative of the study population.
With regard to women’s lifestyle, it was found that for women who
completed both waves of studies, 16.8% of women did not exercise; 61.2% were
non-smokers and 56.8% occasionally drank alcohol. The frequency distribution was
very similar between women who completed both waves of study and those who
dropped out, with no statistical difference identified (see Table 4.1).
In the analysed sample, the mean score for anxiety was 3.54 (SD = 2.89),
depression 3.03 (SD = 2.58), and psychological symptoms 6.53 (SD = 5.01). The
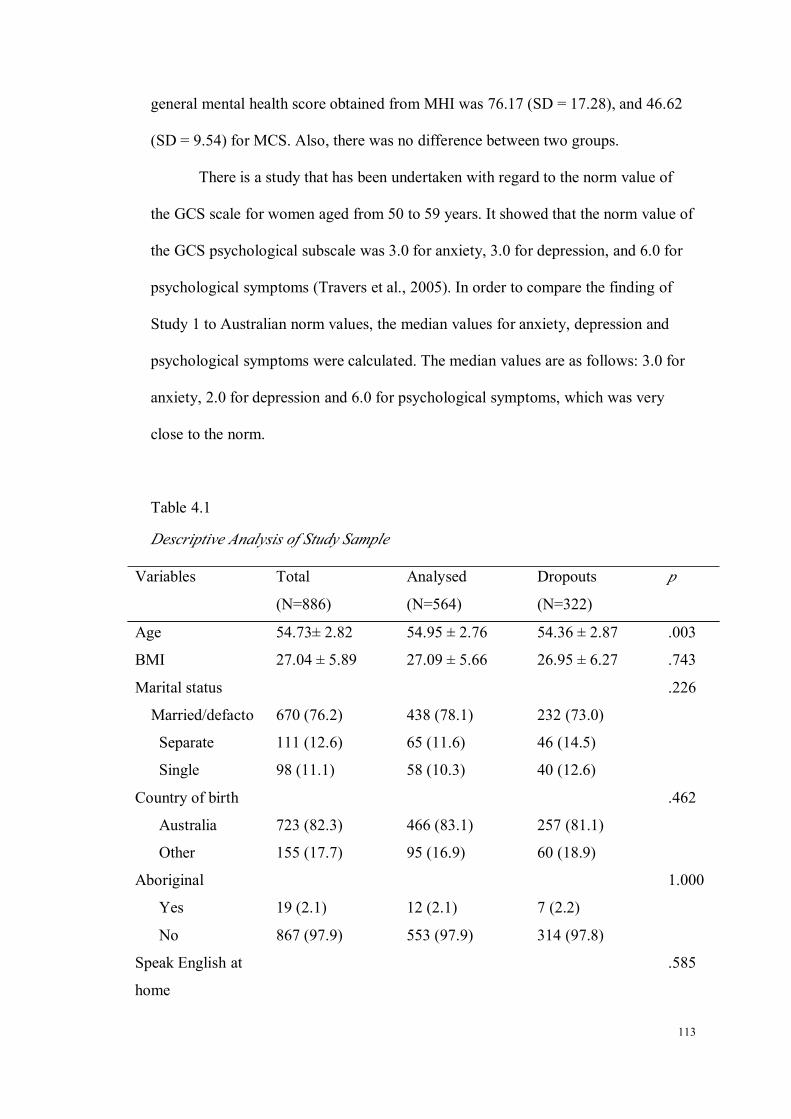
113
general mental health score obtained from MHI was 76.17 (SD = 17.28), and 46.62
(SD = 9.54) for MCS. Also, there was no difference between two groups.
There is a study that has been undertaken with regard to the norm value of
the GCS scale for women aged from 50 to 59 years. It showed that the norm value of
the GCS psychological subscale was 3.0 for anxiety, 3.0 for depression, and 6.0 for
psychological symptoms (Travers et al., 2005). In order to compare the finding of
Study 1 to Australian norm values, the median values for anxiety, depression and
psychological symptoms were calculated. The median values are as follows: 3.0 for
anxiety, 2.0 for depression and 6.0 for psychological symptoms, which was very
close to the norm.
Table 4.1
Descriptive Analysis of Study Sample
Variables Total
(N=886)
Analysed
(N=564)
Dropouts
(N=322)
p
Age 54.73± 2.82 54.95 ± 2.76 54.36 ± 2.87 .003
BMI 27.04 ± 5.89 27.09 ± 5.66 26.95 ± 6.27 .743
Marital status .226
Married/defacto 670 (76.2) 438 (78.1) 232 (73.0)
Separate 111 (12.6) 65 (11.6) 46 (14.5)
Single 98 (11.1) 58 (10.3) 40 (12.6)
Country of birth .462
Australia 723 (82.3) 466 (83.1) 257 (81.1)
Other 155 (17.7) 95 (16.9) 60 (18.9)
Aboriginal 1.000
Yes 19 (2.1) 12 (2.1) 7 (2.2)
No 867 (97.9) 553 (97.9) 314 (97.8)
Speak English at
home
.585
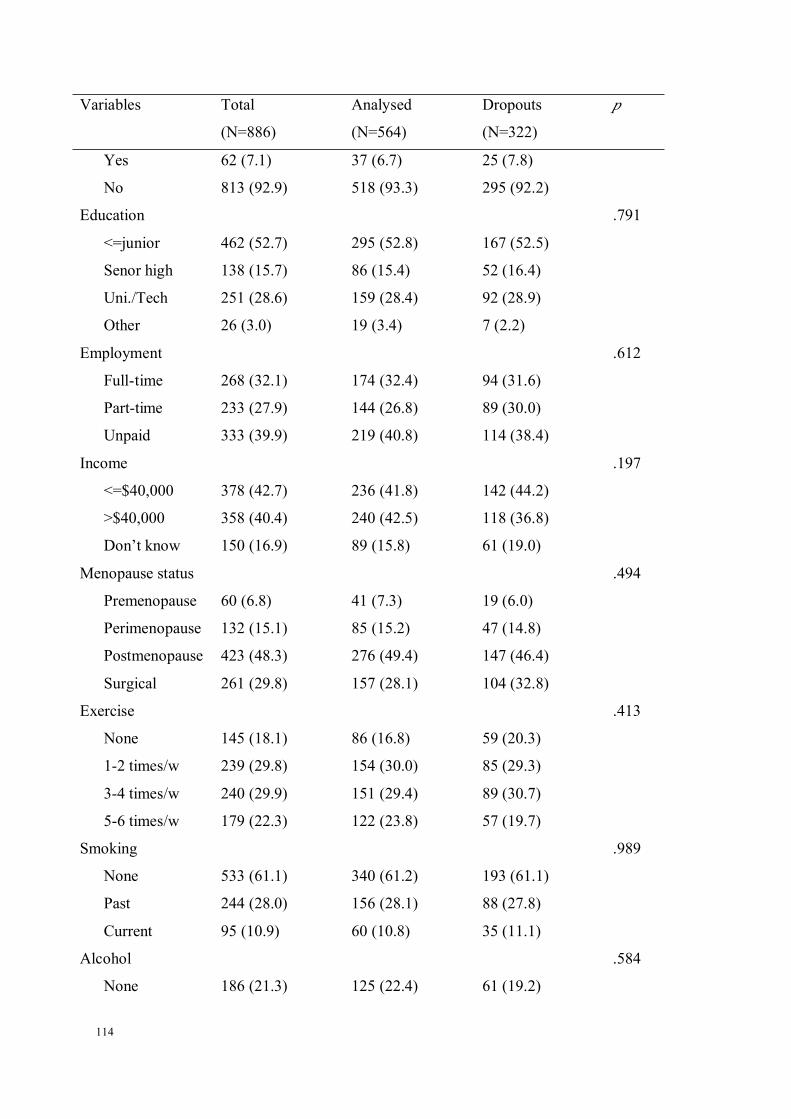
114
Variables Total
(N=886)
Analysed
(N=564)
Dropouts
(N=322)
p
Yes 62 (7.1) 37 (6.7) 25 (7.8)
No 813 (92.9) 518 (93.3) 295 (92.2)
Education .791
<=junior 462 (52.7) 295 (52.8) 167 (52.5)
Senor high 138 (15.7) 86 (15.4) 52 (16.4)
Uni./Tech 251 (28.6) 159 (28.4) 92 (28.9)
Other 26 (3.0) 19 (3.4) 7 (2.2)
Employment .612
Full-time 268 (32.1) 174 (32.4) 94 (31.6)
Part-time 233 (27.9) 144 (26.8) 89 (30.0)
Unpaid 333 (39.9) 219 (40.8) 114 (38.4)
Income .197
<=$40,000 378 (42.7) 236 (41.8) 142 (44.2)
>$40,000 358 (40.4) 240 (42.5) 118 (36.8)
Don’t know 150 (16.9) 89 (15.8) 61 (19.0)
Menopause status .494
Premenopause 60 (6.8) 41 (7.3) 19 (6.0)
Perimenopause 132 (15.1) 85 (15.2) 47 (14.8)
Postmenopause 423 (48.3) 276 (49.4) 147 (46.4)
Surgical 261 (29.8) 157 (28.1) 104 (32.8)
Exercise .413
None 145 (18.1) 86 (16.8) 59 (20.3)
1-2 times/w 239 (29.8) 154 (30.0) 85 (29.3)
3-4 times/w 240 (29.9) 151 (29.4) 89 (30.7)
5-6 times/w 179 (22.3) 122 (23.8) 57 (19.7)
Smoking .989
None 533 (61.1) 340 (61.2) 193 (61.1)
Past 244 (28.0) 156 (28.1) 88 (27.8)
Current 95 (10.9) 60 (10.8) 35 (11.1)
Alcohol .584
None 186 (21.3) 125 (22.4) 61 (19.2)
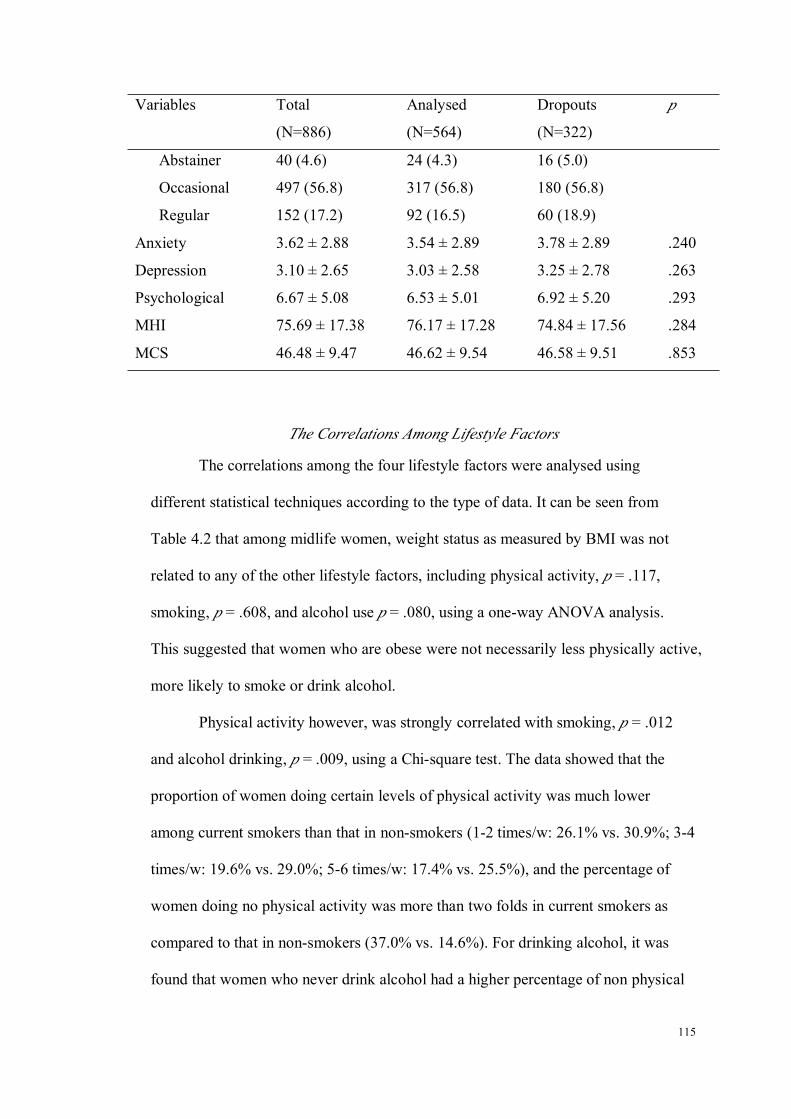
115
Variables Total
(N=886)
Analysed
(N=564)
Dropouts
(N=322)
p
Abstainer 40 (4.6) 24 (4.3) 16 (5.0)
Occasional 497 (56.8) 317 (56.8) 180 (56.8)
Regular 152 (17.2) 92 (16.5) 60 (18.9)
Anxiety 3.62 ± 2.88 3.54 ± 2.89 3.78 ± 2.89 .240
Depression 3.10 ± 2.65 3.03 ± 2.58 3.25 ± 2.78 .263
Psychological 6.67 ± 5.08 6.53 ± 5.01 6.92 ± 5.20 .293
MHI 75.69 ± 17.38 76.17 ± 17.28 74.84 ± 17.56 .284
MCS 46.48 ± 9.47 46.62 ± 9.54 46.58 ± 9.51 .853
The Correlations Among Lifestyle Factors
The correlations among the four lifestyle factors were analysed using
different statistical techniques according to the type of data. It can be seen from
Table 4.2 that among midlife women, weight status as measured by BMI was not
related to any of the other lifestyle factors, including physical activity, p = .117,
smoking, p = .608, and alcohol use p = .080, using a one-way ANOVA analysis.
This suggested that women who are obese were not necessarily less physically active,
more likely to smoke or drink alcohol.
Physical activity however, was strongly correlated with smoking, p = .012
and alcohol drinking, p = .009, using a Chi-square test. The data showed that the
proportion of women doing certain levels of physical activity was much lower
among current smokers than that in non-smokers (1-2 times/w: 26.1% vs. 30.9%; 3-4
times/w: 19.6% vs. 29.0%; 5-6 times/w: 17.4% vs. 25.5%), and the percentage of
women doing no physical activity was more than two folds in current smokers as
compared to that in non-smokers (37.0% vs. 14.6%). For drinking alcohol, it was
found that women who never drink alcohol had a higher percentage of non physical

116
activity (23.3% vs. 16.5%), and a lower percentage of exercising (16.4% vs. 29.4%)
than regular drinkers. The results suggested that women who drink alcohol on a
regular basis were more active than non-drinkers.
Smoking was significantly related with drinking alcohol, p < .001. A
Chi-square analysis revealed that there was a much higher proportion of regular
alcohol drinkers among current smokers than in non-smokers (20.3% vs. 9.8%).
Furthermore, the proportions of regular alcohol drinkers among past smokers and
non smokers were 30.0% vs. 9.8%, respectively.
To summarise, when analysing the intercorrelations among lifestyle factors,
BMI was not found to be related to physical activity, smoking and alcohol use.
Physical activity was negatively correlated with smoking, but positively with alcohol
use. In addition, smoking and alcohol use were strongly related, with the highest
proportion of regular alcohol drinkers being found among past-smokers, followed by
current smokers, and lowest in non-smokers.

117
Table 4.2
The Correlation Matrix Table of Lifestyle Factors, the Significance Level of Tests (p
values)
BMI Physical activity Smoking Alcohol
BMI1
.117
(1.973)^
.608
(0.498)^
.080
(2.268) ^
Physical
activity1
.012
(16.254)§.009
(21.865)§
Smoking 1< .001
(57.640)§
Alcohol 1
^: F value; §: Chi-square
Multiple Linear Regressions: Lifestyle Factors Predicting Mental Health at Baseline
To reiterate, this section described the results of the cross-sectional analysis
of baseline data. Mental health measures were the dependent variables and lifestyle
factors were the independent variables. Sociodemographic factors and menopausal
status were entered into regression models as confounders. Adjusted R2 was
presented.
Anxiety at Baseline as Dependent Variable
Lifestyle factors, sociodemographic factors and menopausal status together
explained 8.1% of the variance in anxiety as measured by the psychological subscale
of the GCS, F(25, 408) = 2.518, p < .001.
Two sociodemographic factors including age and language spoken at home
emerged to be significant factors in the regression model. Age was found to be

118
negatively related with anxiety symptoms in the study population, r = -.187, p = .001,
which suggested that older women tended to have less anxiety symptoms. Women
who do not speak English at home was found to have lower anxiety scores than
women who do, p = .006 (see Table 4.3).
Among the examined lifestyle factors, only physical activity was discovered
to be the significant predictor of anxiety. When compared to women who do not
exercise, women who exercise 5-6 times per week reported significantly less anxiety
symptoms, p = .010. In addition, menopausal stage was not found to be an
influencing factor in the model either.
Table 4.3
Multiple Linear Regression, Anxiety at Baseline as Dependent Variable (N = 433)
Variables B SE β p R2
Anxiety at baseline 8.1
Age -.187 3.660 -.187 .001
Marital status Married/de facto Ref
Separate/divorce .553 .447 .063 .216
Single/widow -.114 .431 -.013 .792
Country of birth Australia Ref
Other countries .025 .363 .003 .944
Aboriginality Yes Ref
No .776 .911 .040 .395
Language
spoken at home
English Ref
Others -1.711 .613 -.139 .006
Education ≤Junior school Ref
Senior school -.437 .401 -.055 .276
Uni./technology .043 .313 .007 .890
Others -.852 .711 -.058 .231
Employment Full-time Ref

119
Variables B SE β p R2
Part-time .082 .347 .013 .813
Not paid .514 .352 .092 .145
Annual family
income
Don’t know Ref
≤ $40, 000 -.055 .564 -.010 .922
> $40, 000 -.634 .567 -.115 .264
BMI .034 .023 .071 .145
Physical
activity
None Ref
1-2 times/w .045 .384 .007 .906
3-4 times/w -.536 .382 -.088 .161
5-6 times/w -1.054 .406 -.161 .010
Smoking Never Ref
Past .296 .305 .049 .332
Current .339 .477 .035 .478
Alcohol Never Ref
Past-drinker .081 .725 .006 .911
Occasionally .188 .329 .034 .569
Regularly .167 .443 .023 .706
Menopausal Perimenopause Ref
Premenopause -1.045 .576 -.099 .071
Postmenopause -.440 .397 -.080 .269
Surgical -.399 .422 -.064 .345
Depression at Baseline as Dependent Variable
As shown in Table 4.4, the same group of independent variables
(sociodemographic factors, lifestyle factor and menopausal stage) explained 13.7%
of the variance in depression at baseline, F(25, 414) = 3.794, p < .001.
At this time, only age turned out to be the significant sociodemographic
factor of depression. Similar to the results about anxiety, age was again found to be
negatively related with depression, r = -.213, p < .001. The data revealed that older

120
women reported less depression symptoms after considering lifestyle factors and
menopausal stages Menopausal stage was found to be related with depression, with
women at postmenopause stage having a lower depression score when compared to
women at the perimenopausal stage.
Two lifestyle factors, including BMI and physical activity, were significant.
The relationship between BMI and depression was positive, r = .154, p = .001,
suggesting women with high BMI had more depression symptoms. Furthermore,
women doing exercise 5-6 times per week had less depressive symptoms when
compared to those doing no exercise (β = .187, p = .002). However, no difference
was found for women exercising at 3-4 times per week, and 1-2 times per week.
Table 4.4
Multiple Linear Regression, Depression at Baseline as Dependent Variable (N =
439)
Variables B SE β p R2
Depression at baseline 13.7
Age -.202 .049 -.213 < .001
Marital status Married/de facto Ref
Separate/divorce .349 .396 .043 .379
Single/widow .107 .394 .013 .786
Country of birth Australia Ref
Other countries -.139 .328 -.020 .672
Aboriginality Yes Ref
No -.429 .829 -.024 .605
Language spoken at
home
English Ref
Others -.979 .527 -.089 .064
Education ≤Junior school Ref
Senior school -.358 .362 -.049 .322
Uni./technology .212 .286 .038 .460

121
Variables B SE β p R2
Others -.528 .628 -.039 .402
Employment Full-time Ref
Part-time .164 .315 .028 .603
Not paid .284 .315 .054 .369
Annual house
income
Don’t know Ref
≤ $40, 000 .328 .481 .063 .497
> $40, 000 -.284 .487 -.055 .560
BMI .068 .021 .154 .001
Physical activity None Ref
1-2 times/w .281 .344 .048 .415
3-4 times/w -.381 .338 -.067 .260
5-6 times/w -1.156 .364 -.187 .002
Smoking Never Ref
Past .188 .278 .033 .499
Current .442 .424 .050 .298
Alcohol Never Ref
Past-drinker -.795 .682 -.058 .245
Occasionally -.437 .297 -.084 .143
Regularly -.320 .405 -.046 .430
Menopausal Perimenopause Ref
Premenopause -.814 .508 -.085 .110
Postmenopause -.960 .363 -.186 .008
Surgical -.620 .381 -.107 .104
Psychological Symptoms at Baseline as Dependent Variable
The group of independent variables as mentioned previously accounted for
11.7% of the variance in psychological symptoms, F(25, 395) = 3.230, p < .001.
Again, age was showed to be a significant factor in predicting psychological
symptoms, r = -.219, p < .001. This result was consistent with previous findings with
regard to depression and anxiety. Taken together, age was still negatively correlated

122
with psychological symptoms among midlife women. Furthermore, women who do
not speak English at home had significantly lower scores of psychological symptoms
(β = -.102, p = .040). Menopausal stage was also found to be significant, with
women at premenopause having less psychological symptoms than women at the
perimenopausal stage (β = -.114, p = .039).
BMI and physical activity were again found to be significant, but not other
lifestyle factors, including smoking and alcohol consumption. BMI was positively
correlated with scores of psychological symptom, r = .112, p = .020, indicating more
psychological symptoms among women with high BMIs. Physical activity was also
shown to be significant, with less psychological symptoms being found among
women exercising 5-6 times per week and those not exercising, β = -.191, p = .002.
Table 4.5
Multiple Linear Regression, Psychological Symptoms at Baseline as Dependent
Variable (N = 420)
Variables B SE β p R2
Psychological symptoms at baseline 11.7
Age -.393 .095 -.219 < .001
Marital status Married/de facto Ref
Separate/divorce .600 .797 .038 .452
Single/widow -.016 .763 -.001 .984
Country of birth Australia Ref
Other countries -.160 .641 -.012 .802
Aboriginality Yes Ref
No .259 1.594 .008 .871
Language spoken
at home
English Ref
Others -2.247 1.092 -.102 .040
Education ≤Junior school Ref
Senior school -.935 .716 -.066 .193
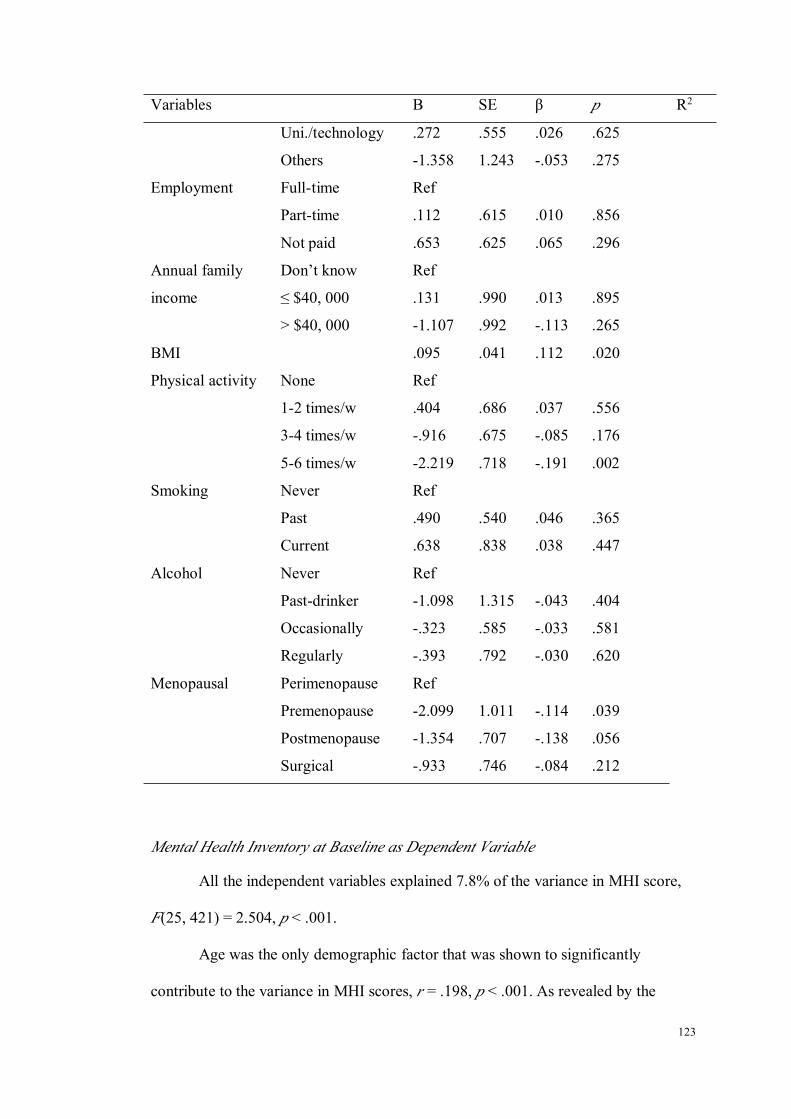
123
Variables B SE β p R2
Uni./technology .272 .555 .026 .625
Others -1.358 1.243 -.053 .275
Employment Full-time Ref
Part-time .112 .615 .010 .856
Not paid .653 .625 .065 .296
Annual family
income
Don’t know Ref
≤ $40, 000 .131 .990 .013 .895
> $40, 000 -1.107 .992 -.113 .265
BMI .095 .041 .112 .020
Physical activity None Ref
1-2 times/w .404 .686 .037 .556
3-4 times/w -.916 .675 -.085 .176
5-6 times/w -2.219 .718 -.191 .002
Smoking Never Ref
Past .490 .540 .046 .365
Current .638 .838 .038 .447
Alcohol Never Ref
Past-drinker -1.098 1.315 -.043 .404
Occasionally -.323 .585 -.033 .581
Regularly -.393 .792 -.030 .620
Menopausal Perimenopause Ref
Premenopause -2.099 1.011 -.114 .039
Postmenopause -1.354 .707 -.138 .056
Surgical -.933 .746 -.084 .212
Mental Health Inventory at Baseline as Dependent Variable
All the independent variables explained 7.8% of the variance in MHI score,
F(25, 421) = 2.504, p < .001.
Age was the only demographic factor that was shown to significantly
contribute to the variance in MHI scores, r = .198, p < .001. As revealed by the
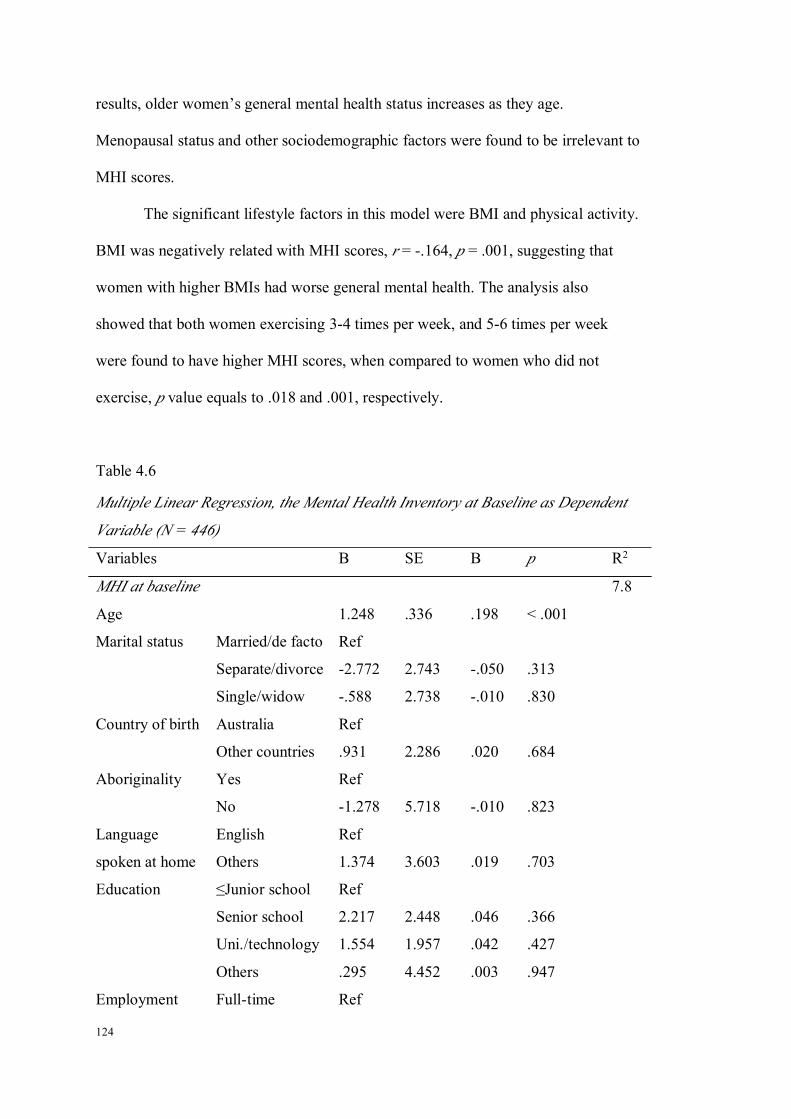
124
results, older women’s general mental health status increases as they age.
Menopausal status and other sociodemographic factors were found to be irrelevant to
MHI scores.
The significant lifestyle factors in this model were BMI and physical activity.
BMI was negatively related with MHI scores, r = -.164, p = .001, suggesting that
women with higher BMIs had worse general mental health. The analysis also
showed that both women exercising 3-4 times per week, and 5-6 times per week
were found to have higher MHI scores, when compared to women who did not
exercise, p value equals to .018 and .001, respectively.
Table 4.6
Multiple Linear Regression, the Mental Health Inventory at Baseline as Dependent
Variable (N = 446)
Variables B SE Β p R2
MHI at baseline 7.8
Age 1.248 .336 .198 < .001
Marital status Married/de facto Ref
Separate/divorce -2.772 2.743 -.050 .313
Single/widow -.588 2.738 -.010 .830
Country of birth Australia Ref
Other countries .931 2.286 .020 .684
Aboriginality Yes Ref
No -1.278 5.718 -.010 .823
Language
spoken at home
English Ref
Others 1.374 3.603 .019 .703
Education ≤Junior school Ref
Senior school 2.217 2.448 .046 .366
Uni./technology 1.554 1.957 .042 .427
Others .295 4.452 .003 .947
Employment Full-time Ref

125
Variables B SE Β p R2
Part-time -.126 2.148 -.003 .953
Not paid -.721 2.145 -.020 .737
Annual family
income
Don’t know Ref
≤ $40, 000 .245 3.277 .007 .940
> $40, 000 3.682 3.315 .107 .267
BMI -.488 .142 -.164 .001
Physical
activity
None Ref
1-2 times/w 2.305 2.362 .060 .330
3-4 times/w 5.609 2.353 .147 .018
5-6 times/w 8.572 2.519 .209 .001
Smoking Never Ref
Past -.074 1.924 -.002 .969
Current -.751 2.949 -.012 .799
Alcohol Never Ref
Past-drinker .657 4.545 .007 .885
Occasionally .282 2.018 .008 .889
Regularly -1.402 2.745 -.030 .610
Menopausal Perimenopause Ref
Premenopause 5.906 3.500 .092 .092
Postmenopause 2.737 2.489 .079 .272
Surgical 2.097 2.623 .053 .424
Mental Composite Score at Baseline as Dependent Variable
With the same group of independent variables, when mental health was
measured by MCS, they only explained 4.8% of the variance in MCS scores, F(25,
362) = 1.789, p = .012.
Age remained a significant factor for MCS, with a positive relationship
indicated, r = .224, p < .001. Women at premenopause status had significantly higher
scores of MCS compared to those at perimenopause, β = .136, p = .021.

126
With regard to lifestyle factors, only BMI was found to be significant, r =
-.105, p = .045, which suggested that the MCS scores decreased as their BMIs
increased. Other lifestyle factors including physical activity, smoking and alcohol
use were not of statistical significance.
Table 4.7
Multiple Linear Regression: the Mental Composite Scores at Baseline as Dependent
Variable (N = 387)
Variables B SE β p R2
MCS at baseline 4.8
Age .764 .198 .224 < .001
Marital status Married/de facto Ref
Separate/divorce -2.616 1.680 -.084 .120
Single/widow -.922 1.576 -.031 .559
Country of birth Australia Ref
Other countries .831 1.394 .033 .552
Aboriginality Yes Ref
No .426 3.368 .006 .899
Language
spoken at home
English Ref
Others .125 2.303 .003 .957
Education ≤Junior school Ref
Senior school 1.351 1.478 .050 .361
Uni./technology .500 1.162 .025 .667
Others .585 2.639 .012 .825
Employment Full-time Ref
Part-time -.209 1.267 -.010 .869
Not paid -1.260 1.293 -.065 .330
Annual family
income
Don’t know Ref
≤ $40, 000 .913 2.025 .048 .652
> $40, 000 1.587 2.035 .084 .436
BMI -.176 .087 -.105 .045

127
Variables B SE β p R2
Physical
activity
None Ref
1-2 times/w -.976 1.440 -.047 .498
3-4 times/w 1.083 1.422 .052 .447
5-6 times/w 2.845 1.537 .127 .065
Smoking Never Ref
Past .368 1.137 .018 .746
Current -.461 1.917 -.013 .810
Alcohol Never Ref
Past-drinker -1.330 2.751 -.026 .629
Occasionally -.671 1.203 -.035 .577
Regularly -.432 1.639 -.017 .792
Menopausal Perimenopause Ref
Premenopause 5.044 2.169 .136 .021
Postmenopause .547 1.472 .029 .710
Surgical 1.829 1.562 .084 .242
Brief Conclusion of the Cross-sectional Analysis
In short, analysis of the baseline data showed that after adjusting for
sociodemographic factors and menopausal status, physical activity was negatively
correlated with mental health. Furthermore, BMI had a positive relationship with
psychological symptoms including depression and general mental health, suggesting
a lower level of mental health in relation to high BMI. For the other two lifestyle
factors, smoking and alcohol use, no correlation was detected in relation to mental
health. The results suggest that women who are physically active have better mental
health, women with a higher BMI tend to have low levels of mental health, and there
is no difference in mental health in relation to smoking and alcohol drinking.
Additionally, age was showed to be a strong protective factor of women’s
mental health, as evidenced by a negative relationship with psychological symptoms
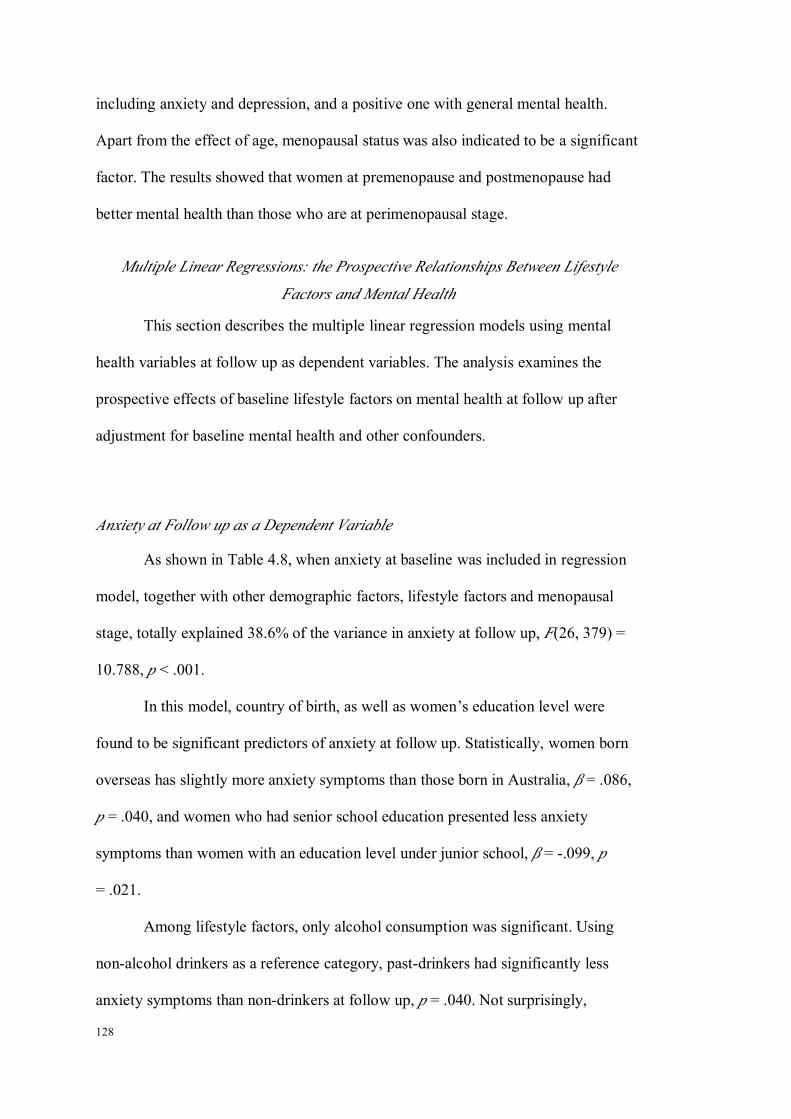
128
including anxiety and depression, and a positive one with general mental health.
Apart from the effect of age, menopausal status was also indicated to be a significant
factor. The results showed that women at premenopause and postmenopause had
better mental health than those who are at perimenopausal stage.
Multiple Linear Regressions: the Prospective Relationships Between Lifestyle
Factors and Mental Health
This section describes the multiple linear regression models using mental
health variables at follow up as dependent variables. The analysis examines the
prospective effects of baseline lifestyle factors on mental health at follow up after
adjustment for baseline mental health and other confounders.
Anxiety at Follow up as a Dependent Variable
As shown in Table 4.8, when anxiety at baseline was included in regression
model, together with other demographic factors, lifestyle factors and menopausal
stage, totally explained 38.6% of the variance in anxiety at follow up, F(26, 379) =
10.788, p < .001.
In this model, country of birth, as well as women’s education level were
found to be significant predictors of anxiety at follow up. Statistically, women born
overseas has slightly more anxiety symptoms than those born in Australia, β = .086,
p = .040, and women who had senior school education presented less anxiety
symptoms than women with an education level under junior school, β = -.099, p
= .021.
Among lifestyle factors, only alcohol consumption was significant. Using
non-alcohol drinkers as a reference category, past-drinkers had significantly less
anxiety symptoms than non-drinkers at follow up, p = .040. Not surprisingly,

129
baseline anxiety had the highest correlation with anxiety at follow up in the whole
model, β = .623, p < .001. The interaction effect of alcohol consumption on anxiety
over time was also plotted in Figure 4.1.
So, adjusting for the baseline anxiety symptoms, only alcohol use was found
to be correlated with women’s anxiety symptoms at follow up.
Table 4.8
Multiple Linear Regression: Anxiety at Follow up as dependent variable (N = 405)
Variables B SE β p R2
Anxiety at follow up 38.6
Age .049 .042 .054 .243
Marital status Married/de facto Ref
Separate/divorce -.324 .349 -.040 .355
Single/widow .107 .328 .014 .744
Country of birth Australia Ref
Other countries .565 .275 .086 .040
Aboriginality Yes Ref
No -.339 .757 -.018 .654
Language
spoken at home
English Ref
Others .620 .488 .053 .205
Education ≤Junior school Ref
Senior school -.727 .313 -.099 .021
Uni./technology -.411 .235 -.079 .081
Others .046 .525 .004 .930
Employment Full-time Ref
Part-time -.346 .265 -.062 .192
Not paid -.155 .267 -.031 .562
Annual family
income
Don’t know Ref
≤ $40, 000 -.307 .442 -.062 .488
> $40, 000 -.413 .439 -.084 .347
BMI -.012 .018 -.026 .522
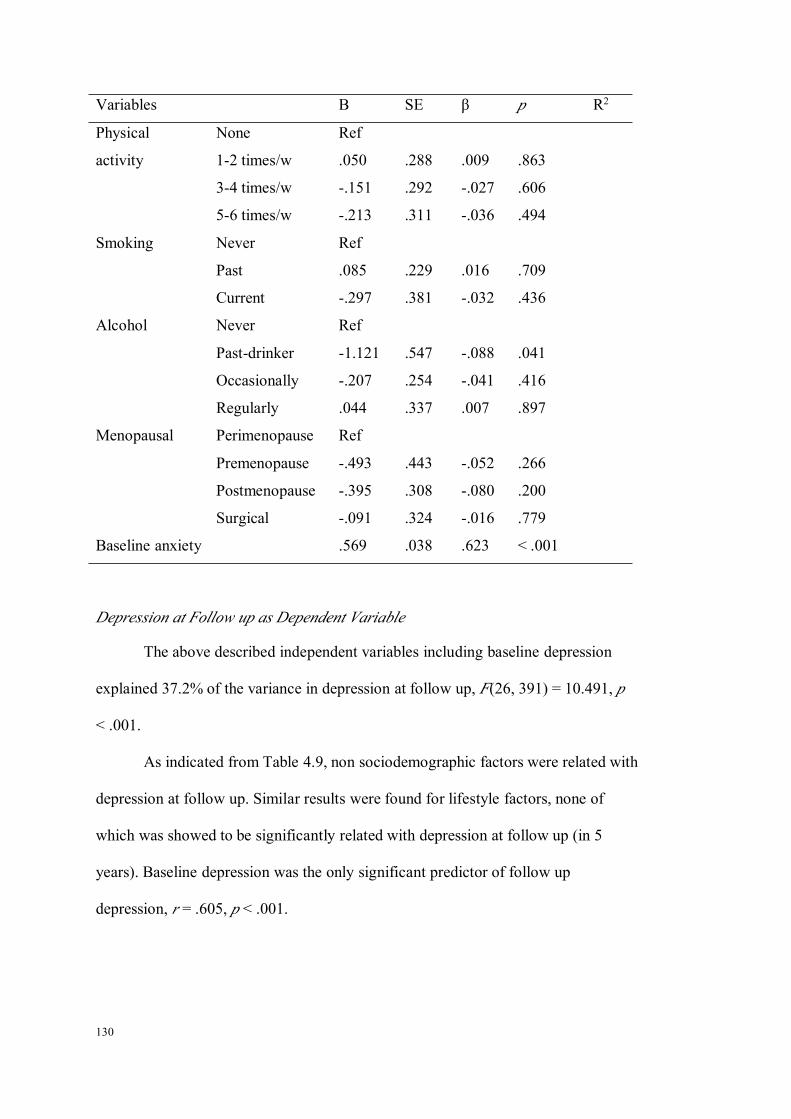
130
Variables B SE β p R2
Physical
activity
None Ref
1-2 times/w .050 .288 .009 .863
3-4 times/w -.151 .292 -.027 .606
5-6 times/w -.213 .311 -.036 .494
Smoking Never Ref
Past .085 .229 .016 .709
Current -.297 .381 -.032 .436
Alcohol Never Ref
Past-drinker -1.121 .547 -.088 .041
Occasionally -.207 .254 -.041 .416
Regularly .044 .337 .007 .897
Menopausal Perimenopause Ref
Premenopause -.493 .443 -.052 .266
Postmenopause -.395 .308 -.080 .200
Surgical -.091 .324 -.016 .779
Baseline anxiety .569 .038 .623 < .001
Depression at Follow up as Dependent Variable
The above described independent variables including baseline depression
explained 37.2% of the variance in depression at follow up, F(26, 391) = 10.491, p
< .001.
As indicated from Table 4.9, non sociodemographic factors were related with
depression at follow up. Similar results were found for lifestyle factors, none of
which was showed to be significantly related with depression at follow up (in 5
years). Baseline depression was the only significant predictor of follow up
depression, r = .605, p < .001.
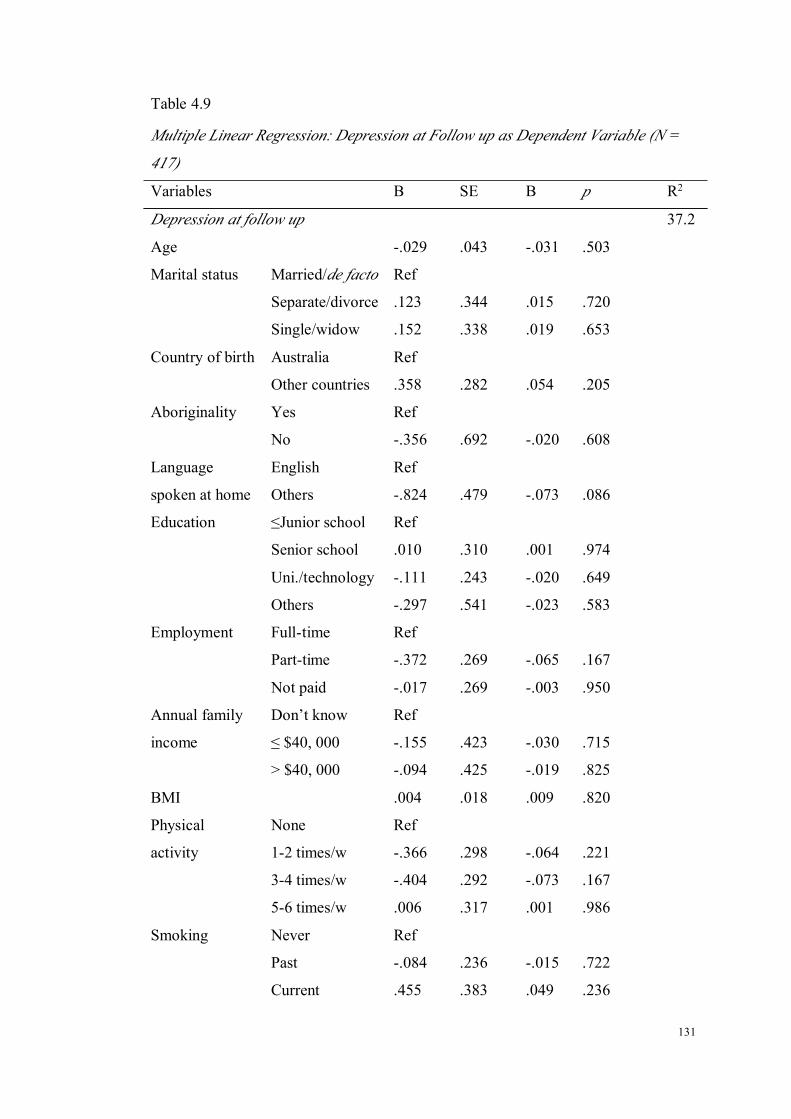
131
Table 4.9
Multiple Linear Regression: Depression at Follow up as Dependent Variable (N =
417)
Variables B SE Β p R2
Depression at follow up 37.2
Age -.029 .043 -.031 .503
Marital status Married/de facto Ref
Separate/divorce .123 .344 .015 .720
Single/widow .152 .338 .019 .653
Country of birth Australia Ref
Other countries .358 .282 .054 .205
Aboriginality Yes Ref
No -.356 .692 -.020 .608
Language
spoken at home
English Ref
Others -.824 .479 -.073 .086
Education ≤Junior school Ref
Senior school .010 .310 .001 .974
Uni./technology -.111 .243 -.020 .649
Others -.297 .541 -.023 .583
Employment Full-time Ref
Part-time -.372 .269 -.065 .167
Not paid -.017 .269 -.003 .950
Annual family
income
Don’t know Ref
≤ $40, 000 -.155 .423 -.030 .715
> $40, 000 -.094 .425 -.019 .825
BMI .004 .018 .009 .820
Physical
activity
None Ref
1-2 times/w -.366 .298 -.064 .221
3-4 times/w -.404 .292 -.073 .167
5-6 times/w .006 .317 .001 .986
Smoking Never Ref
Past -.084 .236 -.015 .722
Current .455 .383 .049 .236
132
Variables B SE Β p R2
Alcohol Never Ref
Past-drinker .661 .588 .049 .262
Occasionally .137 .253 .027 .588
Regularly .044 .350 .006 .900
Menopausal Perimenopause Ref
Premenopause -.010 .438 -.001 .982
Postmenopause -.229 .312 -.045 .464
Surgical -.403 .326 -.071 .217
Baseline
depression
.596 .043 .605 < .001
Psychological Symptoms at Follow up as Dependent Variable
The accounted variance of psychological symptoms at follow up was 42.5%,
F(26, 359) = 11.398, p < .001, using the socio-demographic, lifestyle factors,
menopausal stage and baseline psychological symptoms.
In this model, as shown in Table 4.10, there was a difference in psychological
symptoms in five years in relation to country of birth, with women born overseas
having slightly increased psychological symptoms, β = .089, p = .032. Apart from
this, only baseline psychological symptoms was the significant predictor, r = .664, p
< .001. Psychological symptoms at follow up did not differ according to lifestyle
factors and menopausal symptoms.
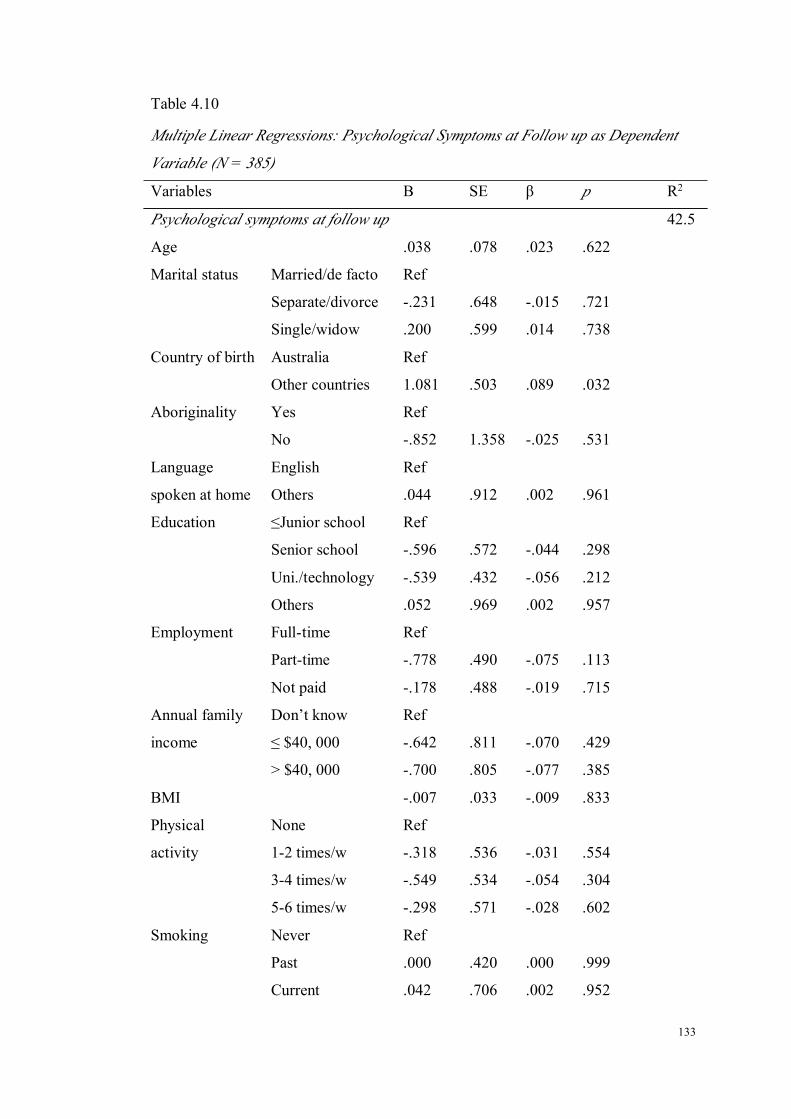
133
Table 4.10
Multiple Linear Regressions: Psychological Symptoms at Follow up as Dependent
Variable (N = 385)
Variables B SE β p R2
Psychological symptoms at follow up 42.5
Age .038 .078 .023 .622
Marital status Married/de facto Ref
Separate/divorce -.231 .648 -.015 .721
Single/widow .200 .599 .014 .738
Country of birth Australia Ref
Other countries 1.081 .503 .089 .032
Aboriginality Yes Ref
No -.852 1.358 -.025 .531
Language
spoken at home
English Ref
Others .044 .912 .002 .961
Education ≤Junior school Ref
Senior school -.596 .572 -.044 .298
Uni./technology -.539 .432 -.056 .212
Others .052 .969 .002 .957
Employment Full-time Ref
Part-time -.778 .490 -.075 .113
Not paid -.178 .488 -.019 .715
Annual family
income
Don’t know Ref
≤ $40, 000 -.642 .811 -.070 .429
> $40, 000 -.700 .805 -.077 .385
BMI -.007 .033 -.009 .833
Physical
activity
None Ref
1-2 times/w -.318 .536 -.031 .554
3-4 times/w -.549 .534 -.054 .304
5-6 times/w -.298 .571 -.028 .602
Smoking Never Ref
Past .000 .420 .000 .999
Current .042 .706 .002 .952

134
Variables B SE β p R2
Alcohol Never Ref
Past-drinker -.284 1.053 -.012 .787
Occasionally .008 .463 .001 .986
Regularly .286 .626 .023 .648
Menopausal Perimenopause Ref
Premenopause -.505 .799 -.030 .527
Postmenopause -.368 .565 -.040 .515
Surgical -.202 .592 -.020 .734
Baseline
psychological.628 .040 .664 < .001
Mental Health Inventory at Follow up as Dependent Variable
First, baseline MHI score with other independent variables explained 37.4%
of the variance in the MHI score at five years’ follow up, F(26, 407) = 10.951, p
< .001. Baseline MHI likewise was the most strong predictor of MHI scores at
follow up, with a positive relationship, r = .602, p < .001.
For general mental health, as measured by the MHI in this model, smoking
emerged to be a significant factor of MHI at follow up. The results showed that
current smokers had as much as 7.225 points lower MHI at follow up compared to
non-smokers, p = .003. No difference was detected between past-smokers and
non-smokers. Interestingly, BMI was found to be a significant and protective factor
of MHI at follow up, r = .107, p = .009. The effect of smoking on MHI measured
mental health over time was also plotted in Figure 4.2.

135
Table 4.11
Multiple Linear Regressions: the Mental Health Inventory Scores at Follow up as
Dependent Variable (N = 433)
Variables B SE β p R2
MHI at follow up 37.4
Age -.214 .274 -.035 .436
Marital status Married/de facto Ref
Separate/divorce .563 2.212 .011 .799
Single/widow -3.884 2.179 -.072 .075
Country of birth Australia Ref
Other countries -.836 1.815 -.019 .645
Aboriginality Yes Ref
No -1.597 4.503 -.014 .723
Language
spoken at home
English Ref
Others 4.916 2.879 .070 .088
Education ≤Junior school Ref
Senior school -.346 1.958 -.007 .860
Uni./technology .976 1.560 .028 .532
Others 1.527 3.508 .017 .664
Employment Full-time Ref
Part-time 1.641 1.705 .044 .336
Not paid -.794 1.704 -.024 .641
Annual family
income
Don’t know Ref
≤ $40, 000 4.092 2.651 .123 .123
> $40, 000 2.161 2.678 .066 .420
BMI .312 .119 .107 .009
Physical
activity
None Ref
1-2 times/w 1.268 1.892 .034 .503
3-4 times/w 1.543 1.896 .042 .416
5-6 times/w 1.273 2.050 .033 .535
Smoking Never Ref
Past 1.282 1.524 .035 .401
Current -7.225 2.415 -.121 .003

136
Variables B SE β p R2
Alcohol Never Ref
Past-drinker -1.541 3.582 -.018 .667
Occasionally -1.993 1.616 -.060 .218
Regularly -3.304 2.202 -.075 .134
Menopausal Perimenopause Ref
Premenopause 4.499 2.775 .074 .106
Postmenopause 3.158 1.980 .096 .111
Surgical 4.021 2.087 .106 .055
Baseline MHI .573 .039 .602 < .001
Mental Composite Score at Follow up as Dependent Variable
Regression analysis showed that socio-demographic, lifestyle factors, and
menopausal stages together with MCS at follow up scores explained 25.8% of the
variance in MCS at follow up, F(26, 320) = 5.618, p < .001.
Marital status and language spoken at home were significant predictors of
MCS at follow up. As shown in Table 4.12, over time, women who were single
tended to score 4 points lower in MCS than those who were married, p = .020.
Regarding language spoken at home, women not speaking English at home had 5
more points in MCS at follow up, p = .029.
Smoking continued to be a significant factor for MCS scores at follow up,
with current smokers having a significantly lower score of MCS than non-smokers, β
= -.103, p = .036. Similar to the finding about BMI and MHI scores at follow up,
BMI was again discovered to be a significant factor of general mental health, as
measured by MCS. The r value was .281, p = .004. Both of the results conveyed the
information that women with high BMIs were more likely to have a better general
mental health status. The effect of smoking on MCS over time was also displayed in
Figure 4.3.
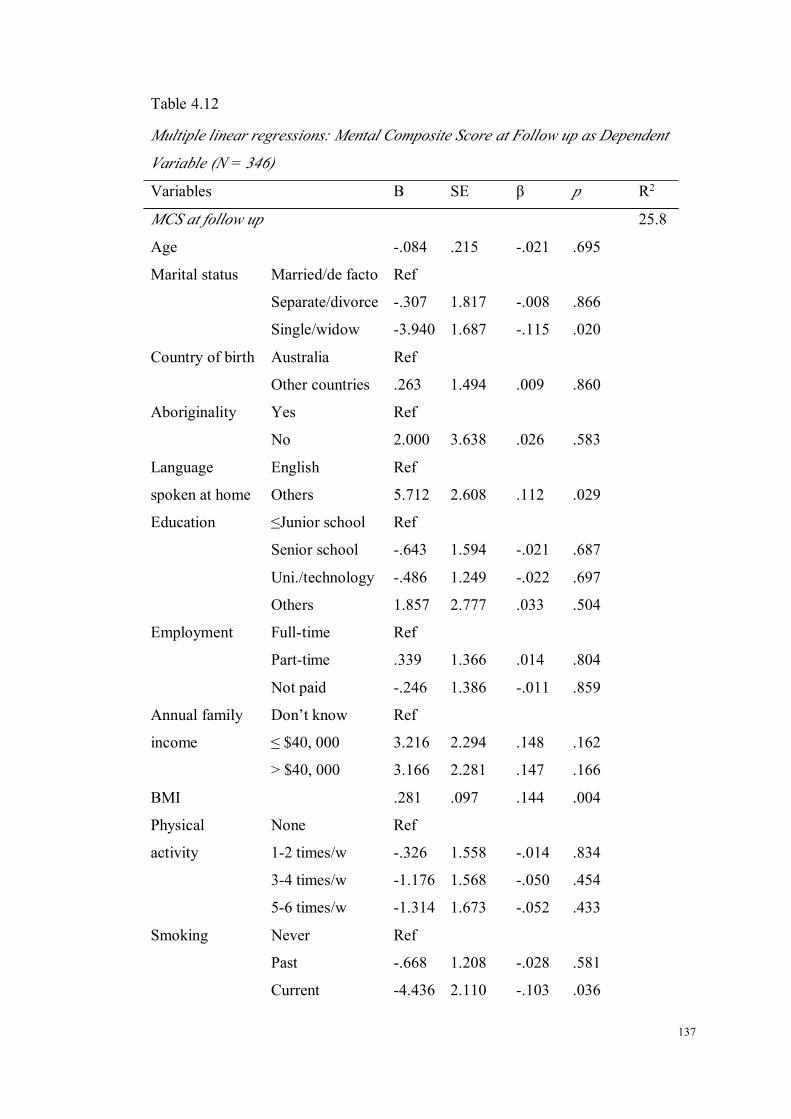
137
Table 4.12
Multiple linear regressions: Mental Composite Score at Follow up as Dependent
Variable (N = 346)
Variables B SE β p R2
MCS at follow up 25.8
Age -.084 .215 -.021 .695
Marital status Married/de facto Ref
Separate/divorce -.307 1.817 -.008 .866
Single/widow -3.940 1.687 -.115 .020
Country of birth Australia Ref
Other countries .263 1.494 .009 .860
Aboriginality Yes Ref
No 2.000 3.638 .026 .583
Language
spoken at home
English Ref
Others 5.712 2.608 .112 .029
Education ≤Junior school Ref
Senior school -.643 1.594 -.021 .687
Uni./technology -.486 1.249 -.022 .697
Others 1.857 2.777 .033 .504
Employment Full-time Ref
Part-time .339 1.366 .014 .804
Not paid -.246 1.386 -.011 .859
Annual family
income
Don’t know Ref
≤ $40, 000 3.216 2.294 .148 .162
> $40, 000 3.166 2.281 .147 .166
BMI .281 .097 .144 .004
Physical
activity
None Ref
1-2 times/w -.326 1.558 -.014 .834
3-4 times/w -1.176 1.568 -.050 .454
5-6 times/w -1.314 1.673 -.052 .433
Smoking Never Ref
Past -.668 1.208 -.028 .581
Current -4.436 2.110 -.103 .036

138
Variables B SE β p R2
Alcohol Never Ref
Past-drinker -1.013 3.121 -.017 .746
Occasionally -.721 1.322 -.033 .586
Regularly -.419 1.787 -.015 .815
Menopausal Perimenopause Ref
Premenopause 4.351 2.308 .105 .060
Postmenopause 3.293 1.560 .153 .036
Surgical 3.634 1.657 .148 .029
Baseline MCS .574 .056 .499 < .001
Further Examination of the Effect of BMI as Women Age
Study from our research showed a significant and positive relationship
between BMI and general mental health (MHI & MCS) at follow up. Such results
have not been consistent with the findings from previous studies (Kasen et al., 2008;
Roberts, Deleger, Strawbridge, & Kaplan, 2003). To confirm the obtained results,
the difference of the change of mental health variables between baseline and follow
up were compared using a one-way ANOVA analysis. The results shown in Table
4.13 were consistent with what was found in regression models that explored the
prospective effect of lifestyle factors mental health. In brief, BMI had no correlations
with anxiety, depression and psychological symptoms, but it was significantly
related to general mental health measured by MHI (p = .020) and MCS (p = .010).
As indicated by the Post Hoc tests, women who were obese at baseline had a
significantly higher increase in general mental health scores, suggesting that the
general mental health of obese women did improve over time, while the general
mental health of women with normal weight remained much the same.
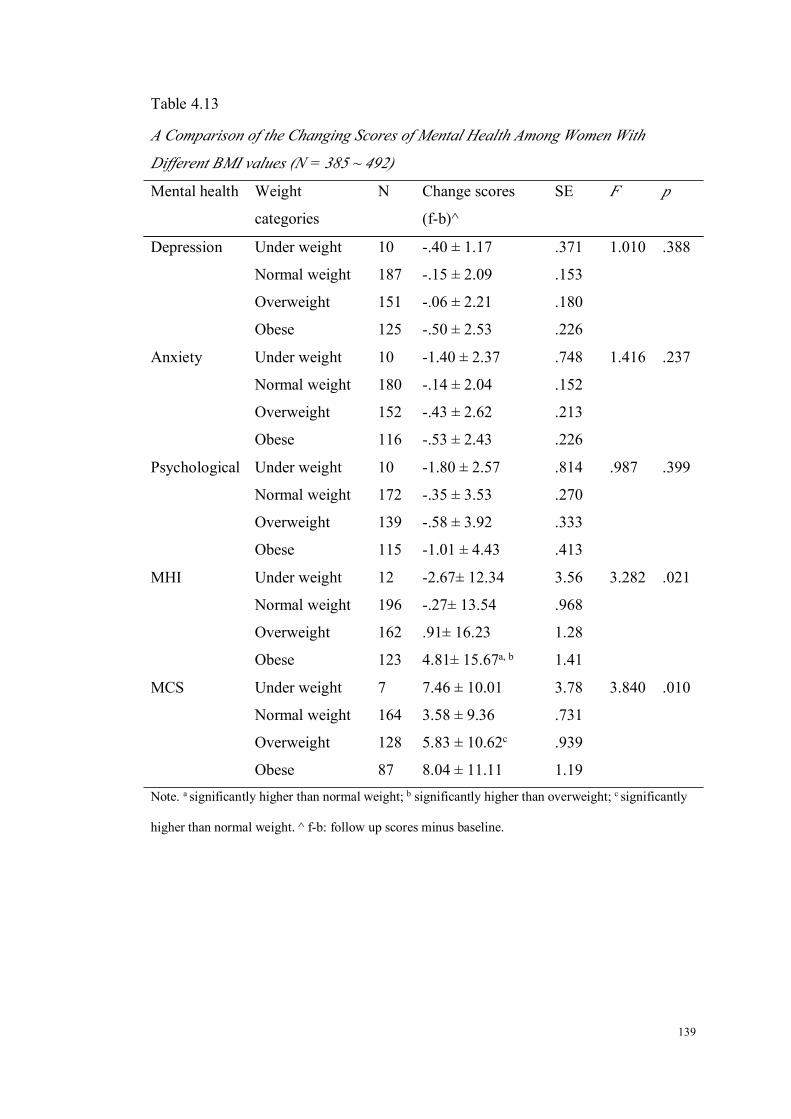
139
Table 4.13
A Comparison of the Changing Scores of Mental Health Among Women With
Different BMI values (N = 385 ~ 492)
Mental health Weight
categories
N Change scores
(f-b)^
SE F p
Depression Under weight 10 -.40 ± 1.17 .371 1.010 .388
Normal weight 187 -.15 ± 2.09 .153
Overweight 151 -.06 ± 2.21 .180
Obese 125 -.50 ± 2.53 .226
Anxiety Under weight 10 -1.40 ± 2.37 .748 1.416 .237
Normal weight 180 -.14 ± 2.04 .152
Overweight 152 -.43 ± 2.62 .213
Obese 116 -.53 ± 2.43 .226
Psychological Under weight 10 -1.80 ± 2.57 .814 .987 .399
Normal weight 172 -.35 ± 3.53 .270
Overweight 139 -.58 ± 3.92 .333
Obese 115 -1.01 ± 4.43 .413
MHI Under weight 12 -2.67± 12.34 3.56 3.282 .021
Normal weight 196 -.27± 13.54 .968
Overweight 162 .91± 16.23 1.28
Obese 123 4.81± 15.67a, b 1.41
MCS Under weight 7 7.46 ± 10.01 3.78 3.840 .010
Normal weight 164 3.58 ± 9.36 .731
Overweight 128 5.83 ± 10.62c .939
Obese 87 8.04 ± 11.11 1.19
Note. a significantly higher than normal weight; b significantly higher than overweight; c significantly
higher than normal weight. ^ f-b: follow up scores minus baseline.

140
Figure 4.1. The impact of alcohol use on the change of anxiety scores over 5 years.
Figure 4.2. The impact of smoking on the change of MHI scores over 5 years.

141
Figure 4.3. The impact of smoking on the change of MCS scores over 5 years.
Since depression and psychological symptoms were not affected by any of
the measured lifestyle factors, a paired t-test was used to compare the mean. As
shown in Table 4.14, women’s depression and psychological scores decreased over
the follow-up period, with the improvement of psychological symptoms being
statistically significant, p = .001.
Table 4.14
Paired t-Test of Depression and Psychological Symptoms Between Baseline and 5
Years Follow Up (N = 454 ~ 493)
Variables Baseline Follow up Mean difference t p
Depression 3.00 ± 2.58 2.81 ± 2.46 0.19 ± 2.23 1.888 .060
Psychological
symptoms
6.35 ± 4.93 5.75 ± 4.59 0.60 ± 3.90 3.302 .001
142
Brief Conclusion of the Prospective Analysis
The longitudinal prospective analysis showed that: 1) women who were past
drinkers had less anxiety symptoms as they age than non-drinkers; 2) no significant
lifestyle factor was determined in predicting depression and psychological symptoms
at follow up, yet there was a trend toward significance for physical activity; 3)
current smokers had a significantly lower levels of general mental health when
compared to non-smokers, no matter how general mental health was measured; and 4)
women who were obese at baseline experienced a better improvement of general
mental health over time than women with normal weight.
Reflection on Research Questions
The major findings of the study 1 are summarized as below:
1. What are relationships between lifestyle factors and mental health among midlife
and older women?
The research found that BMI was positively related with scores of
depression and psychological symptoms, and negatively related with general
mental health scores (MHI). These results suggested that women with a higher
BMI had a lower level of mental health.
Second, women exercising daily had less psychological symptoms
including anxiety and depression, and better general mental health status than
women who did not exercise. In short, daily physical activity improves the
mental health of midlife and older women.
2) What is the long-term effect of lifestyle factors and mental health among midlife
and older women?
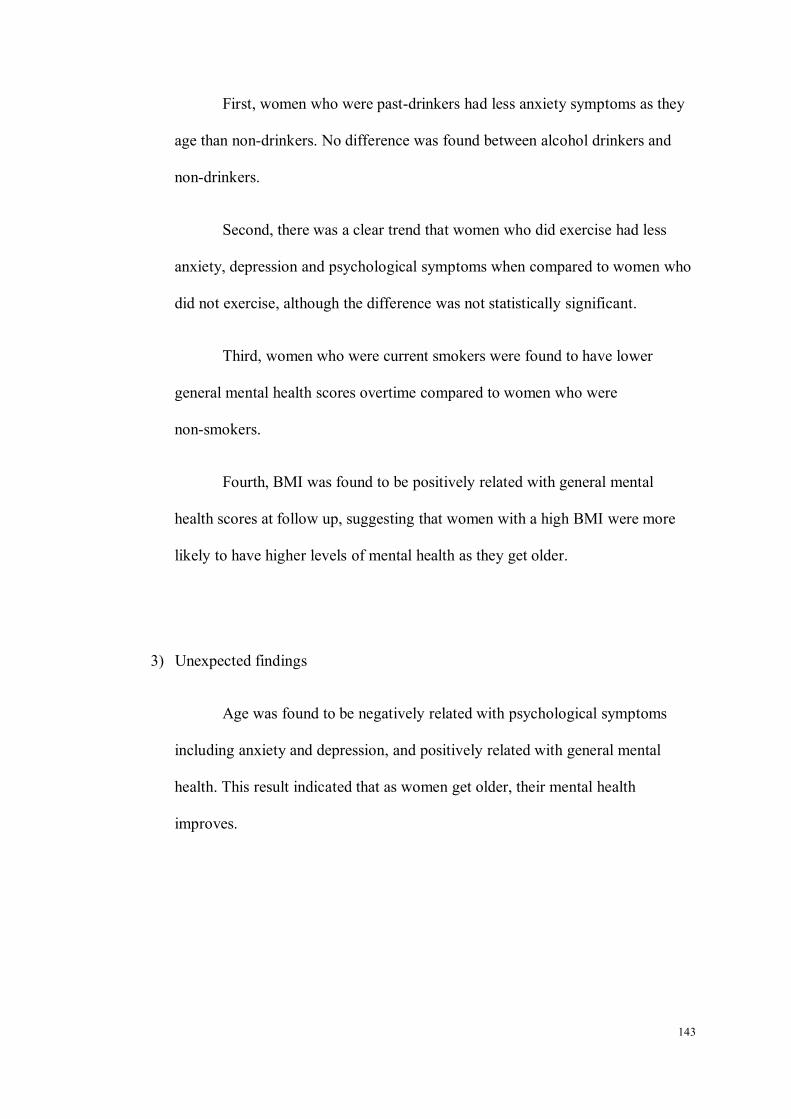
143
First, women who were past-drinkers had less anxiety symptoms as they
age than non-drinkers. No difference was found between alcohol drinkers and
non-drinkers.
Second, there was a clear trend that women who did exercise had less
anxiety, depression and psychological symptoms when compared to women who
did not exercise, although the difference was not statistically significant.
Third, women who were current smokers were found to have lower
general mental health scores overtime compared to women who were
non-smokers.
Fourth, BMI was found to be positively related with general mental
health scores at follow up, suggesting that women with a high BMI were more
likely to have higher levels of mental health as they get older.
3) Unexpected findings
Age was found to be negatively related with psychological symptoms
including anxiety and depression, and positively related with general mental
health. This result indicated that as women get older, their mental health
improves.

144

145
CHAPTER 5 RESULTS OF STUDY 2: THE RELATIONSHIPS BETWEEN
LIFESTYLE FACTORS AND MENTAL HEALTH AMONG AUSTRALIAN
MIDLIFE AND OLDER WOMEN WITH AND WITHOUT DIABETES
Introduction
Study 2 can be seen as an extension of a recent meta-analysis which
examines the prevalence of depression among individuals with diabetes (Ali et al.,
2006). This review paper showed that women with diabetes were more likely to have
depression than those without; however, as highlighted by the authors, these two
groups often differed in factors that are associated with depression, such as obesity in
many studies included in that review. Extending from this review study, Study 2 was
designed to explore the difference of mental health levels between midlife and older
women with and without diabetes and the contributing factors to the difference in
mental health quality. It is hypothesised that lifestyle factors may affect the mental
health levels of women with diabetes. If this hypothesis is proved, the knowledge
generated from the study can be used for health professionals or researchers to
develop programs to reduce the gap.
In total, 177 women were analysed in Study 2, with 94 from the WWP study
and 83 women from the CDWWP. In this study, the outcome measures were mental
health, and the independent variables were lifestyle factors and diabetes. Examined
covariates included sociodemographic factors, menopausal status and number of
co-morbidities. A hierarchical linear regression was used as the main analysis
method for Study 2.
146
Results of Study 2
Description of Sociodemographic Characteristics of the Sample
Age
The mean age of the whole sample was 60 years (SD = 8.08), with the
women having a diagnosis of diabetes being significantly older than those without
diabetes, 65.22 years (SD = 9.02) and 56.38 years (SD = 3.97), respectively.
Marital status
Over 60% of the women were currently married. The distributions of women
who were currently married and not married were similar between the diabetes and
non-diabetes groups, with non statistical significance being found, p = .218.
Education
54% of the women had an education level at senior school or beyond. Of
those, 70% of the women had received a college or technological school education.
When examining the frequency of education levels in relation to diabetes, it was
found that the distribution of three education levels was very close and the
Chi-square test failed to detect any significant difference, p = .243.
Employment
With regard to the employment status, there was a significant difference
between women with and without diabetes, p < .001. Among women with diabetes,
about 75% of them were not in paid employment (either full-time or part-time),
while in women without diabetes, only 45.3% women were in this category. Across

147
the whole sample, about 40% of women were currently employed, with nearly 60%
unemployed.
Annual income
Forty percent (40%) of the women reported an annual household income of
more than $40,000, with more than half reporting less than $40,000. A small number
of the women chose not to answer this question. The data revealed that the annual
income status was higher among women without diabetes than those with diabetes,
with a higher proportion of women having an annual income over $40,000. There
was a trend towards significance for this variable, p = .051.
Country of birth
Approximately 70% women in Study 2 were Australian born, and the
distribution of Australian and non-Australian born women were both similar to the
overall levels. The proportion of overseas born Australians in this sample (23.7%)
was very close to that of the national population (22.0%) (Australian Bureau of
Statistics, 2006a).
Aboriginality
Only 1 woman identified herself as indigenous.
Language spoken at home other than English
Ninety three percent (93%) of the women spoke English at home. The
corresponding proportions in women with and without diabetes were similar to this
value, and no differences were found between groups, p = .253.

148
Menopausal status
The majority (87%) of women were postmenopausal (50.6% naturally and
37.9% surgically). The proportion of women at perimenopause among women
without diabetes was twice as high when compared with women with diabetes. In
addition, a higher percentage of women who were in surgical menopause was seen in
women with diabetes. However, the difference in distribution of menopausal status
was not significant, p = .111.
In summary, women with diabetes were older and less likely to be employed
than those who did not have diabetes.
Table 5.1
The Characteristics of Sociodemographic Factors of Women With and Without
Diabetes (N = 176)
Diabetes
(N = 81)
Non-diabetes
(N = 95)
Overall
Mean / N (%)
Chi-squa
re/tP
Age 65.22 ± 9.02 56.38 ± 3.97 60.45 ± 8.08 8.17 <.001
Marital status 1.515 .218
Married 47 (57.3) 63 (66.3) 110 (62.1)
Not married 35 (42.7) 32 (33.7) 67 (37.9)
Education 2.830 .243
≤Junior school 35 (42.7) 44 (49.4) 79 (46.2)
Senior school 18 (22.0) 11 (12.4) 29 (17.0)
Uni/Technology 29 (35.4) 34 (38.2) 63 (36.8)
Employment 16.796 <.001
Employed 20 (24.4) 52 (54.7) 72 (40.7)
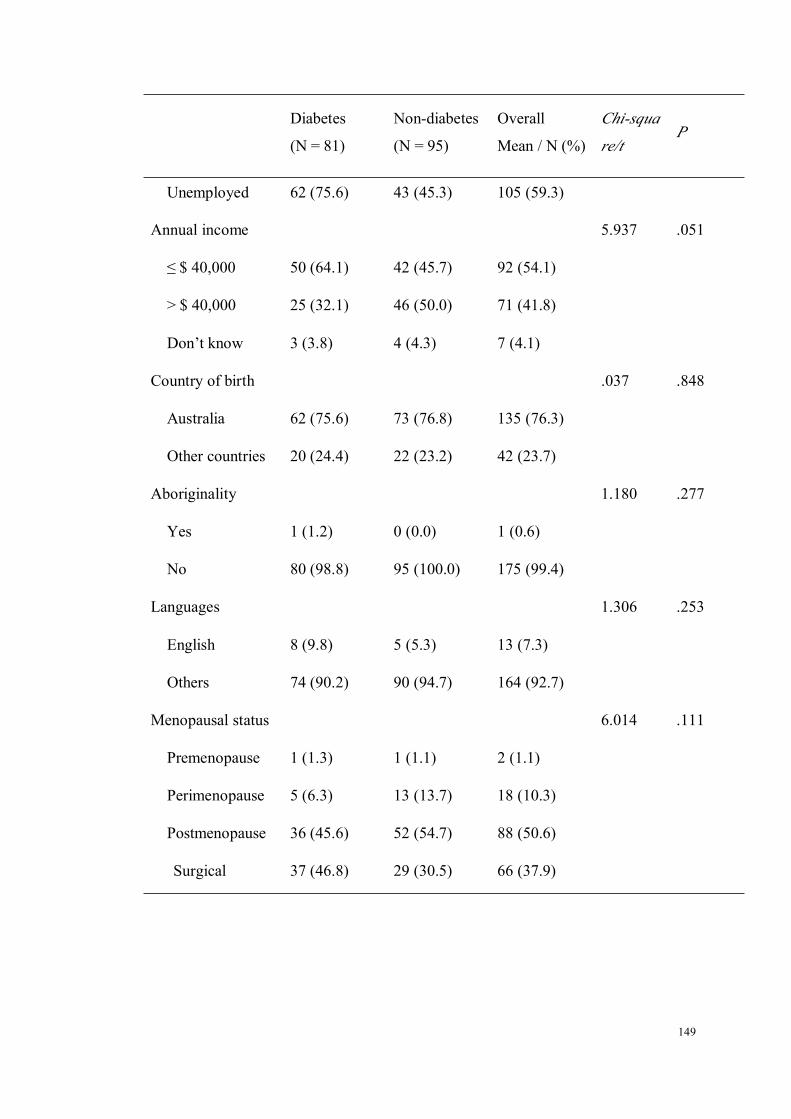
149
Diabetes
(N = 81)
Non-diabetes
(N = 95)
Overall
Mean / N (%)
Chi-squa
re/tP
Unemployed 62 (75.6) 43 (45.3) 105 (59.3)
Annual income 5.937 .051
≤ $ 40,000 50 (64.1) 42 (45.7) 92 (54.1)
> $ 40,000 25 (32.1) 46 (50.0) 71 (41.8)
Don’t know 3 (3.8) 4 (4.3) 7 (4.1)
Country of birth .037 .848
Australia 62 (75.6) 73 (76.8) 135 (76.3)
Other countries 20 (24.4) 22 (23.2) 42 (23.7)
Aboriginality 1.180 .277
Yes 1 (1.2) 0 (0.0) 1 (0.6)
No 80 (98.8) 95 (100.0) 175 (99.4)
Languages 1.306 .253
English 8 (9.8) 5 (5.3) 13 (7.3)
Others 74 (90.2) 90 (94.7) 164 (92.7)
Menopausal status 6.014 .111
Premenopause 1 (1.3) 1 (1.1) 2 (1.1)
Perimenopause 5 (6.3) 13 (13.7) 18 (10.3)
Postmenopause 36 (45.6) 52 (54.7) 88 (50.6)
Surgical 37 (46.8) 29 (30.5) 66 (37.9)
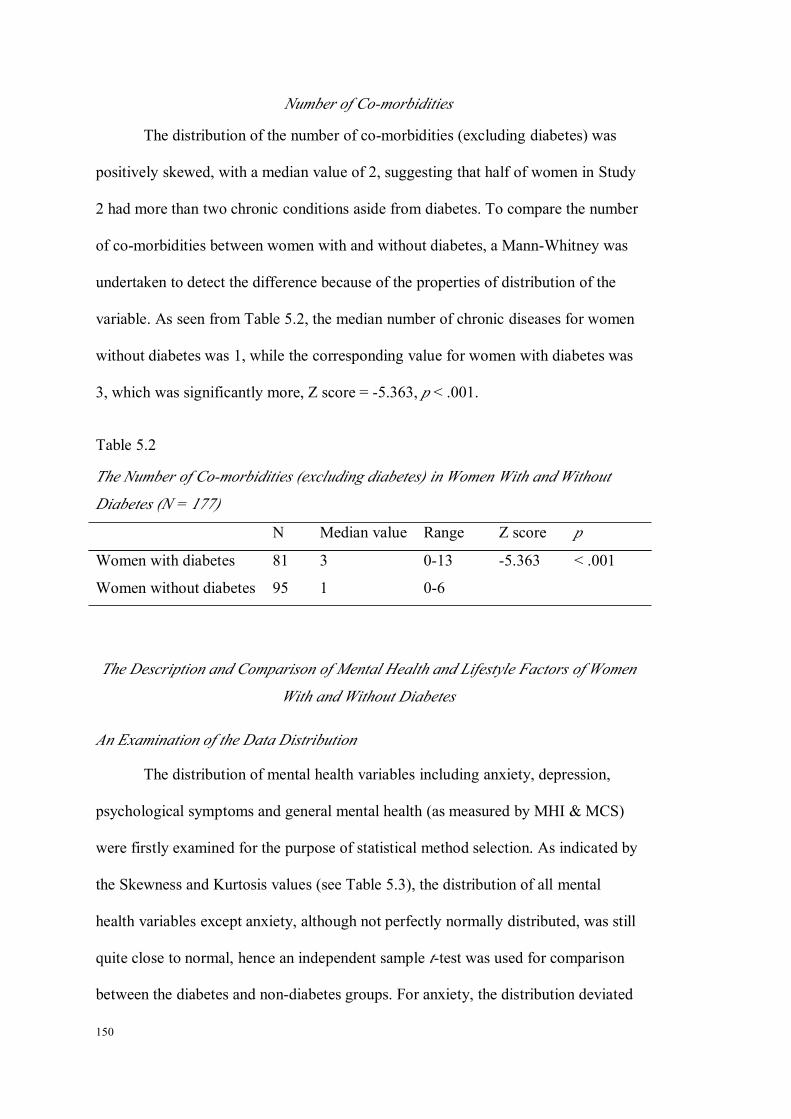
150
Number of Co-morbidities
The distribution of the number of co-morbidities (excluding diabetes) was
positively skewed, with a median value of 2, suggesting that half of women in Study
2 had more than two chronic conditions aside from diabetes. To compare the number
of co-morbidities between women with and without diabetes, a Mann-Whitney was
undertaken to detect the difference because of the properties of distribution of the
variable. As seen from Table 5.2, the median number of chronic diseases for women
without diabetes was 1, while the corresponding value for women with diabetes was
3, which was significantly more, Z score = -5.363, p < .001.
Table 5.2
The Number of Co-morbidities (excluding diabetes) in Women With and Without
Diabetes (N = 177)
N Median value Range Z score p
Women with diabetes 81 3 0-13 -5.363 < .001
Women without diabetes 95 1 0-6
The Description and Comparison of Mental Health and Lifestyle Factors of Women
With and Without Diabetes
An Examination of the Data Distribution
The distribution of mental health variables including anxiety, depression,
psychological symptoms and general mental health (as measured by MHI & MCS)
were firstly examined for the purpose of statistical method selection. As indicated by
the Skewness and Kurtosis values (see Table 5.3), the distribution of all mental
health variables except anxiety, although not perfectly normally distributed, was still
quite close to normal, hence an independent sample t-test was used for comparison
between the diabetes and non-diabetes groups. For anxiety, the distribution deviated

151
more significantly from normality than the other mental health variables. Despite
non-normal distribution of anxiety scores, an independent sample t-test was still
applied for two reasons. First, the transformation technique (square root) failed to
improve the distribution of data, and in addition it increased the difficulty of data
interpretation. Second, when both parametric (independent sample t-test) and
non-parametric analyses (Mann-Whitley) were run, it was found that the significance
levels were the same, with both being non-significant (p = .068 vs. p = .133). In short,
when compared to the crude difference of all of the mental health variables between
women with and without diabetes, an independent sample t-test was applied.
Table 5.3
The Statistics of Normality Examination of Mental Health Variables (N = 177)
Mental health variables Mean SD Skewness (SE) Kurtosis (SE)
Anxiety 3.77 2.81 1.04 (.183) 1.78 (.364)
Depression 3.27 2.51 .795 (.183) .138 (.363)
Psychological symptoms 7.02 2.86 .784 (.183) .321 (.364)
MHI 74.02 16.73 -.785 (.083) .271 (.364)
MCS 48.49 12.80 -.922 (.185) -.097 (.368)
The Difference in Mental Health Between Women With and Without Diabetes
As shown in Table 5.4, women without diabetes tended to have less severe
psychological symptoms including depression, and better general mental health
status. The anxiety score for women with diabetes was 4.19 (SD = 3.17), as
compared to 3.41 (SD = 2.43) for women without diabetes, and no significance was
indicated (p = .068). For depression, the score for women with diabetes was 3.78
(SD = 2.73), and for those without was 2.83 (SD = 2.24), t = 2.506, p = .013. The
scores of psychological symptoms were also significantly higher in women with

152
diabetes, which was mostly contributed to by elevated depression scores. The
psychological scores were 7.94 (SD = 5.39) and 6.24 (SD = 4.22) for women with
diabetes and without, respectively, t = 2.294, p = .023. In relation to measures of
general mental health, it was revealed that women with diabetes had an MHI score of
71.26 (SD = 17.73), which was 5 points lower than the score for women without
diabetes 76.38 (SD = 15.54), t = -2.041, p = .043. Yet, for MCS, no statistically
significant differences were found between the two groups, although women with
diabetes had a lower score of MCS (46.51 ± 12.90 vs. 50.01 ± 12.54), t = -1.839, p
= .068.
In short, women with a diagnosis of diabetes had more psychological
symptoms, including depression, and worse general mental health when compared to
women without diabetes. There was no difference in anxiety symptoms between
these groups.
Table 5.4
The Differences in Mental Health Between Women With and Without Diabetes (N =
177)
Diabetes N Mean SD t p
Anxiety Yes 81 4.19 3.17 1.834 .068
No 95 3.41 2.43
Depression Yes 82 3.78 2.73 2.506 .013
No 95 2.83 2.24
Psychological Yes 81 7.94 5.39 2.294 .023
No 95 6.24 4.22
MHI Yes 81 71.26 17.73 -2.041 .043
No 95 76.38 15.54
MCS Yes 77 46.51 12.90 -1.839 .068
No 95 50.01 12.54

153
The Difference in Lifestyle Factors Between Women With and Without Diabetes
Weight status
The mean BMI of women with diabetes was 33.05 (SD = 7.18), suggesting
that the majority of the women with diabetes were obese. In contrast, the mean BMI
of women without diabetes was 27.90 (SD = 6.41), which was significantly lower
than their counterparts, t = 4.968, p < .001. The WHO standard was applied to
classify women based on their BMI. It was found that only one woman was
classified as underweight (without diabetes). Therefore, when comparing the
proportions of different weight categories between women with and without diabetes,
underweight was combined into normal weight level. As seen in Table 5.5, the
proportion of women having a normal range BMI in the non-diabetes group was
36.8%, which was 5 times higher than 7.3% in the diabetes group. While for obesity,
the proportion for women with diabetes was twice as much as that of women without
diabetes, 62.2% and 33.7%, respectively. The proportions of women being
overweight were quite similar between diabetic and non-diabetic groups (30.5% vs.
29.5%). In brief, a comparative analysis showed that obesity was a more severe
problem for women with diabetes, χ² = 24.207, p < .001.
Physical activity
Physical activity was measured by three dimensions, which included general
daily activity, exercise and rating of overall physical activity. For general daily
activity, there were four categories in the questionnaire, yet due to the small number
in “very active” and “moderately active” levels, they were combined into one
category before analysis. The percentages of women doing moderate to very active
levels of daily activity was 40.7% and 66.7% for women with and without diabetes,
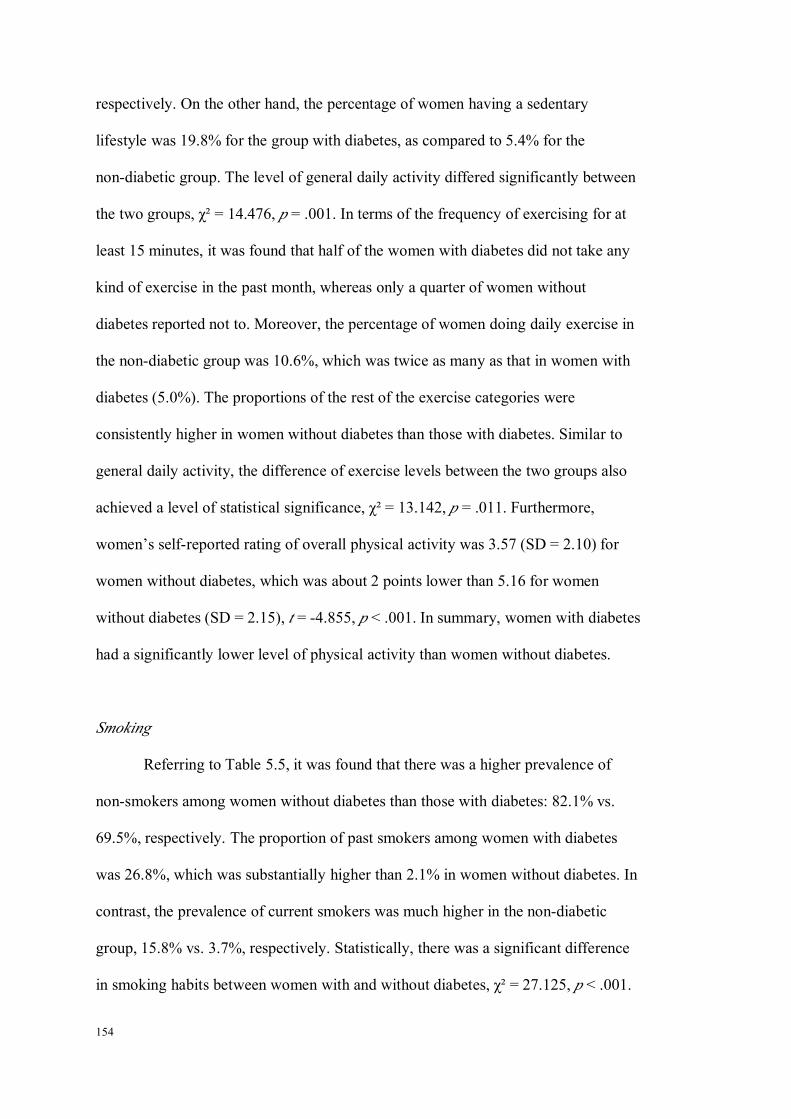
154
respectively. On the other hand, the percentage of women having a sedentary
lifestyle was 19.8% for the group with diabetes, as compared to 5.4% for the
non-diabetic group. The level of general daily activity differed significantly between
the two groups, χ² = 14.476, p = .001. In terms of the frequency of exercising for at
least 15 minutes, it was found that half of the women with diabetes did not take any
kind of exercise in the past month, whereas only a quarter of women without
diabetes reported not to. Moreover, the percentage of women doing daily exercise in
the non-diabetic group was 10.6%, which was twice as many as that in women with
diabetes (5.0%). The proportions of the rest of the exercise categories were
consistently higher in women without diabetes than those with diabetes. Similar to
general daily activity, the difference of exercise levels between the two groups also
achieved a level of statistical significance, χ² = 13.142, p = .011. Furthermore,
women’s self-reported rating of overall physical activity was 3.57 (SD = 2.10) for
women without diabetes, which was about 2 points lower than 5.16 for women
without diabetes (SD = 2.15), t = -4.855, p < .001. In summary, women with diabetes
had a significantly lower level of physical activity than women without diabetes.
Smoking
Referring to Table 5.5, it was found that there was a higher prevalence of
non-smokers among women without diabetes than those with diabetes: 82.1% vs.
69.5%, respectively. The proportion of past smokers among women with diabetes
was 26.8%, which was substantially higher than 2.1% in women without diabetes. In
contrast, the prevalence of current smokers was much higher in the non-diabetic
group, 15.8% vs. 3.7%, respectively. Statistically, there was a significant difference
in smoking habits between women with and without diabetes, χ² = 27.125, p < .001.
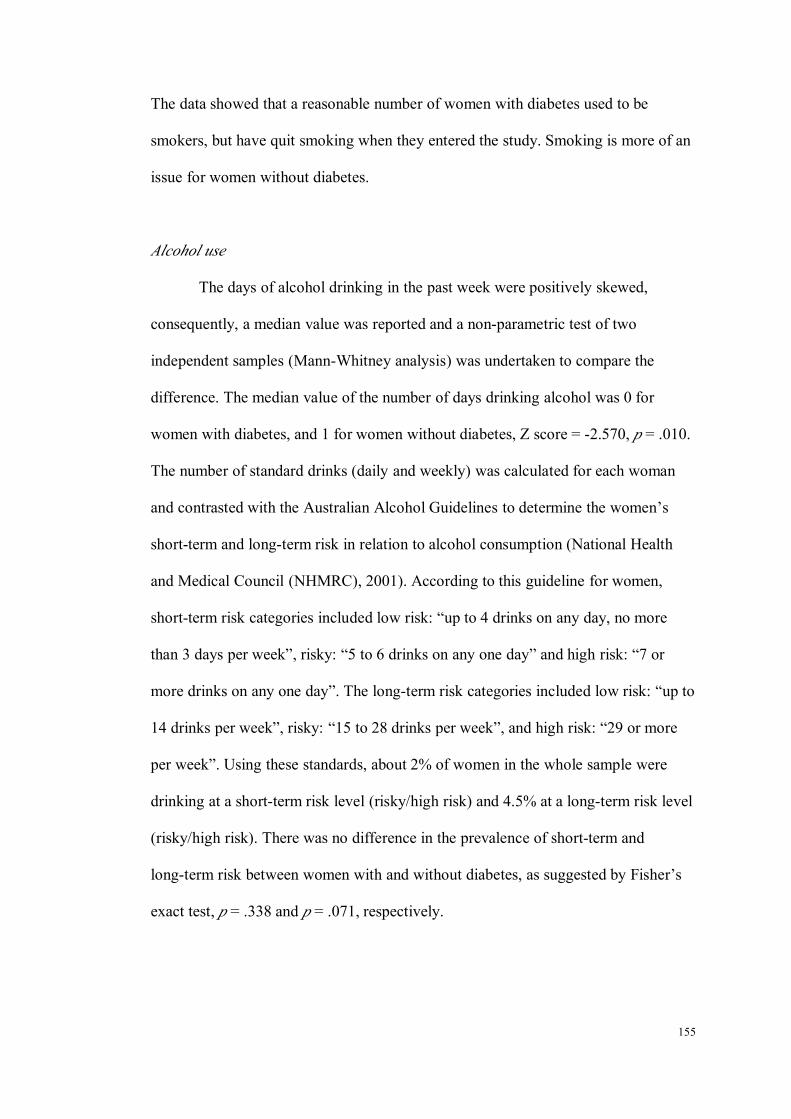
155
The data showed that a reasonable number of women with diabetes used to be
smokers, but have quit smoking when they entered the study. Smoking is more of an
issue for women without diabetes.
Alcohol use
The days of alcohol drinking in the past week were positively skewed,
consequently, a median value was reported and a non-parametric test of two
independent samples (Mann-Whitney analysis) was undertaken to compare the
difference. The median value of the number of days drinking alcohol was 0 for
women with diabetes, and 1 for women without diabetes, Z score = -2.570, p = .010.
The number of standard drinks (daily and weekly) was calculated for each woman
and contrasted with the Australian Alcohol Guidelines to determine the women’s
short-term and long-term risk in relation to alcohol consumption (National Health
and Medical Council (NHMRC), 2001). According to this guideline for women,
short-term risk categories included low risk: “up to 4 drinks on any day, no more
than 3 days per week”, risky: “5 to 6 drinks on any one day” and high risk: “7 or
more drinks on any one day”. The long-term risk categories included low risk: “up to
14 drinks per week”, risky: “15 to 28 drinks per week”, and high risk: “29 or more
per week”. Using these standards, about 2% of women in the whole sample were
drinking at a short-term risk level (risky/high risk) and 4.5% at a long-term risk level
(risky/high risk). There was no difference in the prevalence of short-term and
long-term risk between women with and without diabetes, as suggested by Fisher’s
exact test, p = .338 and p = .071, respectively.

156
Table 5.5
The Differences in Lifestyle Factors Between Women With and Without Diabetes (N
= 177)
Diabetes Test of
significance
p
Yes (N = 82) No (N = 95)
BMI (continuous) 33.05 ± 7.18 27.90 ± 6.41 4.968 < .001
BMI (categorical) 24.207 < .001
18.5-24.9 6 (7.3) 35 (36.8)
25.0-29.9 25 (30.5) 28 (29.5)
≥30.0 51(62.2) 32 (33.7)
General daily activity 14.476 .001
Very/moderate 33 (40.7) 62 (66.7)
Mild 32 (39.5) 26 (28.0)
Sedentary 16 (19.8) 5 (5.4)
Exercise 13.142 .011
Daily 4 (5.0) 10 (10.6)
5-6 times/week 8 (10.0) 12 (12.8)
3-4 times/week 15 (18.8) 22 (23.4)
1-2 times/week 13 (16.2) 27 (28.7)
None 40 (50.0) 23 (24.5)
Overall activity 3.57 ± 2.10 5.16 ± 2.15 -4.855 < .001
Smoking 27.125 < .001
Non-smokers 57 (69.5) 78 (82.1)
Past smokers 22 (26.8) 2 (2.1)
Current smoker 3 (3.7) 15 (15.8)
Alcohol -2.570 .010
Days of drinking 0 1
Short-term .338
Low risk 79 (96.3) 94 (98.8)
Risky & high risk 3 (3.7) 1 (1.1)
Long-term .071
Low risk 80 (98.8) 88 (92.6)
Risky & high risky 1 (1.2) 7 (7.4)

157
The Difference of Eight Scales and Composite Score in SF-36 Between Women With
and Without Diabetes
The transformed scores of eight SF-36 scales, as well as the two composite
scores were calculated and presented for women with and without diabetes,
separately. To ensure the accuracy of MCS scores, correlations between two
composite scores and eight scale scores were analysed as an approach to examine
potential errors (Ware, Kosinski, & Dewey, 2000). The results were displayed in
Table 5.6. The results showed that PF, RP, BP scales correlated highest with PCS
and lowest with MCS; and the MH, RE and SF correlated highest with MCS and
lowest with PCS, which was consistent with correlations described by Ware (Ware,
Kosinski, & Dewey, 2000). Therefore, it was believed that the MCS score was
measured accurately.
Table 5.6
Scoring Check: the Correlations Between Eight Scales and Composite Scores of
SF-36 (N = 172 ~ 175)
PF RP BP GH VT SF RE MH
PCS .850** .811** .820** .712** .480** .448** .096 .062
MCS .116 .300** .127 .325** .600** .622** .864** .845**
**p < .001
The difference of general mental health varied with the measurement
including MHI and MCS. As shown in Table 5.7, the MHI scores for women with
diabetes were 71.26 (SD = 17.73), which were significantly lower than 76.38 for
women without diabetes (SD = 5.54), t = -2.041, p = .043. When measured by MCS,
the mental health score for women with diabetes was 46.51 (SD = 12.90), and the
corresponding scores for women without diabetes were 50.09 (SD = 12.54), yet no
158
statistical significance was achieved, t = -1.839, p = .068. For the rest of the seven
scales and PCS, women with diabetes consistently showed a lower score than
women without diabetes. All the differences were of statistical significance.
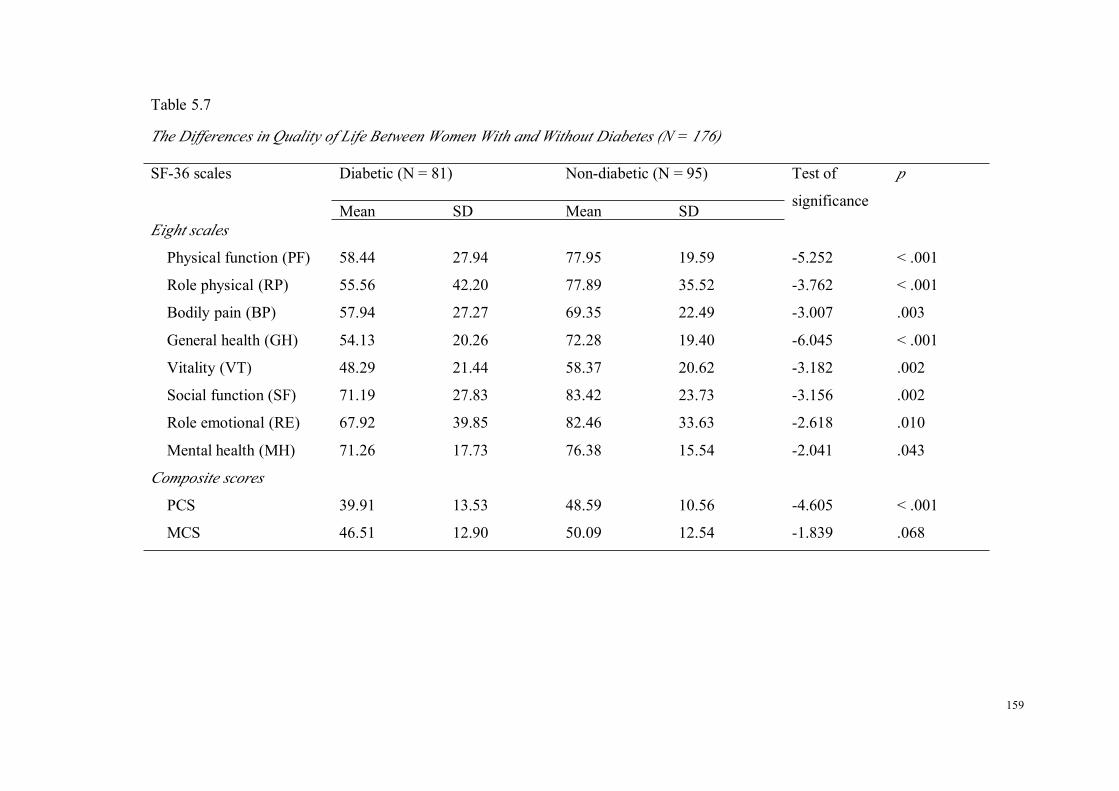
159
Table 5.7
The Differences in Quality of Life Between Women With and Without Diabetes (N = 176)
SF-36 scales Diabetic (N = 81) Non-diabetic (N = 95) Test of
significance
p
Mean SD Mean SDEight scales
Physical function (PF) 58.44 27.94 77.95 19.59 -5.252 < .001
Role physical (RP) 55.56 42.20 77.89 35.52 -3.762 < .001
Bodily pain (BP) 57.94 27.27 69.35 22.49 -3.007 .003
General health (GH) 54.13 20.26 72.28 19.40 -6.045 < .001
Vitality (VT) 48.29 21.44 58.37 20.62 -3.182 .002
Social function (SF) 71.19 27.83 83.42 23.73 -3.156 .002
Role emotional (RE) 67.92 39.85 82.46 33.63 -2.618 .010
Mental health (MH) 71.26 17.73 76.38 15.54 -2.041 .043
Composite scores
PCS 39.91 13.53 48.59 10.56 -4.605 < .001
MCS 46.51 12.90 50.09 12.54 -1.839 .068

160
The Binary Analysis Between Independent Variables and Dependent Variables
Before conducting regression analysis of the relationships between lifestyle
factors and mental health, binary correlations between independent variables
including lifestyle factors and diabetes and dependent variables, which were five
mental health measurements, were undertaken. The correlations between
confounding variables including sociodemographic factors, number of
co-morbidities and menopausal status, and the dependent variables related to mental
health status were also analysed. This step provided a crude description of the
associations between dependent variables and independent and confounding
variables. Significant variables were further examined in hierarchical regression
models.
Sociodemographic Factors and Mental Health
The associations between sociodemographic factors and five mental health
measurements were analysed first. A Pearson correlation was carried out to assess
the relationships between age and mental health variables, and results showed no
correlation between age and any of the five mental health variables. For other
dichotomous sociodemographic factors including marital status, employment,
country of birth and language spoken at home, an independent sample t-test was run.
Similarly to the results for age, no difference in mental health was seen in relation to
these sociodemographic factors. Lastly, a one-way ANOVA analysis was undertaken
for variables of annual income and education, which both had more than two
categories. Again, no statistical difference was found in relation to mental health.
The significant levels of the above tests were displayed in Table 5.8. It was found
that there was no correlation between sociodemographic factors and mental health
among midlife and older women with diabetes.
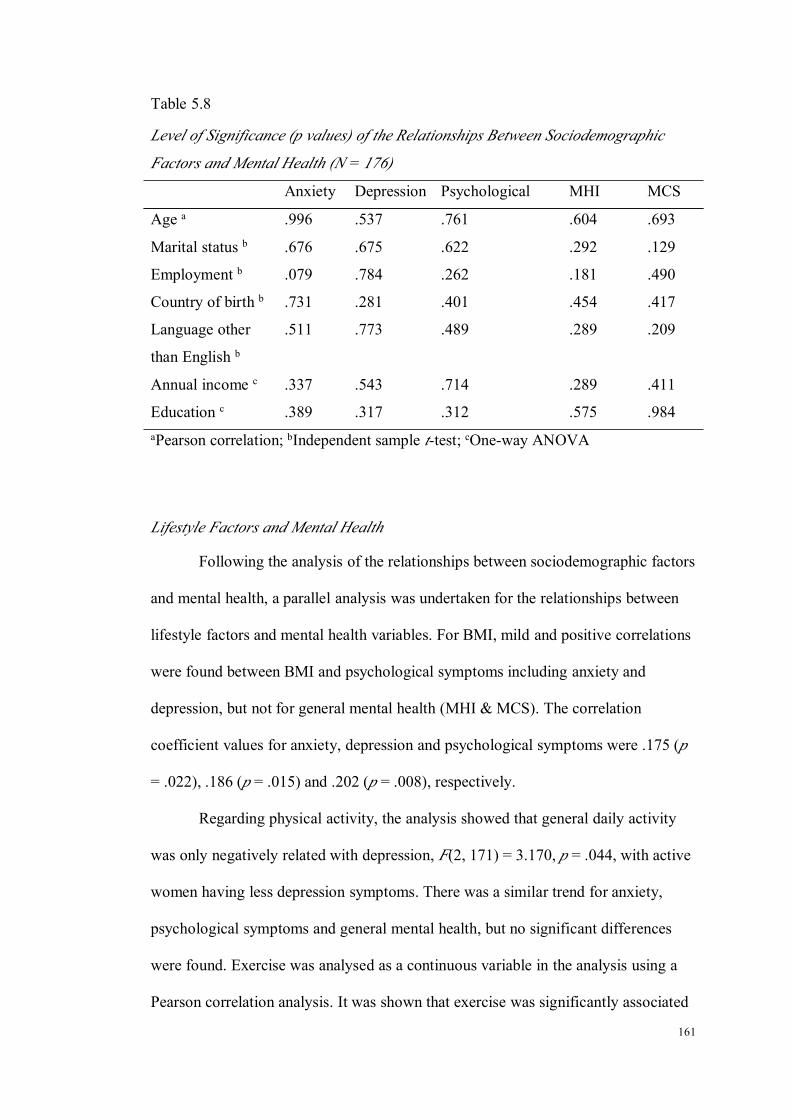
161
Table 5.8
Level of Significance (p values) of the Relationships Between Sociodemographic
Factors and Mental Health (N = 176)
Anxiety Depression Psychological MHI MCS
Age a .996 .537 .761 .604 .693
Marital status b .676 .675 .622 .292 .129
Employment b .079 .784 .262 .181 .490
Country of birth b .731 .281 .401 .454 .417
Language other
than English b
.511 .773 .489 .289 .209
Annual income c .337 .543 .714 .289 .411
Education c .389 .317 .312 .575 .984aPearson correlation; bIndependent sample t-test; cOne-way ANOVA
Lifestyle Factors and Mental Health
Following the analysis of the relationships between sociodemographic factors
and mental health, a parallel analysis was undertaken for the relationships between
lifestyle factors and mental health variables. For BMI, mild and positive correlations
were found between BMI and psychological symptoms including anxiety and
depression, but not for general mental health (MHI & MCS). The correlation
coefficient values for anxiety, depression and psychological symptoms were .175 (p
= .022), .186 (p = .015) and .202 (p = .008), respectively.
Regarding physical activity, the analysis showed that general daily activity
was only negatively related with depression, F(2, 171) = 3.170, p = .044, with active
women having less depression symptoms. There was a similar trend for anxiety,
psychological symptoms and general mental health, but no significant differences
were found. Exercise was analysed as a continuous variable in the analysis using a
Pearson correlation analysis. It was shown that exercise was significantly associated
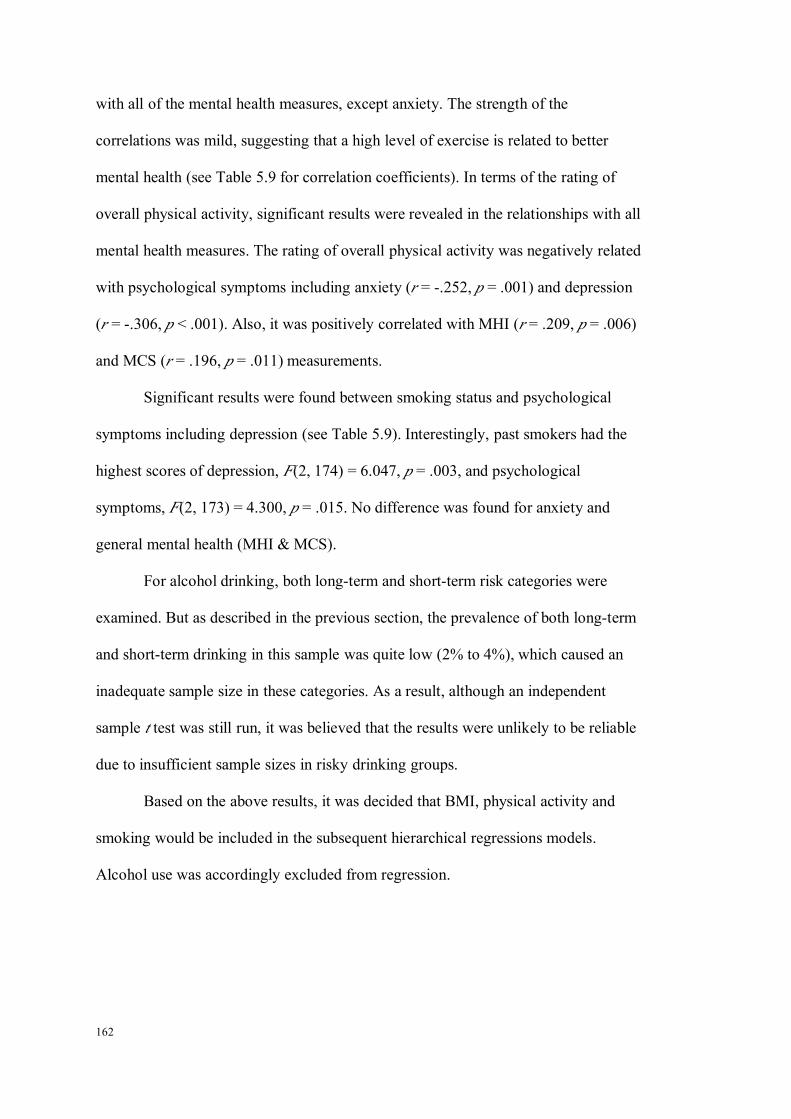
162
with all of the mental health measures, except anxiety. The strength of the
correlations was mild, suggesting that a high level of exercise is related to better
mental health (see Table 5.9 for correlation coefficients). In terms of the rating of
overall physical activity, significant results were revealed in the relationships with all
mental health measures. The rating of overall physical activity was negatively related
with psychological symptoms including anxiety (r = -.252, p = .001) and depression
(r = -.306, p < .001). Also, it was positively correlated with MHI (r = .209, p = .006)
and MCS (r = .196, p = .011) measurements.
Significant results were found between smoking status and psychological
symptoms including depression (see Table 5.9). Interestingly, past smokers had the
highest scores of depression, F(2, 174) = 6.047, p = .003, and psychological
symptoms, F(2, 173) = 4.300, p = .015. No difference was found for anxiety and
general mental health (MHI & MCS).
For alcohol drinking, both long-term and short-term risk categories were
examined. But as described in the previous section, the prevalence of both long-term
and short-term drinking in this sample was quite low (2% to 4%), which caused an
inadequate sample size in these categories. As a result, although an independent
sample t test was still run, it was believed that the results were unlikely to be reliable
due to insufficient sample sizes in risky drinking groups.
Based on the above results, it was decided that BMI, physical activity and
smoking would be included in the subsequent hierarchical regressions models.
Alcohol use was accordingly excluded from regression.

163
Table 5.9
The Relationships Between Lifestyle Factors and Mental Health Variables (N = 170 ~ 177)
GCS-Anxiety GCS-Depression GCS-P MHI MCS
BMI .175* .186 * .202 ** -.128 -.061
General physical activity
Very & moderate 3.46 ± 2.72 2.80 ± 2.40* 6.26 ± 4.72 76.00 ± 16.99 50.02 ± 12.87
Mild 3.98 ± 3.09 3.78 ± 2.57 7.72 ± 5.05 72.55 ± 16.96 47.07 ± 12.99
Sedentary 4.38 ± 2.46 3.67 ± 2.56 8.04 ± 4.61 69.20 ± 15.31 45.10 ± 12.25
Exercise .118 .234** .187 * -.205 ** -.194 *
Overall rating -.252*** -.306*** -.304*** .209** .196*
Smoking
Non-smokers 3.67 ± 2.88 2.96 ± 2.45** 6.63 ± 4.84* 74.55 ± 17.13 49.09 ± 12.89
Past 4.96 ± 2.80 4.83 ± 2.78 9.74 ± 4.74 71.50± 16.86 44.36 ± 12.34
Current 3.00 ± 1.85 3.50 ± 2.64 6.50 ± 4.16 73.41 ± 13.63 49.15 ± 12.30
Alcohol short-term
Low risk 3.71 ± 2.78 3.34 ± 2.52 6.93 ± 4.82 74.33 ± 16.67 48.71 ± 12.75
Risky & high risk 6.25 ± 3.30 4.75 ± 2.22 11.00 ± 5.29 61.00 ± 16.12 39.33 ± 12.94
Alcohol short-term
Low risk 3.74 ± 2.80 3.28 ± 2.53 6.98 ± 4.85 74.48 ± 16.80 48.50 ± 12.85
Risky & high risk 4.13 ± 3.36 3.00 ± 2.20 7.13 ± 5.25 73.50 ± 15.26 49.63 ± 12.60
*p < .05; **p < .01; ***p < .001

164
Table 5.10
The Correlations Between Number of Co-morbidities, Menopausal Status and Mental Health Variables (N = 168 ~ 176)
Anxiety Depression Psychological MHI MCS
# of co-morbidities .383*** .443*** .452*** -.276*** -.193*
Menopausal status
Premenopause 3.50 ± 3.54 4.50 ± 3.54 8.00 ± 7.07 70.00 ± 31.11 44.83 ± 15.75
Perimenopause 3.72 ± 2.54 2.89 ± 1.97 6.61 ± 3.97 77.33± 14.58 51.71 ± 10.84
Postmenopause 3.61 ± 2.86 3.01± 2.39 6.63 ± 4.81 73.79± 17.16 47.86 ± 13.50
Surgical menopause 4.03 ± 2.89 3.68 ± 2.79 7.68 ± 5.18 73.76± 16.46 48.87 ± 12.70
*p < .05; ***p < .001
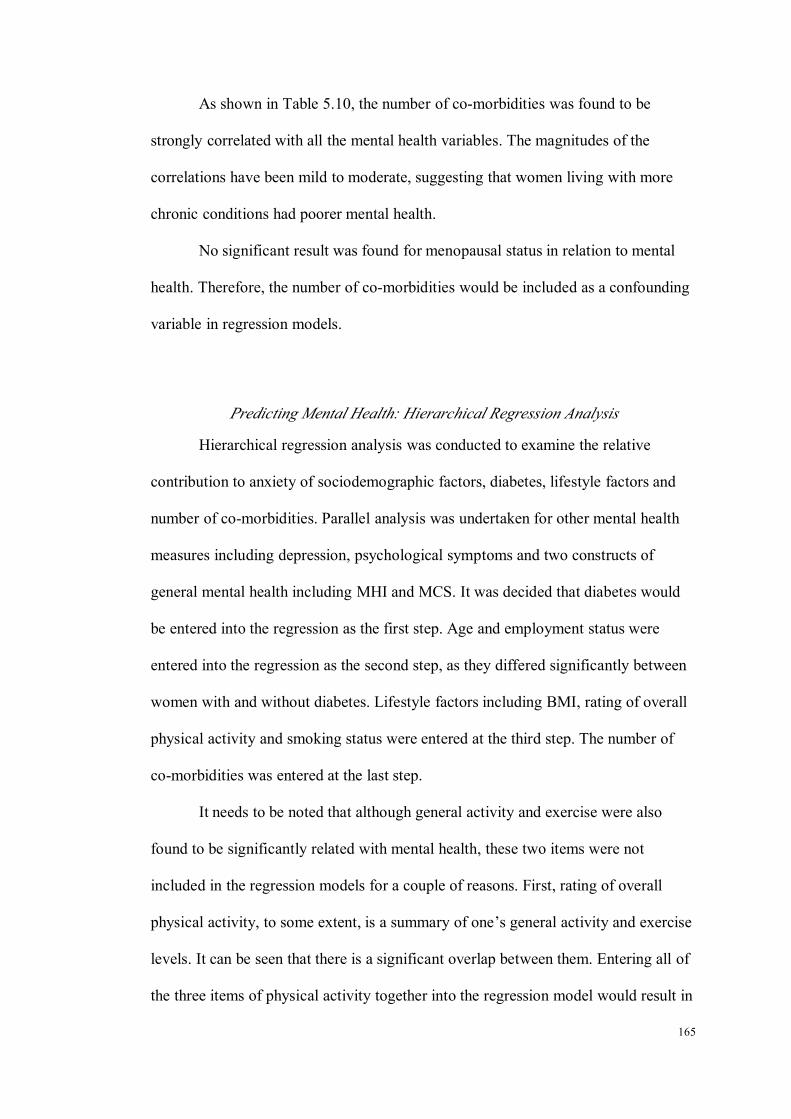
165
As shown in Table 5.10, the number of co-morbidities was found to be
strongly correlated with all the mental health variables. The magnitudes of the
correlations have been mild to moderate, suggesting that women living with more
chronic conditions had poorer mental health.
No significant result was found for menopausal status in relation to mental
health. Therefore, the number of co-morbidities would be included as a confounding
variable in regression models.
Predicting Mental Health: Hierarchical Regression Analysis
Hierarchical regression analysis was conducted to examine the relative
contribution to anxiety of sociodemographic factors, diabetes, lifestyle factors and
number of co-morbidities. Parallel analysis was undertaken for other mental health
measures including depression, psychological symptoms and two constructs of
general mental health including MHI and MCS. It was decided that diabetes would
be entered into the regression as the first step. Age and employment status were
entered into the regression as the second step, as they differed significantly between
women with and without diabetes. Lifestyle factors including BMI, rating of overall
physical activity and smoking status were entered at the third step. The number of
co-morbidities was entered at the last step.
It needs to be noted that although general activity and exercise were also
found to be significantly related with mental health, these two items were not
included in the regression models for a couple of reasons. First, rating of overall
physical activity, to some extent, is a summary of one’s general activity and exercise
levels. It can be seen that there is a significant overlap between them. Entering all of
the three items of physical activity together into the regression model would result in
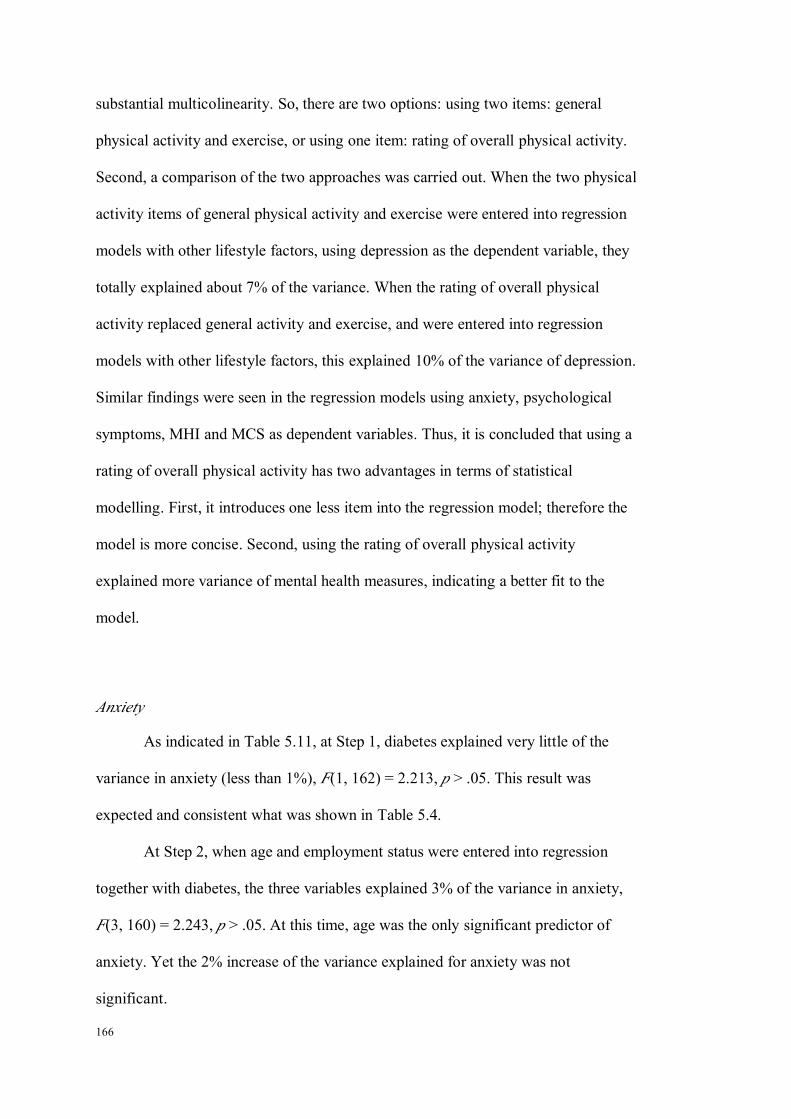
166
substantial multicolinearity. So, there are two options: using two items: general
physical activity and exercise, or using one item: rating of overall physical activity.
Second, a comparison of the two approaches was carried out. When the two physical
activity items of general physical activity and exercise were entered into regression
models with other lifestyle factors, using depression as the dependent variable, they
totally explained about 7% of the variance. When the rating of overall physical
activity replaced general activity and exercise, and were entered into regression
models with other lifestyle factors, this explained 10% of the variance of depression.
Similar findings were seen in the regression models using anxiety, psychological
symptoms, MHI and MCS as dependent variables. Thus, it is concluded that using a
rating of overall physical activity has two advantages in terms of statistical
modelling. First, it introduces one less item into the regression model; therefore the
model is more concise. Second, using the rating of overall physical activity
explained more variance of mental health measures, indicating a better fit to the
model.
Anxiety
As indicated in Table 5.11, at Step 1, diabetes explained very little of the
variance in anxiety (less than 1%), F(1, 162) = 2.213, p > .05. This result was
expected and consistent what was shown in Table 5.4.
At Step 2, when age and employment status were entered into regression
together with diabetes, the three variables explained 3% of the variance in anxiety,
F(3, 160) = 2.243, p > .05. At this time, age was the only significant predictor of
anxiety. Yet the 2% increase of the variance explained for anxiety was not
significant.
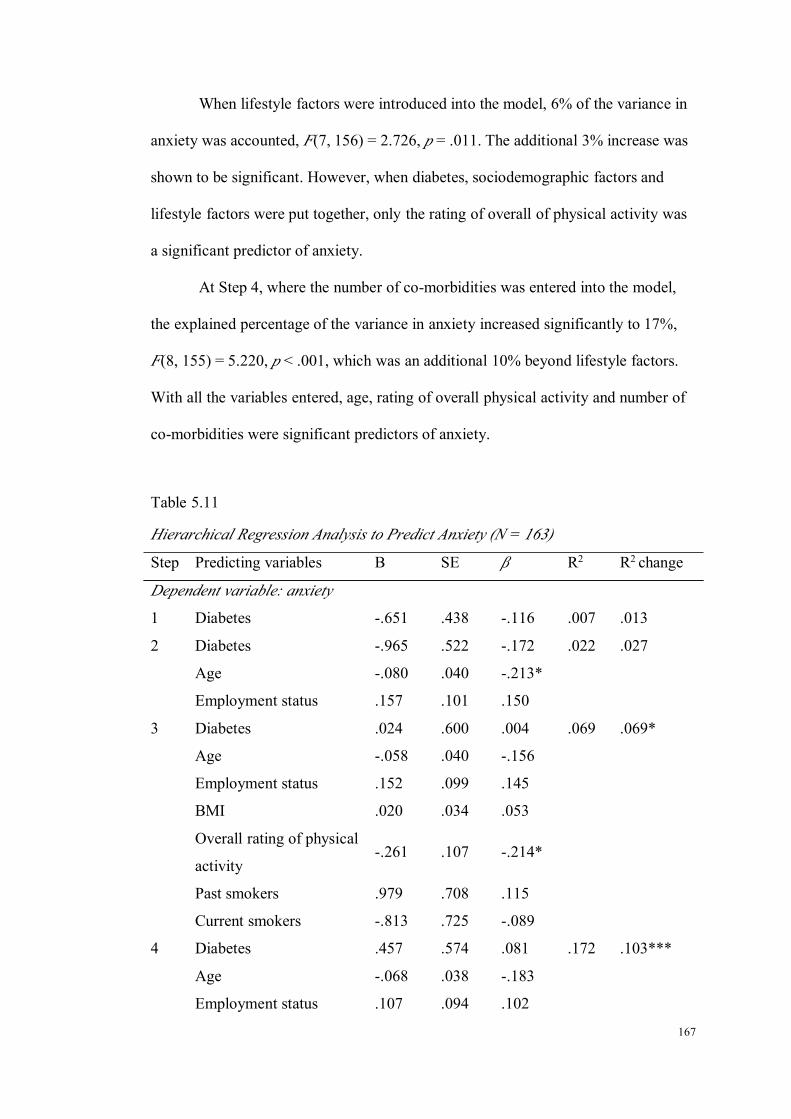
167
When lifestyle factors were introduced into the model, 6% of the variance in
anxiety was accounted, F(7, 156) = 2.726, p = .011. The additional 3% increase was
shown to be significant. However, when diabetes, sociodemographic factors and
lifestyle factors were put together, only the rating of overall of physical activity was
a significant predictor of anxiety.
At Step 4, where the number of co-morbidities was entered into the model,
the explained percentage of the variance in anxiety increased significantly to 17%,
F(8, 155) = 5.220, p < .001, which was an additional 10% beyond lifestyle factors.
With all the variables entered, age, rating of overall physical activity and number of
co-morbidities were significant predictors of anxiety.
Table 5.11
Hierarchical Regression Analysis to Predict Anxiety (N = 163)
Step Predicting variables B SE β R2 R2 change
Dependent variable: anxiety
1 Diabetes -.651 .438 -.116 .007 .013
2 Diabetes -.965 .522 -.172 .022 .027
Age -.080 .040 -.213*
Employment status .157 .101 .150
3 Diabetes .024 .600 .004 .069 .069*
Age -.058 .040 -.156
Employment status .152 .099 .145
BMI .020 .034 .053
Overall rating of physical
activity-.261 .107 -.214*
Past smokers .979 .708 .115
Current smokers -.813 .725 -.089
4 Diabetes .457 .574 .081 .172 .103***
Age -.068 .038 -.183
Employment status .107 .094 .102
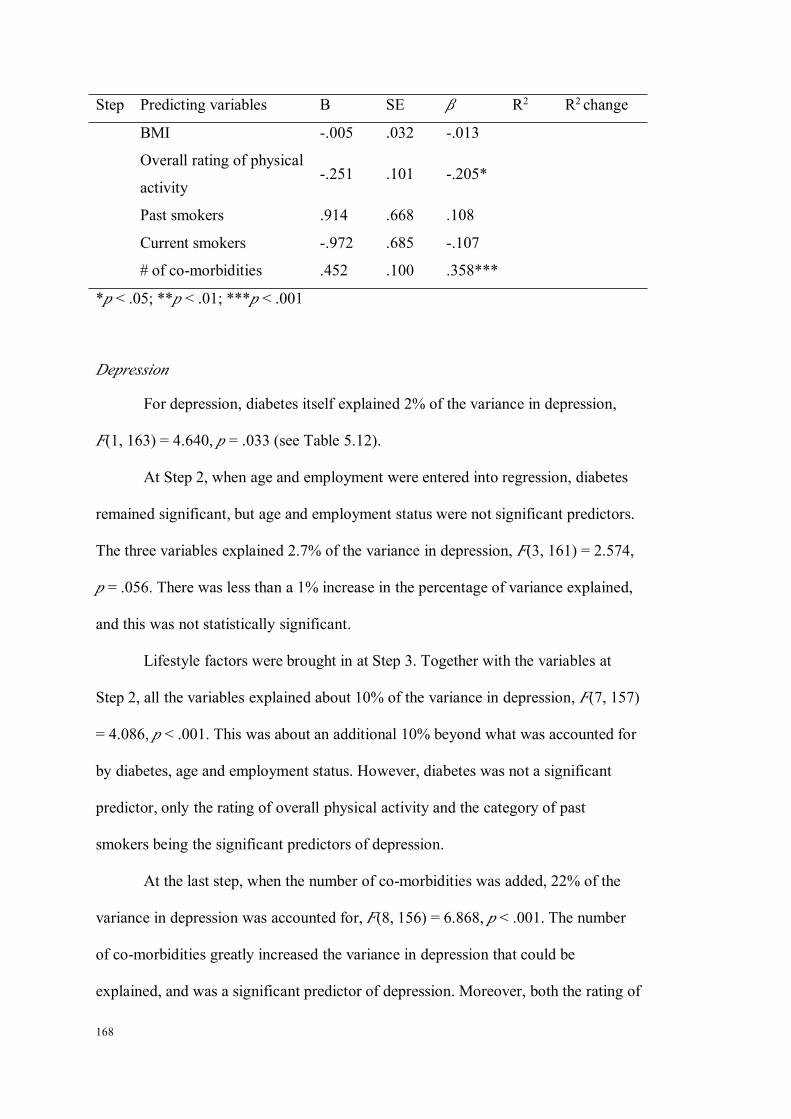
168
Step Predicting variables B SE β R2 R2 change
BMI -.005 .032 -.013
Overall rating of physical
activity-.251 .101 -.205*
Past smokers .914 .668 .108
Current smokers -.972 .685 -.107
# of co-morbidities .452 .100 .358***
*p < .05; **p < .01; ***p < .001
Depression
For depression, diabetes itself explained 2% of the variance in depression,
F(1, 163) = 4.640, p = .033 (see Table 5.12).
At Step 2, when age and employment were entered into regression, diabetes
remained significant, but age and employment status were not significant predictors.
The three variables explained 2.7% of the variance in depression, F(3, 161) = 2.574,
p = .056. There was less than a 1% increase in the percentage of variance explained,
and this was not statistically significant.
Lifestyle factors were brought in at Step 3. Together with the variables at
Step 2, all the variables explained about 10% of the variance in depression, F(7, 157)
= 4.086, p < .001. This was about an additional 10% beyond what was accounted for
by diabetes, age and employment status. However, diabetes was not a significant
predictor, only the rating of overall physical activity and the category of past
smokers being the significant predictors of depression.
At the last step, when the number of co-morbidities was added, 22% of the
variance in depression was accounted for, F(8, 156) = 6.868, p < .001. The number
of co-morbidities greatly increased the variance in depression that could be
explained, and was a significant predictor of depression. Moreover, both the rating of

169
overall physical activity and being a past smoker remained significant predictors in
the model.
Table 5.12
Hierarchical Regression Analysis to Predict Depression (N = 164)
Step Predicting variables B SE β R2 R2 change
Dependent variable: depression
1 Diabetes -.822 .381 -.166* .022 .028*
2 Diabetes -1.267 .458 -.257** .028 .018
Age -.045 .035 -.136
Employment status -.036 .089 -.039
3 Diabetes -.316 .515 -.064 .116 .108***
Age -.023 .034 -.068
Employment status -.039 .085 -.042
BMI .010 .029 .030
Overall rating of physical
activity-.252 .092 -.233**
Past smoker 1.592 .596 .217**
Current smoker .467 .622 .058
4 Diabetes .069 .490 .014 .223 .106***
Age -.032 .032 -.096
Employment status -.078 .080 -.085
BMI -.013 .027 -.038
Overall rating of physical
activity-.243 .086 -.225**
Past smokers 1.552 .559 .211**
Current smokers .324 .585 .040
# of co-morbidities .405 .085 .363***
*p < .05; **p < .01; ***p < .001
170
Psychological Symptoms
Similar to anxiety, the results showed that diabetes explained little variance
in psychological symptoms (1.7%), F(1,162) = 3.760, p = .054.
When age and employment status were entered, diabetes became a significant
factor. These three variables explained 2.5% of the variance in psychological
symptoms, F(3, 160) = 2.395, p = .070, but the increase was not statistically
significant, as indicated by Table 5.13.
At Step 3, lifestyle factors were added into the model and all the variables
explained 8% of the variance in psychological symptoms, F(7, 156) = 3.604, p
= .001. This was a considerable increase from Step 2. In addition, the significance of
diabetes disappeared at this step, but rating of overall physical activity and past
smokers became significant predictors.
When the number of co-morbidities were put into the model, all the variables
explained 23% of the variance in psychological symptoms, F(8, 155) = 7.089, p
< .001. There was an additional 10% increase on the basis of lifestyle factors. When
all the variables were combined together, the rating of overall physical activity, past
smokers and number of co-morbidities remained significant predictors of
psychological symptoms.

171
Table 5.13
Hierarchical Regression Analysis to Predict Psychological Symptoms (N = 163)
Step Predicting variables B SE Β R2 R2 change
Dependent variable: psychological symptoms
1 Diabetes -1.439 .742 -.151 .017 .023
2 Diabetes -2.199 .889 -.230* .025 .020
Age -.123 .067 -.193
Employment status .115 .173 .064
3 Diabetes -.280 1.005 -.029 .101 .096**
Age -.080 .066 -.126
Employment status .109 .166 .061
BMI .032 .056 .050
Overall rating of physical
activity-.512 .179 -.246**
Past smoker 2.494 1.186 .172*
Current smoker -.343 1.214 -.022
4 Diabetes .543 .943 .057 .230 .129***
Age -.099 .062 -.155
Employment status .023 .154 .013
BMI -.015 .053 -.023
Overall rating of physical
activity-.493 .166 -.237**
Past smokers 2.370 1.097 .164*
Current smokers -.646 1.125 -.042
# of co-morbidities .859 .165 .399***
*p < .05; **p < .01; ***p < .001
General Mental Health: the Mental Health Inventory
As shown in Table 5.14, at Step 1 of the regression, diabetes was not
associated with MHI scores, and only explained 1% of variance in MHI scores, F(1,
162) = 2.822, p = .095.
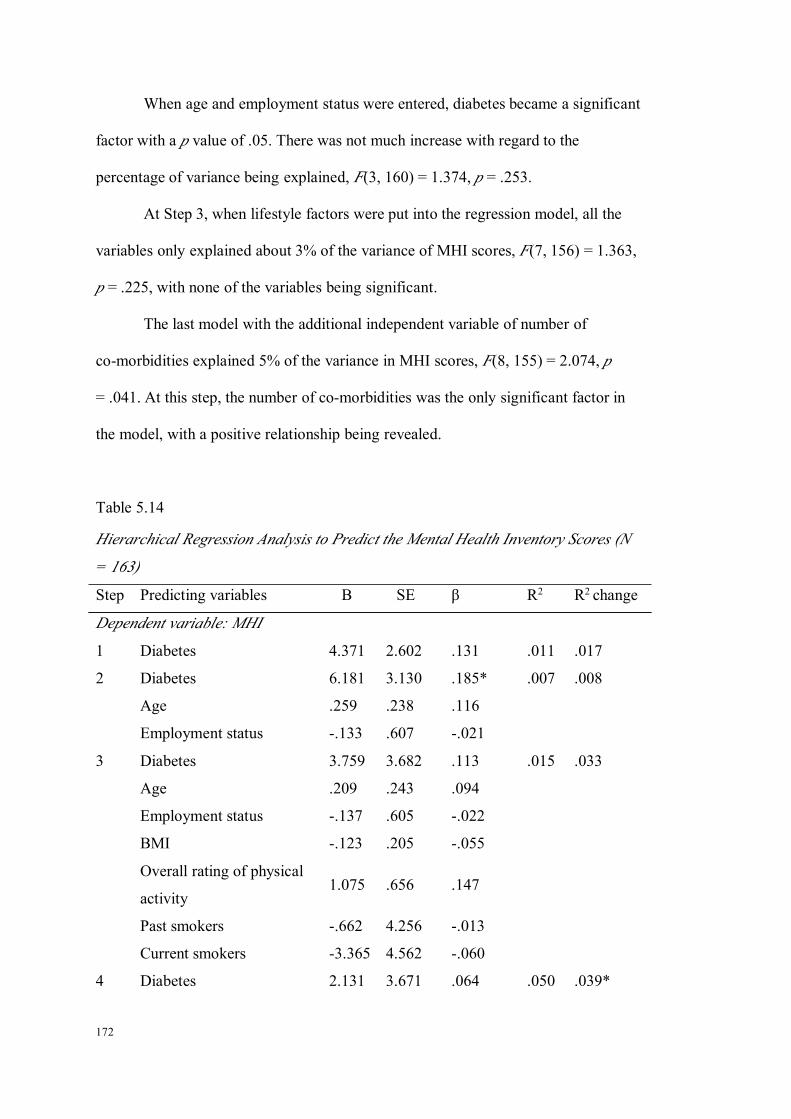
172
When age and employment status were entered, diabetes became a significant
factor with a p value of .05. There was not much increase with regard to the
percentage of variance being explained, F(3, 160) = 1.374, p = .253.
At Step 3, when lifestyle factors were put into the regression model, all the
variables only explained about 3% of the variance of MHI scores, F(7, 156) = 1.363,
p = .225, with none of the variables being significant.
The last model with the additional independent variable of number of
co-morbidities explained 5% of the variance in MHI scores, F(8, 155) = 2.074, p
= .041. At this step, the number of co-morbidities was the only significant factor in
the model, with a positive relationship being revealed.
Table 5.14
Hierarchical Regression Analysis to Predict the Mental Health Inventory Scores (N
= 163)
Step Predicting variables B SE β R2 R2 change
Dependent variable: MHI
1 Diabetes 4.371 2.602 .131 .011 .017
2 Diabetes 6.181 3.130 .185* .007 .008
Age .259 .238 .116
Employment status -.133 .607 -.021
3 Diabetes 3.759 3.682 .113 .015 .033
Age .209 .243 .094
Employment status -.137 .605 -.022
BMI -.123 .205 -.055
Overall rating of physical
activity1.075 .656 .147
Past smokers -.662 4.256 -.013
Current smokers -3.365 4.562 -.060
4 Diabetes 2.131 3.671 .064 .050 .039*

173
Step Predicting variables B SE β R2 R2 change
Age .247 .239 .110
Employment status .029 .598 .005
BMI -.030 .204 -.013
Overall rating of physical
activity1.031 .645 .141
Past smokers -.539 4.181 -.011
Current smokers -2.588 4.491 -.046
# of co-morbidities -1.658 .640 -.220*
*p < .05; **p < .01; ***p < .001
General Mental Health: the Mental Composite Scores
The MCS score was explained poorly by the variables in Study 2. As can be
seen from Table 5.15, all of the variables explained about 1% of the variance of
general mental health as measured by the MCS. None of the lifestyle factors was of
statistical significance in relation to MCS. Even the overall rating of physical activity
and the number of co-morbidities became non-significant.

174
Table 5.15
Hierarchical Regression Analysis to Predict the Mental Composite Scores (N = 159)
Step Predicting variables B SE β R2 R2 change
Dependent variable: MCS
1 Diabetes 2.362 2.024 .092 .002 .009
2 Diabetes 3.592 2.424 .141 -.005 .006
Age .107 .185 .062
Employment status .177 .472 .037
3 Diabetes 1.649 2.845 .065 .001 .031
Age .078 .188 .045
Employment status .186 .471 .039
BMI .063 .160 .037
Overall rating of physical
activity.945 .507 .170
Past smokers -2.919 3.407 -.075
Current smokers -.489 3.501 -.012
4 Diabetes .797 2.883 .031 .011 .015
Age .098 .188 .057
Employment status .279 .473 .059
BMI .105 .161 .061
Overall rating of physical
activity.929 .505 .167
Past smokers -2.946 3.390 -.076
Current smokers -.126 3.491 -.003
# of co-morbidities -.799 .507 -.140
*p < .05; **p < .01; ***p < .001

175
Reflection on Research Questions
1) What is the difference in mental health between women with and without
diabetes, without consideration of lifestyle factors?
Women with diabetes presented more psychological symptoms
including depression and a lower level of general mental health when
compared to women without diabetes. In other words, women with diabetes
have lower levels of mental health than those without.
2) What are the contributing factors to the difference in mental health between
women with and without diabetes?
After controlling for lifestyle factors, there was no difference in
mental health between women with and without diabetes. The previously
identified difference in mental health between women with and without
diabetes groups was not related with diabetes itself, but with a lower level of
physical activity, being a past-smoker and the number of co-morbidities those
women with diabetes present.

176
177
CHAPTER 6 RESULTS OF STUDY 3: ANALYSIS OF THE MEDIATION OF
SELF-EFFICACY IN THE RELATIONSHIPS BETWEEN LIEFSTYLE
FACTORS AND MENTAL HEALTH IN MIDLIFE AND OLDER WOMEN
WITH DIABETES
Introduction
Self-efficacy was the central concept in social cognitive theory, and believed
to be essential in guiding behaviour changes. The multimodal intervention used in
the WWP study is based on social cognitive theory, and has been shown to be
effective in improving the lifestyles for midlife and older women from the general
community. The purpose of Study 3 was to examine the mediating effect of
self-efficacy in the relationships between lifestyle factors and mental health. In the
context of the current research study, if self-efficacy mediates the relationships,
concerted effect should be devoted to enhance individuals’ self-efficacy and lead to
desired outcomes. Study 3 has the potential to generate knowledge that might be
useful for developing effective interventions for mental health improvement.
The baseline data of women who participated in the CDWWP project (N =
83) was utilised in Study 3. A cross-sectional design was adopted. The variables in
Study 3 were sociodemographic factors, lifestyle factors, mental health, self-efficacy
and other confounders including duration of diabetes, use of antidepressants, number
of co-morbidities and menopausal status. The sampling procedure and results of
recruitment were depicted in Figure 6.1.
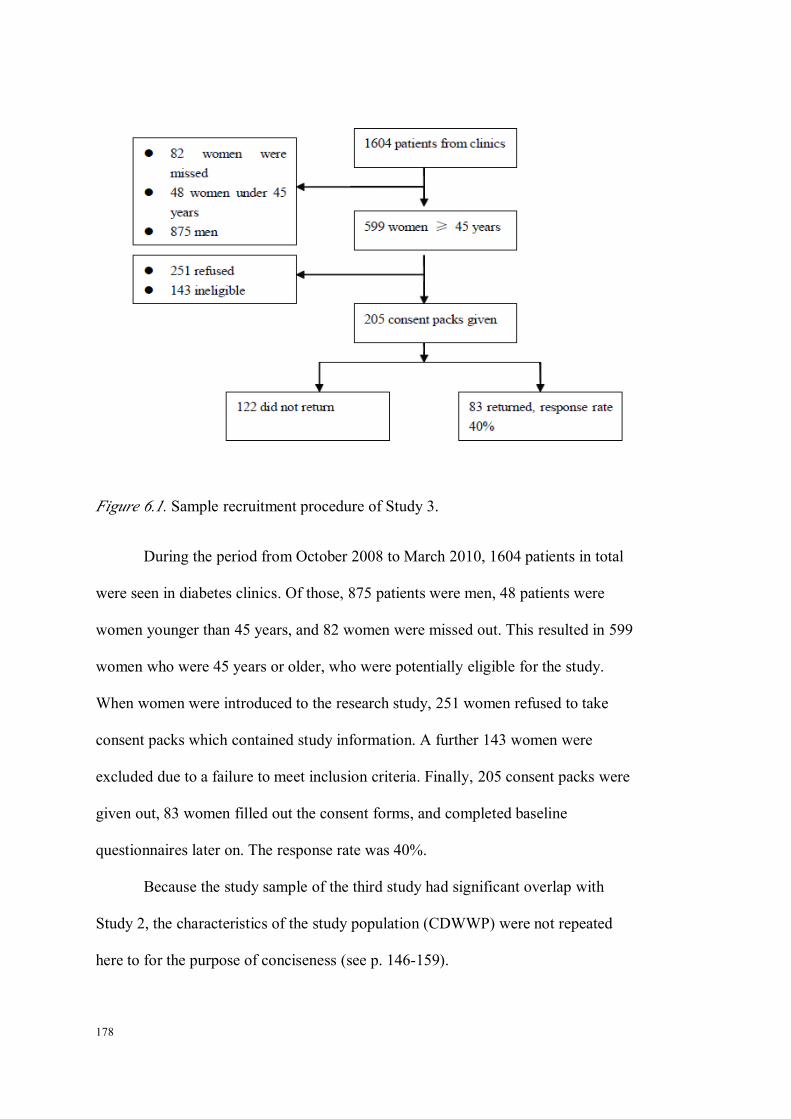
178
Figure 6.1. Sample recruitment procedure of Study 3.
During the period from October 2008 to March 2010, 1604 patients in total
were seen in diabetes clinics. Of those, 875 patients were men, 48 patients were
women younger than 45 years, and 82 women were missed out. This resulted in 599
women who were 45 years or older, who were potentially eligible for the study.
When women were introduced to the research study, 251 women refused to take
consent packs which contained study information. A further 143 women were
excluded due to a failure to meet inclusion criteria. Finally, 205 consent packs were
given out, 83 women filled out the consent forms, and completed baseline
questionnaires later on. The response rate was 40%.
Because the study sample of the third study had significant overlap with
Study 2, the characteristics of the study population (CDWWP) were not repeated
here to for the purpose of conciseness (see p. 146-159).

179
Results of Study 3
The Correlations Between Mental Health and Lifestyle Factors
This step of analysis was to find out the correlations between mental health
and lifestyle factors (Path c). Based on Baron and Kenny’s principles, this initial step
was undertaken to determine the significant correlations between mental health and
lifestyle factors, in other words, to establish whether there is a correlation that can be
mediated.
As shown in Table 6.1, BMI was found to be significantly and positively
correlated with depression, r = .275, p = .014, suggesting that higher BMI values
were related with higher depression scores. Apart from depression, no correlations
were identified between BMI and anxiety and general mental health. The rating of
overall physical activity was negatively and strongly correlated with depression, r =
-.284, p = .013, but not with anxiety and general mental health. The independent
sample t-test failed to detect any significant difference in mental health between
women who drank and did not drink in the preceding week. For smoking status, a
significant difference in general mental health (MCS) was found. Interestingly,
women who were current smokers had higher MCS scores (58.10 ± 3.16) than those
who were not current smokers (46.34 ± 13.00), p = .003. However, it needs to be
noted that only three women were current smokers, thus, the results may not be
reliable due to the low statistical power.
To sum up, this step of analysis found two significant correlations between
mental health and lifestyle factors, that is a correlation of depression with BMI and
the rating of overall physical activity. Thus, the mediating effect of self-efficacy was
tested in these two correlations.
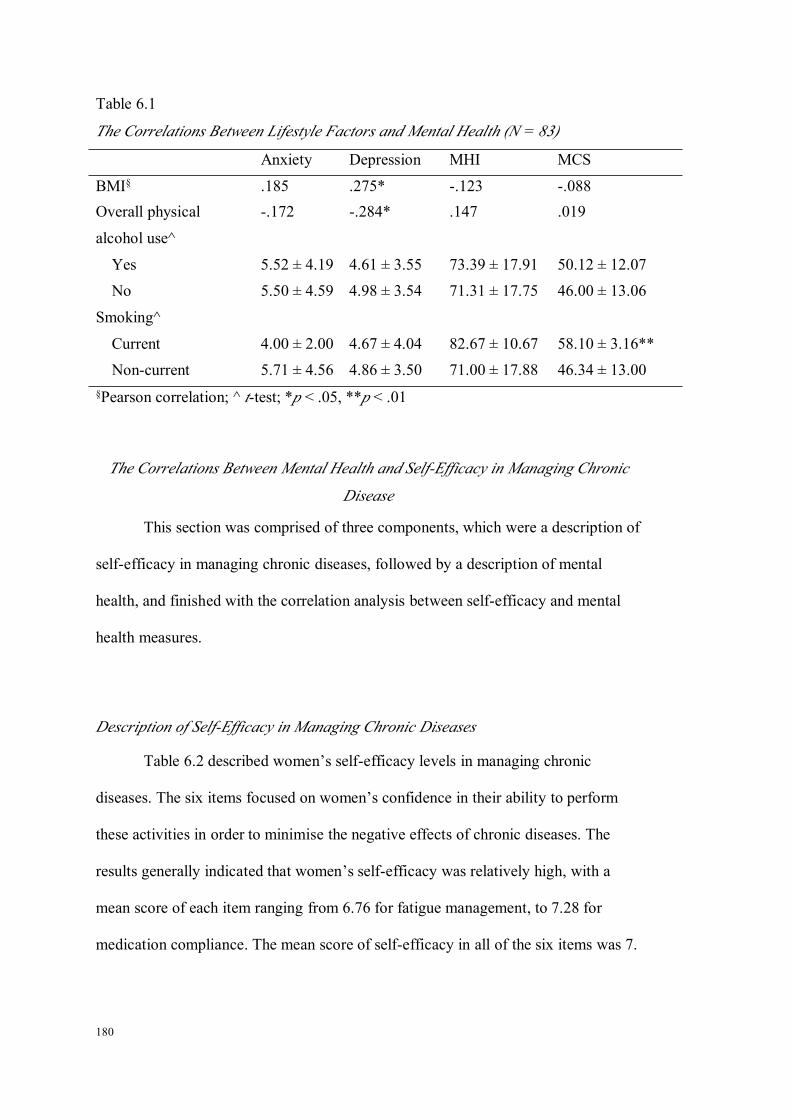
180
Table 6.1
The Correlations Between Lifestyle Factors and Mental Health (N = 83)
Anxiety Depression MHI MCS
BMI§ .185 .275* -.123 -.088Overall physical -.172 -.284* .147 .019
alcohol use^
Yes 5.52 ± 4.19 4.61 ± 3.55 73.39 ± 17.91 50.12 ± 12.07
No 5.50 ± 4.59 4.98 ± 3.54 71.31 ± 17.75 46.00 ± 13.06
Smoking^
Current 4.00 ± 2.00 4.67 ± 4.04 82.67 ± 10.67 58.10 ± 3.16**
Non-current 5.71 ± 4.56 4.86 ± 3.50 71.00 ± 17.88 46.34 ± 13.00§Pearson correlation; ^ t-test; *p < .05, **p < .01
The Correlations Between Mental Health and Self-Efficacy in Managing Chronic
Disease
This section was comprised of three components, which were a description of
self-efficacy in managing chronic diseases, followed by a description of mental
health, and finished with the correlation analysis between self-efficacy and mental
health measures.
Description of Self-Efficacy in Managing Chronic Diseases
Table 6.2 described women’s self-efficacy levels in managing chronic
diseases. The six items focused on women’s confidence in their ability to perform
these activities in order to minimise the negative effects of chronic diseases. The
results generally indicated that women’s self-efficacy was relatively high, with a
mean score of each item ranging from 6.76 for fatigue management, to 7.28 for
medication compliance. The mean score of self-efficacy in all of the six items was 7.
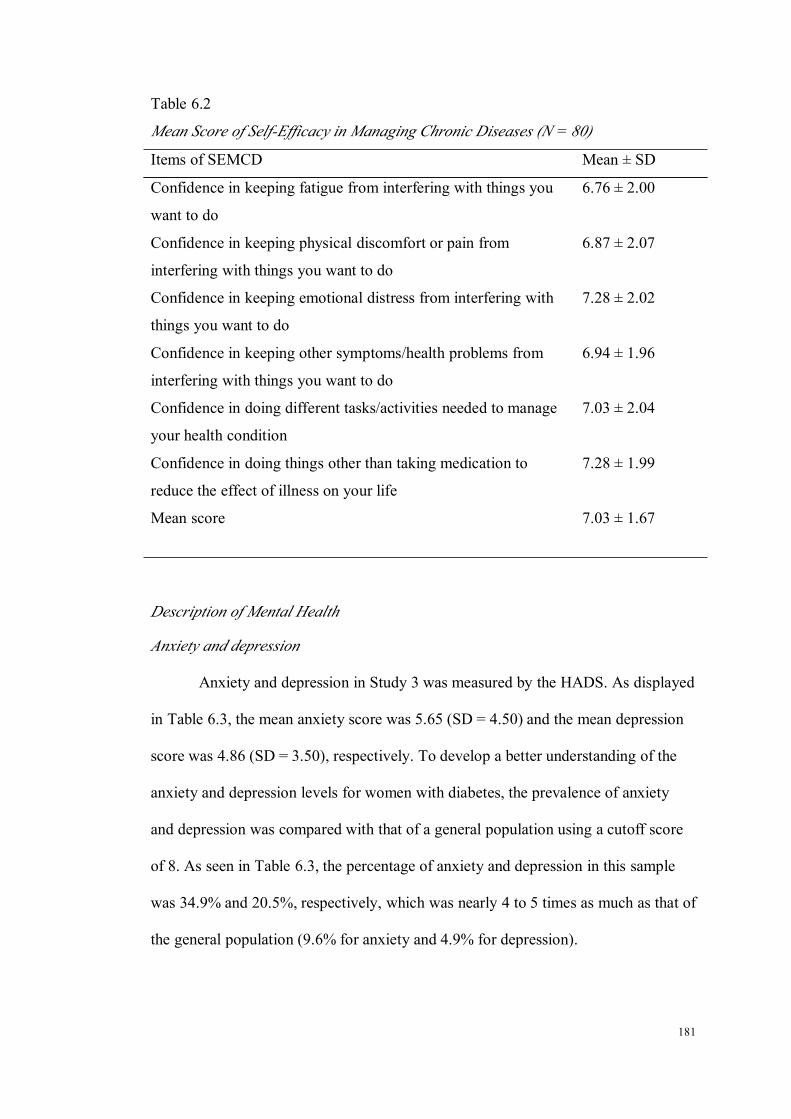
181
Table 6.2
Mean Score of Self-Efficacy in Managing Chronic Diseases (N = 80)
Items of SEMCD Mean ± SD
Confidence in keeping fatigue from interfering with things you
want to do
6.76 ± 2.00
Confidence in keeping physical discomfort or pain from
interfering with things you want to do
6.87 ± 2.07
Confidence in keeping emotional distress from interfering with
things you want to do
7.28 ± 2.02
Confidence in keeping other symptoms/health problems from
interfering with things you want to do
6.94 ± 1.96
Confidence in doing different tasks/activities needed to manage
your health condition
7.03 ± 2.04
Confidence in doing things other than taking medication to
reduce the effect of illness on your life
7.28 ± 1.99
Mean score 7.03 ± 1.67
Description of Mental Health
Anxiety and depression
Anxiety and depression in Study 3 was measured by the HADS. As displayed
in Table 6.3, the mean anxiety score was 5.65 (SD = 4.50) and the mean depression
score was 4.86 (SD = 3.50), respectively. To develop a better understanding of the
anxiety and depression levels for women with diabetes, the prevalence of anxiety
and depression was compared with that of a general population using a cutoff score
of 8. As seen in Table 6.3, the percentage of anxiety and depression in this sample
was 34.9% and 20.5%, respectively, which was nearly 4 to 5 times as much as that of
the general population (9.6% for anxiety and 4.9% for depression).
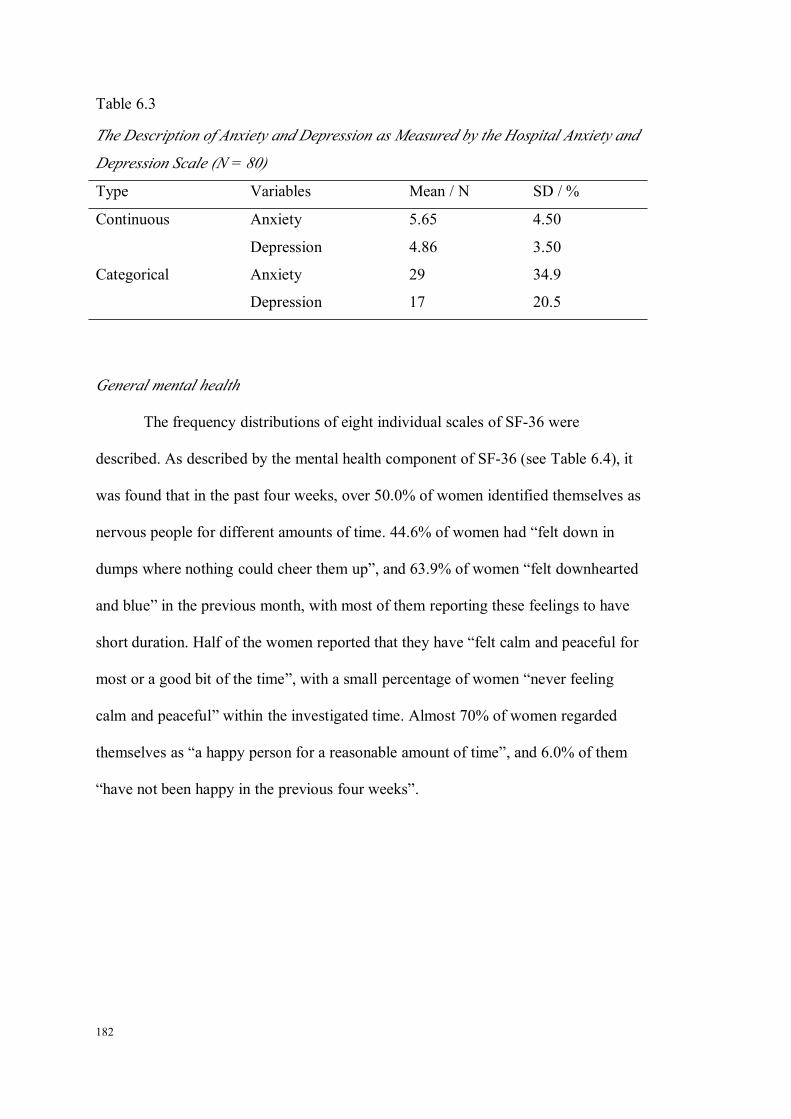
182
Table 6.3
The Description of Anxiety and Depression as Measured by the Hospital Anxiety and
Depression Scale (N = 80)
Type Variables Mean / N SD / %
Continuous Anxiety 5.65 4.50
Depression 4.86 3.50
Categorical Anxiety 29 34.9
Depression 17 20.5
General mental health
The frequency distributions of eight individual scales of SF-36 were
described. As described by the mental health component of SF-36 (see Table 6.4), it
was found that in the past four weeks, over 50.0% of women identified themselves as
nervous people for different amounts of time. 44.6% of women had “felt down in
dumps where nothing could cheer them up”, and 63.9% of women “felt downhearted
and blue” in the previous month, with most of them reporting these feelings to have
short duration. Half of the women reported that they have “felt calm and peaceful for
most or a good bit of the time”, with a small percentage of women “never feeling
calm and peaceful” within the investigated time. Almost 70% of women regarded
themselves as “a happy person for a reasonable amount of time”, and 6.0% of them
“have not been happy in the previous four weeks”.
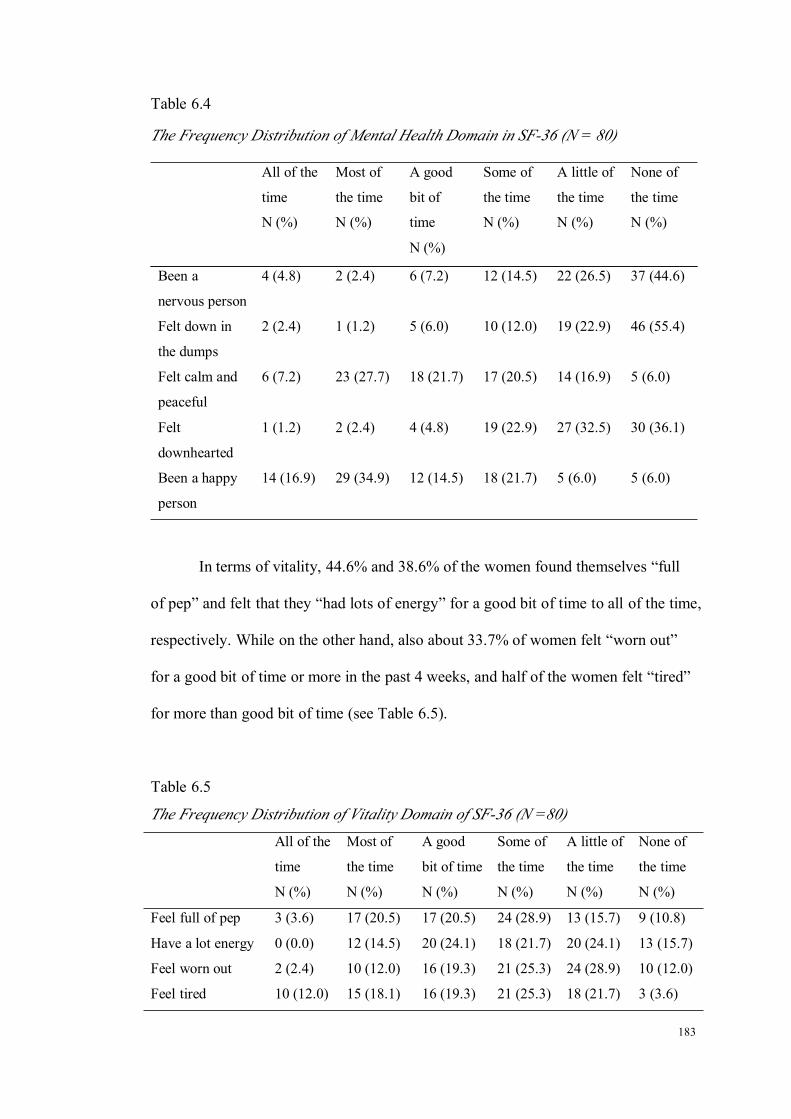
183
Table 6.4
The Frequency Distribution of Mental Health Domain in SF-36 (N = 80)
All of the
time
N (%)
Most of
the time
N (%)
A good
bit of
time
N (%)
Some of
the time
N (%)
A little of
the time
N (%)
None of
the time
N (%)
Been a
nervous person
4 (4.8) 2 (2.4) 6 (7.2) 12 (14.5) 22 (26.5) 37 (44.6)
Felt down in
the dumps
2 (2.4) 1 (1.2) 5 (6.0) 10 (12.0) 19 (22.9) 46 (55.4)
Felt calm and
peaceful
6 (7.2) 23 (27.7) 18 (21.7) 17 (20.5) 14 (16.9) 5 (6.0)
Felt
downhearted
1 (1.2) 2 (2.4) 4 (4.8) 19 (22.9) 27 (32.5) 30 (36.1)
Been a happy
person
14 (16.9) 29 (34.9) 12 (14.5) 18 (21.7) 5 (6.0) 5 (6.0)
In terms of vitality, 44.6% and 38.6% of the women found themselves “full
of pep” and felt that they “had lots of energy” for a good bit of time to all of the time,
respectively. While on the other hand, also about 33.7% of women felt “worn out”
for a good bit of time or more in the past 4 weeks, and half of the women felt “tired”
for more than good bit of time (see Table 6.5).
Table 6.5
The Frequency Distribution of Vitality Domain of SF-36 (N =80)
All of the
time
N (%)
Most of
the time
N (%)
A good
bit of time
N (%)
Some of
the time
N (%)
A little of
the time
N (%)
None of
the time
N (%)
Feel full of pep 3 (3.6) 17 (20.5) 17 (20.5) 24 (28.9) 13 (15.7) 9 (10.8)
Have a lot energy 0 (0.0) 12 (14.5) 20 (24.1) 18 (21.7) 20 (24.1) 13 (15.7)
Feel worn out 2 (2.4) 10 (12.0) 16 (19.3) 21 (25.3) 24 (28.9) 10 (12.0)
Feel tired 10 (12.0) 15 (18.1) 16 (19.3) 21 (25.3) 18 (21.7) 3 (3.6)

184
Two items were applied to investigate the effect of physical and emotional
health on women’s social activity. As indicated in Table 6.6, more than half of the
women found their social activities were interfered with, with 21.7% being slightly
impacted, 18.1% moderately, 15.7% quite a bit, and 1.2% extremely. Likewise, more
than 50% of women reported social activities were affected for various time
durations, with 16.9% reporting a little of the time, 21.7% some of the time, 14.5%
most of the time, and 4.8% for all of the time.
Table 6.6
The Frequency Distribution of Social Function of SF-36 (N = 83)
Not at all Slightly Moderately Quite a
bit
Extremely
To what extent
social activities
were affected
36 (43.4) 18 (21.7) 15 (18.1) 13 (15.7) 1 (1.2)
All of the
time
Most of
the time
Some of
the time
A little of
the time
None of
the time
How much time
social activities
were affected
4 (4.8) 12 (14.5) 18 (21.7) 14 (16.9) 35 (42.2)
The extent to which women were affected by emotional problem was
described in Table 6.7. Specifically, 25.9% of women had to cut down time on work
or activities due emotional distress, 37.0% of women accomplished less than they
liked, and 29.3% of women did not work as carefully as usual.

185
Table 6.7
The Frequency Distribution of Role Emotional of SF-36 (N = 83)
Yes No
Cut down time on work or activities 21 (25.9) 60 (74.1)
Accomplish less than you would like 30 (37.0) 51 (63.0)
Did not work as carefully as usual 24 (29.3) 58 (70.7)
For physical functioning, it was found that 60% of the women reported that
their vigorous activity was limited a lot because of health conditions; while only
about 20% of the women claimed that moderate activity was affected so. Half of the
women had no difficulty in carrying groceries due to their health, and the percentage
was similar regarding to climbing one flight of stairs. About one third of the women
reported that their health condition significantly limited bending/kneeling, walking
more than a mile or several blocks. In addition, 66.7% to 88.9% of women were not
affected in relation to self-bathing or dressing, and walking one block (see Table
6.8).
Table 6.8
The Frequency Distribution of Physical Function of SF-36 (N = 83)
Yes, limited a
lot
Yes, limited
a little
No, not
limited at all
Limits imposed on vigorous activity 50 (61.7) 25 (30.9) 6 (7.4)
Limits imposed on moderate activity 16 (19.8) 34 (42.0) 31 (38.3)
Limits imposed on carrying groceries 13 (16.0) 33 (40.7) 35 (43.2)
Limits imposed on several flights of
stairs
26 (32.1) 29 (35.8) 26 (32.1)
Limits imposed on one flight of stairs 12 (14.8) 26 (32.1) 43 (53.1)
Limits imposed on bending or
kneeling
23 (28.4) 38 (46.9) 20 (24.7)

186
Yes, limited a
lot
Yes, limited
a little
No, not
limited at all
Limits imposed on walking more than
a mile
26 (31.7) 27 (32.9) 29 (35.4)
Limits imposed on walking several
blocks
23 (28.4) 26 (32.1) 32 (39.5)
Limits imposed on walking one block 9 (11.1) 18 (22.2) 54 (66.7)
Limits imposed on bathing or dressing 2 (2.5) 7 (8.6) 72 (88.9)
The effects of physical health on women’s work and other activities were
presented in Table 6.9. It can be seen that 28% of women had to cut down the
amount of time that they spent on work and other activities in the past four weeks.
Moreover, approximately half of the women accomplished less, had been limited in
the kind of work they do, and/or had difficulty in performing the work or other
activities because of health issues.
Table 6.9
The Frequency Distribution of Role Physical of SF-36 (N = 83)
Yes No
Cut down the time you spent on work or other activities 23 (28.0) 59 (72.0)
Accomplished less than you would like 43 (52.4) 39 (47.6)
Were limited in the kind of work or other activities 37 (45.1) 45 (54.9)
Had difficulty performing the work or other activities 37 (44.6) 45 (54.9)
Regarding the severity of pain women had during the past four weeks, about
half of the women experienced pain at moderate to very severe levels, with 30% of
them reporting having moderate pain. The effect of pain on women’s work was not
as bad as the pain they experienced. It was found that over 80% of women reported
be non-affected or mildly affected (see Table 6.10).
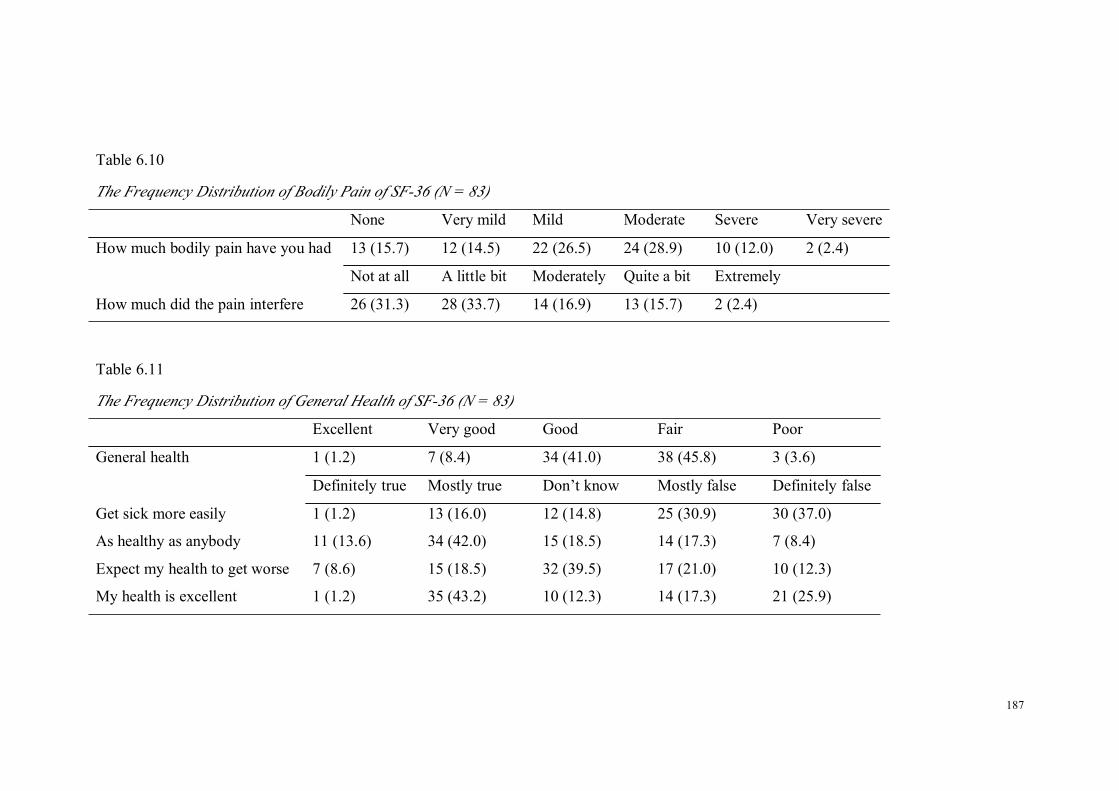
187
Table 6.10
The Frequency Distribution of Bodily Pain of SF-36 (N = 83)
None Very mild Mild Moderate Severe Very severe
How much bodily pain have you had 13 (15.7) 12 (14.5) 22 (26.5) 24 (28.9) 10 (12.0) 2 (2.4)
Not at all A little bit Moderately Quite a bit Extremely
How much did the pain interfere 26 (31.3) 28 (33.7) 14 (16.9) 13 (15.7) 2 (2.4)
Table 6.11
The Frequency Distribution of General Health of SF-36 (N = 83)
Excellent Very good Good Fair Poor
General health 1 (1.2) 7 (8.4) 34 (41.0) 38 (45.8) 3 (3.6)
Definitely true Mostly true Don’t know Mostly false Definitely false
Get sick more easily 1 (1.2) 13 (16.0) 12 (14.8) 25 (30.9) 30 (37.0)
As healthy as anybody 11 (13.6) 34 (42.0) 15 (18.5) 14 (17.3) 7 (8.4)
Expect my health to get worse 7 (8.6) 15 (18.5) 32 (39.5) 17 (21.0) 10 (12.3)
My health is excellent 1 (1.2) 35 (43.2) 10 (12.3) 14 (17.3) 21 (25.9)
188
When women were asked to rate their general heath, half of them reported
their general health condition was good to excellent, and 45.8% of women rated their
health as fair (see Table 6.11). Four additional items were asked to assess women’s
general health. The results showed that 17% of women thought they got sick more
easily than other people, and about 70% of the women did not agree with this
statement. In addition, 25% of women believed that their health was deteriorating.
Last, about half of the women agreed that their health was excellent, and about half
of them disagreed.
After the presentation of frequency tables for eight scales in SF-36, the two
composite scores of SF-36 were calculated. Furthermore, a scoring check suggested
by Ware and colleagues (2000) was undertaken. The correlations between the eight
scales of SF-36, and two composite scores were displayed in Table 6.12. Similar to
the results in Study 2, it showed that PCS had the highest correlations with PF, RP
and BP, but lowest correlations with SF, RE and MH. In contrast, MCS correlated
highest with SF, RE and MH, but lowest with PF, RP and BP. The PCS and MCS
correlations with GH and VT were both moderate. These results provided evidence
that the scoring of the composite scores have been accurate.
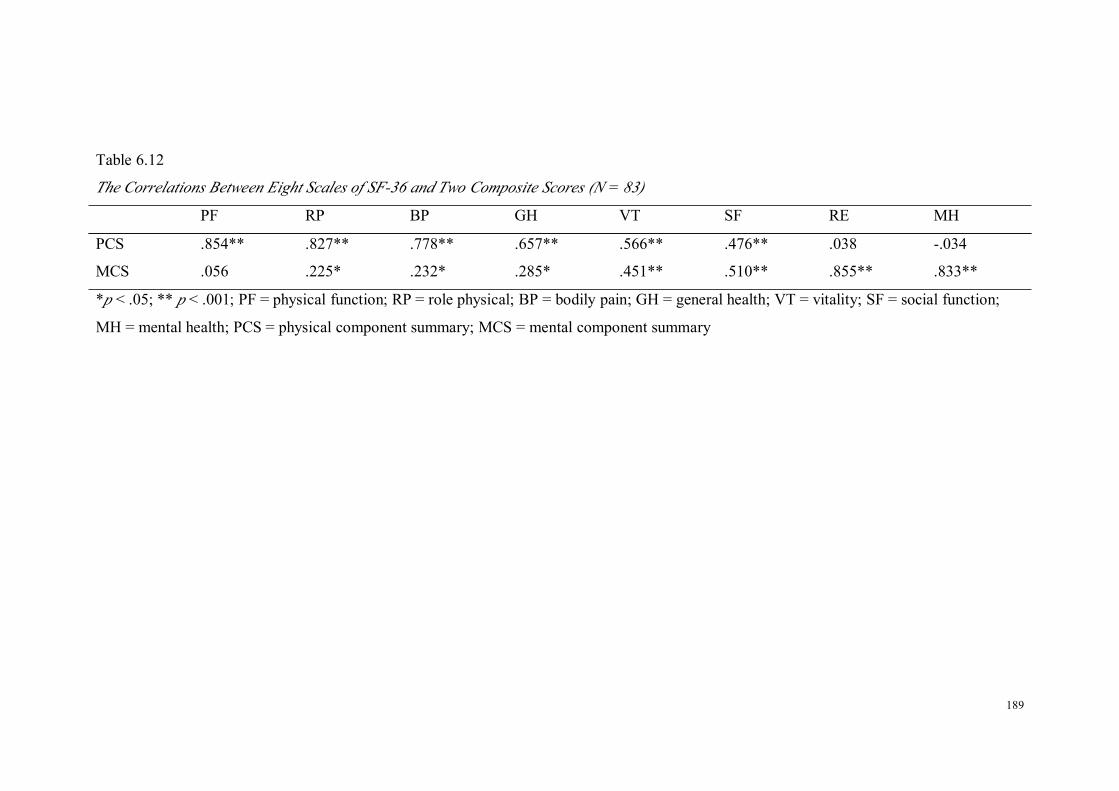
189
Table 6.12
The Correlations Between Eight Scales of SF-36 and Two Composite Scores (N = 83)
PF RP BP GH VT SF RE MH
PCS .854** .827** .778** .657** .566** .476** .038 -.034
MCS .056 .225* .232* .285* .451** .510** .855** .833**
*p < .05; ** p < .001; PF = physical function; RP = role physical; BP = bodily pain; GH = general health; VT = vitality; SF = social function;
MH = mental health; PCS = physical component summary; MCS = mental component summary

190
Correlations Between Mental Health and Self-Efficacy in Managing ChronicDisease
The cross-sectional relationships between SEMCD and different measures of
mental health were analysed by using a binary Pearson correlation analysis. It can be
seen from Table 6.13 that SEMCD was significantly related with all of the mental
health variables, with the strongest correlation being found with depression, r = -.632,
p < .001. These results suggested that women with high self-efficacy tended to have
less anxiety and depression symptoms, and better general mental health. Apart from
this, it was noticed that all the other mental health measures were strongly
interrelated with each other, p < .001.
Table 6.13
Associations Between Self-Efficacy in Managing Chronic Diseases and Mental
Health (N = 83)
SEMCD Anxiety Depression MHI MCS
SEMCD 1 -.422*** -.632*** .452*** .367***
Anxiety 1 .676*** -.649*** -.650***
Depression 1 -.513*** -.502***
MHI 1 .833***
MCS 1
*** p < .001
Associations Between Self-Efficacy in Managing Chronic Disease and Lifestyle
Factors
When examining the relationships between self-efficacy in managing chronic
diseases and lifestyle factors, an independent sample t-test and One-way ANOVA

191
analysis were applied. The characteristics of lifestyle factors for women with
diabetes were displayed in Table 6.14 for clarification, but not described in detail.
There was a significant negative relationship between BMI and SEMCD, r =
-.258, p = .025, suggesting that women with a higher BMI tended to have a lower
level of SEMCD. The magnitude of relationship was mild. However, when women
were classified into normal, overweight and obese categories according to their
BMIs, no statistical difference was found between groups in terms of their
self-efficacy score. This could be related with the small number of women in the
normal weight category (N = 5), which suggested limited statistical power to detect
differences. Women’s rating of overall physical activity was positively related with
SEMCD, r = .281, p = .018. This showed that women with more physical activity
had a high level of self-efficacy in managing chronic diseases. Apart from the
findings for BMI and physical activity, no difference was found in self-efficacy in
relation to other lifestyle factors including smoking and alcohol use.
Table 6.14
Associations Between Self-Efficacy in Managing Chronic Diseases and Lifestyle
Factors (N = 80)
Variables SEMCD
(Mean ± SD)
Test of
significance
p
BMI (continuous) 33.51 ± 7.28 7.03 ± 1.67 -.258 .025
BMI (categorical) 1.392 .255
Normal 6 (7.6) 7.37 ± 1.91
Overweight 22 (27.8) 7.52 ± 1.38
Obese 51 (64.6) 6.83 ± 1.77
Physical activity
General activity 1.151 .322
Very/moderate 30 (37.5) 7.28 ± 1.76

192
Variables SEMCD
(Mean ± SD)
Test of
significance
p
Mild 34 (42.5) 7.13 ± 1.61
Sedentary 16 (20.0) 6.51 ± 1.59
Exercise -1.970 .053
Yes 39 (49.4) 7.46 ± 1.79
No 40 (50.6) 6.72 ± 1.47
Rating of overall
physical activity
3.55 ± 2.00 .263 .025
Alcohol consumption -1.510 .135
Yes 23 (28.0) 7.46 ± 1.66
No 58 (70.7) 6.84 ± 1.67
Smoking habit -1.575 .119
Smoker 3 (3.6) 8.50 ± 1.26
Non-smoker 80 (96.4) 6.97 ± 1.66
The Associations of Self-Efficacy With Sociodemographic Factors and Other
Confounders
The purpose of this section was to examine the correlations between SEMCD
and sociodemographic factors, as well as other confounders to determine the
significant covariates to be included in further mediation analysis.
The analysis showed that none of the sociodemographic factors was
correlated with SEMCD. Other variables including the duration of diabetes, use of
antidepressants and number of co-morbidities were significantly correlated with
SEMCD, menopausal status was not (Table 6.15). In detail, the number of
co-morbidities was negatively related with SEMCD, and the strength of this
association was moderate, r = -.543, p < .001. Women who have had diabetes for
more than two years had lower SEMCD scores than those who have had diabetes for
less than two years (7.77 ± 1.13 vs. 6.55 ± 1.79), t = 3.716, p = .001. Lastly, women

193
who were using antidepressants reported a SEMCD score of 5.83 (SD = 2.24) while
the corresponding scores for those who did not were 7.26 (SD = 1.45), t = 2.946, p
= .004. Based on the analysis, the confounders of the duration of diabetes, use of
antidepressants and the number of co-morbidities were to be included in the
mediation analysis.
Table 6.15
The Differences of Self-Efficacy in Managing Chronic Diseases in Relation to
Sociodemographic Factors and Other Confounders (N = 77 ~ 83)
Mean ± SD / N (%)SEMCD
(Mean ± SD)
Test of
Significance
p
Age 65.43 ± 9.26 7.03 ± 1.67 -.070 .539
# of co-morbidities§ 3.00 7.03 ± 1.67 -.543 < .001
Marital status .678 .500
Married 47 (56.6) 7.14 ± 1.68
Not married 36 (43.4) 6.88 ± 1.67
Country of origin .531 .328
Australia 59 (71.1) 6.90 ± 1.75
Others 24 (28.9) 7.31 ± 1.45
Aboriginality -1.328 .188
Yes 1 (1.2) 4.83
No 81 (98.8) 7.05 ± 1.66
Speaking another
language than English
-1.030 .306
Yes 10 (12.0) 6.52 ± 1.62
No 73 (88.0) 7.10 ± 1.67
Education 2.598 .081
≤Junior school 34 (42.5) 6.57 ± 1.97
Senior school 16 (20.0) 7.08 ± 1.47
Uni./Technology 30 (37.5) 7.51 ± 1.26
Employment .157 .675

194
Mean ± SD / N (%)SEMCD
(Mean ± SD)
Test of
Significance
p
Paid employment 19 (22.9) 7.17 ± 1.37
Unemployed 64 (77.1) 6.98 ± 1.76
Annual income .059 .943
≤$ 40,000 47 (61.0) 7.09 ± 1.68
>$ 40,000 27 (35.1) 6.96 ± 1.70
Don’t know 3 (3.89) 6.89 ± 1.78
Duration of diabetes 3.716 .001
≤ 2 years 31 (38.8) 7.77 ± 1.13
> 2 years 49 (61.2) 6.55 ± 1.79
Use of antidepressant 2.946 .004
Yes 13 (15.7) 5.83 ± 2.24
No 70 (84.3) 7.26 ± 1.45
Menopausal status .504 .681
Pre- 1 (1.3) 8.33
Peri- 7 (8.8) 7.55 ± .64
Post 32 (40.0) 7.03 ± 1.50
Surgical 40 (50.0) 6.89 ± 1.92§Median
Mediation Analysis
Based on the above analysis, the mediating effect of SEMCD could be tested
in the correlations between depression and BMI, and depression and rating of overall
physical activity. The confounders in the mediation analysis were duration of
diabetes, use of antidepressants, and number of co-morbidities. The hypothesised
mediation models and the correlation coefficients between variables were depicted in
from Figures 6.2 to 6.5. As the relationships between lifestyle factors and mental
health are reciprocal, four models were examined. The first model used physical
activity as the outcome measure and depression as the predictor to examine whether
self-efficacy mediates the effect of depression on physical activity. The second
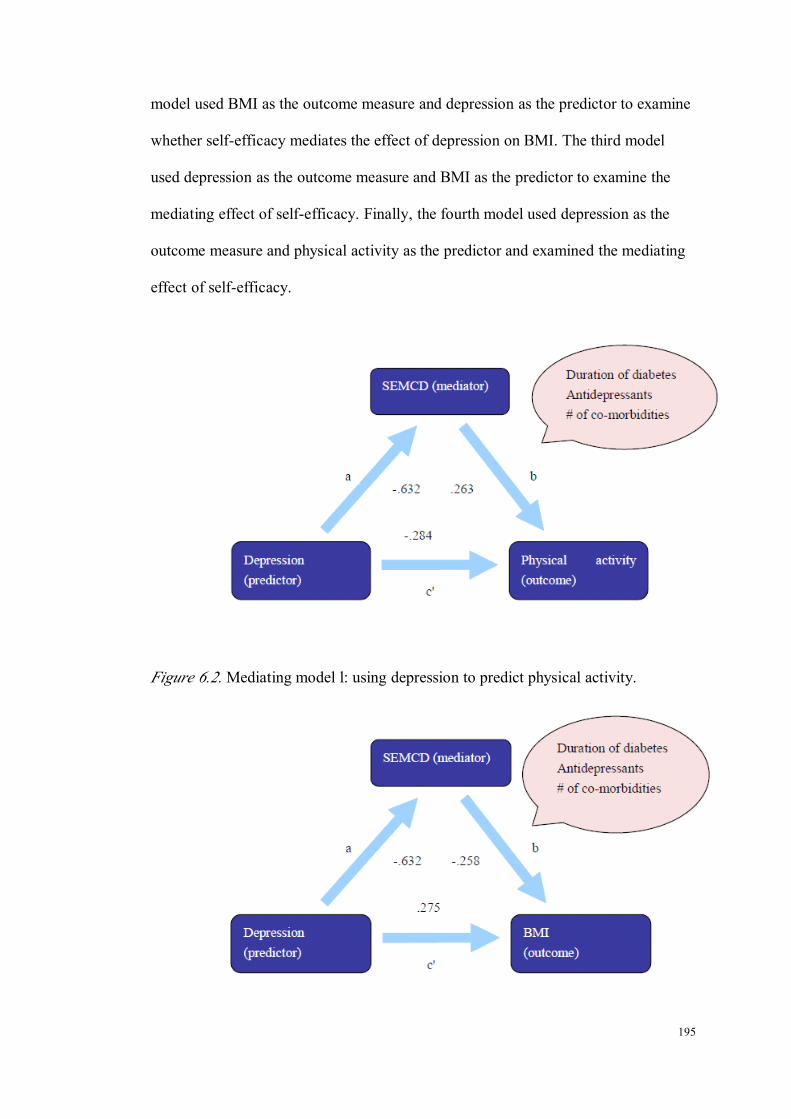
195
model used BMI as the outcome measure and depression as the predictor to examine
whether self-efficacy mediates the effect of depression on BMI. The third model
used depression as the outcome measure and BMI as the predictor to examine the
mediating effect of self-efficacy. Finally, the fourth model used depression as the
outcome measure and physical activity as the predictor and examined the mediating
effect of self-efficacy.
Figure 6.2.Mediating model l: using depression to predict physical activity.
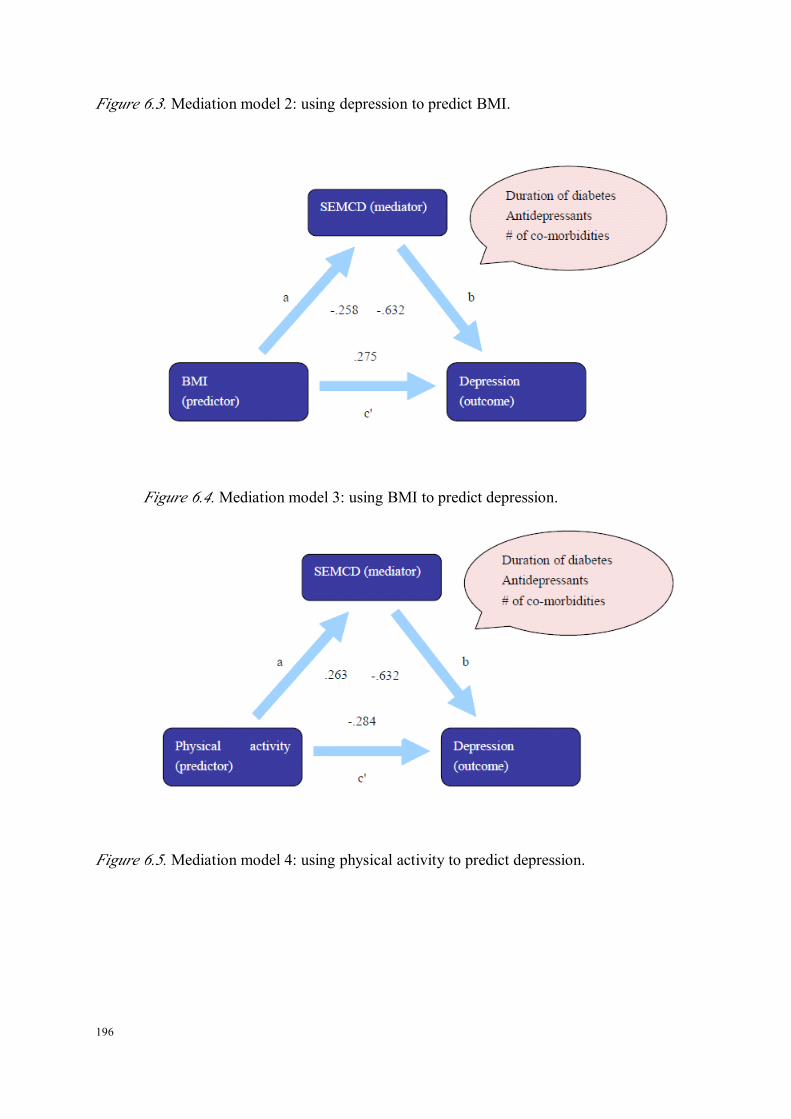
196
Figure 6.3.Mediation model 2: using depression to predict BMI.
Figure 6.4.Mediation model 3: using BMI to predict depression.
Figure 6.5.Mediation model 4: using physical activity to predict depression.
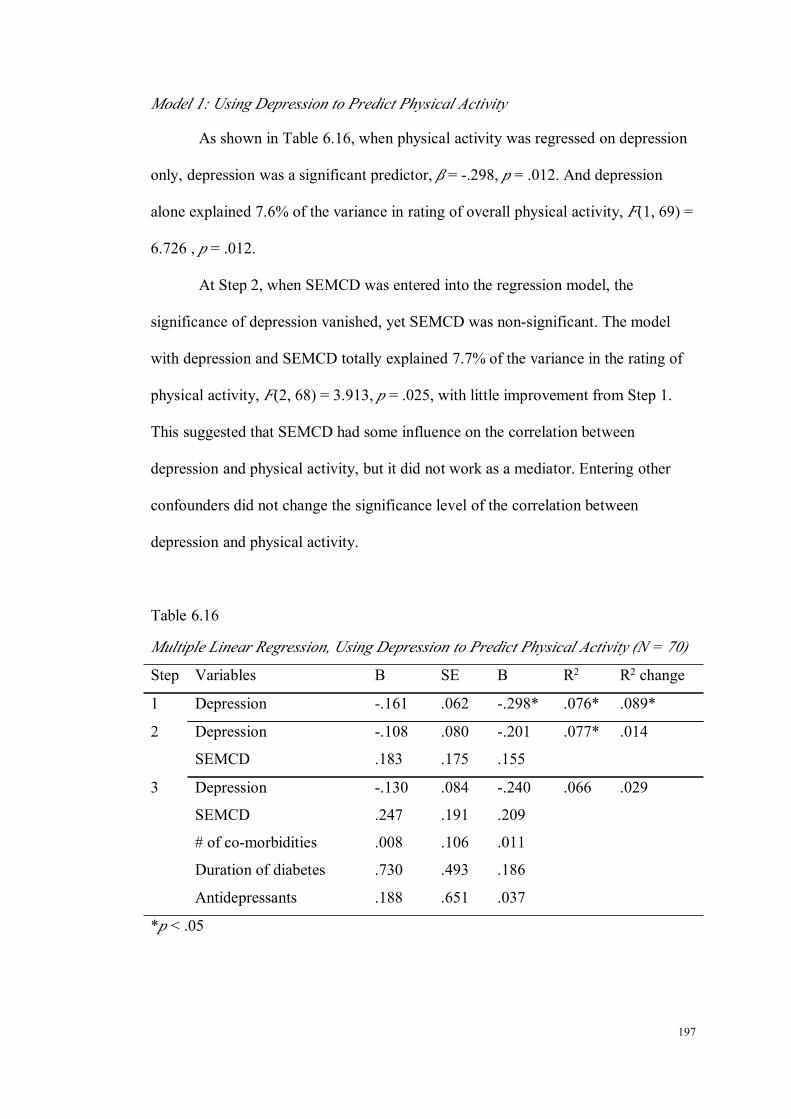
197
Model 1: Using Depression to Predict Physical Activity
As shown in Table 6.16, when physical activity was regressed on depression
only, depression was a significant predictor, β = -.298, p = .012. And depression
alone explained 7.6% of the variance in rating of overall physical activity, F(1, 69) =
6.726 , p = .012.
At Step 2, when SEMCD was entered into the regression model, the
significance of depression vanished, yet SEMCD was non-significant. The model
with depression and SEMCD totally explained 7.7% of the variance in the rating of
physical activity, F(2, 68) = 3.913, p = .025, with little improvement from Step 1.
This suggested that SEMCD had some influence on the correlation between
depression and physical activity, but it did not work as a mediator. Entering other
confounders did not change the significance level of the correlation between
depression and physical activity.
Table 6.16
Multiple Linear Regression, Using Depression to Predict Physical Activity (N = 70)
Step Variables B SE Β R2 R2 change
1 Depression -.161 .062 -.298* .076* .089*
2 Depression -.108 .080 -.201 .077* .014
SEMCD .183 .175 .155
3 Depression -.130 .084 -.240 .066 .029
SEMCD .247 .191 .209
# of co-morbidities .008 .106 .011
Duration of diabetes .730 .493 .186
Antidepressants .188 .651 .037
*p < .05
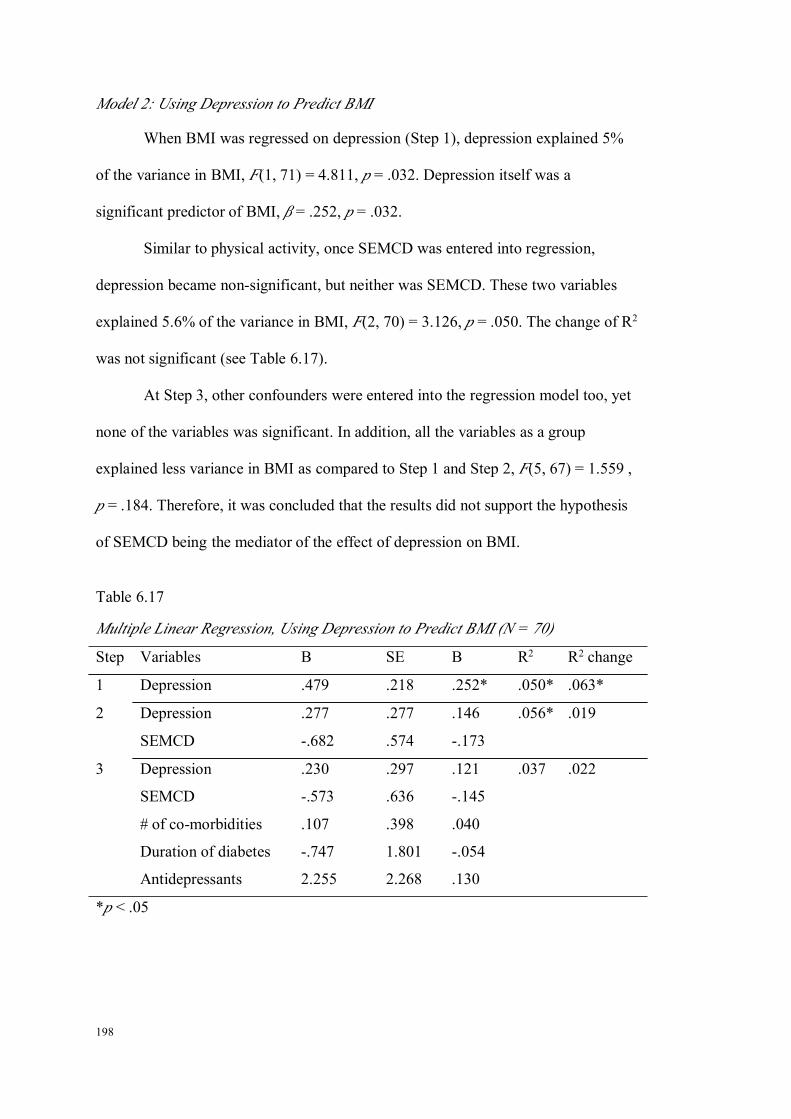
198
Model 2: Using Depression to Predict BMI
When BMI was regressed on depression (Step 1), depression explained 5%
of the variance in BMI, F(1, 71) = 4.811, p = .032. Depression itself was a
significant predictor of BMI, β = .252, p = .032.
Similar to physical activity, once SEMCD was entered into regression,
depression became non-significant, but neither was SEMCD. These two variables
explained 5.6% of the variance in BMI, F(2, 70) = 3.126, p = .050. The change of R2
was not significant (see Table 6.17).
At Step 3, other confounders were entered into the regression model too, yet
none of the variables was significant. In addition, all the variables as a group
explained less variance in BMI as compared to Step 1 and Step 2, F(5, 67) = 1.559 ,
p = .184. Therefore, it was concluded that the results did not support the hypothesis
of SEMCD being the mediator of the effect of depression on BMI.
Table 6.17
Multiple Linear Regression, Using Depression to Predict BMI (N = 70)
Step Variables B SE Β R2 R2 change
1 Depression .479 .218 .252* .050* .063*
2 Depression .277 .277 .146 .056* .019
SEMCD -.682 .574 -.173
3 Depression .230 .297 .121 .037 .022
SEMCD -.573 .636 -.145
# of co-morbidities .107 .398 .040
Duration of diabetes -.747 1.801 -.054
Antidepressants 2.255 2.268 .130
*p < .05
199
Model 3: Using BMI to Predict Depression
Step 1 used BMI as the independent variable, and depression as the
dependent variable. As shown in Table 6.18, BMI had a significant relationship with
depression, β = .252, p = .032. BMI, by itself, explained 5.0% of the variance in
depression, F(1, 71) = 4.811, p = .032.
When SEMCD was entered into the regression model with BMI, the
significance of BMI vanished, and SEMCD was shown to be a strong factor
influencing depression, β = -.590, p < .001. Moreover, the variance accounted by
BMI and SEMCD was 37.1%, F(2, 70) = 22.194, p < .001, which was a substantial
increase beyond what was explained by BMI.
The effect of confounders was controlled at Step 3. As revealed, the strength
of the correlation between SEMCD and depression was attenuated somewhat,
remained statistically significant, β = -.388, p = .002. None of the remaining
variables were found to be significant. All the variables explained 41.4% of the
variance in depression, which was shown to be a significant improvement, ΔR2 =
6.7%, p = .050.
In brief, SEMCD was a mediator of the relationship between BMI (predictor)
and depression (outcome). In other words, the finding that women with high BMI are
more likely to have depressive symptoms is because they have low self-efficacy in
managing chronic disease.

200
Table 6.18
Multiple Linear Regression, Using BMI to Predict Depression (N = 72)
Step Variables B SE β R2 R2 change
1 BMI .132 .060 .252* .050* .063*
2 BMI .051 .051 .097 .371*** .325***
SEMCD -1.225 .201 -.590***
3 BMI .039 .050 .073 .414*** .067*
SEMCD -.806 .243 -.388**
# of co-morbidities .280 .159 .199
Duration of diabetes 1.204 .724 .166
Antidepressants .929 .930 .102
*p < .05; **p < 0.01; ***p < .001
Model 4: Using Physical Activity to Predict Depression
The effect of the rating of overall physical activity on depression was first
analysed. At Step 1, physical activity was a significant predictor of depression, β =
-.298, p =.012. Physical activity alone explained 7.6% of the variance in depression,
F(1, 69) = 6.726, p = .012.
Then, SEMCD was entered into regression analysis with physical activity.
The results showed that physical activity became a non-significant factor in
predicting depression, while SEMCD became a significant one, β = -.594, p < .001.
These two variables explained 39.6% of the variance in depression, F(2, 68) =
23.949, p < .001.
Finally, when other confounders were entered into the model, the magnitude
of the correlation between depression and self-efficacy decreased, but remained
strongly significant, β = -.412, p < .001. In addition, no other factors were found to
be significantly impacting on depression. The whole group of variables accounted

201
for 43.0% of the variance in depression, but this was not a significant improvement,
ΔR2 = 5.7%, p = .082.
In short, the analysis showed that in the relationship between physical
activity (predictor) and depression (outcome), SEMCD was a mediator. The reason
for more depression symptoms among women with low physical activity was
actually low self-efficacy in this group of women.
Table 6.19
Multiple Linear Regressions, Using Physical Activity to Predict Depression (N = 70)
Step Variables B SE β R2 R2 change
1 Physical activity -.552 .213 -.298* .076* .089*
2 Physical activity -.243 .179 -.131 .396*** .324***
SEMCD -1.300 .212 -.594***
3 Physical activity -.272 .176 -.147 .430*** .057
SEMCD -.902 .256 -.412***
# of co-morbidities .290 .149 .210
Duration of diabetes 1.108 .712 .152
Antidepressants .559 .940 .058
*p < .05; ***p < .001
Reflection on the Research Questions
1) What is the relationship between mental health and lifestyle factors among
midlife and older women with diabetes?
Among this population, depression was positively correlated with
BMI and negatively related with rating of overall physical activity. Apart from
depression, no other correlations were identified between other mental health
and lifestyle factors.

202
2) Does self-efficacy in managing chronic diseases mediate the correlations
between depression and BMI, and depression and physical activity among
midlife and older women with diabetes?
When examining the effect of lifestyle factors (BMI & physical activity)
on depression, self-efficacy was a mediator. However, when the effect of
depression on lifestyle factors (BMI & physical activity) was evaluated,
self-efficacy was not a mediator.
3) Additional findings
Women who had diabetes for more than two years had a lower level of
self-efficacy in managing chronic disease than women who have had diabetes for
less than two years. Furthermore, women using antidepressants had a lower level
of self-efficacy in managing chronic diseases than those who do not.

203
CHAPTER 7: DISCUSSION
Introduction
This chapter summarises the major findings of each study, compares the
findings of the current research with previous studies, and discusses the strengths
and limitations of the study. Prior to each section of the discussion, the
corresponding major finding is briefly outlined. This chapter is comprised of five
sections: the first lists the primary findings of each individual study of the current
research; the second discusses the relationship of each lifestyle factor with mental
health in midlife and older women from the general population; the third illustrates
the relationship between lifestyle and mental health in midlife and older women with
chronic diseases; the fourth demonstrates the mediating effect of self-efficacy in the
associations between lifestyle factors and mental health among midlife and older
women with a chronic disease, and the fifth presents the strengths and limitations.
The Lifestyles of Australian Midlife and Older Women
Research question:
What are the inter-relationships among lifestyle factors among Australian
midlife and older women?
The current study examined four common lifestyle factors including BMI,
physical activity, smoking and alcohol use in Australian midlife and older women. It
is important to gain an understanding of the characteristics of lifestyle factors among
Australian midlife and older women.

204
The current research found that there is no difference in other lifestyle factors
including physical activity, smoking and alcohol use in relation to BMI, suggesting
that overweight and obese women do not necessarily have a greater number of other
unhealthy lifestyle factors. When examining the relationships between physical
activity, smoking and alcohol use, the research found women who are current
smokers had lower level of physical activity than non-smokers. In addition, women
who reported to be regular alcohol drinkers are more likely to perform physical
activity. Finally, women who are current smokers are also more likely to be regular
alcohol drinkers.
The absence of the relationships between BMI and other three lifestyle
factors differs from the literature in this area. Studies have reported that people who
are overweight or obese have lower levels of physical activity than those with
normal weight (Sanchez et al., 2008; Stamatakis et al., 2009), and that people who
are current smokers are less likely to be overweight (John, Hanke, Rumpf, & Thyrian,
2005; Munafo, Tilling, & Ben-Shlomo, 2009). In contrast, the current study found
results otherwise. 81% of obese women in the current study report doing different
levels of physical activity, suggesting that these women may have initiated physical
activity and attempted to place it into practice when they participated in the study.
Therefore, effort should be made towards facilitating women to stabilise the
behaviour of doing physical activity. Furthermore, in this research, no relationship
between smoking and BMI was indicated, although the small number of current
smokers in the current study may have limited the power of detecting a significant
result.
The relationship between smoking status and physical activity collaborates
with a review study by Kaczynski et al. (2008), who claim that current smokers have

205
lower level of physical activity as compared to non-smokers. There are two
hypotheses for this relationship. One suggests that smokers are less health conscious
than those who have never smoked. When this attitude towards health is reflected in
physical activity, this group pays less attention to such activity and consequently
approaches it with less effort. The other hypothesis proposes that physiologically,
smokers tend to have an impaired lung capacity, which in turn prevents them from
carrying out adequate physical activity. In reality, it is likely that these two
mechanisms work jointly rather than separately. Nevertheless, current smokers are
more likely to be physically inactive compared to non-smokers, therefore; physical
activity promotion should be a strong focus for current smokers, particular.
Regarding the correlation between physical activity and alcohol use, the
current study found that regular alcohol drinkers are more likely to engage in a high
level of physical activity, and less likely to lead a sedentary lifestyle than
non-drinkers. It needs to be noted that the majority of women drink alcohol in
moderation in this study. This finding corresponds with a German study, whose
results revealed that non-alcohol use is a risk factor for exercising less than two
hours per week (Haenle et al., 2006), despite of the difference in physical activity
measurement. This relationship may be explained by the socioeconomic factors
(Fine et al., 2004), for example, education. Among women who drink alcohol on a
regular basis, over 40% of the women received tertiary education (university or
technological college), while among women who never drink, the corresponding
percentage was 22%. Higher level of education may indicate that these women are
more conscious and knowledgeable about their own health, which could be a
possible explanation to the relationship between alcohol drinking and physical
activity.

206
The Effect of Lifestyle Factors on Mental Health in Midlife and Older Women
Overweight and Obesity and Mental Health
Research question:
What is the relationship between BMI and mental health among Australian
midlife and older women?
The prevalence rates of overweight and obesity in Australian midlife and
older women in the current study are 33.0% and 25.6%, respectively. These figures
are very similar to those of the Australian female population, among which 30% of
women are classified as overweight and 22% as obese (Thorburn, 2005). In contrast,
among midlife and older women with diabetes, the prevalence of obesity is much
higher than that of the general population (62.2% vs. 25.6%).
The current study found that Australian midlife and older women who are
overweight or obese had lower levels of mental health than women with normal
weight. This finding collaborates with a number of previous studies, which clearly
state a positive relationship between BMI and depression (Barry et al., 2008;
Bruffaerts et al., 2008; Eunkyung, 2009; Zhao et al., 2009).
However, the relationship between BMI and mental health changes as
women age. It is indicated that over time, a higher BMI seemed to be beneficial to
women’s mental health. To our best knowledge, this is the first study showing that as
women age, BMI can actually change from a negative factor for mental health to a
positive one. Some literature does state that being overweight or obese has no
relationship with individuals’ mental health. For example, Vogelzangs and
colleagues studied a cohort of elderly people aged from 70 to 79 years in Netherland,
and found that BMI has no impact on depression as women age (Vogelzangs et al.,
207
2010). One Norwegian study examined anxiety, and also failed to find a relationship
between BMI and anxiety (Bjerkeset et al., 2008). Moreover, other studies comment
that despite the limited physical function that is commonly seen among overweight
and obese people, their mental health remains unaffected (Huang, Frangakis, & Wu,
2006; Mond & Baune, 2009; Renzaho et al., 2010; Vasiljevic et al., 2008; Wee et al.,
2010). In comparison, the current study shows that as midlife and older women age,
those who are overweight or obese have better mental health than those with normal
weight. Relating to the underlying mechanisms between obesity and mental health
may be helpful to explain why the effect of obesity and overweight on mental health
changes as women age.
Two primary pathways of the linkage between mental health (depression) and
obesity are proposed, one is the biophysical mechanism and the other is the
psychological pathway. The biological mechanism refers to the dysregulation of the
hypothalamic-pituitary-adrenocortical (HPA) system which is seen in both obese and
depressed patients (Bornstein, Schuppenies, Wong, & Licinio, 2006; Chrousos,
2000). It is evidenced by the facts that several neuropeptidergic and neurotransmitter
systems involving molecules and norepinephrine are involved in the regulation of
mood as well as body weight. This hypothesis is further supported by the evidence
that antidepressant treatment can result in a side effect of weight gain, while
treatment of obesity often causes depression (McElroy et al., 2004). The other
explanation is psychologically associated, which is strongly related with the social
construction of how obesity is perceived. In the present day, stigma and
discrimination toward obese persons are pervasive and pose numerous consequences
for their psychological and physical health (Puhl & Heuer, 2010). People with
obesity are often blamed with having a weak personality, a lack of self-discipline and
208
even being intelligently inferior (Rogge et al., 2004). This probably explains why
women with a higher BMI have more psychological symptoms.
However, despite the unfavourable societal attitude toward obesity, how an
individual would be influenced mentally heavily depends on his or her
self-perspective about his or her own weight. The psychological symptoms of obese
people may have been rooted in the inability to reduce the gap between a desired
body weight and the real one. Therefore concern about one’s appearance becomes
one of the important pathways via which heavy people experience psychological
problems (Hrabosky & Thomas, 2008; Markowitz, Friedman, & Arent, 2008;
Muennig, Jia, Lee, & Lubetkin, 2008). In relating to the current study (Morrow,
2001), women become more accepting of their bodies as they age because of the
psychosocial changes occurring at this stage of life (Keel, Baxter, Heatherton, &
Joiner, 2007). Going from midlife and beyond, women actually start to have more
space for themselves, both financial and time wise. They are less driven by the
socio-cultural norms of success and achievement. In addition to that, women at
midlife tend to have a more stable income, be released from child raising and have
better marriage relationships (Hunter, Sundel, & Sundel, 2002; Pudrovska, 2009).
These positive factors in combination can be an enormous source of satisfaction and
freedom, which can distract women from their appearance, and still result in
improved mental health.
An alternative explanation is based on the context of the study, and is related
with women’s physical activity levels. Some earlier studies find that physical
inactivity is more common among overweight or obese populations (Sanchez et al.,
2008; Stamatakis et al., 2009), whereas in the current study, women who are obese
have been as equally active as women with normal weight (see Appendix A). It is

209
indicated that the majority of obese women carry out exercise routinely. Considering
these women’s activity level, it is regarded that overweight or obese women may
have benefited from doing regular exercise and may have developed a strong sense
of well-being. Previous study has also shown that midlife women who are engaged
in health promotion activities (e.g. physical activity) report greater extent of life
satisfaction (Degges-White & Myers, 2006).
Physical Activity and Mental health
Research question:
What is the relationship between physical activity and mental health among
Australian midlife and older women?
It was revealed that 16.7% of the women did not perform any exercise on a
weekly basis, while more than 50% of them exercised more than three times a day.
Compared to the Australian population data, which indicates 30% of Australians lead
a sedentary lifestyle, the prevalence of a sedentary lifestyle in the current study is
less than half of the norm (Bauman & Owen, 1999). These data suggests that
Australian midlife and older women are more physically active than the general
population.
Regarding the effect of physical activity on mental health, the current study
revealed that women exercising daily had much better mental health including less
anxiety, depression and better general mental health. This positive effect of physical
activity remained unchanged as women age. This finding of the study is widely
supported by a substantial amount of research in this field (Aoyagi et al., 2010; Bhui
& Fletcher, 2000; Brown et al., 2005; Fukukawa et al., 2004; Galper et al., 2006;

210
Goodwin, 2003; Rakovac et al., 2007; Vallance et al., 2010; Van Gool et al., 2007;
Wyshak, 2001). The current study’s findings strongly suggest that physical activity
is a useful means of improving mental health for Australian midlife and older
women or midlife and older women in other western countries.
Despite the widely accepted notion that physical activity improves mental
health and promotes a sense of well-being, there is a lack of agreement about how to
measure physical activity. The physical activity measured in one study may not be
comparable to that examined in another. For example, the study by Goodwin et al.
(2003) measured physical activity by asking “how often do you get physical exercise
in your job and recreational activities?”, which essentially evaluated the frequency of
doing exercise. However, Bhui and his associates investigated how many times a
week participants took part in activities and for how long on each occasion (Bhui &
Fletcher, 2000), considering both frequency and duration. Furthermore, a study
undertaken in Japan measured physical activity objectively by using a pedometer
(Aoyagi et al., 2010). As can be seen from these examples, apparently, there is a lack
of agreement on how physical activity should be evaluated, which in turn increases
the difficulty of identifying the minimal effective level of physical activity in
reducing depression and anxiety.
Several mechanisms of physical activity (exercise in this case) reducing
depression and anxiety have been discussed, with some of them being primarily
physiologically based, while others stem from a psychological perspective. In fact,
the beneficial effect of physical activity on mental health is likely to be produced by
the combination of both mechanisms. These mechanisms have been reviewed by Lox
et al. (Lox, Martine Ginis, & Petruzzello, 2006). The existing biophysical hypotheses
of depression include the endorphin hypothesis and the monoamine hypothesis. The

211
former hypothesis explains that the body produces endorphin that is a natural
painkiller during exercise; which makes people feel happy. The latter suggested that
exercise changes mood by accelerating the communication between brain
neurotransmitters that are related in emotion regulation, thus reducing depressive
symptoms. The theory explaining the anxiety reduction effect of exercise is called
thermogenic theory. It argues that exercise elevates the body temperature, which is
sequentially sensed by the brain, therefore triggering a muscle relaxation response
and resulting in a feeling of anxiety reduction.
The psychological hypotheses for depression and anxiety are quite similar.
The master hypothesis assumes that alleviated depression is associated with a sense
of accomplishment from doing exercise. Socially, it is an opportunity for individuals
to obtain support if exercising with others (Donaghy, 2007). Regarding anxiety,
research states that exercise distracts people from their daily routine, and creates an
opportunity to leave worries behind, therefore, resulting in a decreased level of
anxiety. The applicability of these theories is not yet well explored, but it is agreed
that exercise decreases negative psychological effects via biophysical and
psychological pathways in conjunction with each other.
Smoking and Mental Health
Research question:
What is the relationship between smoking and mental health among
Australian midlife and older women?
The study identified 10.8% of current smokers among a large community
sample of Australian midlife and older women. This prevalence of current smokers

212
is approximately half of the national proportion, 18.4% of the Australian population
(Social Research Centre, 2006). The detrimental effect of smoking on mental health
was not shown at an earlier stage, but did become significant as women age.
The negative effect of smoking on mental health has been well established by
earlier research studies (Massak & Graham, 2008; Mino et al., 2001; Sarna et al.,
2008; Tavafian et al., 2009; Tselebis et al., 2001). For example, the Nurses’ Health
Study in America examined 158, 736 nurses from 1992/1993 to 2000/2001, during
which nurses’ mental health appeared to improve as they age, but the disparities of
mental health across smoking status remained (Sarna et al., 2008). In the current
study, when women first entered the study at 55 years of age, not much difference in
mental health was seen between women who smoked and those did not. While as
women age, the difference of mental health between those with different levels of
smoking enlarged. There was a steady improvement for non-smoking women and a
clear deterioration for women who smoked. The improvement of mental health as
women age has been demonstrated by the Nurses’ Health Study. In addition, the
current study suggests that smoking has actually prevented some women from
enjoying optimal mental health.
Two mechanisms have been proposed to explain the adverse effect of
smoking on mental health. The first hypothesis is that smoking per se leads to
depression by neurochemical changes brought on by smoking, which is primarily
supported by the studies examining the incidence of psychological illnesses among
adolescents (Johnson et al., 2000; Wu & Anthony, 1999). The second illustrates that
the co-morbidity of smoking and psychological illnesses is a result of shared
predisposition to genetic and environmental factors (Dierker, Avenevoli, Stolar, &
Merikangas, 2002; Duncan & Rees, 2005; Goodwin & Hamilton, 2002).
213
Given the strong impact of smoking on mental health, it is interesting that no
relationship between the two variables was found when women were younger, for
which explanations are sought. Re-examination of the mental health level of women
finds that when compared to women of younger ages i.e. 30 years, the mental health
of midlife and older women in this study is actually better (Australian Bureau of
Statistics, 2007). When a cutoff score of 10 was used to categorise women into
clinical depression/non-depression and clinical anxiety/non-anxiety groups, the
prevalence rates of depression and anxiety were both found to be 2.3%. These
percentages are much lower than the lifetime prevalence of mental disorders (14.4%)
in the Australian sample (Australian Bureau of Statistics, 2007). Considering the
much lower proportion of smokers in the study population, as mentioned in the
beginning of this section, the non-significant relationship between smoking and
mental health among midlife and older women at their 55 years of age may be
attributed to an inadequate number of women who smoke or have mental health
problems. Nevertheless, it is regarded that smoking produces detrimental
psychological effects on midlife and older women. Continued effort should be made
to encourage women to quit smoking and improve their mental health to the largest
extent as possible.
Alcohol Use and Mental Health
Research question:
What is the relationship between alcohol use and mental health among
Australian midlife and older women?

214
The study showed that the prevalence of women drinking alcohol on a
regular basis was 16.5%, half of the women (50%) drank alcohol occasionally, and
the other 22.4% of the women never drank. When alcohol drinking was categorised
according to the National Health and Medical Council’s guidelines, the study found
that the prevalence of short-term risky and high risk drinking was 2.26%, and
long-term risky and high risk drinking was 4.52%, respectively. Compared to the
national data for Australian women, which revealed that the proportion of risky and
high risk drinking (including short- and long-term) level has increased from 6.2% in
1995 to 11.7% for the period between 2004 and 2005 (Australian Bureau of
Statistics, 2006c), risky and high risk drinking seems less of a problem for midlife
and older women.
In addition, the study suggests that the relationship between alcohol use and
mental health changes as women age. No relationship between the two variables is
found initially, yet as time goes by, women who were past alcohol drinkers present
less anxiety symptoms than women who were non-drinkers. No difference in mental
health was found between current drinkers and non-drinkers.
The non-significant relationship between current alcohol drinking and mental
health is in contrast to some earlier studies, which claim that moderate alcohol
drinking is related to improved quality of life (mentally and physically) and healthier
ageing for older women (Byles et al., 2006; Chan et al., 2009). The evaluation of
alcohol drinking in the current study is compared to that of earlier studies as an
attempt to explain the differences.
Regarding the assessment of alcohol, the study obtained information by
asking women “how often do you drink alcohol?”. It can be seen from this question
that what was measured is the frequency of alcohol consumption. Graham et al. have
215
discussed the effect of alcohol use measurement on its associations with depression,
and concluded that depression is unrelated with frequency of alcohol use, but more
linked with a larger number of standard drinks per occasion (Graham, Massak,
Demers, & Rehm, 2007). This suggests that frequency-based categorisation may
result in different classification levels from what is obtained by using a quantity
based method. However, as mentioned earlier in this section, the percentage of
women drinking at risky and high risk levels is quite low (2.26% to 4.52%) in this
sample. Therefore, the likelihood of missing the capture of harmful alcohol drinking
is rare.
It is seen that as women age, the anxiety levels of women who were past
drinkers were lower than non-drinkers. Literature has demonstrated that people who
quit alcohol drinking are more likely to have mental health problems such as
depression and anxiety as part of their withdrawal syndrome (Ducci et al., 2007). It
is considered that there may be a few reasons behind this phenomenon. First, the
past-drinkers in the current study may not have been heavy problem drinkers before
they quit. In this circumstance, even though they refrain from drinking alcohol,
psychological problems are less likely to occur. Second, reduced anxiety levels may
be related with physical activity. In the current study, the prevalence of women
doing daily exercise among past-drinkers is 43%, which is nearly two times higher
than that of non-drinkers (16.4%). The beneficial psychological effect of physical
activity has been widely acknowledged, therefore, it is considered that women who
drank in the past benefit psychologically from doing adequate activity in the long
term.
216
Age and Mental Health
The mental health of Australian midlife and older women improves as they
age. This is evidenced by reduced psychological symptoms including depression.
This finding collaborates with the results of two large women’s studies: the
Australian Longitudinal Study of Women’s Health (ALSWH) and the Nurses’
Health Study. Both found that generally women’s mental health improves as they
age, although some negative factors (e.g. smoking) could prevent this trend from
occurring in a subgroup of women. The participants in the current study are middle
aged or older, around which time of life a considerable number of changes, both
biological (e.g. menopausal symptoms) and social (e.g.empty nest), often occur.
Traditional views tend to highlight these factors as the sources of stress for women,
but overlook the positive aspects of midlife. Actually, research (Hunter et al., 2002)
has shown most women experience a high level of well-being, optimism and
satisfaction about life, power and personal achievement at middle-age, although the
deterioration of physical health is an inevitable factor that can confront some
women.
The Effects of Lifestyle Factors on the Mental Health of Women With and Without
Diabetes
Research questions:
a. What is the difference in mental health between women with and without
diabetes?
b. What are the contributing factors of the difference in mental health between
women with and without diabetes?

217
Based on ten controlled studies estimating the prevalence of depression
among diabetic populations, Ali et al. concluded that the prevalence of depression
among people with Type 2 diabetes was nearly twice that of those without (Ali, et al.,
2006).
Although such meta-analysis has the advantages of using a larger sample size
and a greater ability to generalise the results to other populations, it is not without its
limitations. As commented by the authors, diabetic and non-diabetic groups included
in many studies differ from each other in variables known to be associated with
depression. For example, confounders like socioeconomic factors, obesity and
co-morbid conditions were not always adjusted for when comparing the depression
levels between the two groups. Therefore, the resulting analysis may not accurately
reflect the true differences. Again, for anxiety, the German National Study, which
included 4,169 individuals from the community (Kruse et al., 2003), found that
patients with diabetes are 90% (95%CI, 1.19-3.14) more likely to have anxiety
disorder when compared to those without. However, this study also has a limitation
of only controlling for sociodemographic factors. The current study, thus, has the
advantage of considering the confounding effect of lifestyle factors and
co-morbidities that could have an effect on the relationship between diabetes and
mental health.
The current study showed that before adjusting for sociodemographic factors,
lifestyle factors and number of chronic diseases, women with diabetes were found to
have more depressive symptoms and a lower level of general mental health, but not
anxiety. After controlling for confounders, the difference in depression and general
mental health vanished to being non-significant. Therefore, this means that diabetes
itself is not related with lower levels of mental health.

218
Rather, lifestyle factors including physical inactivity and the number of
co-morbidities impact on the mental health of women. The relationship between
physical activity and mental health again confirms the existing literature (Brown et
al., 2005; Dunn, Trivedi, & O'Neal, 2001), and lends further support to the beneficial
psychological effect of physical activity and adverse effect of physical inactivity.
The important implication of the result is that there is a potential to improve the
mental health of women with diabetes, as physical inactivity can be modified with
effort.
What needs to be considered is that women with diabetes often have other
chronic conditions that can strongly affect their ability and motivation to do physical
activity. This could be the reason why women with diabetes reported lower levels of
physical activity. Therefore, research aiming to increase physical activity for women
with diabetes must take this into consideration to enable a tailored and effective
program that is suitable for the population.
Overweight and obesity did not impose an adverse effect on women’s mental
health. Some of the research studies on obesity and health-related quality of life
indicated that although overweight and obesity can sometimes limit people’s
physical function and compromise their level of physical function, their mental
health remains less disturbed (Goins, Spencer, & Krummel, 2003; Sturm &Wells,
2001). Two other lifestyle factors, smoking and alcohol use, were not related with
mental health, which is probably due to the small numbers of women who smoke
and drink in this sample.
In conclusion, the current study found the levels of mental health of women
with diabetes are lower than women without. The disparity in mental health results
from lower levels of physical activity and other co-morbidities, but not the condition
219
of having diabetes. Given that physical inactivity is modifiable, there is a potential
for the mental health of women with diabetes to be improved.
The Mediating Effect of Self-Efficacy, Mental Health and Lifestyle Factors
Research question:
Does self-efficacy mediate the relationships between lifestyle factors and
mental health among midlife and older women with diabetes?
The study suggests that self-efficacy mediates the relationships between
lifestyle factors, especially BMI and physical activity and depression. Specifically,
when examining the effect of lifestyle factors including BMI and physical inactivity
on depression, self-efficacy fully mediates the relationship. However, it was not
shown to be the one when examining the effect of depression on these lifestyle
factors.
From a statistical perspective, it can be explained why self-efficacy was not
shown to be a mediator when using depression to predict the lifestyle factors of BMI
and physical activity. It is noticed that, in particular, the correlation between
depression and self-efficacy in the study was strong. This strong correlation is
supported by social cognitive theory, in which mood is described as a source of
self-efficacy (Bandura, 1997). Based on Baron and Kenny’s theory, this means that
there is a strong correlation between the predicting variable (depression) and the
mediator (self-efficacy).
These researchers have stated that when a strong relationship exists between
a predicting variable and mediator, multicollinearity is likely to occur in regression
models. The consequence of multicollinearity is larger standard errors for
coefficients of each independent variable. In addition, finding a statistically

220
significant coefficient becomes more difficult due to lowered statistical power
(Kenny, 2009; Marill, 2004).
In the study, when lifestyle factors were regressed on depression and
self-efficacy, the observed powers of depression and self-efficacy were both low
(approximately 20%), and explained why self-efficacy is not the mediator of the
effect of depression on the lifestyle factors of BMI and physical activity. While BMI
and physical activity were analysed as initial variables (predictors) that cause
depression, self-efficacy was proved to be the mediator of the relationship. In this
circumstance, the correlations between the initial variables of BMI and physical
activity and the mediator (self-efficacy) were mild; therefore, the likelihood of
creating multicollinearity in regression models is low. Also, it was found that the
observed power of predictors was found to be adequate (about 80%), which
supported the reliability of the results.
Taken all together, the study showed that self-efficacy is the mediator of the
effect of the lifestyle factors of BMI and physical activity on depression, but not the
other way around. Although self-efficacy in managing chronic diseases is strongly
indicated as a full mediator of the effect of lifestyle factors on depression, it is
acknowledged that this study did not exam other potential mediators that could
possibly alternate the results. Nethertheless, the result that depression is related with
a lower self-efficacy level is supported by a number of other researchers (Aberle et
al., 2009; Bowser, Utz, Glick, Harmon, & Rovnyak, 2009; Sacco et al., 2005;
Wagner, Tennen, & Osborn, 2010). In addition, research with a larger sample size
may be warranted to test the mediating effect of self-efficacy with the effect of
depression on lifestyle factors.
221
Regarding the mediating effect of self-efficacy, the current study validated
the conclusion of the research by Sacco and colleagues (2005) that self-efficacy fully
mediates the relationship between BMI and self-efficacy among people with diabetes.
In addition, the current research also shows that self-efficacy fully mediates the
relationship between physical activity and depression. It is known that women with
diabetes also live with other chronic conditions that could limit their ability to
exercise. The resulting lower level of physical activity then may cause or exacerbate
depression because of isolation, lower energy and increased body weight. Moreover,
depression can reversely impact on people’s motivation to do physical activity, thus
a vicious circle is formed. Based on the findings of the current study, it can be seen
that self-efficacy is the central aspect in behaviour change; therefore, researchers or
clinicians should work tirelessly to enhance patients’ self-efficacy in order to initiate
and stabilise the effect of behavioural change. How to enhance patients’ self-efficacy
is discussed in the section on theoretical reflection below.
Self-Efficacy, Duration of Diabetes and Use of Antidepressants
Research question:
How does the duration of diabetes and use of antidepressants affect
self-efficacy in managing chronic disease?
The finding that a longer duration of diabetes is related with lower
self-efficacy in managing chronic disease is unexpected. Initially, it was
hypothesised that women with a longer duration of diabetes would have more
opportunities to build up their skills of diabetes management and thus should have
less psychological problems related to diabetes management. Age and the number of

222
co-morbidities were checked to explore the underlying reasons, because it was
thought that age may affect women’s ability to understand information and the
number of co-morbidities indicates the burden of disease management.
Further analysis of the differences in age and number of co-morbidities in
relation to diabetes duration was undertaken. No relationship between age and
duration of diabetes was found (65.18 ± 9.31 vs. 65.59 ± 9.32, t = -.196, p = .845);
therefore, age is not the factor that influences the correlation between duration of
diabetes and self-efficacy. Similarly, the number of co-morbidities was not shown to
be related the diabetes duration. Thus, complicated disease management tasks do not
explain the relationship between lower self-efficacy and a longer duration.
Finally, it is regarded that although women have had diabetes for a long time
(e.g. over two years), they do not necessarily get opportunities to learn and enhance
their chronic disease management skills. When the symptoms deteriorate over time,
the management tasks do get complicated and mastering these skills becomes more
difficult than when the diabetes started. Yet for women with a shorter duration of
diagnosis, the management tasks are relatively easier, so gaining confidence appears
to be a quicker and more efficient process when they are taught how to manage
diabetes.
Theoretical Reflection
The findings from the current study partially support the hypothesised
conceptual framework proposed in Chapter 2 (also see Figure 7.1). Based on the
social cognitive theory, the initial conceptual framework has two primary
assumptions. The first assumption is that that lifestyle factors including overweight
and obesity, physical activity, smoking and alcohol use have impacts on mental
223
health, and second is that self-efficacy mediates the effect of mental health on
lifestyle factors.
As indicated by the study results, the first assumption about the effect of
lifestyle factors on mental health is met, and in addition, the effect of each lifestyle
factor on mental health varies. The second assumption of the framework is not
supported. Instead, the mediating effect of self-efficacy on the effect of lifestyle
factors on mental health is strongly indicated.
In brief, the new conceptual framework clearly shows that lifestyle factors do
affect mental health, and self-efficacy is the mediator in the relationship among
women with Type 2 diabetes. Hence, it indicates that individuals’ mental health
needs to be considered when implementing lifestyle modification programs. Also, it
is suggested that concerted effort is required to promote people’s self-efficacy, which
may be effective to facilitate lifestyle change as well as mental health improvement.
The detailed information of the conceptual framework is delineated below.
All of the four lifestyle factors have impacts on mental health, but the
patterns of their relationships with mental health are different. First, physical activity
has the most robust relationship with mental health. It reduces psychological
symptoms, including depression and anxiety, and promotes general mental health.
From the other aspect, people who have inadequate level of physical activity
experience more frequent and severe mental health problems. Second, the effect of
BMI on mental health varies with time. In Australian midlife and older women,
those with a high BMI value have better improvement of mental health as they age,
while in women with diabetes, those with higher BMI values have more depression
symptoms. The variation of the impact of BMI indicates that women who are
overweight or obese do not necessarily have lower level of mental health. The effect

224
of BMI on mental health may be influenced by other factors. Third, smoking
produces an adverse effect on mental health of midlife and older women. Although
the prevalence rate of smoking among midlife and older women is lower than the
population data, the psychological adverse effect on individuals who smoke is not
any less. Women who are non-smokers have experienced a steady improvement of
mental health over time, yet women who are smokers display a downward trend. The
adverse psychological effect of smoking may be difficult to detect in a short period,
but if women continue to smoke, their mental health will eventually be influenced.
Thus, smoking should be largely discouraged. Finally, women who were formerly
alcohol drinkers experience less anxiety symptoms as they age. This result may be
taken with caution as the number of abstainers in the current research is small, which
may limit the ability of generalising the results to a broader population.
Lifestyle modification programs for midlife and older women may be more
effective and cost-effective, if they consider the features of lifestyle profiles of this
population. The understanding of the relationships between lifestyle factors and
mental health may be more profound knowing the interactions among lifestyle
factors themselves. Among midlife and older women with diabetes, lower levels of
physical activity and a high BMI is related to depression. Self-efficacy fully
mediates the effect of these two lifestyle factors on depression, but the effect of
depression on these two factors. Clinically, this implies that women living with
unhealthy lifestyle factors including physical inactivity and obesity are not confident
in managing chronic diseases, suggesting additional support for these women in
improving lifestyle and disease management. The enhancement of self-efficacy for
these women will help reducing depression symptoms, better managing disease tasks,
and promoting health related quality of life.
225
It is highly recommended that clinical strategies aiming at improving
self-efficacy should heavily rely on the four major sources of self-efficacy. The four
major sources are: 1) mastery experience, 2) vicarious experience, 3) verbal
persuasion, and 4) self-appraisal. The most important source of self-efficacy is
mastery experience, which means people gain the most confidence from successful
completion of a certain task. For example, if health professionals are able to work
with women in developing new skills of controlling blood sugar by appropriate
physical activity, women’s self-efficacy in this regard will be largely enhanced. At
the same time, the depression symptoms may also be relieved effectively by a
rewarding feeling from having completed the task. The other three strategies should
also be implemented in combination to maximise the positive outcomes.
The theoretical framework generated from the current research provides
some guidance for developing lifestyle modification programs that could be tailored
for midlife and older women. Firstly, lifestyle modification needs to incorporate
mental health as an integrated component of the program because of their
relationships. Second, among all of the four factors, physical activity should be the
first priority due to its robust protective impact. Finally, the framework indicates for
women with diabetes, health professionals should work hard to enhance self-efficacy.

226
Figure 7.1. A conceptual framework for the relationships between lifestyle factors and mental health among Australian midlife and
older women.
Positive relationship Negative relationship
227
Strengths and Limitations
The strengths of the current research include the following: the study utilises
a large number and representative sample of midlife and older women. A
longitudinal prospective approach is applied to examine the temporal relationships
between lifestyle factors and mental health. In addition, the research study includes a
clinical population of women with diabetes and is able to conduct a comparative
study between general and clinical populations. The comparative study extends the
knowledge obtained from examining general populations, overcomes a shortage of
previous studies, and further enhances the understanding of the relationships
between lifestyle factors and mental health. More importantly, a theoretical
framework based on the social cognitive theory is used to explain the relationships
between mental health and lifestyle factors, which contribute knowledge about
behavioural change mechanisms in order to assist in the further development of
useful intervention. This is one of the few studies using an exclusive female sample
aged 45 years and older, which is important as the knowledge generated from the
study may facilitate healthy aging for women.
Based on the HOW project, the research has investigated the temporal
relationships between lifestyle factors and mental health over a period of five years.
The advantage of having an extended time frame is that it permits relatively reliable
observation of the improvement or deterioration of mental health problems, which
are chronic conditions that may not be easily observable in a shorter period (Pasco et
al., 2008). Furthermore, the study also acknowledges the potential interactions
among lifestyle factors themselves, and examines their relationships with each other
before analysing their individual effects on mental health. By doing this, the
interpretation of the individual temporal relationships between lifestyle factors and

228
mental health can be partly linked to the characteristics of other lifestyle factors at a
population level, thus enabling a more comprehensive understanding of this research
question in this female population. The results offer valuable information to health
promotion for women of this age group and give suggestions about some areas
worthy of attention from the psychological point of view.
The research study also clarifies the differences in mental health between
women with and without diabetes, and furthermore, finds out the factors that
contribute to this difference. As highlighted in a systematic review on the prevalence
of depression among people with diabetes (Ali et al., 2006), the diabetic and
non-diabetic populations included in many studies differed on variables that are
associated with depression, such as lifestyle factors. The current study addressed this
issue by controlling for a number of lifestyle factors and co-morbidities as well, thus
the results may be more reliable. It should be noticed that when comparing women
with and without diabetes, the age of the two groups did not match, which may have
introduced some bias into the results. But statistical analysis was controlled to
minimise the bias. In addition, although the study clearly shows that a low level of
physical activity is one of the important factors in relation to lower levels of mental
health among women with diabetes, no causal relationship is indicated due to a
cross-sectional design.
The reliance on self-reporting measures for all of the variables in the study
may introduce some information bias to the study. For example, when using a
self-report strategy to obtain people’s height and weight, the BMI is often
underestimated. This is because, intentionally or not, people tend underestimate
weight and overestimate height (Gorber et al., 2007). But given the large sample size
of the study, obtaining an objective measurement of height and weight is financially

229
very difficult. Hence, a self-reported BMI has been applied. Despite the disadvantage
of using a self-reported BMI, there is evidence showing that in women, a substantial
strong agreement exists between measured and self-reported BMIs, except for
women who are pregnant, older than 75 years or without physician visits (Craig &
Adams, 2009). Apart from BMI, the assessment of alcohol drinking in the study is
frequency focused; therefore, the actual quantity of alcohol consumed per occasion
cannot be calculated. In this case, abnormal drinking patterns (e.g. binge drinking)
are not examined. However, as discussed, the prevalence of risky and high risk
drinking among this particular population is quite low, so, the possibility of failing to
capture abnormal drinking is low.
The literature indicates two ways of assessing mental health, which are
clinical interviews or self-report psychometric scales. In the current study, mental
health is examined by using self-report psychological scales. Some argue that
clinical interviews are objective methods, which are considered to be more reliable
and valid than psychometric scales. However, the interest of the current research is
not clinical mental health disorders, such as major depression, but more on women’s
mental health symptoms, which can be much more minor. In addition, the
measurement tools of mental health utilised in the study are all well validated and
appropriate to the study population.
As highlighted by Bandura, the measurement of self-efficacy should be
circumstance specific, indicating a high level of self-efficacy in one domain does not
necessarily imply the same level of confidence in the other. For example, someone
with high self-efficacy in mathematics does not necessarily feel confident in
literature. In the current study, self-efficacy in managing chronic disease is evaluated,
while the examined behaviours are health related lifestyle such as physical activity.
230
Managing chronic diseases is a multitask which involves other activities beyond
lifestyle modification, for example, adhering medications. From this point of view,
self-efficacy in managing chronic diseases may not be the most accurate measure of
women’s self-efficacy in improving their lifestyles. However, it needs to be noticed
that self-efficacy also has the property of generality (Bandura, 1997), which means
that self-efficacy in one area can actually be extended to another. Given that lifestyle
modification is one of the integrated aspects of chronic diseases management,
women’s confidence in their abilities to manage chronic diseases may still be a good
reflection of the self-efficacy in exercise or diet. In addition, this scale of
self-efficacy in managing chronic disease has other advantages, too. First, it suits the
population among whom multiple chronic conditions are not uncommon, despite the
focus on diabetes. Second, it is a brief version containing six items only, which is
unlikely to burden participants, and the possibility of inaccurate responses resulting
from tiredness from filling out the questionnaires is low.
This research study examines the relationships between mental health and
lifestyle factors by using both longitudinal and cross-sectional designs, and is able to
compare the general population with a clinical cohort. The usefulness of social
cognitive theory in explaining these relationships is examined as well. It is expected
that knowledge generated from the study will contribute to the study of women’s
health, especially in the areas of healthy ageing and health promotion.

231
CHAPTER 8: CONCLUSIONS
Introduction
This chapter starts with a brief summary of the major findings of the research,
followed by the implications generated from the research for education, research and
policy development, respectively, and finally finishes with the conclusions for the
study. The current research attempts to develop a comprehensive understanding of
the effect of lifestyle factors on mental health in Australian midlife and older women.
It has the potential to enhance the knowledge of health professionals, researchers and
policy makers with regard to lifestyle factors from a psychological perspective. It
may also be beneficial to the development of health promotion programs that aim to
improve the lifestyles and mental health for women in Australia.
Summary of Major Findings
Effect of Lifestyle Factors on Mental Health in Midlife and Older Women
The four lifestyle factors of overweight and obesity, physical activity,
smoking and alcohol use have a different impact on mental health among midlife and
older women.
First, women with a higher BMI have lower levels of mental health
(depression and general mental health) than women with normal weight. However,
as women age, the mental health of women who are overweight and obese becomes
better than that of women with normal weight. Second, women who are physically
active have higher levels of mental health than those who are not. Third, smoking
adversely impacts on their mental health. This negative effect may not exhibit when
women were younger, yet the adverse effect of smoking is clear over the long term.
232
Fourth, those who were formerly drinkers of alcohol had fewer anxiety symptoms
than women who were always non-drinkers, as both groups age.
Although the patterns of the relationship of each individual lifestyle factor
with mental health varies, all the evidence supports women living with a healthier
lifestyle have a better status of mental health. Among the four modifiable lifestyle
factors, physical activity is deemed to be particularly important for midlife and older
women due to its strong association with mental health and the effects produced on
other lifestyle factors.
Effect of Lifestyle Factors on Mental Health in Midlife and Older Women With and
Without Diabetes
Women with diabetes do have lower levels of mental health than women
without. However, the difference is not related with diabetes per se, rather, it is
contributed to by the low level of physical activity and the higher number of
co-morbidities that women with diabetes commonly present.
This finding extends and verifies the knowledge about the relationship
between physical activity and mental health. More importantly, it sheds light on the
development of strategies that could be used in improving the mental health of
women with diabetes. Given the effect of physical activity on mental health, and its
modifiable nature, it is believed that physical activity promotion will benefit midlife
and older women both physically and psychologically.
233
The Mediating Role of Self-Efficacy in the Associations Between Lifestyle Factors
and Mental Health Among Midlife and Older Women With Diabetes
Self-efficacy fully mediates the effect of the lifestyle factors of BMI and
physical activity on depression. Women with longer durations of diabetes have lower
levels of self-efficacy in managing chronic diseases, suggesting a strong need for
interventions facilitating women to master chronic disease management skills. In
addition, women using antidepressants have lower levels of self-efficacy than
women who do not.
Based on the findings, self-efficacy enhancement strategies may be
particularly important for mental health improvement. Previous studies consistently
show that people with higher levels of self-efficacy are more likely to assume
successful behaviour changes, while the current studies suggest that individuals are
also likely to benefit psychologically if their self-efficacy is enhanced. Therefore,
future intervention programs should continue to place a heavy emphasis on
facilitating people’s self-efficacy by providing for the four major sources of
self-efficacy in an effective manner.
Implications
Implications of the Study
The profile of lifestyle factors among Australian midlife and older women
illustrates that concerted effort should be made towards promoting and stabilising
physical activity. The impact of alcohol use on mental health seems minor among
women. Considering the low prevalence of risky and high risk drinking, alcohol use
may not be the major target of health promotion for this population, but this finding
234
may not apply to other populations such as males (Australian Bureau of Statistics,
2006c). A great number of studies indicate overweight and obesity is related with
more severe mental health problems (Carroll et al., 2010; Kasen et al., 2008;
Luppino et al., 2010), but the current study shows the mental health of women who
are overweight and obese improves better as women age. Although the traditional
view of middle age consistently links middle age with stress, decline of health and so
forth, middle age is also characterised by career success, release from child-bearing
responsibilities, financial stability (Australian Bureau of Statistics, 2006d) and more
personal space (Hunter et al., 2002).
Overall, in health promotion for midlife and older women, physical activity is
the priority. It is a robust protector of mental health for women with and without
diabetes. In addition, physical activity is also one of the essential strategies for losing
weight (Hamman et al., 2006); therefore, focusing on physical activity also facilitates
weight management at the same time. Emphasis on physical activity rather than BMI
value may also help to avoid potential distress resulting from failure or fluctuation of
weight loss (Teixeira et al., 2002).
In terms of how to motivate women to increase their levels of physical
activity, self-efficacy can never be overemphasised. Women with high self-efficacy
have better mental health and healthier lifestyle factors, and self-efficacy is the
mediator in the relationship between mental health and lifestyle factors. Thus, there
is solid evidence that self-efficacy should be centrally targeted in behaviour change
programs, which is likely to benefit women both psychologically and physically.
235
Implications for Health Education
The percentages of elderly people in Australia continue to expand (Australian
Bureau of Statistics, 2008b), so does the proportion of chronic diseases within this
population (Australian Bureau of Statistics, 2006f). Leading a healthy lifestyle at
midlife is considered to be vitally important for preventing and improving clinical
outcomes of chronic diseases amongst older population. Therefore, motivating
clients to make lifestyle changes will continue to be a major task of health
professionals. When conducting health education regarding lifestyle change for
clients, health providers need to bear in mind that women who live with unhealthy
lifestyles also have lower levels of mental health, which may affect their ability to
make successful lifestyle changes (Wott & Carels, 2010). It is recommended that
before consultation, health professionals conduct a systematic assessment of clients’
lifestyle and mental health status. The assessment of lifestyle factors allows health
professionals to individualise their care (Clark & Hampson, 2001) and possibly
effective use of limited clinical resources. Some brief mental health assessment tools
like HADS may be helpful in identify potential mental health problems in a timely
manner, and provide useful information for further consultation. If a client is found
to have mental issues, health professionals may want to help them solve these
problems first. If a client is mentally well, but still reporting difficulty in changing
lifestyle, health professionals may need to consider whether any of the
socio-environmental factors is preventing him/her from to do so (Strayhorn, 2009).
Moreover, it is worthwhile for health professionals to work towards
self-efficacy enhancement by providing clients with the four sources of self-efficacy
proposed by Bandura (1997). Task accomplishment is the strongest source of
gaining confidence. Setting up reasonable goals for changes within set time periods
236
for clients and implementing individualised care are important strategies to realise
optimal behavioural change at each stage. After a certain period of practice, it is
important to review the progress of behavioural change. This is a great opportunity
to evaluate the previously developed plan and bring up with solutions to problems if
there is any. In brief, health professionals shall spare no effort to facilitate clients to
make positive lifestyle change. It is a long journey and it is not easy, but it is
certainly worth all the effort.
Implications for Policy Making
The importance of a healthy lifestyle is clearly illustrated in the current
research which has been informed by a psychological perspective. Considering the
existing literature on the impacts of lifestyle factors on physical health, it is
concluded that a healthy lifestyle can benefit individuals both physically (Breslow et
al., 2001; Ma et al., 2008; Parker et al., 2007; Rothenbacher et al., 2006) and
psychologically. Therefore, lifestyle promotion or modification should continue to
be the focus of policy development. At the policy making level, governments should
work very closely and intensively with researchers and health professionals in this
field. They should utilise the knowledge generated from the clinical practice as well
as research field to develop targeted policies to facilitate behavioural changes. For
example, if a lack of safe environment and instruments prevents a large number of
people exercising, building such infrastructures would be a very appropriate and
effective approach (American Heart Association, 2006; Strayhorn, 2009). Or, if the
public have little awareness of access to health care or the potential consequences of
living unhealthy lifestyle, mass media can be used to disseminate information.

237
In the meantime, government or policy makers should also strive to create a
supportive environment for researchers and clinicians, as they are the driving force
of improving lifestyle for the population. Adequate support will motivate clinicians
to work more efficiently with clients and also allow researchers to conduct large
scale and rigorous studies to inform policy making in turn. In addition, government
should aim to largely promote collaboration between clinicians and researchers. It is
important to translate knowledge from the research to the first line of practice;
therefore, clinicians can be informed with the most updated information and
researchers can apply their research into practice. Not only government, but also
employers are able to contribute to health promotion for their staffs. For example,
organisations can encourage employees to use stairs as means of increasing physical
activity.
In brief, government and policy makers are at vital position in promoting
health for the society. If they make tireless effort to create a supportive environment
for both research and clinical practice, achieving the goal of health promotion may
become easier.
Implications for Future Research
The longitudinal analysis in the current research offers valuable information
about the temporal effect of lifestyle factors on mental health among midlife and
older women from the general population over an extended time frame. However,
one’s lifestyle can change overtime (Sternfeld et al., 2004). A woman who has a
sedentary lifestyle can initiate regular physical activity, and in contrast, a slim and
healthy woman can also put on weight. In other words, there is a fair chance that
women’s lifestyle patterns alternate over time. In this case, capturing the changes of

238
lifestyle patterns of participants becomes essential. Future research may need to
follow the participants more frequently when research resources permit, in order to
develop a better understanding of the effect of lifestyle factors on mental health.
The sample size in the study examining the mediating role of self-efficacy
may not be adequate; therefore, when considering depression as predictor and
lifestyle factors as outcomes, the mediating effect of self-efficacy failed to be
detected. A larger sample size is needed to overcome the collinearity effect between
self-efficacy and depression. In addition, further studies may be warranted to include
other potential mediators to validate the mediating role of self-efficacy. Due to the
cross-sectional design, the causal relationship between self-efficacy, lifestyle factors
and mental health cannot be determined. It is recommended that the psychological
effect of interventions based on self-efficacy should be evaluated in future research.
Conclusions
The current research investigates the longitudinal impact of lifestyle factors
on mental health among a large and representative sample of midlife and older
women from the general community; examines the difference in mental health
between midlife and older women with and without diabetes as well as the
contributing effect of lifestyle factors to the disparities; and tests the mediating effect
of self-efficacy in explaining the relationships between lifestyle factors and mental
health among midlife and older women with diabetes.
Women living with unhealthy lifestyles generally have lower levels of mental
health. Diabetes does have an impact on mental health. To be precise, low levels of
physical activity and other co-morbidities, which are related to diabetes, produce a
negative effect on mental health. This finding highlights that the mental health of
women with diabetes can be improved by increasing their physical activity levels.

239
The social cognitive theory explains part of the relationships between mental health
and lifestyle factors, and there is strong evidence to suggest that self-efficacy is the
mediator of the effect of lifestyle factors on mental health. It is recommended that
future research should focus on enhancing the self-efficacy of participants to
improve their mental health.
240
REFERENCES
Aberle, I., Scholz, U., Bach-Kliegel, B., Fischer, C., Gorny, M., Langer, K., et al.
(2009). Psychological aspects in continuous subcutaneous insulin infusion: A
retrospective study. Journal of Psychology, 143(2), 147-160.
Ajzen, I. (1991). The theory of planned behavior. Organizational Behavior and
Human Decision Processes, 50(2), 179-211.
Ajzen, I., & Fishbein, M. (1980). Understanding attitudes and predicting social
behavior. Englewood Cliffs: Prentice-Hall.
Al-Delaimy, W. K., Willett, W. C., Manson, J. E., Speizer, F. E., & Hu, F. B. (2001).
Smoking and mortality among women with type 2 diabetes: The Nurses'
Health Study cohort. Diabetes Care, 24(12), 2043-2048.
Alati, R., Kinner, S., Najman, J. M., Fowler, G., Watt, K., & Green, D. (2004).
Gender differences in the relationships between alcohol, tobacco and mental
health in patients attending an emergency department. Alcohol and
Alcoholism, 39(5), 463-469.
Alati, R., Lawlor, D. A., Najman, J. M., Bor, W., O'Callaghan, M., & Williams, G.
M. (2005). Is there really a 'J-shaped' curve in the association between
alcohol consumption and symptoms of depression and anxiety? Findings
from the Mater- University Study of Pregnancy and its outcomes. Addiction,
100(5), 643-651.
Ali, S., Stone, M. A., Peters, J. L., Davies, M. J., & Khunti, K. (2006). The
prevalence of co-morbid depression in adults with Type 2 diabetes: a
systematic review and meta-analysis. Diabetic Medicine, 23(11), 1165-1173.
American Heart Association. (2010). Women and cardiovascular disease:statistics.
Retrieved 22 November 2009, from
241
http://www.americanheart.org/downloadable/heart/1260905040318FS10WM
10.pdf
American Heart Association. (2006). Physical activity intervention studies: what we
know and what we need to know: a scientific statement from the American
Heart Association Council on Nutrition, Physical Activity, and Metabolism
(subcommittee on physical activity); Council on Cardiovascular Disease in
the Young; and the Interdisciplinary Working Group on Quality of Care and
Outcomes Research. Circulation, 114, 2379-2752.
Anderson, D., Lang, C. P., & Xu, Q. (2010). Is lifestyle intervention for mature
women in the general population suitable for patients with diabetes?
Preliminary results comparing two populations. Paper presented at the
Women's Health: The 18th Annual Congress. Washington D.C., U.S.A.
Anderson, D., Mizzari, K., Kain, V., & Webster, J. (2006). The effects of a
multimodal intervention trial to promote lifestyle factors associated with the
prevention of cardiovascular disease in menopausal and postmenopausal
Australian women. Health Care for Women International, 27(3), 238-253.
Anderson, D., Yoshizawa, T., Gollschewski, S., Atogami, F., & Courtney, M. (2004).
Menopause in Australia and Japan: effects of country of residence on
menopausal status and menopausal symptoms. Climacteric, 7(2), 165-174.
Anderson, D. J., & Yoshizawa, T. (2007). Cross-cultural comparisons of
health-related quality of life in Australian and Japanese midlife women: the
Australian and Japanese Midlife Women's Health Study. Menopause, 14(4),
697-707.
Anderson, R. J., Grigsby, A. B., Freedland, K. E., de Groot, M., McGill, J. B.,
Clouse, R. E., et al. (2002). Anxiety and poor glycemic control: a

242
meta-analytic review of the literature. International Journal of Psychiatry in
Medicine, 32(3), 235-247.
Aoyagi, Y., Park, H., Park, S., & Shephard, R. J. (2010). Habitual physical activity
and health-related quality of life in older adults: Interactions between the
amount and intensity of activity (the Nakanojo Study). Quality of Life
Research, 19(3), 333-338.
Araya, R., Gaete, J., Rojas, G., Fritsch, R., & Lewis, G. (2007). Smoking and
common mental disorders: a population-based survey in Santiago, Chile.
Social Psychiatry and Psychiatric Epidemiology, 42(11), 874-880.
Atlantis, E., & Baker, M. (2008). Obesity effects on depression: systematic review of
epidemiological studies. International Journal of Obesity, 32(6), 881-891.
Australian Bureau of Statistics. (1997). Mental health and Wellbeing: profile of
adults, Australia (No. 4326.0). Canberra: Australian Bureau of Statistics.
Australian Bureau of Statistics. (2006a). Census of population and housing: media
releases and fact sheets (2914.0.55.002). Canberra: Australian Bureau of
Statistics.
Australian Bureau of Statistics. (2006b). Tobacco smoking in Australia: a snapshot,
2004-2005 (4831.0.55.001). Canberra: Australian Bureau of Statistics.
Australian Bureau of Statistics. (2006c). Alcohol consumption in Australia: a
snapshot, 2004-05 (4832.0.55.001). Canberra: Australian Bureau of
Statistics.
Australian Bureau of Statistics. (2006d). Australian social trends 2006 (4102.0).
Canberra: Australian Bureau of Statistics.

243
Australian Bureau of Statistics. (2006e). Diabetes in Australia: a snapshot, 2004-05
(4820.0.55.001). Canberra: Australian Bureau of Statistics.
Australian Bureau of Statistics. (2006f). National health survey: summary of results,
2004-2005 (4364.0). Canberra: Australian Bureau of Statistics.
Australian Bureau of Statistics. (2006g). Physical activity in Australia: a snapshot,
2004-2005 (4835.0.55.001). Canberra: Australian Bureau of Statistics.
Australian Bureau of Statistics. (2007). National survey of mental health and
wellbeing: summary of results (4326.0). Canberra: Australian Bureau of
Statistics.
Australian Bureau of Statistics. (2008a). Overweight and obesity in adults
2004-2005 (4719.0). Canberra: Australian Bureau of Statistics.
Australian Bureau of Statistics. (2008b). Population projections, Australia (cat no.
3222.0). Canberra: Australian Bureau of Statistics.
Australian Bureau of Statistics. (2009). National health survey: summary of results,
2007-2008 (4364.0). Canberra: Australian Bureau of Statistics.
Australian Institute of Health and Welfare. (2004). Lonitudinal studies of ageing:
implications for future studies. Retrieved 22 November, from
http://www.aihw.gov.au/publications/age/lsa/lsa.pdf
Australian Institute of Health and Welfare. (2008). Diabetes Australian facts 2008
(No. CVD 40). Canberra: AIHW.
Avis, N. E., Stellato, R., Crawford, S., Bromberger, J., Ganz, P., Cain, V., et al.
(2001). Is there a menopausal syndrome? Menopausal status and symptoms
across racial/ethnic groups. Social Science & Medicine, 52(3), 345-356.

244
Ballard, K. D., Kuh, D. J., & Wadsworth, M. E. J. (2001). The role of the menopause
in women's experiences of the 'change of life'. Sociology of Health and
Illness, 23(4), 397-424.
Bandura, A. (1977). Self-efficacy: toward a unifying theory of behavioral change.
Psychol Rev, 84(2), 191-215.
Bandura, A. (1986). Social foundations of though and action: a social cognitive
theory. Englewood Cliffs, N.J.: Prentice-Hall.
Bandura, A. (2004). Health promotion by social cognitive means. Health Education
& Behavior, 31(2), 143-164.
Bandura., A. (1997). Self-efficacy: the exercise of control. New York: W.H.
Freeman.
Baron, R. M., & Kenny, D. A. (1986). The moderator-mediator variable distinction
in social psychological research: Conceptual, strategic, and statistical
considerations. Journal of Personality and Social Psychology, 51(6),
1173-1182.
Barr, E. L. M., Magliano, D. J., Zimmet, P. Z., Polkinghorne, K. R., Atkins, R. C.,
Dunstan, D. W., et al. (2005). AusDiab 2005-the Australian diabetes,obesity
and lifestyle study. Retrieved 22 November 2009, from
http://www.diabetes.com.au/pdf/AUSDIAB_Report_Final.pdf
Barry, D., Pietrzak, R. H., & Petry, N. M. (2008). Gender differences in associations
between body mass index and DSM-IV mood and anxiety disorders: results
from the National Epidemiologic Survey on Alcohol and Related Conditions.
Annals of Epidemiology, 18(6), 458-466.
245
Bauman, A., & Owen, N. (1999). Physical activity of adult Australians:
epidemiological evidence and potential strategies for health gain. Journal of
Science and Medicine in Sport / Sports Medicine Australia, 2(1), 30-41.
Begg, S., Vos, T., Barker, B., Stevenson, C., Stanley, L., & Lopez, A. D. (2007). The
burden of disease and injury in Australia 2003. Canberra:AHIW.
Bender, T., Nagy, G., Barna, I., Tefner, I., Kadas, E., & Geher, P. (2007). The effect
of physical therapy on beta-endorphin levels. European Journal of Applied
Physiology, 100(4), 371-382.
Bhui, K., & Fletcher, A. (2000). Common mood and anxiety states: gender
differences in the protective effect of physical activity. Social Psychiatry and
Psychiatric Epidemiology, 35(1), 28-35.
Bjerkeset, O., Romundstad, P., Evans, J., & Gunnell, D. (2008). Association of adult
body mass index and height with anxiety, depression, and suicide in the
general population: the HUNT study. American Journal of Epidemiology,
167(2), 193-202.
Bonnet, F., Irving, K., Terra, J. L., Nony, P., Berthezene, F., & Moulin, P. (2005).
Anxiety and depression are associated with unhealthy lifestyle in patients at
risk of cardiovascular disease. Atherosclerosis, 178(2), 339-344.
Bornstein, S. R., Schuppenies, A., Wong, M. L., & Licinio, J. (2006). Approaching
the shared biology of obesity and depression: the stress axis as the locus of
gene-environment interactions. Molecular Psychiatry, 11(10), 892.
Bowser, D. M., Utz, S., Glick, D., Harmon, R., & Rovnyak, V. (2009). The
relationship between diabetes mellitus, depression, and missed appointments
in a low-income uninsured population. Diabetes Educator, 35(6), 966-977.

246
Breslow, R. A., Ballard-Barbash, R., Munoz, K., & Graubard, B. I. (2001).
Long-term recreational physical activity and breast cancer in the National
Health and Nutrition Examination Survey I epidemiologic follow-up study.
Cancer Epidemiology, Biomarkers & Prevention, 10(7), 805-808.
Briffa, T. G., Maiorana, A., Sheerin, N. J., Stubbs, A. G., Oldenburg, B. F., Sammel,
N. L., et al. (2006). Physical activity for people with cardiovascular disease:
recommendations of the National Heart Foundation of Australia. The Medical
Journal of Australia, 184(2), 71-75.
Brown, W. J., Ford, J. H., Burton, N. W., Marshall, A. L., & Dobson, A. J. (2005).
Prospective study of physical activity and depressive symptoms in
middle-aged women. American Journal of Preventive Medicine, 29(4),
265-272.
Bruffaerts, R., Demyttenaere, K., Vilagut, G., Martinez, M., Bonnewyn, A., De
Graaf, R., et al. (2008). The relation between body mass index, mental health,
and functional disability: a European population perspective. Canadian
Journal of Psychiatry, 53(10), 679-688.
Byles, J., Young, A., Furuya, H., & Parkinson, L. (2006). A drink to healthy aging:
The association between older women's use of alcohol and their
health-related quality of life. Journal of the American Geriatrics Society,
54(9), 1341-1347.
Cai, L., Lubitz, J., Flegal, K. M., & Pamuk, E. R. (2010). The predicted effects of
chronic obesity in middle age on medicare costs and mortality. Med Care,
48(6), 510-517.
Caldwell, T. M., Rodgers, B., Jorm, A. F., Christensen, H., Jacomb, P. A., Korten, A.
E., et al. (2002). Patterns of association between alcohol consumption and
247
symptoms of depression and anxiety in young adults. Addiction, 97(5),
583-594.
Cameron, A. J., Dunstan, D. W., Owen, N., Zimmet, P. Z., Barr, E. L., Tonkin, A.
M., et al. (2009). Health and mortality consequences of abdominal obesity:
evidence from the AusDiab study. Medical Journal of Australia, 191(4),
202-208.
Capewell, S., Ford, E. S., Croft, J. B., Critchley, J. A., Greenlund, K. J., & Labarthe,
D. R. (2009). Cardiovascular risk factor trends and potential for reducing
coronary heart disease mortality in the United States of America. Bulletin of
the World Health Organisation, 88(2), 120-130.
Carpenter, K. M., Hasin, D. S., Allison, D. B., & Faith, M. S. (2000). Relationships
between obesity and DSM-IV major depressive disorder, suicide ideation,
and suicide ideation and suicide attempts: results from a general population
study. American Journal of Public Health, 90(2), 251-257.
Carr, D., & Friedman, M. A. (2005). Is obesity stigmatizing? Body weight,
perceived discrimination, and psychological well-being in the United States.
Journal of Health and Social Behavior, 46(3), 244-259.
Carroll, D., Blanck, H., Serdula, M., & Brown, D. (2010). Obesity, physical activity,
and depressive symptoms in a cohort of adults aged 51 to 61. Journal of
Aging and Health, 22(3), 384-398.
Cassidy, A. E., Bielak, L. F., Zhou, Y., Sheedy, P. F., 2nd, Turner, S. T., Breen, J. F.,
et al. (2005). Progression of subclinical coronary atherosclerosis: does
obesity make a difference? Circulation, 111(15), 1877-1882.
Chan, A. M., von Muhlen, D., Kritz-Silverstein, D., & Barrett-Connor, E. (2009).
Regular alcohol consumption is associated with increasing quality of life and
248
mood in older men and women: the Rancho Bernardo Study. Maturitas,
62(3), 294-300.
Chen, R. Q., Davis, S. R., Wong, C. M., & Lam, T. H. (2010). Validity and cultural
equivalence of the standard Greene Climacteric Scale in Hong Kong.
Menopause, 17(3), 630-635.
Chen, Y., Jiang, Y., & Mao, Y. (2009). Association between obesity and depression
in Canadians. Journal of Women's Health, 18(10), 1687-1692.
Chrousos, G. P. (2000). The role of stress and the hypothalamic-pituitary-adrenal
axis in the pathogenesis of the metabolic syndrome: neuro-endocrine and
target tissue-related causes. International Journal of Obesity and Related
Disorders, 24(S2), S50.
Chu, S. Y., Callaghan, W. M., Kim, S. Y., Schmid, C. H., Lau, J., England, L. J., et
al. (2007). Maternal obesity and risk of gestational diabetes mellitus.
Diabetes Care, 30(8), 2070-2076.
Ciechanowski, P. S., Katon, W. J., & Russo, J. E. (2000). Depression and diabetes:
impact of depressive symptoms on adherence, function, and costs. Archives
of Internal Medicine, 160(21), 3278-3285.
Clark, M., & Hampson, S. E. (2001). Implementing a psychological intervention to
improve lifestyle self-management in patients with Type 2 diabetes. Patient
Education and Counselling, 42(3), 247-256.
Cohen, J. W. (1988). Statistical power analysis for the behavioural sciences (2nd ed.).
Hillsdale, NJ: Lawrence Erlbaum Associates.
Cohen, L. S., Soares, C. N., Vitonis, A. F., Otto, M. W., & Harlow, B. L. (2006).
Risk for new onset of depression during the menopausal transition: the
249
Harvard study of moods and cycles. Archives of General Psychiatry, 63(4),
385-390.
Colagiuri, S., Lee, C. M. Y., Colagiuri, R., Magliano, D., Shaw, J. E., Zimmet, P. Z.,
et al. (2010). The cost of overweight and obesity in Australia. The Medical
Journal of Australia, 192(5), 260-264.
Collaris, R., Sidhu, K., & Chan, J. M. (2010). Prospective follow-up of changes in
menopausal complaints and hormone status after surgical menopause in a
Malaysian population. Menopause, 17(2), 351-358.
Collins, M. M., Corcoran, P., & Perry, I. J. (2009). Anxiety and depression
symptoms in patients with diabetes. Diabetic Medicine, 26(2), 153-161.
Craig, B. M., & Adams, A. K. (2009). Accuracy of body mass index categories
based on self-reported height and weight among women in the United States.
Maternal & Child Health Journal, 13(4), 489-496.
Cuijpers, P., Smit, F., Ten Have, M., & De Graaf, R. (2007). Smoking is associated
with first-ever incidence of mental disorders: a prospective population-based
study. Addiction, 102(8), 1303-1309.
Cummings, K. M., Jette, A. M., & Rosenstock, I. M. (1978). Construct validation of
the health belief model. Health Education Monographs, 6(4), 394-405.
De Jonge, P., Roy, J. F., Saz, P., Marcos, G., & Lobo, A. (2006). Prevalent and
incident depression in community-dwelling elderly persons with diabetes
mellitus: results from the ZARADEMP project. Diabetologia, 49(11),
2627-2633.
De Moor, M. H. M., Beem, A. L., Stubbe, J. H., Boomsma, D. I., & De Geus, E. J. C.
(2006). Regular exercise, anxiety, depression and personality: A
population-based study. Preventive Medicine, 42(4), 273-279.
250
Deecher, D., Andree, T. H., Sloan, D., & Schechter, L. E. (2008). From menarche to
menopause: Exploring the underlying biology of depression in women
experiencing hormonal changes. Psychoneuroendocrinology, 33(1), 3-17.
Degenhardt, L., & Hall, W. (2003). Patterns of co-morbidity between alcohol use
and other substance use in the Australian population. Drug and Alcohol
Review, 22(1), 7-13.
Degges-White, S., & Myers, J. E. (2006). Women at midlife: an exploration of
chronological age, subjective age, wellness, and life satisfaction. Adultspan
Journal, 5(2), 67-80.
Department of Health and Ageing. (2008). Lifescripts. Retrieved 22 November 2009,
from
http://www.health.gov.au/internet/main/publishing.nsf/Content/health-pubhlt
h-strateg-lifescripts-index.htm
Dhaliwal, S. S., & Welborn, T. A. (2009). Central obesity and cigarette smoking are
key determinants of cardiovascular disease deaths in Australia: a public
health perspective. Prev Med, 49(2-3), 153-157.
DiClemente, R. J., Crosby, R. A., & Kegler, M. C. (2009). Emerging theories in
health promotion practice and research (2nd ed.). San Francisco:
Jossey-Bass.
Dierker, L. C., Avenevoli, S., Stolar, M., & Merikangas, K. R. (2002). Smoking and
depression: an examination of mechanisms of comorbidity. The American
Journal of Psychiatry, 159(6), 947-953.
Donaghy, M. E. (2007). Exercise can seriously improve your mental health: fact or
fiction? Advances in Physiotherapy, 9(2), 76-88.
251
Dong, C., Sanchez, L. E., & Price, R. A. (2004). Relationship of obesity to
depression: a family-based study. International Journal of Obesity & Related
Metabolic Disorders, 28(6), 790-795.
Doyle, F., McGee, H. M., De La Harpe, D., Shelley, E., & Conroy, R. N. (2006).
The Hospital Anxiety and Depression Scale depression subscale, but not the
Beck Depression Inventory-Fast Scale, identifies patients with acute coronary
syndrome at elevated risk of 1-year mortality. Journal of Psychosomatic
Research, 60(5), 461-467.
Ducci, F., Enoch, M.-A., Funt, S., Virkkunen, M., Albaugh, B., & Goldman, D.
(2007). Increased anxiety and other similarities in temperament of alcoholics
with and without antisocial personality disorder across three diverse
populations. Alcohol, 41(1), 3-12.
Dunbar, J. A., Reddy, P., Davis-Lameloise, N., Philpot, B., Laatikainen, T.,
Kilkkinen, A., et al. (2008). Depression: an important comorbidity with
metabolic syndrome in a general population. Diabetes Care, 31(12),
2368-2373.
Duncan, B., & Rees, D. I. (2005). Effect of smoking on depressive symptomatology:
a reexamination of data from the National Longitudinal Study of Adolescent
Health. American Journal of Epidemiology, 162(5), 461-470.
Dunn, A. L., Trivedi, M. H., & O'Neal, H. A. (2001). Physical activity dose-response
effects on outcomes of depression and anxiety. Medicine and Science in
Sports Exercise, 33(Suppl. 6), S587-597.
Dzewaltowski, D. A., Noble, J. M., & Shaw, J. M. (1990). Physical activity
participation: Social cognitive theory versus the theories of reasoned action
252
and planned behavior. Journal of Sport & Exercise Psychology, 12(4),
388-405.
Ebrahim, S., Beswick, A., Burke, M., & Davey Smith, G. (2009). Multiple risk
factor interventions for primary prevention of coronary heart disease.
Cochrane Database of Systematic Reviews, 4, Art. No.: CD001561. DOI:
10.1002/14651858.CD001561.pub2
Egede, L. E. (2004). Effects of depression on work loss and disability bed days in
individuals with diabetes. Diabetes Care, 27(7), 1751-1753.
Elgar, F. J., & Stewart, J. M. (2008). Validity of self-report screening for overweight
and obesity. Evidence from the Canadian Community Health Survey.
Canadian Journal of Public Health, 99(5), 423-427.
Emmanuel, G., & Jatkin, D. K. (2007). Risk of dementia with increased body mass
index. Age and Ageing, 36(1), 23-29.
Eunkyung, P. (2009). Gender as a moderator in the association of body weight to
smoking and mental health. American Journal of Public Health, 99(1),
146-151.
Ezzati, M., Henley, S. J., Lopez, A. D., & Thun, M. J. (2005). Role of smoking in
global and regional cancer epidemiology: current patterns and data needs.
International Journal of Cancer, 116(6), 963-971.
Ezzati, M., & Lopez, A. D. (2004). Regional, disease specific patterns of
smoking-attributable mortality in 2000. Tobacco Control, 13(4), 388-395.
Fine, L. J., Philogene, G. S., Gramling, R., Coups, E. J., & Sinha, S. (2004).
Prevalence of multiple chronic disease risk factors: 2001 National Health
Interview Survey. American Journal of Preventive Medicine, 27(Suppl.1),
18-24.
253
Fishbein., M., & Ajzen., I. (1975). Belief, attitude, intention and behavior: an
introduction to theory an research. Reading, Mass, London:
Addison-Wesley.
Flegal, K. M., Graubard, B. I., Williamson, D. F., & Gail, M. H. (2007).
Cause-specific excess deaths associated with underweight, overweight, and
obesity. Journal of the American Medical Association, 298(17), 2028-2037.
Fox, C. S., Massaro, J. M., Hoffmann, U., Pou, K. M., Maurovich-Horvat, P., Liu, C.
Y., et al. (2007). Abdominal visceral and subcutaneous adipose tissue
compartments: association with metabolic risk factors in the Framingham
Heart Study. Circulation, 116(1), 39-48.
Freeman, E. W., Sammel, M. D., Lin, H., Gracia, C. R., & Kapoor, S. (2008).
Symptoms in the menopausal transition: hormone and behavioral correlates.
Obstetrics & Gynecology, 111(1), 127-136.
Freeman, E. W., Sammel, M. D., Liu, L., Gracia, C. R., Nelson, D. B., & Hollander,
L. (2004). Hormones and menopausal status as predictors of depression in
women in transition to menopause. Archives of General Psychiatry, 61(1),
62-70.
Fu, C.-W., Tan, A. W., Sheng, F., Luan, R.-S., Zhan, S.-Y., Chen, W.-Q., et al.
(2007). The prevalence of anxiety symptoms and depressive symptoms in
patients with somatic disorders in urban China: a multi-center cross-sectional
study. International Journal of Psychiatry in Medicine, 37(2), 185-199.
Fukukawa, Y., Nakashima, C., Tsuboi, S., Kozakai, R., Doyo, W., Niino, N., et al.
(2004). Age Differences in the Effect of Physical Activity on Depressive
Symptoms. Psychology and Aging, 19(2), 346-351.

254
Galán, I., Rodríguez-Artalejo, F., Díez-Gañán, L., Tobías, A., Zorrilla, B., &
Gandarillas, A. (2006). Clustering of behavioural risk factors and compliance
with clinical preventive recommendations in Spain. Preventive Medicine,
42(5), 343-347.
Gallicchio, L., Schilling, C., Miller, S. R., Zacur, H., & Flaws, J. A. (2007).
Correlates of depressive symptoms among women undergoing the
menopausal transition. Journal of Psychosomatic Research, 63(3), 263-268.
Galper, D. I., Trivedi, M. H., Barlow, C. E., Dunn, A. L., & Kampert, J. B. (2006).
Inverse association between physical inactivity and mental health in men and
women. Medicine and Science in Sports and Exercise, 38(1), 173-178.
Gandek, B., Sinclair, S. J., Kosinski, M., & Ware, J. E., Jr. (2004). Psychometric
evaluation of the SF-36 health survey in Medicare managed care. Health
Care Financing Review, 25(4), 5-25.
Gariepy, G., Wang, J., Lesage, A. D., & Schmitz, N. (2010). The longitudinal
association from obesity to depression: results from the 12-year National
Population Health Survey. Obesity, 18(5), 1033-1038.
Gariepy, G., Nitka, D., & Schmitz, N. (2009). The association between obesity and
anxiety disorders in the population: a systematic review and meta-analysis.
International Journal of Obesity, 34(3), 407-419.
Gaylord, G., Gruener, R., Rodgers, J., & Zalice, K. K. (Eds.). (2008).Mental health
nursing. Upper Saddle River, N.J.: Pearson/Prentice Hall.
Goins, R. T., Spencer, S. M., & Krummel, D. A. (2003). Effect of obesity on
health-related quality of life among Appalachian elderly. Southern Medical
Journal, 96(6), 552-557.

255
Goldney, R. D., Dunn, K. I., Air, T. M., Dal Grande, E., & Taylor, A. W. (2009).
Relationships between body mass index, mental health, and suicidal ideation:
population perspective using two methods. The Australian and New Zealand
Journal of Psychiatry, 43(7), 652-658.
Goodwin, R. D. (2003). Association between physical activity and mental disorders
among adults in the United States. Preventive Medicine, 36(6), 698-703.
Goodwin, R. E., & Hamilton, S. P. (2002). Cigarette smoking and panic: the role of
neuroticism. American Journal of Psychiatry, 159(7), 1208-1213.
Gorber, S. C., Tremblay, M., Moher, D., & Gorber, B. (2007). A comparison of
direct vs. self-report measures for assessing height, weight and body mass
index: a systematic review. Obesity Reviews, 8(4), 307-326.
Graham, K., Massak, A., Ders, A., & Rehm, J. (2007). Does the association between
alcohol consumption and depression depend on how they are measured?
Alcoholism, Clinical and Experimental Research, 31(1), 78-88.
Greene, J. G. (n.d.) The greene climacteric scale. Retrieved 6 January 2010, from
http://www.menopausematters.co.uk/greenescale.php, Retrieved on 6 January
2010
Greene, J. G. (1998). Constructing a standard climacteric scale. Maturitas, 29(1),
25-31.
Grigsby, A. B., Anderson, R. J., Freedland, K. E., Clouse, R. E., & Lustman, P. J.
(2002). Prevalence of anxiety in adults with diabetes: a systematic review.
Journal of Psychosomatic Research, 53(6), 1053-1060.
Guh, D. P., Zhang, W., Bansback, N., Amarsi, Z., Birmingham, C. L., & Anis, A. H.
(2009). The incidence of co-morbidities related to obesity and overweight: a
systematic review and meta-analysis. BMC Public Health, 9, 88.
256
Hämäläinen, J., Kaprio, J., Isometsa, E., Heikkinen, M., Poikolainen, K., Lindeman,
S., et al. (2001). Cigarette smoking, alcohol intoxication and major
depressive episode in a representative population sample. Journal of
Epidemiology and Community Health, 55(8), 573-576.
Hach, I., Ruhl, U. E., Klose, M., Klotsche, J., Kirch, W., & Jacobi, F. (2007).
Obesity and the risk for mental disorders in a representative German adult
sample. European Journal of Public Health, 17(3), 297-305.
Hach, I., Ruhl, U. E., Klotsche, J., Klose, M., & Jacobi, F. (2006). Associations
between waist circumference and depressive disorders. Journal of Affective
Disorders, 92(2-3), 305-308.
Haenle, M. M., Brockmann, S. O., Kron, M., Bertling, U., Mason, R. A., Steinbach,
G., et al. (2006). Overweight, physical activity, tobacco and alcohol
consumption in a cross-sectional random sample of German adults. BMC
Public Health, 6, 233-245.
Hamman, R. F., Wing, R. R., Edelstein, S. L., Lachin, J. M., Bray, G. A., Delahanty,
L., et al. (2006). Effect of weight loss with lifestyle intervention on risk of
diabetes. Diabetes Care, 29(9), 2102-2107.
Hardeman, W., Johnston, M., Johnston, D. W., Bonetti, D., Wareham, N. J., &
Kinmonth, A. L. (2002). Application of the Theory of Planned Behaviour in
behaviour change interventions: a systematic review. Psychology & Health,
17(2), 123-158.
Harkonmäki, K., Lahelma, E., Martikainen, P., Rahkonen, O., & Silventoinen, K.
(2006). Mental health functioning (SF-36) and intentions to retire early
among ageing municipal employees: the Helsinki Health Study.
Scandinavian Journal of Public Health, 34(2), 190-198.

257
Hart, C. L., & Smith, G. D. (2009). Alcohol consumption and use of acute and
mental health hospital services in the West of Scotland Collaborative
prospective cohort study. Journal of Epidemiology and Community Health,
63(9), 703-707.
Hasin, D. S., Goodwin, R. D., Stinson, F. S., & Grant, B. F. (2005). Epidemiology of
major depressive disorder: results from the National Epidemiologic Survey
on Alcoholism and Related Conditions. Archives of General Psychiatry,
62(10), 1097-1106.
Hassmén, P., Koivula, N., & Uutela, A. (2000). Physical exercise and psychological
well-being: a population study in Finland. Preventive Medicine, 30(1), 17-25.
Haynes, J. C., Farrell, M., Singleton, N., Meltzer, H., Araya, R., Lewis, G., et al.
(2005). Alcohol consumption as a risk factor for anxiety and depression:
results from the longitudinal follow-up of the National Psychiatric Morbidity
Survey. The British Journal of Psychiatry, 187(6), 544-551.
Healy, J. (2004). The benefits of an ageing population. Retrieved 5 February 2010,
from https://www.tai.org.au/documents/dp_fulltext/DP63.pdf
Heo, M., Pietrobelli, A., Fontaine, K. R., Sirey, J. A., & Faith, M. S. (2006).
Depressive mood and obesity in US adults: comparison and moderation by
sex, age, and race. International Journal of Obesity, 30(3), 513-519.
Hermanns, N., Kulzer, B., Krichbaum, M., Kubiak, T., & Haak, T. (2005). Affective
and anxiety disorders in a German sample of diabetic patients: prevalence,
comorbidity and risk factors. Diabetic Medicine, 22(3), 293-300.
Herrmann, C. (1997). International experiences with the Hospital Anxiety and
Depression Scale-A review of validation data and clinical results. Journal of
Psychosomatic Research, 42(1), 17-41.
258
Hildrum, B., Mykletun, A., Midthjell, K., Ismail, K., & Dahl, A. A. (2009). No
association of depression and anxiety with the metabolic syndrome: the
Norwegian HUNT study. Acta Psychiatrica Scandinavica, 120(1), 14-22.
Hinz, A., & Schwarz, R. (2001). Anxiety and depression in the general population:
normal values in the Hospital Anxiety and Depression Scale. Psychotherapie,
Psychosomatik, Medizinische Psychologie, 51(5), 193-200.
Honarmand, K., & Feinstein, A. (2009). Validation of the Hospital Anxiety and
Depression Scale for use with multiple sclerosis patients. Multiple Sclerosis,
15(12), 1518-1524.
Hrabosky, J. I., & Thomas, J. J. (2008). Elucidating the relationship between obesity
and depression: Recommendations for future research. Clinical Psychology:
Science and Practice, 15(1), 28-34.
Hu, G., Jousilahti, P., Barengo, N. C., Qiao, Q., Lakka, T. A., & Tuomilehto, J.
(2005). Physical activity, cardiovascular risk factors, and mortality among
Finnish adults with diabetes. Diabetes Care, 28(4), 799-805.
Huang, I. C., Frangakis, C., & Wu, A. W. (2006). The relationship of excess body
weight and health-related quality of life: evidence from a population study in
Taiwan. International Journal of Obesity, 30(8), 1250-1259.
Hunter, S., Sundel, S. S., & Sundel, M. (2002).Women at midlife: Life Experiences
and Implications for the Helping Professions.Washington, D.C. : National
Association of Social Workers.
Husky, M. M., Mazure, C. M., Paliwal, P., & McKee, S. A. (2008). Gender
differences in the comorbidity of smoking behavior and major depression.
Drug and Alcohol Dependence, 93(1-2), 176-179.
259
Ismail, K., Winkley, K., Stahl, D., Chalder, T., & Edmonds, M. (2007). A cohort
study of people with diabetes and their first foot ulcer: the role of depression
on mortality. Diabetes Care, 30(6), 1473-1479.
Jackson, T. (2006). Relationships between perceived close social support and health
practices within community samples of American women and men. Journal
of Psychology, 140(3), 229-246.
Janssen, I., Katzmarzyk, P. T., & Ross, R. (2002). Body mass index, waist
circumference, and health risk: evidence in support of current National
Institutes of Health Guidelines. Archives of Internal Medicine, 162(18), 2074.
Jee, S. H., Sull, J. W., Park, J., Lee, S.-Y., Ohrr, H., Guallar, E., et al. (2006).
Body-mass index and mortality in Korean men and women. Journal of the
American Medical Association, 355(8), 779-787.
Jeon, C. Y., Lokken, R. P., Hu, F. B., & Van Dam, R. M. (2007). Physical activity of
moderate intensity and risk of type 2 diabetes: a systematic review. Diabetes
Care, 30(3), 744-752.
John, U., Hanke, M., Rumpf, H. J., & Thyrian, J. R. (2005). Smoking status,
cigarettes per day, and their relationship to overweight and obesity among
former and current smokers in a national adult general population sample.
International Journal of Obesity, 29(10), 1289-1294.
Johnson, J. G., Cohen, P., Pine, D. S., Klein, D. F., Kasen, S., & Brook, J. S. (2000).
Association between cigarette smoking and anxiety disorders during
adolescence and early adulthood. Journal of the American Medical
Association, 284(18), 2348-2351.
260
Johnson, S. S., Driskell, M., Johnson, J. L., Prochaska, J. M., Zwick, W., &
Prochaska, J. O. (2006). Efficacy of a transtheoretical model-based expert
system for antihypertensive adherence. Disease Management, 9(5), 291-301.
Jorm, A. F., Korten, A. E., Christensen, H., Jacomb, P. A., Rodgers, B., & Parslow,
R. A. (2003). Association of obesity with anxiety, depression and emotional
well-being: a community survey. Australian and New Zealand Journal of
Public Health, 27(4), 434-440.
Kaczynski, A. T., Manske, S. R., Mannell, R. C., & Grewal, K. (2008). Smoking and
physical activity: a systematic review. American Journal of Health Behavior,
32(1), 93-110.
Kasen, S., Cohen, P., Chen, H., & Must, A. (2008). Obesity and psychopathology in
women: a three decade prospective study. International Journal of Obesity,
32(3), 558-566.
Kaufert, P. A., Gilbert, P., & Tate, R. (2008). The Manitoba Project: a
re-examination of the link between menopause and depression. Maturitas,
61(1-2), 54-66.
Keel, P. K., Baxter, M. G., Heatherton, T. F., & Joiner, T. E., Jr. (2007). A 20-year
longitudinal study of body weight, dieting, and eating disorder symptoms.
Journal of Abnormal Psychology, 116(2), 422-432.
Keizer, I., & Eytan, A. (2005). Variations in smoking during hospitalization in
psychiatric in-patient units and smoking prevalence in patients and
health-care staff. International Journal of Social Psychiatry, 51(4), 317-328.
Kenny, D. A. (2009). Mediation. Retrieved 12 May 2010, from
http://davidakenny.net/cm/mediate.htm

261
Kessler, R. C., Berglund, P., Demler, O., Jin, R., Merikangas, K. R., & Walters, E. E.
(2005). Lifetime prevalence and age-of-onset distributions of DSM-IV
disorders in the National Comorbidity Survey Replication. Archives of
Geneneral Psychiatry, 62(6), 593-602.
Khaled, S. M., Bulloch, A., Exner, D. V., & Patten, S. B. (2009). Cigarette smoking,
stages of change, and major depression in the Canadian population.
Canadian Journal of Psychiatry, 54(3), 204-208.
Klose, M., & Jacobi, F. (2004). Can gender differences in the prevalence of mental
disorders be explained by sociodemographic factors? Archives of Women's
Mental Health, 7(2), 133-148.
Klungsoyr, O., Nygard, J. F., Sorensen, T., & Sandanger, I. (2006). Cigarette
smoking and incidence of first depressive episode: an 11-year,
population-based follow-up study. American Journal of Epidemiology,
163(5), 421-432.
Knowler, W. C., Barrett-Connor, E., Fowler, S. E., Hamman, R. F., Lachin, J. M.,
Walker, E. A., et al. (2002). Reduction in the incidence of type 2 diabetes
with lifestyle intervention or metformin. New England Journal of Medicine,
346(6), 393-403.
Korhonen, T., Broms, U., Varjonen, J., Romanov, K., Koskenvuo, M., Kinnunen, T.,
et al. (2007). Smoking behaviour as a predictor of depression among Finnish
men and women: a prospective cohort study of adult twins. Psychological
Medicine, 37(5), 705-715.
Krishnan, S., Rosenberg, L., & Palmer, J. R. (2009). Physical activity and television
watching in relation to risk of type 2 diabetes: the Black Women's Health
Study. American Journal of Epidemiology, 169(4), 428-434.
262
Kruse, J., Schmitz, N., & Thefeld, W. (2003). On the association between diabetes
and mental disorders in a community sample: results from the German
National Health Interview and Examination Survey. Diabetes Care, 26(6),
1841-1846.
Lafitte, M., Barandon, L., Pucheu, Y., Pillois, X., Gin, H., Bonnet, J., et al. (2010).
After acute coronary syndrome, diabetic patients with peripheral vascular
disease remain at high risk of cardiovascular events despite secondary
prevention measures. Archives of Cardiovascular Diseases, 103(2), 97-105.
Lawrence, D., Mitrou, F., & Zubrick, S. R. (2009). Smoking and mental illness:
results from population surveys in Australia and the United States. BMC
Public Health, 9, 285.
Lee, I. M., & Skerrett, P. J. (2001). Physical activity and all-cause mortality: what is
the dose-response relation? Medicine and Science in Sports and Exercise,
33(Suppl.6), S459-471.
Lee, J. S., Kritchevsky, S. B., Tylavsky, F. A., Harris, T., Everhart, J., Simonsick, E.
M., et al. (2004). Weight-loss intention in the well-functioning,
community-dwelling elderly: associations with diet quality, physical activity,
and weight change. American Journal of Clinical Nutrition, 80(2), 466-474.
Leese, M., Schene, A., Koeter, M., Meijer, K., Bindman, J., Mazzi, M., et al. (2008).
SF-36 scales, and simple sums of scales, were reliable quality-of-life
summaries for patients with schizophrenia. Journal of Clinical Epidemiology,
61(6), 588-596.
Lewinsohn, P. M., Seeley, J. R., Roberts, R. E., & Allen, N. B. (1997). Center for
Epidemiologic Studies Depression Scale (CES-D) as a screening instrument
263
for depression among community-residing older adults. Psychology and
Aging, 12(2), 277-287.
Li, T. Y., Rana, J. S., Manson, J. E., Willett, W. C., Stampfer, M. J., Colditz, G. A.,
et al. (2006). Obesity as compared with physical activity in predicting risk of
coronary heart disease in women. Circulation, 113(4), 499-506.
Lorig, K., Doak, C., Doak, L., & Giloth, B. E. (2001). Patient education, a practical
approach (3rd ed. P.22). Lodon: Sage Publications.
Lorig, K., Ritter, P. L., & Plant, K. (2005). A disease-specific self-help program
compared with a generalized chronic disease self-help program for arthritis
patients. Arthritis and Rheumatism, 53(6), 950-957.
Lorig, K., Ritter, P. L., Villa, F., & Piette, J. D. (2008). Spanish diabetes
self-management with and without automated telephone reinforcement: two
randomized trials. Diabetes Care, 31(3), 408-414.
Lorig, K., Ritter, P. L., Laurent, D. D., & Plant, K. (2006). Internet-based chronic
disease self-management: a randomized trial. Medical Care, 44(11), 964-971.
Lorig, K., Sobel, D. S., Ritter, P. L., Laurent, D., & Hobbs, M. (2001). Effect of a
self-management program on patients with chronic disease. Effective Clinical
Practice, 4(6), 256-262.
Lox, C. L., Martine Ginis, K. A., & Petruzzello, S. J. (2006). The psychology of
exercise : integrating theory and practice Scottsdale, Ariz: Holcomb
Hathaway Publishers.
Lu, S., Tseng, H., Lin, L., Luh, W., & Shu, B. (2009). Factors related to depression
during menopause: a study in Southern Taiwan. Journal of Nursing Research,
17(2), 128-135.
264
Ludman, E., Katon, W., Russo, J., Simon, G., Von Korff, M., Lin, E., et al. (2006).
Panic episodes among patients with diabetes. General Hospital Psychiatry,
28(6), 475-481.
Luppino, F. S., De Wit, L. M., Bouvy, P. F., Stijnen, T., Cuijpers, P., Penninx, B. W.
J. H., et al. (2010). Overweight, obesity, and depression: a systematic review
and meta-analysis of longitudinal studies. Archives of General Psychiatry,
67(3), 220-229.
Lustman, P. J., Anderson, R. J., Freedland, K. E., de Groot, M., Carney, R. M., &
Clouse, R. E. (2000). Depression and poor glycemic control: a meta-analytic
review of the literature. Diabetes Care, 23(7), 934-942.
Ma, G., Luan, D., Li, Y., Liu, A., Hu, X., Cui, Z., et al. (2008). Physical activity
level and its association with metabolic syndrome among an employed
population in China. Obesity Reviews, 9 (Suppl. 1), 113-118.
Maki, P. M. (2008). Menopause and anxiety: immediate and long-term effects.
Menopause, 15(6), 1033-1035.
Mancuso, C. A., Rincon, M., McCulloch, C. E., & Charlson, M. E. (2001).
Self-efficacy, depressive symptoms, and patients' expectations predict
outcomes in asthma. Medical Care, 39(12), 1326-1338.
Marill, K. A. (2004). Advanced statistics: linear regression, part II: multiple linear
regression. Academic Emergency Medicine, 11(1), 94-102.
Markowitz, S., Friedman, M. A., & Arent, S. M. (2008). Understanding the relation
between obesity and depression: Causal mechanisms and implications for
treatment. Clinical Psychology, 15(1), 1-20.
Martinsen, E. W. (2008). Physical activity in the prevention and treatment of anxiety
and depression. Nordic Journal of Psychiatry, 62 (Suppl. 47), 25-29.
265
Massak, A., & Graham, K. (2008). Is the smoking-depression relationship
confounded by alcohol consumption? An analysis by gender. Nicotine &
Tobacco Research, 10(7), 1231-1243.
Mather, A. A., Cox, B. J., Enns, M. W., & Sareen, J. (2009). Associations of obesity
with psychiatric disorders and suicidal behaviors in a nationally
representative sample. Journal of Psychosomatic Research, 66(4), 277-285.
Mathers C, Vos T, & C, S. (1999). The burden of disease and injury in Australia
(PHE 17). Canberra: AIHIW.
Mathers, C. D., Vos, E. T., Stevenson, C. E., & Begg, S. J. (2000). The Australian
Burden of Disease Study: measuring the loss of health from diseases, injuries
and risk factors. The Medical Journal of Australia, 172(12), 592-596.
McClure, J. B., Divine, G., Alexander, G., Tolsma, D., Rolnick, S. J., Stopponi, M.,
et al. (2009). A comparison of smokers' and nonsmokers' fruit and vegetable
intake and relevant psychosocial factors. Behavioral Medicine, 35(1), 14-22.
McElroy, S. L., Kotwal, R., Malhotra, S., Nelson, E. B., Keck, P. E., & Nemeroff, C.
B. (2004). Are mood disorders and obesity related? A review for the mental
health professional. The Journal of Clinical Psychiatry, 65(5), 634-651.
Medina-Shepherd, R. B. (2008). The efficacy of the health belief model in predicting
Spanish-speaking Hispanic women's behavior regarding mammography
screening. US: ProQuest Information & Learning.
Mezuk, B., Eaton, W. W., Albrecht, S., & Golden, S. H. (2008). Depression and type
2 diabetes over the lifespan: a meta-analysis. Diabetes Care, 31(12),
2383-2390.
266
Mino, Y., Shigemi, J., Otsu, T., Ohta, A., Tsuda, T., Yasuda, N., et al. (2001).
Smoking and mental health: cross-sectional and cohort studies in an
occupational setting in Japan. Preventive Medicine, 32(4), 371-375.
Mond, J. M., & Baune, B. T. (2009). Overweight, medical comorbidity and
health-related quality of life in a community sample of women and men.
Obesity, 17(8), 1627-1634.
Morrow, C. (2001). Psychosocial health of well women through the life cycle. In J.
A. Rosenfeld (Ed.), Handbook of women's health : an evidence-based
approach (pp. 123). New York Cambridge University Press.
Motl, R. W., & McAuley, E. (2010). Physical activity, disability, and quality of life
in older adults. Physical Medicine and Rehabilitation Clinics of North
America, 21(2), 299-308.
Muennig, P., Jia, H., Lee, R., & Lubetkin, E. (2008). I think therefore I am:
perceived ideal weight as a determinant of health. American Journal of
Public Health, 98(3), 501-506.
Munafo, M. R., Tilling, K., & Ben-Shlomo, Y. (2009). Smoking status and body
mass index: a longitudinal study. Nicotine & Tobacco Research, 11(6),
765-771.
Mykletun, A., Overland, S., Aarø, L. E., Liabø, H.-M., & Stewart, R. (2008).
Smoking in relation to anxiety and depression: Evidence from a large
population survey: The HUNT study. European Psychiatry, 23(2), 77-84.
Nakata, A., Takahashi, M., Ikeda, T., Hojou, M., Nigam, J. A., & Swanson, N. G.
(2008). Active and passive smoking and depression among Japanese workers.
Preventive Medicine, 46(5), 451-456.

267
National Health and Medical Council (NHMRC). (2001). Australian alcohol
guidelines: health risks and benefits. Retrieved 18 April 2010, from
http://www.nhmrc.gov.au/publications/synopses/ds9syn.htm
National Health and Medical Research Council (NHMRC). (2009). Australian
guidelines to reduce health risks from drinking alcohol. Retrieved 22 April
2010, from
http://www.nhmrc.gov.au/_files_nhmrc/file/publications/synopses/ds10-alco
hol.pdf
National Heart Lung and blood Institutes. (1998). Clinical guidelines of
identification, evaluation and treatment of overweight and obesity in adults
(No. 98-4083).Maryland: NIH Publication.
Orozco, L. J., Buchleitner, A. M., Gimenez-Perez, G., Roqué i Figuls, M., Richter,
B., & Mauricio, D. (2008). Exercise or exercise and diet for preventing type 2
diabetes mellitus. Cochrane Database Systematic Reviews, (3). Art. No.:
CD003054. DOI: 10.1002/14651858.CD003054.pub3.
Parker, E. D., Jacobs Jr, D. R., Schreiner, P. J., Schmitz, K. H., & Dengel, D. R.
(2007). Physical activity in young adults and incident hypertension over 15
years of follow-up: The CARDIA Study. American Journal of Public Health,
97(4), 703-709.
Parry, B. L. (2007). Sleep disturbances at menopause are related to sleep disorders
and anxiety symptoms. Menopause, 14(5), 812-814.
Pasco, J. A., Williams, L. J., Jacka, F. N., Ng, F., Henry, M. J., Nicholson, G. C., et
al. (2008). Tobacco smoking as a risk factor for major depressive disorder:
population-based study. The British Journal of Psychiatry, 193(4), 322-326.
268
Patja, K., Jousilahti, P., Hu, G., Valle, T., Qiao, Q., & Tuomilehto, J. (2005). Effects
of smoking, obesity and physical activity on the risk of type 2 diabetes in
middle-aged Finnish men and women. Journal of Internal Medicine, 258(4),
356-362.
Patten, S. B., Brandon-Christie, J., Devji, J., & Sedmak, B. (2000). Performance of
the composite international diagnostic interview short form for major
depression in a community sample. Chronic Diseases in Canada, 21(2),
68-72.
Pelican, J. M. (2007). Understanding differentiation of health in late modernity - by
use of sociological systems theory. In D. V. McQueen, I. Kickbusch & L.
Potvin (Eds.), Health and modernity : the role of theory in health promotion.
New York: Springer.
Pisinger, C., Toft, U., Aadahl, M., Glümer, C., & Jørgensen, T. (2009). The
relationship between lifestyle and self-reported health in a general population:
the Inter99 study. Preventive Medicine, 49(5), 418-423.
Plotnikoff, R. C., Hotz, S. B., Johnson, S. T., Hansen, J. S., Birkett, N. J., Leonard, L.
E., et al. (2009). Readiness to shop for low-fat foods: a population study.
Journal Of The American Dietetic Association, 109(8), 1392-1397.
Pomerleau, C. S., Zucker, A. N., & Stewart, A. J. (2003). Patterns of depressive
symptomatology in women smokers, ex-smokers, and never-smokers.
Addictive Behaviors, 28(3), 575-582.
Poortinga, W. (2007). The prevalence and clustering of four major lifestyle risk
factors in an English adult population. Preventive Medicine, 44(2), 124-128.
Prochaska, J. O., & Velicer, W. F. (1997). The transtheoretical model of health
behavior change. American Journal of Health Promotion, 12(1), 38-48.

269
Prochaska, J. O., Velicer, W. F., Rossi, J. S., Goldstein, M. G., Marcus, B. H.,
Rakowski, W., et al. (1994). Stages of change and decisional balance for 12
problem behaviors. Health Psychology, 13(1), 39-46.
Pudrovska, T., & A. (2009). Psychological implications of parenthood in midlife:
Evidence from sibling models. US: ProQuest Information & Learning.
Puhl, R. M., & Heuer, C. A. (2010). Obesity stigma: important considerations for
public health. American Journal of Public Health, 100(6), 1019-1028.
Rakovac, M., Baric, R., & Heimer, S. (2007). Prevalence of certain chronic diseases
sensitive to kinesiological treatment in physically active vs inactive
postmenopausal women. Kinesiology, 39(2), 124-130.
Renzaho, A., Wooden, M., & Houng, B. (2010). Associations between body mass
index and health-related quality of life among Australian adults. Quality of
Life Research, 19(4), 515-520.
Resnicow, K., McCarty, F., & Baranowski, T. (2003). Are precontemplators less
likely to change their dietary behavior? A prospective analysis. Health
Education Research, 18(6), 693-705.
Riva, M., Bambra, C., Curtis, S., & Gauvin, L. (2010). Collective resources or local
social inequalities? Examining the social determinants of mental health in
rural areas. European Journal of Public Health, doi: 10.1093/eurpub/ckq064
Roach, J. B., Yadrick, M. K., Johnson, J. T., Boudreaux, L. J., Forsythe Iii, W. A., &
Billon, W. (2003). Using self-efficacy to predict weight loss among young
adults. Journal of the American Dietetic Association, 103(10), 1357-1359.
Roberts, R. E., Deleger, S., Strawbridge, W. J., & Kaplan, G. A. (2003). Prospective
association between obesity and depression: evidence from the Alameda
270
County Study. International Journal of Obesity and Related Metabolic
Disorders, 27(4), 514-521.
Rodgers, B., Korten, A. E., Jorm, A. F., Christensen, H., Henderson, S., & Jacomb, P.
A. (2000). Risk factors for depression and anxiety in abstainers, moderate
drinkers and heavy drinkers. Addiction, 95(12), 1833-1845.
Rogge, M. M., Greenwald, M., & Golden, A. (2004). Obesity, stigma, and civilized
oppression. Advances in Nursing Science, 27(4), 301-315.
Rohrer, J. E., Rush Pierce, J. J., & Blackburn, C. (2005). Lifestyle and mental health.
Preventive Medicine, 40(4), 438-443.
Rosenstock, I. (1974). Historical origins of the health belief model. Health
Education Monographs, 2, 328-335.
Rothenbacher, D., Koenig, W., & Brenner, H. (2006). Lifetime physical activity
patterns and risk of coronary heart disease. Heart, 92(9), 1319-1320.
Sacco, W. P., Wells, K. J., Vaughan, C. A., Friedman, A., Perez, S., & Matthew, R.
(2005). Depression in adults with type 2 diabetes: the role of adherence, body
mass index, and self-efficacy. Health Psychology, 24(6), 630-634.
Salaffi, F., Sarzi-Puttini, P., Girolimetti, R., Atzeni, F., Gasparini, S., & Grassi, W.
(2009). Health-related quality of life in fibromyalgia patients: a comparison
with rheumatoid arthritis patients and the general population using the SF-36
health survey. Clinical and Experimental Rheumatology, 27(5 Suppl. 56),
S67-S74.
Sanchez-Villegas, A., Henriquez, P., Bes-Rastrollo, M., & Doreste, J. (2006).
Mediterranean diet and depression. Public Health Nutrition, 9(8A),
1104-1109.

271
Sanchez, A., Norman, G. J., Sallis, J. F., Calfas, K. J., Rock, C., & Patrick, K. (2008).
Patterns and correlates of multiple risk behaviors in overweight women.
Preventive Medicine, 46(3), 196-202.
Sarna, L., Bialous, S. A., Cooley, M. E., Jun, H.-J., & Feskanich, D. (2008). Impact
of smoking and smoking cessation on health-related quality of life in women
in the Nurses' Health Study. Quality of Life Research, 17(10), 1217-1227.
Scott, K. M., Bruffaerts, R., Simon, G. E., Alonso, J., Angermeyer, M., Girolamo, G.
D., et al. (2008). Obesity and mental disorders in the general population:
results from the world mental health surveys. International Journal of
Obesity, 32(1), 192-200.
Shai, I., Jiang, R., Manson, J. E., Stampfer, M. J., Willett, W. C., Colditz, G. A., et al.
(2006). Ethnicity, obesity, and risk of type 2 diabetes in women: a 20-year
follow-up study. Diabetes Care, 29(7), 1585-1590.
Shortridge-Baggett, L. M. (2001). Self-efficacy: measurement and intervention in
nursing. Scholarly Inquiry for Nursing Practice, 15(3), 183-188.
Singer, S., Kuhnt, S., Götze, H., Hauss, J., Hinz, A., Liebmann, A., et al. (2009).
Hospital anxiety and depression scale cutoff scores for cancer patients in
acute care. British Journal of Cancer, 100(6), 908-912.
Skogen, J. C., Harvey, S. B., Henderson, M., Stordal, E., & Mykletun, A. (2009).
Anxiety and depression among abstainers and low-level alcohol consumers.
The Nord-TrØndelag Health Study. Addiction, 104(9), 1519-1529.
Smith-DiJulio, K., & Anderson, D. (2009). Sustainability of a multimodal
intervention to promote lifestyle factors associated with the prevention of
cardiovascular disease in midlife Australian women: a 5-year follow-up.
Health Care for Women Internationalt, 30(12), 1111-1130.
272
Smith-DiJulio, K., Woods, N. F., & Mitchell, E. S. (2008). Well-being during the
menopausal transition and early postmenopause: a longitudinal analysis.
Menopause, 15(6), 1095-1102.
Social Research Center. (2006). National tobacco survey: smoking prevalence and
consumption, 1997-2005. Retrieved 11 May 2010, from
http://www.quitnow.info.au/internet/quitnow/publishing.nsf/Content/hotspots
-lp
Somers, J. M., Goldner, E. M., Waraich, P., & Hsu, L. (2006). Prevalence and
incidence studies of anxiety disorders: a systematic review of the literature.
Canadian Journal of Psychiatry, 51(2), 100-113.
Stamatakis, E., Hirani, V., & Rennie, K. (2009). Moderate-to-vigorous physical
activity and sedentary behaviours in relation to body mass index-defined and
waist circumference-defined obesity. British Journal of Nutrition, 101(5),
765-773.
Stanford Patient Education Research Center. Self-Efficacy for Managing Chronic
Disease 6-Item Scale. CA: Stanford University.
Stanley, E. L. (2008). Why we should use simpler models if the data allow this:
relevance for ANOVA designs in experimental biology. BMI Physiology,
8(16), doi:10.1186/1472-6793-1116.
Sternfeld, B., Wang, H., Quesenberry, C. P., Jr., Abrams, B., Everson-Rose, S. A.,
Greendale, G. A., et al. (2004). Physical activity and changes in weight and
waist circumference in midlife women: findings from the Study of Women's
Health Across the Nation. American Journal of Epidemiology, 160(9),
912-922.

273
Storr, C. L., Cheng, H., Alonso, J., Angermeyer, M., Bruffaerts, R., de Girolamo, G.,
et al. (2010). Smoking estimates from around the world: data from the first
17 participating countries in the World Mental Health Survey Consortium.
Tobacco Control, 19(1), 65-74.
Strawbridge, W. J., Deleger, S. p., Roberts, R. E., & Kaplan, G. A. (2002). Physical
activity reduces the risk of subsequent depression for older adults. American
Journal of Epidemiology, 156(4), 328-334.
Strayhorn, G. (2009). Health disparities: the case for diabetes. In R. L. Braithwaite, S.
E. Taylor & H. M. Treadwell (Eds.), Health issues in the Black community
(3rd ed.). (pp. 279-289). San Francisco: Jossey-Bass.
Sturm, R., & Wells, K. B. (2001). Does obesity contribute as much to morbidity as
poverty or smoking? Public Health, 115(3), 229-235.
Sullivan, P. W., Morrato, E. H., Ghushchyan, V., Wyatt, H. R., & Hill, J. O. (2005).
Obesity, inactivity, and the prevalence of diabetes and diabetes-related
cardiovascular comorbidities in the U.S., 2000-2002. Diabetes Care, 28(7),
1599-1603.
Takeuchi, T., Nakao, M., & Yano, E. (2004). Relationship between smoking and
major depression in a Japanese workplace. Journal of Occupational Health,
46(6), 489-492.
Tanasescu, M., Leitzmann, M. F., Rimm, E. B., & Hu, F. B. (2003). Physical activity
in relation to cardiovascular disease and total mortality among men with type
2 diabetes. Circulation, 107(19), 2435-2439.
Tavafian, S.-S., Aghamolaei, T., & Zare, S. (2009). Water pipe smoking and
health-related quality of life: a population-based study. Archives of Iranian
Medicine, 12(3), 232-237.

274
Taylor-Piliae, R. E., Fair, J. M., Haskell, W. L., Varady, A. N., Iribarren, C., Hlatky,
M. A., et al. (2010). Validation of the Stanford Brief Activity Survey:
examining psychological factors and physical activity levels in older Adults.
Journal of Physical Activity & Health, 7(1), 87-94.
Teixeira, P., J. , Going, S., B., Houtkooper, L., B., Cussler, E., C. , Martin, C., J.,
Metcalfe, L., L., et al. (2002). Weight loss readiness in middle-aged women:
psychosocial predictors of success for behavioral weight reduction. Journal
of Behavioral Medicine, 25(6), 499-523.
Thorburn, A. W. (2005). Prevalence of obesity in Australia. Obesity Reviews, 6(3),
187-189.
Tobias, M., Templeton, R., & Collings, S. (2008). How much do mental disorders
contribute to New Zealand's tobacco epidemic? Tobacco Control, 17(5),
347-350.
Travers, C., O'Neill, S. M., King, R., Battistutta, D., & Khoo, S. K. (2005). Greene
Climacteric Scale: norms in an Australian population in relation to age and
menopausal status. Climacteric, 8(1), 56-62.
Trosclair, A., & Dube, S. R. (2010). Smoking among adults reporting lifetime
depression, anxiety, anxiety with depression, and major depressive episode,
United States, 2005-2006. Addictive Behaviors, 35(5), 438-443.
Tselebis, A., Panaghiotou, A., Theotoka, I., & Ilias, I. (2001). Nursing staff anxiety
versus smoking habits. International Journal of Nursing Practice, 7(3),
221-223.
Turley, M., Tobias, M., & Paul, S. (2006). Non-fatal disease burden associated with
excess body mass index and waist circumference in New Zealand adults.
Australian & New Zealand Journal of Public Health, 30(3), 231-237.

275
Untas, A. l., Aguirrezabal, M., Chauveau, P., Leguen, E., Combe, C., & Rascle, N.
(2009). Anxiety and depression in hemodialysis: validation of the Hospital
Anxiety and Depression Scale (HADS). Néphrologie & Thérapeutique 5(3),
193-200.
Vallance, J. K., Murray, T. C., Johnson, S. T., & Elavsky, S. (2010). Quality of life
and psychosocial health in postmenopausal women achieving public health
guidelines for physical activity. Menopause, 17(1), 64-71.
Vamos, E. P., Bottle, A., Majeed, A., & Millett, C. (2010). Trends in lower extremity
amputations in people with and without diabetes in England, 1996-2005.
Diabetes Research & Clinical Practice, 87(2), 275-282.
Van Gool, C. H., Kempen, G. I. J. M., Bosma, H., van Eijk, J. T. M., van Boxtel, M.
P. J., & Jolles, J. (2007). Associations between lifestyle and depressed mood:
longitudinal results from the Maastricht Aging Study. American Journal of
Public Health, 97(5), 887-894.
Vasiljevic, N., Ralevic, S., Marinkovic, J., Kocev, N., Maksimovic, M., Milosevic, G.
S., et al. (2008). The assessment of health-related quality of life in relation to
the body mass index value in the urban population of Belgrade. Health and
Quality of Life Outcomes, 6, 106-106.
Vogelzangs, N., Kritchevsky, S. B., Beekman, A. T. F., Brenes, G. A., Newman, A.
B., Satterfield, S., et al. (2010). Obesity and onset of significant depressive
symptoms: results from a prospective community-based cohort study of older
men and women. The Journal of Clinical Psychiatry, 71(4), 391-399.
Wagner, J. A., Tennen, H., & Osborn, C. Y. (2010). Lifetime depression and
diabetes self-management in women with Type 2 diabetes: a case-control
study. Diabetic Medicine, 27(6), 713-717.
276
Walsh, T. L., Homa, K., Hanscom, B., Lurie, J., Sepulveda, M. G., & Abdu, W.
(2006). Screening for depressive symptoms in patients with chronic spinal
pain using the SF-36 Health Survey. The Spine Journal, 6(3), 316-320.
Wang, J., & Patten, S. B. (2001). Alcohol consumption and major depression:
findings from a follow-up study. The Canadian Journal of Psychiatry, 46(7),
632-638.
Wannamethee, S. G., & Shaper, A. G. (2003). Alcohol, body weight, and weight
gain in middle-aged men. The American Journal of Clinical Nutrition, 77(5),
1312-1317.
Ware, J. E., Jr., Kosinski, M., & Dewey, J. E. (2000). Chapter 7 Scoring SF-36v2
physical and mental summary measures. In How to score version 2 of the
SF-36® health survey. Lincoln: RI: QualityMetric Incorporated.
Ware, J. E., Jr., Kosinski, M., & Gandek, B. (2000a). Development of the SF-36
SF-36 Health Survey: Manual & Interpretation Guide. Lincoln, RI:
QualityMetric Incorporated.
Ware, J. E., Jr., Kosinski, M., & Gandek, B. (2000b). Validity: norm-based
interpretation SF-36 Health Survey: Manual & Interpretation Guide. Lincoln,
RI: QualityMetric Incorporated.
Warren, C. W., Jones, N. R., Eriksen, M. P., & Asma, S. (2006). Patterns of global
tobacco use in young people and implications for future chronic disease
burden in adults. Lancet, 367(9512), 749-753.
Wee, H., Wu, Y., Thumboo, J., Lee, J., & Tai, E. (2010). Association of body mass
index with Short-Form 36 physical and mental component summary scores in
a multiethnic Asian population. International Journal of Obesity, 34(6),
1034-1043.

277
Wen, L. M., Thomas, M., Jones, H., Orr, N., Moreton, R., King, L., et al. (2002).
Promoting physical activity in women: evaluation of a 2-year
community-based intervention in Sydney, Australia. Health Promotion
International, 17(2), 127-137.
Widome, R., Linde, J. A., Rohde, P., Ludman, E. J., Jeffery, R. W., & Simon, G. E.
(2009). Does the association between depression and smoking vary by body
mass index (BMI) category? Preventive Medicine, 49(5), 380-383.
Willi, C., Bodenmann, P., Ghali, W. A., Faris, P. D., & Cornuz, J. (2007). Active
smoking and the risk of type 2 diabetes: a systematic review and
meta-analysis. Journal of American Medical Association, 298(22),
2654-2664.
Wolitzky-Taylor, K. B., Castriotta, N., Lenze, E. J., Stanley, M. A., & Craske, M. G.
(2010). Anxiety disorders in older adults: a comprehensive review.
Depression and Anxiety, 27(2), 190-211.
World Health Organisation. (2000a). Obesity: preventing and managing the global
epidemic. WHO Technical Report Series 894. Geneva. Retrieved 25 June
2010, from http://whqlibdoc.who.int/trs/WHO_TRS_894_(part1).pdf
World Health Organisation. (2000b). Technical report series 894: "obesity:
preventing and managing the global epidemic." Geneva: WHO.
World Health Organisation. (2003). WHO launches annual Move for Health day as
global initiative to promote benefits of physical activity, Retrieved 07 August
2009, from
http://www.who.int/mediacentre/news/releases/2003/pr15/en/index.html
World Health Organisation. (2005a).Mental Health. Retrieved on 02 June 2010,
from http://www.who.int/mental_health/en/

278
World Health Organisation. (2005b). Preventing chronic disease: a vital investment.
Retrieved 02 June 2009, from
http://www.who.int/chp/chronic_disease_report/contents/en/index.html
World Health Organisation. (2006). Diabetes. Retrieved 07 June 2009, from
http://www.who.int/mediacentre/factsheets/fs312/en/index.html
World Health Organisation. (2008). Management of substance abuse-Alcohol.
Retrieved 14 July 2010, from
http://www.who.int/substance_abuse/facts/alcohol/en/index.html
World Health Organisation Regional Office for Europe. (1986). Ottawa chater for
health promotion. Geneva: WHO.
Wott, C. B., & Carels, R. A. (2010). Overt weight stigma, psychological distress and
weight loss treatment outcomes. Journal of Health Psychology, 15(4),
608-614.
Wu, L. T., & Anthony, J. C. (1999). Tobacco smoking and depressed mood in late
childhood and early adolescence. American Journal of Public Health, 89(12),
1837-1840.
Wyshak, G. (2001). Women's college physical activity and self-reports of
physician-diagnosed depression and of current symptoms of psychiatric
distress. Journal of Women's Health & Gender-Based Medicine, 10(4),
363-370.
Yusuf, S., Hawken, S., Ounpuu, S., Dans, T., Avezum, A., Lanas, F., et al. (2004).
Effect of potentially modifiable risk factors associated with myocardial
infarction in 52 countries (the INTERHEART study): case-control study.
Lancet, 364(9438), 937-952.

279
Zender, R., & Olshansky, E. (2009). Women's mental health: depression and anxiety.
The Nursing Clinics of North America, 44(3), 355-364.
Zhao, G., Ford, E. S., Dhingra, S., Li, C., Strine, T. W., & Mokdad, A. H. (2009).
Depression and anxiety among US adults: associations with body mass index.
International Journal of Obesity, 33(2), 257-266.
Ziaei, S., Moghasemi, M., & Faghihzadeh, S. (2010). Comparative effects of
conventional hormone replacement therapy and tibolone on climacteric
symptoms and sexual dysfunction in postmenopausal women. Climacteric,
13(2), 147-156.
Zigmond, A. S., & Snaith, R. P. (1983). The Hospital Anxiety and Depression Scale.
Acta Psychiatrica Scandinavica, 67(6), 361-370.
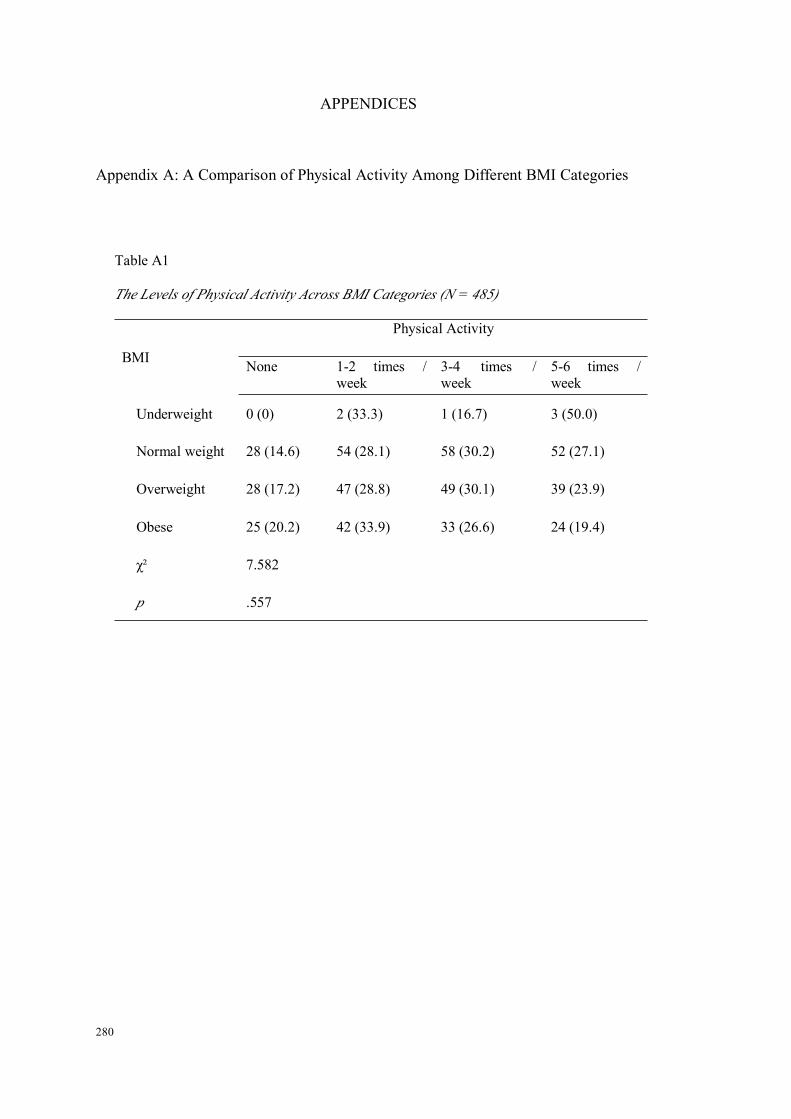
280
APPENDICES
Appendix A: A Comparison of Physical Activity Among Different BMI Categories
Table A1
The Levels of Physical Activity Across BMI Categories (N = 485)
BMI
Physical Activity
None 1-2 times /week
3-4 times /week
5-6 times /week
Underweight 0 (0) 2 (33.3) 1 (16.7) 3 (50.0)
Normal weight 28 (14.6) 54 (28.1) 58 (30.2) 52 (27.1)
Overweight 28 (17.2) 47 (28.8) 49 (30.1) 39 (23.9)
Obese 25 (20.2) 42 (33.9) 33 (26.6) 24 (19.4)
χ² 7.582
p .557

281
Appendix B: Medical Outcomes Study Short Form (SF-36)
Please answer each of the following questions. Some questions may look like others, but
each one is different. Please take the time to read and answer each question carefully, and
mark an in the one box that best describes your answer.
1. In general, would you say your health is:
Excellent Very good Good Fair Poor
1 2 3 4 5
2. Compared to one year ago, how would you rate your health in general now?
Much betternow than oneyear ago
Somewhat betternow than oneyear ago
About thesame as one year
ago
Somewhat worsenow than oneyear ago
Much worsenow than oneyear ago
1 2 3 4 5
3. The following items are about activities you might do during a typical day.Does your health now limit you in these activities? If so, how much?
Yes,limiteda lot
Yes,limiteda little
No, notlimitedat all
a.a.a.a. Vigorous activities, such as running, lifting heavyobjects, participating in strenuous sports 1 2 3
b.b.b.b. Moderate activities, such as moving a table, pushing avacuum cleaner, bowling, or playing golf 1 2 3
c.c.c.c. Lifting or carrying groceries 1 2 3
d.d.d.d. Climbing several flights of stairs 1 2 3
e.e.e.e. Climbing one flight of stairs 1 2 3
f.f.f.f. Bending, kneeling, or stooping 1 2 3
g.g.g.g. Walking more than a kilometre 1 2 3
h.h.h.h. Walking several blocks 1 2 3
i.i.i.i. Walking one block 1 2 3
j.j.j.j. Bathing or dressing yourself 1 2 3
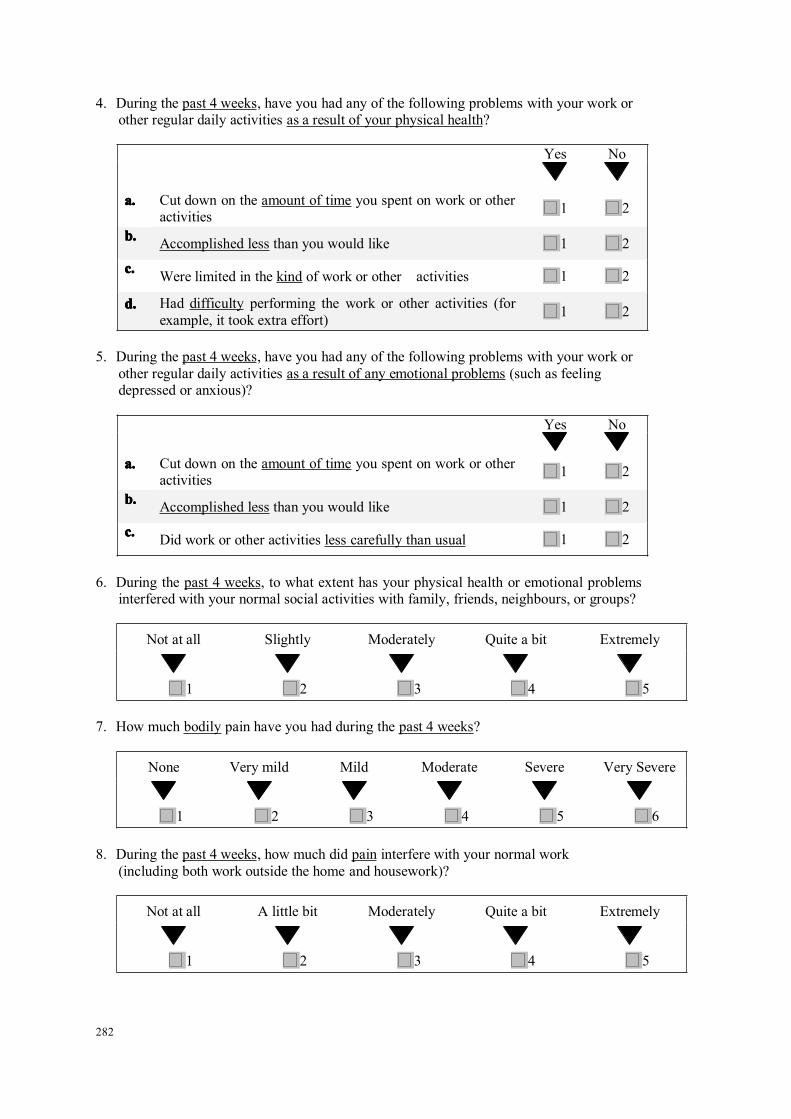
282
4. During the past 4 weeks, have you had any of the following problems with your work orother regular daily activities as a result of your physical health?
Yes No
a.a.a.a. Cut down on the amount of time you spent on work or otheractivities 1 2
b.b.b.b. Accomplished less than you would like 1 2
c.c.c.c. Were limited in the kind of work or other activities 1 2
d.d.d.d. Had difficulty performing the work or other activities (forexample, it took extra effort) 1 2
5. During the past 4 weeks, have you had any of the following problems with your work orother regular daily activities as a result of any emotional problems (such as feelingdepressed or anxious)?
Yes No
a.a.a.a. Cut down on the amount of time you spent on work or otheractivities 1 2
b.b.b.b. Accomplished less than you would like 1 2
c.c.c.c. Did work or other activities less carefully than usual 1 2
6. During the past 4 weeks, to what extent has your physical health or emotional problemsinterfered with your normal social activities with family, friends, neighbours, or groups?
Not at all Slightly Moderately Quite a bit Extremely
1 2 3 4 5
7. How much bodily pain have you had during the past 4 weeks?
None Very mild Mild Moderate Severe Very Severe
1 2 3 4 5 6
8. During the past 4 weeks, how much did pain interfere with your normal work(including both work outside the home and housework)?
Not at all A little bit Moderately Quite a bit Extremely
1 2 3 4 5
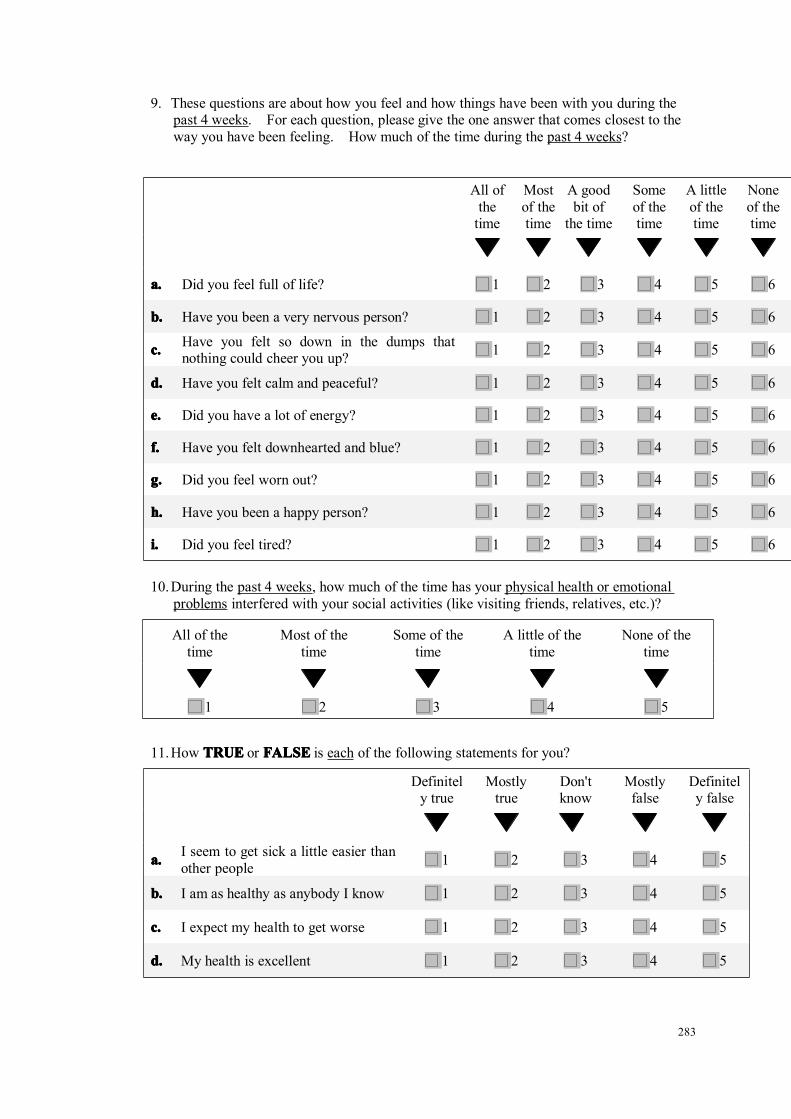
283
9. These questions are about how you feel and how things have been with you during thepast 4 weeks. For each question, please give the one answer that comes closest to theway you have been feeling. How much of the time during the past 4 weeks?
All ofthetime
Mostof thetime
A goodbit of
the time
Someof thetime
A littleof thetime
Noneof thetime
a.a.a.a. Did you feel full of life? 1 2 3 4 5 6
b.b.b.b. Have you been a very nervous person? 1 2 3 4 5 6
c.c.c.c. Have you felt so down in the dumps thatnothing could cheer you up? 1 2 3 4 5 6
d.d.d.d. Have you felt calm and peaceful? 1 2 3 4 5 6
e.e.e.e. Did you have a lot of energy? 1 2 3 4 5 6
f.f.f.f. Have you felt downhearted and blue? 1 2 3 4 5 6
g.g.g.g. Did you feel worn out? 1 2 3 4 5 6
h.h.h.h. Have you been a happy person? 1 2 3 4 5 6
i.i.i.i. Did you feel tired? 1 2 3 4 5 6
10.During the past 4 weeks, how much of the time has your physical health or emotionalproblems interfered with your social activities (like visiting friends, relatives, etc.)?
All of thetime
Most of thetime
Some of thetime
A little of thetime
None of thetime
1 2 3 4 5
11.How TRUETRUETRUETRUE or FALSEFALSEFALSEFALSE is each of the following statements for you?
Definitely true
Mostlytrue
Don'tknow
Mostlyfalse
Definitely false
a.a.a.a. I seem to get sick a little easier thanother people 1 2 3 4 5
b.b.b.b. I am as healthy as anybody I know 1 2 3 4 5
c.c.c.c. I expect my health to get worse 1 2 3 4 5
d.d.d.d. My health is excellent 1 2 3 4 5

284
Appendix C: Greene’s Climacteric Scale
Please indicate the extent to which you are bothered at the moment by any of these
symptoms by placing a tick in the appropriate box.
Not at all A little Quite abit Extremely
a. Heart beating quickly or strongly
b. Feeling tense or nervous
c. Difficulty in sleeping
d. Excitable
e. Attacks of panic
f. Difficulty in concentrating
g. Feeling tired or lacking in energy
h. Loss of interest in most things
i. Feeling unhappy or depressed
j. Crying spells
k. Irritability
l. Feeling dizzy or faint
m. Pressure or tightness in head or body
n. Parts of body feel numb or tingling
o. Headaches
p. Muscle and joint pains
q. Loss of feeling hands or feet
r. Breathing difficulties
s. Hot Flushes
t. Sweating at night
u. Loss of interest in sex

285
Appendix D: The Hospital Anxiety and Depression Scale
Please read each item and circle the number next to the reply which comes closest to
how you have been feeling in the past week. Don't take too long over your replies;
your immediate reaction to each item will probably be more accurate than a long
thought out response.
a. I feel tense or ‘wound up’
0. Most of the time1. A lot of the time2. From time to time, occasionally3. Not at all
b. I still enjoy the things I used to enjoy
0. Definitely as much1. Not quite as much2. Only a little3. Hardly at all
c. I get a sort of frightened feeling as if something awful is about to happen
0. Very definitely and quite badly1. Yes, but not too badly2. A little, but it doesn’t worry me3. Not at all
d. I can laugh and see the funny side of things
0. As much as I always could1. Not quite so much now2. Definitely not so much now3. Not at all
e. Worrying thoughts go through my mind
0. A great deal of the time1. A lot of the time2. From time to time but not too often3. Only occasionally
f. I feel cheerful
0. Not at all1. Not often2. Sometimes3. Most of time
g. I can sit at ease and feel relaxed
0. Definitely1. Usually

286
2. Not often3. Not at all
h. I feel as if I am slowed down:
0. Nearly all the time1. Very often2. Sometimes3. Not at all
i. I get a sort of frightened feeling like ‘butterflies’ in the stomach
0. Not at all1. Occasionally2. Quite often3. Very often
j. I have lost interest in my appearance
0. Definitely1. I don’t take so much care as I should2. I may not take quite as much care3. I take just as much care as ever
k. I feel restless as if I have to be on the move
0. Very much indeed1. Quite a lot2. Not very much3. Not at all
l. I look forward with enjoyment to things
0. As much as I ever did1. Rather less than I used to2. Definitely less than I used to3. Hardly at all
m. I get sudden feelings of panic
0. Very often indeed1. Quite often2. Not very often3. Not at all
n. I can enjoy a good book or radio or TV program
0. Often1. Sometimes2. Not often3. Very seldom
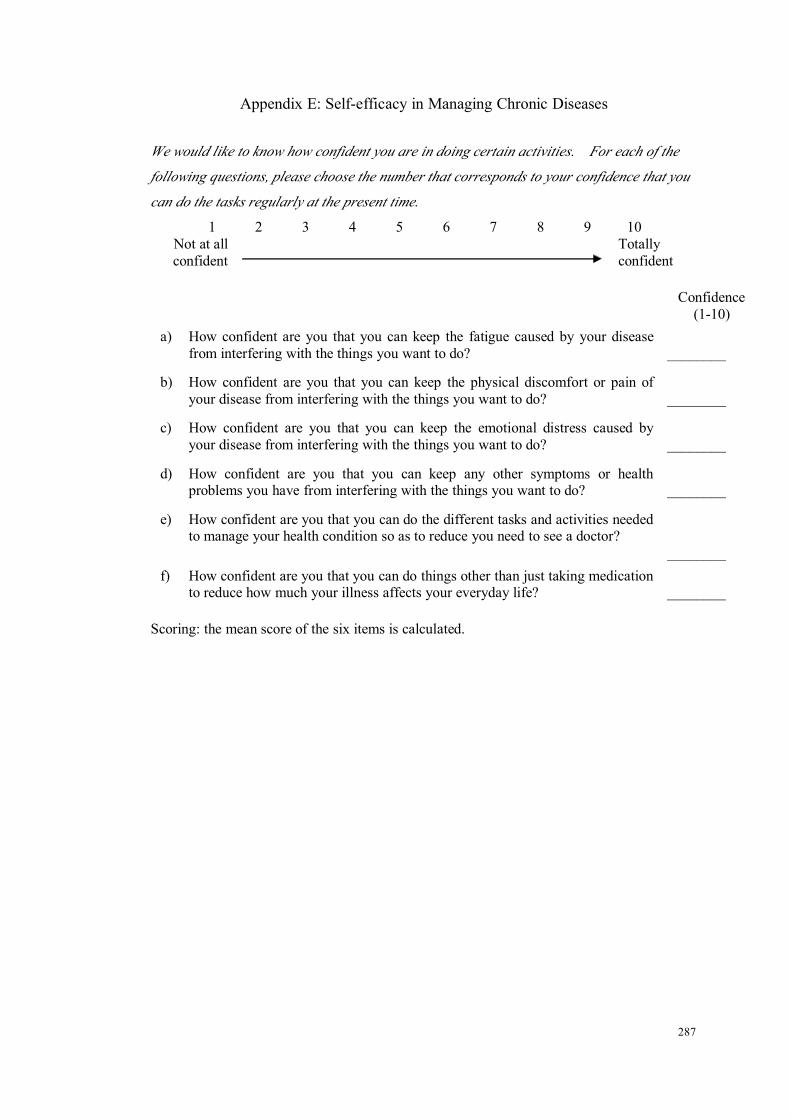
287
Appendix E: Self-efficacy in Managing Chronic Diseases
We would like to know how confident you are in doing certain activities. For each of the
following questions, please choose the number that corresponds to your confidence that you
can do the tasks regularly at the present time.
1 2 3 4 5 6 7 8 9 10Not at allconfident
Totallyconfident
Confidence(1-10)
a) How confident are you that you can keep the fatigue caused by your diseasefrom interfering with the things you want to do? ________
b) How confident are you that you can keep the physical discomfort or pain ofyour disease from interfering with the things you want to do? ________
c) How confident are you that you can keep the emotional distress caused byyour disease from interfering with the things you want to do? ________
d) How confident are you that you can keep any other symptoms or healthproblems you have from interfering with the things you want to do? ________
e) How confident are you that you can do the different tasks and activities neededto manage your health condition so as to reduce you need to see a doctor?
________f) How confident are you that you can do things other than just taking medication
to reduce how much your illness affects your everyday life? ________
Scoring: the mean score of the six items is calculated.

288
Appendix F: The Seattle Physical Activity Questionnaire
1. General daily activity includes activities such as housework, caring for children,shopping, gardening or activity at work. It does not include exercising. How do you
describe your current general daily activity level?
Very active (involves strenuous labour)
Moderately active
Mildly active (some walking/stair climbing)
Sedentary (mostly sitting)
2. During the past month, how many times did you exercise for at least 15 minutes at a
time? (Exercise includes activities such as callisthenics, jogging, racquet sports,
team sports, dance classes, brisk walking, lifting weights, yoga, Tai Chi etc)
Daily
5-6 times a week
3-4 times a week
1-2 times a week
None
3. Overall, how do you rate your current level of physical activity (general daily activityplus exercise)? Rate from (00) not at all active to (10) extremely active.
00 01 02 03 04 05 06 07 08 09 10NOT AT ALL ACTIVE EXTREMELY ACTIVE

289
Appendix G: Ethical Approval

290
291
292
293

294

295

![, pp. 67-86. - QUTTherapy+final+proof[1].pdf · Jim Oxtoby BBehPsych (Hons) Queensland University of Technology Sandy Sacre PhD Queensland University of Technology Janine Lurie-Beck](https://img.dokumen.tips/doc/110x75/6096e000afbebb62355c5b03/-pp-67-86-qut-therapyfinalproof1pdf-jim-oxtoby-bbehpsych-hons-queensland.jpg)


![Classical Feedback Control With MATLAB [Lurie B., Enright P]](https://img.dokumen.tips/doc/110x75/55cf99a1550346d0339e60c7/classical-feedback-control-with-matlab-lurie-b-enright-p.jpg)

![TOPOLOGICAL MODULAR FORMS [after Hopkins, Miller, and Lurie] Paul](https://img.dokumen.tips/doc/110x75/613d1296736caf36b758fd54/topological-modular-forms-after-hopkins-miller-and-lurie-paul.jpg)


![Topological Modular Forms [after Hopkins, Miller, and Lurie]](https://img.dokumen.tips/doc/110x75/5868e8171a28ab87408c2e23/topological-modular-forms-after-hopkins-miller-and-lurie.jpg)