Embed Size (px)
Citation preview
SANDIA REPORT SAND2007-7178 Unlimited Release Printed November 2007
Quasi-Spherical Direct Drive Fusion Simulations for the Z Machine and Future Accelerators
Tom Nash, Pace VanDevender, Norman Roderick, and Dillon McDaniel
Prepared by Sandia National Laboratories Albuquerque, New Mexico 87185 and Livermore, California 94550 Sandia is a multiprogram laboratory operated by Sandia Corporation, a Lockheed Martin Company, for the United States Department of Energy’s National Nuclear Security Administration under Contract DE-AC04-94AL85000. Approved for public release; further dissemination unlimited.

2
Issued by Sandia National Laboratories, operated for the United States Department of Energy by Sandia Corporation. NOTICE: This report was prepared as an account of work sponsored by an agency of the United States Government. Neither the United States Government, nor any agency thereof, nor any of their employees, nor any of their contractors, subcontractors, or their employees, make any warranty, express or implied, or assume any legal liability or responsibility for the accuracy, completeness, or usefulness of any information, apparatus, product, or process disclosed, or represent that its use would not infringe privately owned rights. Reference herein to any specific commercial product, process, or service by trade name, trademark, manufacturer, or otherwise, does not necessarily constitute or imply its endorsement, recommendation, or favoring by the United States Government, any agency thereof, or any of their contractors or subcontractors. The views and opinions expressed herein do not necessarily state or reflect those of the United States Government, any agency thereof, or any of their contractors. Printed in the United States of America. This report has been reproduced directly from the best available copy. Available to DOE and DOE contractors from U.S. Department of Energy Office of Scientific and Technical Information P.O. Box 62 Oak Ridge, TN 37831 Telephone: (865) 576-8401 Facsimile: (865) 576-5728 E-Mail: [email protected] Online ordering: http://www.osti.gov/bridge Available to the public from U.S. Department of Commerce National Technical Information Service 5285 Port Royal Rd. Springfield, VA 22161 Telephone: (800) 553-6847 Facsimile: (703) 605-6900 E-Mail: [email protected] Online order: http://www.ntis.gov/help/ordermethods.asp?loc=7-4-0#online

3
SAND2007-7178 Unlimited Release
Printed November 2007
Quasi-Spherical Direct Drive Fusion Simulations for the Z Machine and Future Accelerators
Tom Nasha, Pace VanDevenderb, Norm Roderickc, and Dillon McDanield aDiagnostics and Target Physics Department, Org 1677, bEmeritus Office, Org. 12101,
cHigh Energy Density Physics Group, Org. 1670, and dPulsed Power Technologies, Org. 1650
Sandia National Laboratories P.O. Box 5800
Albuquerque, New Mexico 87185-MS1196
Abstract We explored the potential of Quasi-Spherical Direct Drive (QSDD) to reduce the cost and risk of a future fusion driver for Inertial Confinement Fusion (ICF) and to produce megajoule thermonuclear yield on the renovated Z Machine with a pulse shortening Magnetically Insulated Current Amplifier (MICA). Analytic relationships for constant implosion velocity and constant pusher stability have been derived and show that the required current scales as the implosion time. Therefore, a MICA is necessary to drive QSDD capsules with hot-spot ignition on Z. We have optimized the LASNEX parameters for QSDD with realistic walls and mitigated many of the risks. Although the mix-degraded 1D yield is computed to be ~30 MJ on Z, unmitigated wall expansion under the > 100 gigabar pressure just before burn prevents ignition in the 2D simulations. A squeezer system of adjacent implosions may mitigate the wall expansion and permit the plasma to burn.

4
ACKNOWLEDGMENTS Acknowledgements We gratefully acknowledge the superb professionalism and the general spirit of openness, collaboration, constructive criticism, and encouragement from the Pulsed Power Sciences community and especially the residents of the Q-Corridor. Without their prior work and willingness to share it with us, this work could not have been accomplished with the allocated resources. We are especially indebted to Roger Vesey, Steve Slutz, Mark Herrmann, Mike Desjarlais, Ray Lemke, Kyle Cochran, Marcus Knudsen, John Porter, and Keith Matzen of Sandia National Laboratories, and Joe Kilkenny of General Atomics.

5
CONTENTS
1. Introduction................................................................................................................................ 9
2. Technical Approach .................................................................................................................... 9
3. Analytic Scaling of Driver Requirements for QSDD AS A Function of Implosion Time ......... 9
4.0 1D Physics Description of Baseline QSDD Capsule for Z with a MICA .............................. 13 4.1 Baseline Capsule Geometry............................................................................................. 13 4.2 LASNEX Optimization and Sensitivity Analysis............................................................. 16
5.0 2D QSDD Simulations............................................................................................................ 21 5.1 LASNEX Rezoning .......................................................................................................... 21 5.2 Mesh Considerations......................................................................................................... 22 5.3 MITL Power Feed............................................................................................................. 22 5.4 Current Feed to Capsule.................................................................................................... 23 5.5 Mass loading with azimuth for uniform average acceleration.......................................... 24 5.6 Shock simultaneity with azimuthal angle for spherical convergence............................... 24 5.7 Current on axis.................................................................................................................. 25 5.8 Wall Instability.................................................................................................................. 27 5.10 Anti-Mix Layer ............................................................................................................... 29 5.11 Cavity closure and push back ......................................................................................... 29 5.12 Wall Motion in End game and PdV losses ..................................................................... 33 5.13 2-D Optimization with Simulation of Squeezer Geometry............................................. 34 5.14 Gas-filled single shell driven by MICA scale 1.4 pulse ................................................. 37 to ignition ................................................................................................................................ 37 5.15 Growth of RT instability in Gas-filled single shell driven by MICA pulse.................... 38 5.16 Quasi-spherical shells driven by wire-arrays to ignition at 100 ns implosion times ...... 40 5.17 Quasi-spherical shells driven by wire-arrays at 150 ns implosion times for refurbished Z ....................................................................................................................................... 42
6.0 Summary of Risks and Mitigations......................................................................................... 45
7.0 Summary ................................................................................................................................. 46
8.0 Conclusions............................................................................................................................. 47
9.0 Recommendations................................................................................................................... 47
10.0 References............................................................................................................................. 48

6
Figures
Figure 1 Required current as a function of implosion velocity from analytic scaling.................. 12 Figure 2 : Computed current driving the baseline QSDD capsule on the refurbished Z equipped with a MICA is shown. The implosion occurs at 212 ns, which is ~45 ns after the start of the current. .......................................................................................................................................... 13 Figure 3: Illustration of Baseline QSDD Capsule Geometry........................................................ 14 Figure 4: Material maps of a) conical 90o at 0 ns, b) shaped 180o at 0 ns, c) conical 90o at 39 ns, and d) shaped 180o at 39 ns. The shaped 180o electrode shows much less material in the vacuum near the pusher wall interface. ...................................................................................................... 24 Figure 5: Material maps of the implosion a) without the cryogenic DT anti-mix layer on the gold wall and b) with the cryogenic DT anti-mix layer on the gold wall mitigating the wall instability....................................................................................................................................................... 27 Figure 6: Material maps of the implosion at 37.6 ns with four different initial radii and aspect ratios: a) 3.08 mm, b) 2.76 mm c) 2.63 mm, and d) 2.50 mm. All the simulations have the same total mass per unit area of DT and beryllium at the equator......................................................... 28 Figure 7: Material maps of the central cavity (left) and the whole implosion above the equator (right) at a) 0 ns, b) 20 ns, c) 30 ns, d) 35 ns, e) 40 ns, f) 41.3 ns, and g) 41.775 ns................... 32 Figure 8: Material maps of the central cavity of the implosion at a) 0ns , b) 20ns , c) 30ns, and d) 40 ns. The sequence shows the initial expansion of the electrode plasma and DT layer on the gold electrode until the compressing DT gas reforms the central cavity...................................... 33 Figure 9: Material maps of the final stages of the implosion at a) 41 ns, b) 42 ns, c) 43 ns, and d) 43.4 ns after the density of gold in the wall has been increased by a factor of 3 (right) over the baseline situation (left) by artificially tripling the wall pressure to approximate the effect of the squeezer geometry. ....................................................................................................................... 36 Figure 10: Material maps of the central 500 microns of the implosion with the pressure in the gold wall artificially increased by 3X at 40 ns: a) 44 ns , b) 45 ns, and c) 46 ns ......................... 37 Figure 11: Gas-filled quasi-spherical shell driven by a ZR MICA pulse with current scaled up by a factor of 1.4. ............................................................................................................................... 38 Figure 12: Gas-filled Be shell target with 1000 Å amplitude 5 degree period perturbation to seed simulation of RT instability. ......................................................................................................... 39 Figure 13: Liner-driven quasi-sphere (LDQS) for a 60 MA, 100 ns machine ............................. 40 Figure 14: LDQS with two on-axis targets ................................................................................... 42 Figure 15: LDQS target system for ZR......................................................................................... 43
TABLES Table 1: Summary of key features of 1D QSDD simulations. ..................................................... 14 Table 2: Sensitivity of capsule performance to key simulation variables for QSDD Baseline All of these 1D simulations have EFLXM=25.44 and the JHZPD=JHZPQ=JHZPR=0 for the 1D spherical implosion. ...................................................................................................................... 19 Table 3: Development of the hot-spot plasma in 2D LASNEX simulations................................ 26 Table 4: Summary of Risks and Mitigations ................................................................................ 45

7
NOMENCLATURE 1D One dimensional 2D Two dimensional α ratio of material energy density to that of a Fermi degenerate plasma at the same
pressure ρr Integral of density ρ along the radius from 0 to r DT 50/50 (in number density) mixture of deuterium and tritium eV electron Volt (1.6 x 10⁻¹⁹ Joules) fwhm full width at half maximum ICF Inertial Confinement Fusion LDRD Laboratory Directed Research and Development MJ Mega Joule MICA Magnetically Insulated Current Amplifier QMD Quantum Molecular Dynamics QSDD Quasi Spherical Direct Drive Fusion Z The Z Machine z-pinch driver at Sandia National Laboratories

8

9
1. INTRODUCTION The long term goal of this line of research is to determine if the higher efficiency of Quasi-Spherical Direct Drive (QSDD) could produce a multi mega Joule thermonuclear yield on the renovated Z Machine and, if not, could QSDD reduce the cost and risk of a future fusion driver for Inertial Confinement Fusion (ICF). Two options for QSDD with the Magnetically Insulated Current Amplifier (MICA), which was invented to increase the current and decrease the pulse duration on the renovated Z Machine, were initially scoped in a late-start LDRD in 2006. The encouraging results were reported in SAND2007-0235.1 The LDRD Assessment Team recommended focusing on the QSDD option with cryogenic fuel for a one year LDRD to understand and mitigate the risks associated with QSDD on Z. The goals of this limited risk assessment were to explore the effects of real walls on the imploding QSDD plasma and explore the effects of the magnetic Rayleigh-Taylor instability on the stability of the pusher. The MICA development was furthered theoretically and experimentally with program funds and favorably reviewed in a Pulsed Power seminar on July 10, 2007. Progress on the QSDD research was peer reviewed on June 14, 2007, and received very favorable feedback and suggestions—all of which have been implemented. Therefore, this report summarizes the results of the FY2007 research and recommendations for further work.
2. TECHNICAL APPROACH The strategy for this LDRD consisted of the following steps:
1) Use analytic scaling and1D simulations with LASNEX to scope the dominant physics of QSDD for multi-mega Joule yield on Z with a MICA.
2) Determine the baseline capsule design that has the highest ignition margin as the starting point for optimizing QSDD in 2D LASNEX simulations.
3) Optimize LASNEX code—the dominant computer code for ICF simulations with indirect (x-ray) drive—to simulate Quasi Spherical Direct Drive capsules.
4) Use 2D LASNEX simulations with real material walls to discover and quantify the additional physics that arise in two dimensions with real walls.
5) Modify the baseline capsule design with 2D effects. 6) Assess the potential of QSDD for the Z-Machine with a MICA. 7) Summarize the research in terms of risks and mitigations. 8) Recommend next steps. 9) Explore the potential of a Liner Driven Quasi Spherical (LDQS) implosion in which an
imploding liner array replaces the MICA to shorten the pulse on the capsule for a 60 mega Ampere LDQS driver.
3. ANALYTIC SCALING OF DRIVER REQUIREMENTS FOR QSDD AS A
FUNCTION OF IMPLOSION TIME
Analytic scaling of current I versus Implosion Time τ for a specified implosion velocity U and constant ratio of pusher thickness to pusher radius guided the QSDD research and

10
illustrates the value of short pulse drivers. These constraints were chosen because the implosion velocity strongly influences the temperature of the hot spot and the ratio of pusher thickness to pusher radius strongly influences pusher stability. Consider the conditions on the equator of a QSDD capsule at radius r. The driving magnetic pressure is P = μoI2/(8π2r2). The mass per unit area at the equator is M/(4πr2) if M equals the mass of an equivalent 1D spherical capsule subtending 4π sterradians of solid angle. The acceleration of the capsule is dr2/dt2 = P/(M/(4πr2)) = μoI2/(2πM) and equals a constant for constant I. Under that approximation,
ro = (1/2) (dr2/dt2) τ2 f1
for ro = the initial capsule radius and f1 = a constant for a given current waveform to compensate for the approximation of constant current.
Combining the above equations gives
τ = (2/I) (πroM/f1μo)1/2.
The implosion velocity U for the same assumptions is
U = (dr2/dt2) τ f2 = If2(μoro/(f1πM))1/2
for f2 equals a constant for a given current waveform to compensate for the assumption of constant current.
For a family of capsules with a constant ratio of pusher thickness to pusher radius and with the mass of deuterium-tritium fuel much less than the mass of the pusher,
M = kmro3.
These equations are combined to give the following useful relationships:
τ = (ro2/I)(4πkm/μof1)1/2
ro = (I/U)( μof22/(πf1km))1/2
U = (I/ro)( μof22/(πf1km))1/2
= (I/τ)1/2(4μof24/(πf1
3km))1/4.
11
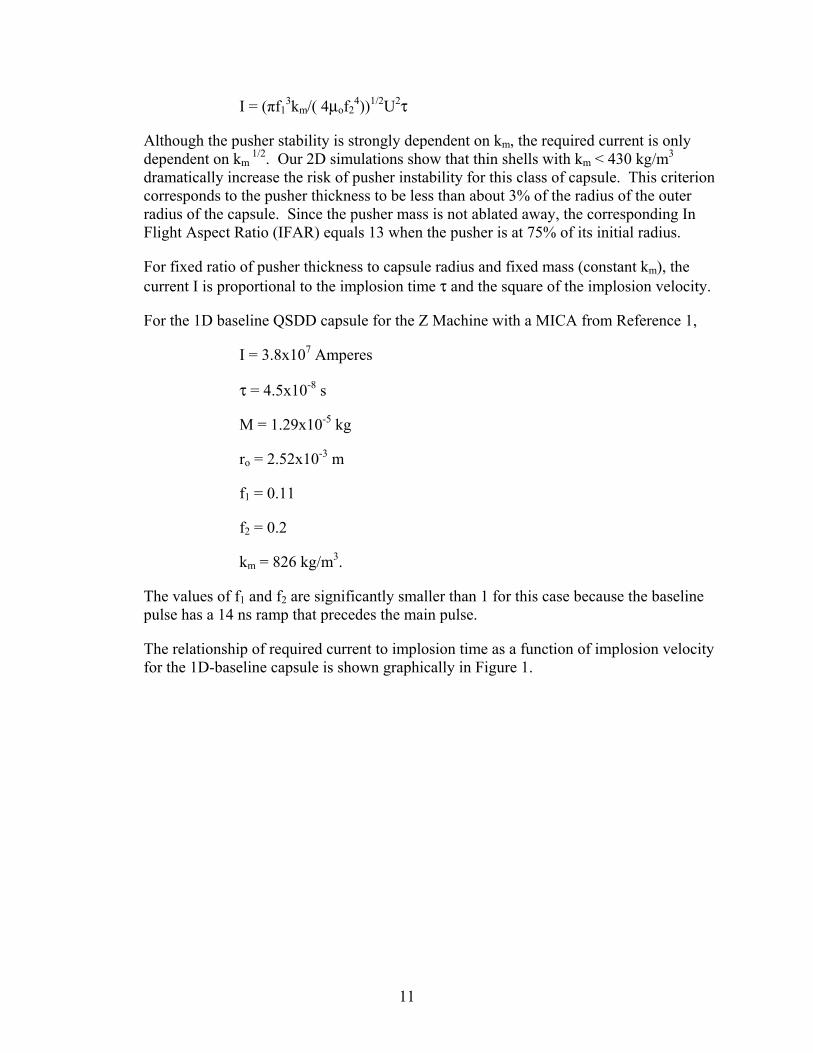
I = (πf13km/( 4μof2
4))1/2U2τ
Although the pusher stability is strongly dependent on km, the required current is only dependent on km
1/2. Our 2D simulations show that thin shells with km < 430 kg/m3 dramatically increase the risk of pusher instability for this class of capsule. This criterion corresponds to the pusher thickness to be less than about 3% of the radius of the outer radius of the capsule. Since the pusher mass is not ablated away, the corresponding In Flight Aspect Ratio (IFAR) equals 13 when the pusher is at 75% of its initial radius.
For fixed ratio of pusher thickness to capsule radius and fixed mass (constant km), the current I is proportional to the implosion time τ and the square of the implosion velocity.
For the 1D baseline QSDD capsule for the Z Machine with a MICA from Reference 1,
I = 3.8x10⁷ Amperes
τ = 4.5x10⁻⁸ s
M = 1.29x10⁻⁵ kg
ro = 2.52x10⁻³ m
f1 = 0.11
f2 = 0.2
km = 826 kg/m3.
The values of f1 and f2 are significantly smaller than 1 for this case because the baseline pulse has a 14 ns ramp that precedes the main pulse.
The relationship of required current to implosion time as a function of implosion velocity for the 1D-baseline capsule is shown graphically in Figure 1.

12
Figure 1 Required current as a function of implosion velocity from analytic scaling
In the 1D simulations at ignition with U = 20 cm/microsecond, the inwardly directed kinetic energy is approximately 30% of the fuel kinetic energy and provides a reasonable margin for ignition. The capsule energy efficiency scales as 1/U2, so implosion velocities significantly greater than the minimum substantially reduces the efficiency. Finally, the fuel is well tamped by the converged pusher. For all these reasons, the implosions velocities of interest are in the 20 cm/microsecond range.
The normal implosion time for the refurbished Z-Machine is 100 to 130 ns. Discussion is underway on 300 ns implosion times in future accelerators. As seen in Figure 1, such long implosion times are not useful for QSDD. However, the refurbished Z Machine has sufficient energy to drive a QSDD capsule if and only if the pulse duration is compressed to ~45 ns and the current amplified to 38 MA. The Magnetically Insulated Current Amplifier (MICA) was invented for that purpose and is being developed in a separate project. The computed current from a MICA on Z driving the QSDD baseline capsule is shown in Figure 2 and meets the requirements in current and implosion time.
Current Required for QSDD versus Implosion Time for Various Implosion Velocities
0
50
100
150
200
250
300
350
400
0 50 100 150 200 250 300
Time (ns)
20 cm/microsec 25 cm/microsec

13
Summary of Currents with Min Zo=1.0 Ohms
05
101520253035404550
150 170 190 210 230 250
Time (ns)
Cu
rre
nt
(MA
)
ILOAD IMICA1 IMICA2 IMICA3 I_INTO_ZFLOW IZFLOW_LOSS
Figure 2 : Computed current driving the baseline QSDD capsule on the refurbished Z equipped with a MICA is shown. The implosion occurs at 212 ns, which is ~45 ns after
the start of the current.
The current drive in Figure 2 was developed iteratively with 1D LASNEX simulations of the QSDD capsule and SCREAMER simulations of the MICA circuit to arrive at the baseline design, which is discussed in the following section. 4.0 1D PHYSICS DESCRIPTION OF BASELINE QSDD CAPSULE FOR Z
WITH A MICA
4.1 Baseline Capsule Geometry The baseline QSDD capsule is illustrated in Figure 3 and is composed of a beryllium pusher surrounding a cryogenic DT main fuel, which contains a gaseous DT filled cavity in thermal equilibrium with the cryogenic DT. The conducting conical electrodes at 30 degrees above and below the equator are made of gold and are coated with a tapered cryogenic DT layer from a radius of 300 microns to the main cryogenic fuel. The coating is a byproduct of the formation of the main fuel layer and serves as an anti-mix layer and mitigates the wall instability discussed below.

14
Figure 3: Illustration of Baseline QSDD Capsule Geometry
The 1D simulations reveal the basic dynamics of the QSDD baseline capsule for Z with a MICA. The additional effects that arise in 2D are added in a later section. The gross dynamics of the 2D simulations are very similar to that of the 1D simulations until peak compression. Some of the characteristics of the baseline QSDD capsule on Z with a MICA are summarized in Table 1.
Table 1: Summary of key features of 1D QSDD simulations. Time (ns) Feature
0 The beryllium pusher begins to conduct current at t=0 and the magnetic pressure creates a gradually rising pressure pulse in the pusher.
10.8 The magnetic pressure has formed a 0.3 megabar shock in the beryllium with the pressure rising to 0.45 megabar pressure behind it.
14.1 The shock enters the cryogenic fuel at a radius of 0.240 cm and a second shock is forming in the beryllium as the pressure continues to rise.
18.9 A discharge occurs on axis heating the gas near the axis to much less than 1 eV.
22.0 The first shock has a pressure of 0.75 megabars in the cryogenic fuel. 26.1 The 1.6 megabar combined shock enters the gas at a radius of 0.180 cm,
radiatively heats the gas to 2.1 eV and shock heats the outer region of the gas to 80 eV, increasing the α (ratio of material energy density to that of a Fermi degenerate plasma at the same pressure) to > 1000.

15
Time (ns) Feature
36.5 The shock reaches the axis and the reflected shock continues to heat the gas.
39.0 The shock has equilibrated the electron and ion temperatures throughout the hot-spot plasma to ~ 400 eV.
40.6 The pressure from the converging pusher continues to climb and the resulting pressure pulse reaches the axis—adiabatically compressing the hot-spot plasma to 2.18keV on axis,
41.2 Gas relaxes to 1.2 keV as the hot spot equilibrates. At this time, the gas-cryo interface has converged to 0.0362 cm.
43.7 The converging pusher continues to adiabatically heat the central plasma until maximum compression is achieved. The burning hot spot has a temperature of 19.9 keV and a density of 2.18 g/cm3 to a radius of 0.0102 cm and is carrying a current of 780 KA. At this time, the cryo-beryllium interface is at a radius of 0.0179 cm and α = 1.2
The 1D and 2D simulations discussed below reveal the following key features: • The computed fuel energy and fuel mass are comparable to that of high-yield
capsules. • If the MICA works on Z, the energy, power, and magnetic pressure are sufficient to
drive a QSDD capsule to a mix-degraded yield of ~30 MJ unless 2D effects prevent it.
• The capsule features a relatively low-α implosion with shock heating and adiabatic compression of the hot spot.
• The high axial current and associated magnetic trapping of the alpha particles to reduce the ρr product for ignition from the usual 0.3 g/cm2 for indirect drive to only 0.06 g/cm2 for T > 4 keV, which allows ignition with a relatively low implosion velocity of 20 cm/μs and convergence ratio of 25.
• Mix of the DT fuel with the beryllium pusher from the Rayleigh-Taylor instability, as the low density fuel decelerates the higher density pusher, kills the burn in the outer region of the DT. David Youngs2 has developed a model based on classical interface mix experiments to estimate the fraction of the fuel that is unmixed2. His model predicts about 80% of the fuel will be unmixed. Peter Amendt3 has made a more relevant model based on the fusion yield of double shell targets with a gold pusher using the Omega laser3. Both of these models are applied to the QSDD case above and indicate ~30 MJ yields could be attainable on Z with a MICA if 2D effects do not overwhelm the margins for ignition.
• The margin for ignition for QSDD capsules differs from the usual definition since the kinetic energy of the pusher is potentially available for use by the fuel; in contrast, the mass (and hence kinetic energy) of the pusher goes to zero in ablative drive of an efficient capsule. In accord with advice from Mark Herrmann, we express the margin for QSDD capsules as the kinetic energy of the fuel and pusher when the hot spot reaches 13 keV divided by the fuel energy at that time: 47.7 KJ total kinetic energy divided by 74 KJ fuel energy = 64 % in the 1D simulations.
16
4.2 LASNEX Optimization and Sensitivity Analysis LASNEX has many settable parameters to let it address a wide variety of problems. We examined the default settings and the variation from the defaults that are commonly used for simulating spherical x-ray driven inertial fusion capsules (without internal currents) and cylindrical z-pinch implosions (with internal currents), the sensitivity of QSDD simulations to these variations, and the underlying rationale for the sensitive parameters. This sensitivity study let us set the LASNEX parameters for QSDD and determine where additional work is needed to better use LASNEX for simulating QSDD capsules. We examined a total of 79 parameters and found that the results were insensitive to all but seven:
• The electrical conductivity model • The electron thermal flux limiter • The electron magnetic flux limiter • The Nernst switch • Three parameters that optimize the numerics for spherical or cylindrical implosions
The dynamics of the capsule is obviously sensitive to the diffusion of the magnetic field into the current feed, pusher, cryogenic DT, and gaseous DT. Therefore, validated models of the electrical conductivity are essential to the ability of LASNEX to compute the performance of QSDD capsules. Mike Desjarlais, et al,4,5 have been very successful in using Quantum Molecular Dynamics (QMD) to compute the conductivity of materials, including the gold, beryllium, and deuterium used in QSDD capsules. Desjarlais conductivities provide the essential foundation for meaningful calculations of QSDD performance. However, they are included in LASNEX as a table for the electrical resistivity, not as an inline calculation that provides a self-consistent value of electron-ion momentum transfer time τei and the transport properties dependent on τei. LASNEX computes τei from the local electron and ion number densities, temperature and average charge state Zbar, and uses it and the formulas in Epperlain-Haines6 to calculate:
1) cross-field electrical conductivity, 2) flux-limited thermal conductivity with multiplier EFLXM, 3) flux limited electron transport across the magnetic field with approximate magnetic flux
multiplier XMGEFLXM, and 4) the Nernst electric field perpendicular to the magnetic field and the gradient in the
electron temperature with switch XMGNERNM. If the electrical conductivity is obtained from a table—which we must do to use the Desjarlias conductivities—then τei is not calculated from the electrical conductivity but is, nevertheless, used in the calculation of the other transport processes. In principle, τei could be calculated from the Desjarlais conductivity (from the tabular value or in line as a subroutine) and give
τσ = 4πε0σme/(nee2)
for electron mass me, electron charge e, electron number density ne, electrical conductivity σ, and 4πε0 = 1.11x10⁻¹⁰ in the mks system.
17
The difference between τei and τσ causes several inconsistencies within LASNEX. We strongly recommend that LASNEX be modified to provide a self-consistent treatment of all of these transport processes with the Desjarlais conductivities as the foundation. Until then, the following prescription provides our best effort to compute the dynamics of the QSDD capsule with LASNEX. We greatly appreciate the work by Roger Vesey of Sandia National Laboratories to untangle the complicated dependencies described below. We include this summary to communicate the risk involved in our calculations and to motivate work to include a self-consistent treatment of these effects in LASNEX with the Desjarlais conductivities.
1) Use the Desjarlais QMD model in a table for the electrical resistivity and use Roger Vesey’s subroutine7 to multiply the resulting value of the conductivity by 1/(1+ω2 τei
2) for cyclotron frequency ω. The difference between τei and τσ on the simulation results is illustrated by the difference between the results of using the LASNEX default resistivity and Desjarlais tabular resistivity for the baseline capsule. For example, the ρr of the hot spot at 13 keV with the Desjarlais conductivity table is twice the value with the LASNEX default resistivity, as shown in Table 2.
2) Use the LASNEX generated τei with the thermal flux limiter EFLXM = 25.44, which is consistent with the thermal flux limited to 5% of its free-streaming value, as commonly used in the ICF community. The value is consistent with experiments with laser heated plasmas, although Atzeni and Meyer-ter-vehn8 note that a review of the experimental data by Shvarts9 is more consistent with a value of 8% +/- 2%. The computed performance of the QSDD capsule is only weakly sensitive to the difference between 5% and 8% flux limits.
3) If XMGEFLXM=0, as is often the practice in calculations of cylindrical liners, then LASNEX sets the electromagnetic electron-ion collision time τem = τei. If XMGEFLXM > 0, then LASNEX sets τem = τei/max(1, ((XMGEFLXM ue τei) /LT)), in which ue is the rms electron thermal velocity and LT is the length associated with the gradient of the electron temperature. This approach of changing the electron-ion collision time to effect a magnetic flux limiter was developed by Brackbill and Goodman10. They compared collisionless Fokker-Plank plasma simulations with fluid models for the radial thermal transport of energy from the laser focal spot in planar target experiment. Unlike the fluid simulations, the Fokker-Plank simulations show strong self-generated and convected magnetic fields and associated convective transport of thermal energy out of the hot spot. They find that restricting τei to LT/ue in fluid simulations ensures that the convective heat transport perpendicular to the magnetic field does not exceed the free-streaming limit and appropriately dominates the conductive transport, in accord with laboratory experiments. Although the default value of XMGEFLXM=1 for LASNEX (which minimally satisfies their restriction), Brackbill and Goodman recommend that the flux limit should be ~10%. We set XMGEFLXM =20 to be consistent with the 5% thermal flux limit discussed above and consistent with experiments that were done after Brackbill and Goodman’s 1982 publication.
4) The electric field from the Nernst effect (through the generalized Ohms Law) is generated by charge separation as electrons flow along the gradient in the electron temperature and across the magnetic field. Brackbill and Goodman also discuss the importance of the Nernst effect and find their limitation on τei appropriately describes the plasma transport properties when the Nernst effect is important. The treatment of the
18
Nernst term in LASNEX uses the τem = τei/max(1, ((XMGEFLXM ue τei) /LT)) expression even if we use the tabular resistivity and, thereby, not use τem
for computing the electrical conductivity. As discussed in item 1) above, the Desjarlais conductivity makes a very large difference in the computed performance of the capsule. However, LASNEX does not currently provide any way of estimating the overall effect of using the Desjarlais conductivity in the Nernst term.
5) LASNEX has one algorithmic optimization for driving cylindrical implosions (JHZPD=
JHZPQ=JHZPR=1 and one for driving spherical implosions (JHZPD= JHZPQ=JHZPR=0). The cylindrical algorithm conserves energy better than the spherical one but does not preserve the required spherical symmetry of the implosion. Roger Vesey advised setting these parameters to 0 for the spherical regions and to 1 for the cylindrical regions in the gold walls and then changing all the variables to 1 when the problem has converged and cylindrical symmetry is adequate. We followed Roger’s prescription and changed all the parameters to 1 at 40 ns into the implosion.

19
The sensitivity to the most important parameters is illustrated in the following Table for the baseline capsule. Since the capsule design could be tuned to accommodate other variations to some degree, the table represents the sensitivity of one design to the various parameters--not the optimum performance for each set of parameters.
Table 2: Sensitivity of capsule performance to key simulation variables for QSDD Baseline All of these 1D simulations have EFLXM=25.44 and the
JHZPD=JHZPQ=JHZPR=0 for the 1D spherical implosion.
The first column defines the parameters of interest. The simulation parameters are shown in the second through fifth rows and the results are shown in the subsequent rows. The results of the simulation of the baseline capsule with burn turned on and the same capsule without burn for the Z Machine with MICA are shown in the second and third columns

20
respectively. A ρr of only 0.06 g/cm2 at Ti>4 keV is sufficient to ignite the hot spot because the alpha particles are magnetically trapped in the fuel. The total energy in the DT fuel (hot spot and cryo) at peak compression is ~74 KJ and is 92 KJ without burn, which is consistent with 45% to 24% energy margin respectively. Columns two and four compare the results of Desjarlais conductivity to the LASNEX default conductivity for the baseline design. With the LASNEX default conductivity, the hot spot ρr is about half that of the simulations with the Desjarlais conductivity. The LASNEX model gives 2.4 MA of current in the hot spot—about 3 times the 0.78 MA of hot spot current with the Desjarlais model. The higher current in the hot spot means a lower magnetic pressure differential across the pusher and cryo fuel, so the compression is less efficient. In addition, the LASNEX model produces a shorter time delay between the first and second shocks in the cryo, a higher initial temperature in the gas, and about the same temperature of the hot spot. However, the hot spot density is 22% less and the hot spot radius is 20% larger than it is with the Desjarlais conductivity. Even with the significantly lower ρr, the clean-1D yield and the mix degraded yield are almost the same. Columns two and five compare the results with and without the ωτ magnetic effects on the conductivity, using Roger Vesey’s subroutine that makes the correction one cycle late. The temperature of the hot spot is only 7% less than the baseline case, the current in the hot spot is 20% less, the hot-spot ρr is down by 3%, and the margins and energy metrics are almost the same. These small effects give a mix-degraded yield of two-thirds the baseline value. The next two columns (six and seven) explore the effect of the commonly-used XMGELFXM=1 and the default XMGELFXM=0 magnetic flux multiplier. As observed in the simulations with the default LASNEX conductivities, the lower flux limiters lets more current into the hot spot plasma, reduces the maximum mass density and increases the hot-spot radius—all reducing the ρr of the implosion. Although the yield is up from the baseline, possibly from greater alpha trapping by the higher magnetic field, the implosion history is less favorable for XMGELFXM=1 and the mix-degraded yield is down by 50%. With XMGELFXM=0, there is no flux limit and the simulation is unphysical because the flux exceeds the free-streaming value, so it is not surprising that both the clean 1D and mix-degraded yields are up by a factor of 3 from the baseline. Columns eight and nine show that turning off the Nernst term in the generalized Ohm’s law leads to a higher current in the hotspot, about 30% less ρr, and greatly degraded clean 1D yield. The Nernst term is one of six terms contributing to the axial and radial electric field in the generalized Ohm’s Law in LASNEX and is calculated as EN = - β^ (B x gradTe)/(e ne|B|) for Nernst coefficient tensor β^ , magnetic field B, electron temperature Te, electron charge e, and electron number density ne. For the 1D case, gradTe is only in the radial direction, so the Nernst term contributes to the axial electric field. Chittenden and Haines11 have examined the Nernst term in z-pinches and find that it redistributes the current in a z-pinch to areas with lower temperature, providing a nearly isothermal plasma. LASNEX simulations of the QSDD baseline
21
capsule show the a qualitatively similar equilibration of the hot spot plasma. Additional analysis of the 1D and 2D simulations of the baseline capsule can determine if the Nernst effect is the cause of the equilibration and whether or not other effects of the Nernst term contribute to the different result shown in Table 2. The identical results in columns eight and nine show that if the electrical resistivity is obtained from a table (eliminating the effect of XMGELFXM on the electrical conductivity) and if the Nernst term is circumvented by setting XMGNERNM=0, then the effect of XMGEFLXM is removed from the simulation. Therefore, XMGELFXM is only important to the Nernst Term if the resistivity is obtained from a table.
5.0 2D QSDD SIMULATIONS 5.1 LASNEX Rezoning The 1D simulations described in the preceding section did not require rezoning. The 2D simulations described in this section had real material walls and severe shear in the plasma flow at and near the interfaces. These simulations required significant rezoning and rezoning is inherently diffusive to some degree. We greatly appreciate the advice and contributed subroutines of Mark Herrmann, Steve Slutz, Roger Vesey, and Ray Lemke. Building on their work, we developed the following approach to balance completion with minimal diffusive artifacts:
• Check for bowties and boomerangs on every cycle and untie them by minimal local relaxation of the grid
• Make the two zones closest to the axis continually orthogonal, i.e. give the corner points the same z-coordinate as that of the l=3 grid line, every 5 cycles. This practice prevents time step crashes as the code tries to resolve the physics very close to the axis. The zones on axis have infinite inductance in these calculations.
• Apply the Tipton rezoner every 10 cycles • Orthogonalize and repartition the zones in the DT gas that are within 300 microns of the
axis every 0.1 ns between 10 ns and 38 ns to keep the simulation from crashing as the current on axis causes tight pinching near the equator. Such a tight pinch would normally be resolved by a helical instability that a 2D simulation cannot handle.
• Separately orthogonalize and repartition the regions from the equator to the axis-- including the cells in the gold wall while maintaining the material boundaries of three regions: 1) the DT hot spot (DT density less than 1015 cm-3), 2) the main fuel (DT density greater than 1015 cm-3), and 3) the beryllium pusher while maintaining the location of the interfaces at 1) the gold wall and the DT anti-mix layer and 2) at the DT anti-mix layer and the DT gas. This rezoning is done at 38 ns and every 2 ns thereafter and preserved <3 micron resolution in the burning plasma.
• Redistribute the grid line immediately inboard from the fixed circuit line by bisecting the space between the fixed circuit line and the second smaller radius grid line every 10 cycles after cycle 3000 to prevent the simulation crashing as it tires to handle the dynamic low density flows without relaxing the fixed zones.

22
• Use 100 hydro subcycles for every magnetic cycle until we have to relax that to 10 hyrdo subcycles per magnetic cycle in the final 3 ns of the implosion. This practice greatly reduces the time required for the simulation without significantly altering the results.
5.2 Mesh Considerations Previous simulations of QSDD implosions have assumed idealized walls.12 However, walls are the unique challenge of QSDD. They conduct heat and current, ablate from Joule and radiative heating, mix with the fuel, remain behind as the adjacent implosion goes forward, compress under the shock pressure, and move to expand the central cavity—robbing the energy needed for igniting the hot spot—in the adiabatic compression phase. Therefore, we zoned the walls as realistically as practical. Following the results of Ray Lemke13, we resolved the gold wall adjacent to the capsule to 1 micron so that the zone will heat and ablate realistically. Each successive zone in the wall had twice the thickness of the previous zone. Hussey, et al,14 showed that the magnetic Rayleigh-Taylor instability is mitigated by magnetic diffusion for wavelengths less than 2π times the magnetic diffusion length. Norman Roderick’s MACH2 simulations1 of this class of QSDD capsule showed that 1 radial zone per degree of simulated plasma was sufficient to resolve the dominant magnetohydrodynamic instability at the wall and the magnetic Rayleigh Taylor instability. We adopted that zoning convention for the LASNEX simulations. The central DT gas, cryogenic DT main fuel, beryllium pusher, and vacuum region were modeled with 29, 15, 16, and 20 radial zones respectively. Based on the advice of Mark Herrmann, the radial extent of each zone was adjusted so that the total mass in adjacent zones across the gas-cryo and cryo-beryllium interfaces were approximately equal and the rest of the zones were smoothly increased or decreased with distance from the interface. Based on Steve Slutz’s advice, the six zones modeling the anti-mix layer adjacent to the gold wall had the same azimuthal dimensions as those in the adjacent DT fuel, to prevent numerical effects from artificially accelerating these zones. The MITL power feed had a floor density of beryllium of 10-6 g/cm3 and cells with a density of less than 6 x 10⁻⁵ g/cm3 did not conduct current. 5.3 MITL Power Feed The 1 mm vacuum gap in the MITL power feed of the MICA must remain open during the implosion. Stygar, et al,15 have studied 1 mm MITL gaps on Z at 13 and 19 MA for 100 ns pulses and find no evidence of closure until after the current has dropped well below its peak value. Steve Rosenthal, et al16 and Rick Spielman, et al17 have simulated MITL closure with a magnetohydrodynamics code without a radiation treatment for >100 ns implosions with 40 MA current through a 0.8 cm radius conductor (8 MA/cm) and find that short pulses are very advantageous to prevent resistive and inductive losses in the walls and that the plasma closure velocity increases dramatically after the current drops in cylindrical implosions. Dave Bliss’s18 X-ray and laser shadowgraphy of the cathode plasma in the MITL power feed with 19 MA in

23
100 ns at 1 cm radius (3 MA/cm) on Z showed an initial expansion of 0.14 mm, after which the plasma was stationary until the current decreased. Yu. L. Bakshaev, et al19 also found very little plasma expansion until after peak current at 1.8 MA through a 0.6 mm radius cathode (5 MA/cm) and ~120 ns implosions on S300 accelerator. Fortunately, the inductance of a QSDD implosion is proportional to the radius of the shell so there is no inductive spike in the voltage and no current droop. Therefore, 1 mm MITL gaps are not excluded by the experimental or theoretical results to date. However, the required current per unit circumference of these experiments and simulations were < 8 MA/cm and the QSDD experiment will have ~25 MA/cm, which has not unexplored theoretically or experimentally. LASNEX rad-hydro simulations let us examine the electrode plasma formation and motion for the 45 ns QSDD implosions for Z with a MICA. We found that the magnetic pressure from 38 MA at 2.7 mm (22.4 MA/cm) and 45 ns into the pulse of Figure 2 had compressed the wall and increased the vacuum gap by 0.2 mm but the low density plasma had expanded 0.3 mm to give a net reduction in the vacuum gap of 0.1 mm per side or 0.2 mm of the 1 mm total. If this simulation properly describes the MITL gap closure dynamics, then closure of the 1 mm gap should not preclude the QSDD capsule functioning on Z with a MICA. 5.4 Current Feed to Capsule We initially had a straight wall from the QSDD capsule to the current feed, as shown in Figure 4a. However, the large concentration of current at the 90 degree angle between the gold wall and the beryllium pusher enhanced the local heating and increased the wall ablation, as shown in the material map at 39 ns in Figure 4c. Therefore, a 180 degree current feed was adopted for the baseline and is shown in Figure 4b. The corresponding material map at 39 ns is shown in Figure 4d and shows that the wall ablation and its affect on the implosion has been successfully mitigated.
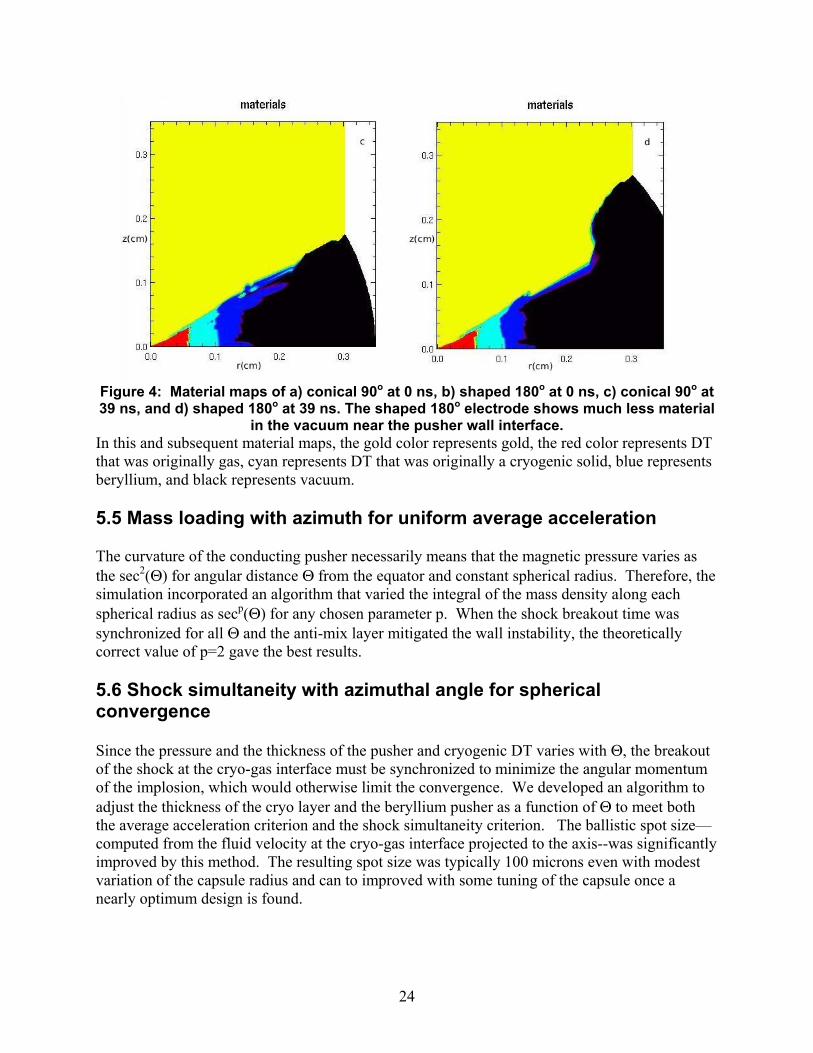
24
Figure 4: Material maps of a) conical 90o at 0 ns, b) shaped 180o at 0 ns, c) conical 90o at 39 ns, and d) shaped 180o at 39 ns. The shaped 180o electrode shows much less material
in the vacuum near the pusher wall interface. In this and subsequent material maps, the gold color represents gold, the red color represents DT that was originally gas, cyan represents DT that was originally a cryogenic solid, blue represents beryllium, and black represents vacuum. 5.5 Mass loading with azimuth for uniform average acceleration The curvature of the conducting pusher necessarily means that the magnetic pressure varies as the sec2(Θ) for angular distance Θ from the equator and constant spherical radius. Therefore, the simulation incorporated an algorithm that varied the integral of the mass density along each spherical radius as secp(Θ) for any chosen parameter p. When the shock breakout time was synchronized for all Θ and the anti-mix layer mitigated the wall instability, the theoretically correct value of p=2 gave the best results. 5.6 Shock simultaneity with azimuthal angle for spherical convergence Since the pressure and the thickness of the pusher and cryogenic DT varies with Θ, the breakout of the shock at the cryo-gas interface must be synchronized to minimize the angular momentum of the implosion, which would otherwise limit the convergence. We developed an algorithm to adjust the thickness of the cryo layer and the beryllium pusher as a function of Θ to meet both the average acceleration criterion and the shock simultaneity criterion. The ballistic spot size—computed from the fluid velocity at the cryo-gas interface projected to the axis--was significantly improved by this method. The resulting spot size was typically 100 microns even with modest variation of the capsule radius and can to improved with some tuning of the capsule once a nearly optimum design is found.
25
5.7 Current on axis Since the 1D simulations have an idealized spherical geometry all the way to the innermost (infinite inductance) zone and the 2D simulations have a more realistic gas filled cavity on axis, the electrical breakdown of the gas on axis and the axial current were significantly different in the two simulations. In the 1D simulations, the current on axis began at 19 ns but the current was very low and the resulting heating of the hot-spot plasma was < 1 eV; the hot spot was heated from large radius by the shock wave, which enters the gas at 26.1 ns, radiatively preheats the gas to 2 eV and then shocks the gas to 80 eV at the cryo interface. By 39 ns , the reflected shocks have heated the hot spot volume to a uniform 400 eV from which isentropic compression heats the gas to 19 keV. The current in the hot spot is < 800 KA until after peak compression. In contrast, the 2D simulations show the discharge occurs on axis 9 ns earlier and the gas is preheated very non-uniformly from the axis outward to the cryo fuel. By the time the shock enters the gas at 25 ns, the ion temperature of the hot spot varies from 38 eV on axis, to 1.36 eV in the middle, to 48 eV at the gas-cryo boundary. Nevertheless, by 40 ns the hot spot is carrying 1.6 MA and the hot-spot plasma has been heated to ~328 eV at a radius of 536 microns—which is quite comparable to the 400 eV of the hot spot plasma at 39 ns in the 1D simulations. The development of the 2D plasma is described in more detail in the Table 3.
26
Table 3: Development of the hot-spot plasma in 2D LASNEX simulations Time (ns) Feature
10 A small discharge occurs on axis. 12.5 The current jumps up to 3.24 KA on axis, when it is 6.8 MA in the
capsule. α has reached 500 on axis and Ti = 10eV. 15 The current has grown and stabilized at 93 KA, Te =45 eV, α =1760.
Current in the main DT fuel is 360 KA and total current is 9.36 MA. Density on axis is up to 9.25 E-3 g/cm3.
18.3 The current on axis has risen to 174 KA, Ti=65 eV, density= 0.01 g/cm3 and the blast wave has spread to 400 microns and decreasing smoothly to the gas-cryo interface.
25 The axial current continues to increase in the gas near the axis and reaches 430 KA at 25 ns, Ti=38 eV on axis. α is ~20 on axis as gold from the wall reaches the equator. The minimum gas temp = 1.36 eV midway between the axis and the gas-cryo interface, where the temperature has suddenly increased to 42 eV between 23 and 25 ns.
30 The current is 380 KA on axis and rises to 800 KA at the cryo interface. The entire hot-spot plasma shares the current now. Ti varies between 37 eV on axis and 57 eV at the hot-spot interface with the main fuel at 0.18 cm. α in gas is between 220 and 2400 (at interface with hot spot and main fuel).
35 Ti = 55 eV in the gas and the current is 570 KA to 1.15 MA—peaking at 0.0704 cm in mid hot spot. The pressure peaks at 0.1554 cm in the main fuel and is not very steep. α is ~1000 in the hot spot.
40 The compression continues to heat the gas to Thot-spot =328 eV, with a cold plasma on axis at 100 eV. It is a well formed hot spot with α = ~1000. Peak current in hot spot is 1.6MA at 0.0252 cm. Hot spot extends to 0.0536 cm.
43 At 43.07 ns, Ti on axis reaches its maximum at about 2.98 KeV when the hot spot radius = 30 microns (which is much lower than the 1D case because of axial expansion of the cavity relieves the pressure) but the hot spot on the equator is down to ρr ~0.008 and α <600. The gas has mixed into the gold wall to a radius of 10 microns and the current in the main fuel is about 7 MA.
43+ Then the simulation does a major rezone in which the cold spot on axis diminishes and Thot-spot drops to 1.255 keV—indicating that the rezoning is causing significant mix. The ρr of hot spot is 0.0086 and the current in the hot spot is ~4 MA.
45 The density is up to 300 g/cm3 in the hot-spot and 180 g/cm3 in the main fuel. The temperature of the gold-DT plasma on axis is down to 467 eV.
.
27
Since the temperature T1 from isentropic compression of a gas with γ=5/3 with temperature T0 at density ρ0 to density ρ1 is given by
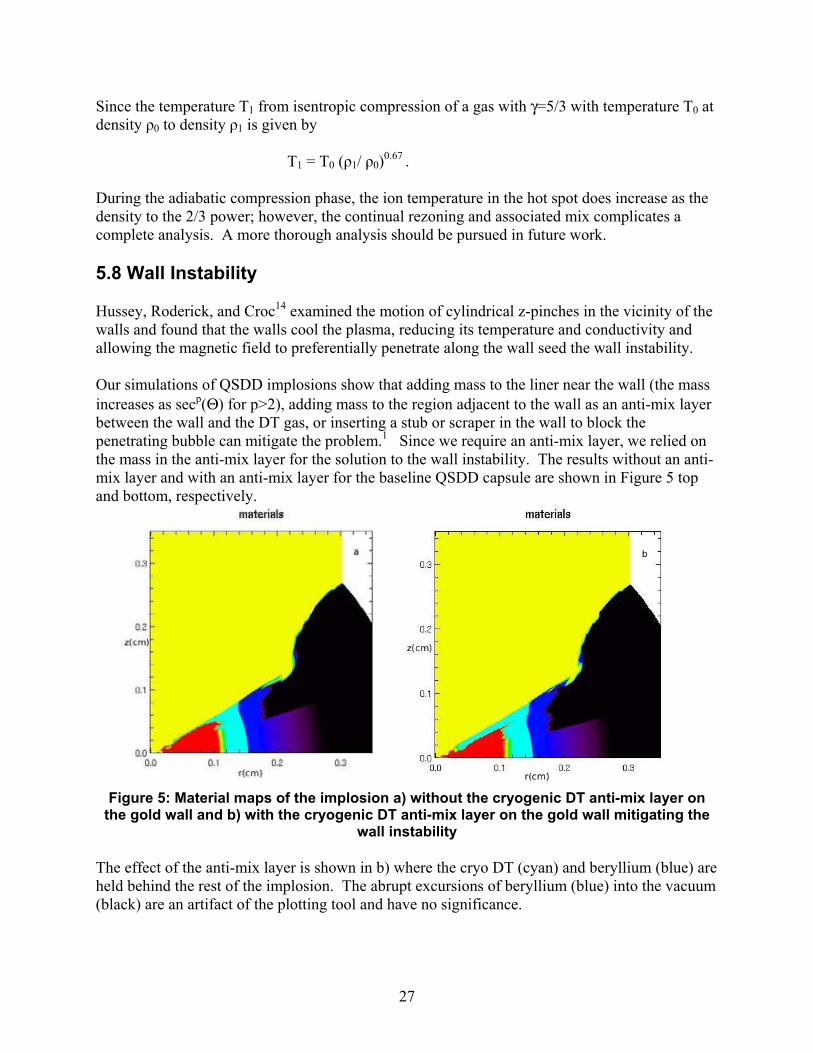
T1 = T0 (ρ1/ ρ0)0.67 . During the adiabatic compression phase, the ion temperature in the hot spot does increase as the density to the 2/3 power; however, the continual rezoning and associated mix complicates a complete analysis. A more thorough analysis should be pursued in future work. 5.8 Wall Instability Hussey, Roderick, and Croc14 examined the motion of cylindrical z-pinches in the vicinity of the walls and found that the walls cool the plasma, reducing its temperature and conductivity and allowing the magnetic field to preferentially penetrate along the wall seed the wall instability. Our simulations of QSDD implosions show that adding mass to the liner near the wall (the mass increases as secp(Θ) for p>2), adding mass to the region adjacent to the wall as an anti-mix layer between the wall and the DT gas, or inserting a stub or scraper in the wall to block the penetrating bubble can mitigate the problem.1 Since we require an anti-mix layer, we relied on the mass in the anti-mix layer for the solution to the wall instability. The results without an anti-mix layer and with an anti-mix layer for the baseline QSDD capsule are shown in Figure 5 top and bottom, respectively.
Figure 5: Material maps of the implosion a) without the cryogenic DT anti-mix layer on
the gold wall and b) with the cryogenic DT anti-mix layer on the gold wall mitigating the wall instability
The effect of the anti-mix layer is shown in b) where the cryo DT (cyan) and beryllium (blue) are held behind the rest of the implosion. The abrupt excursions of beryllium (blue) into the vacuum (black) are an artifact of the plotting tool and have no significance.

28
5.9 Magnetic Rayleigh Taylor Instability and Limitations on Shell Aspect Ratio
Although Hussey, et al14, also showed that shorter drive pulses mitigated the magnetic Rayleigh Taylor instability for wavelengths less than 2π times the scale length of the density gradient, the instability was expected to disrupt the implosion of sufficiently thin pushers. Two-dimensional simulations of capsules with the same mass of beryllium pusher and cryogenic DT fuel but different initial material radii and thicknesses explored this effect. The results are illustrated in Figure 6.
Figure 6: Material maps of the implosion at 37.6 ns with four different initial radii and
aspect ratios: a) 3.08 mm, b) 2.76 mm c) 2.63 mm, and d) 2.50 mm. All the simulations have the same total mass per unit area of DT and beryllium at the equator.
29
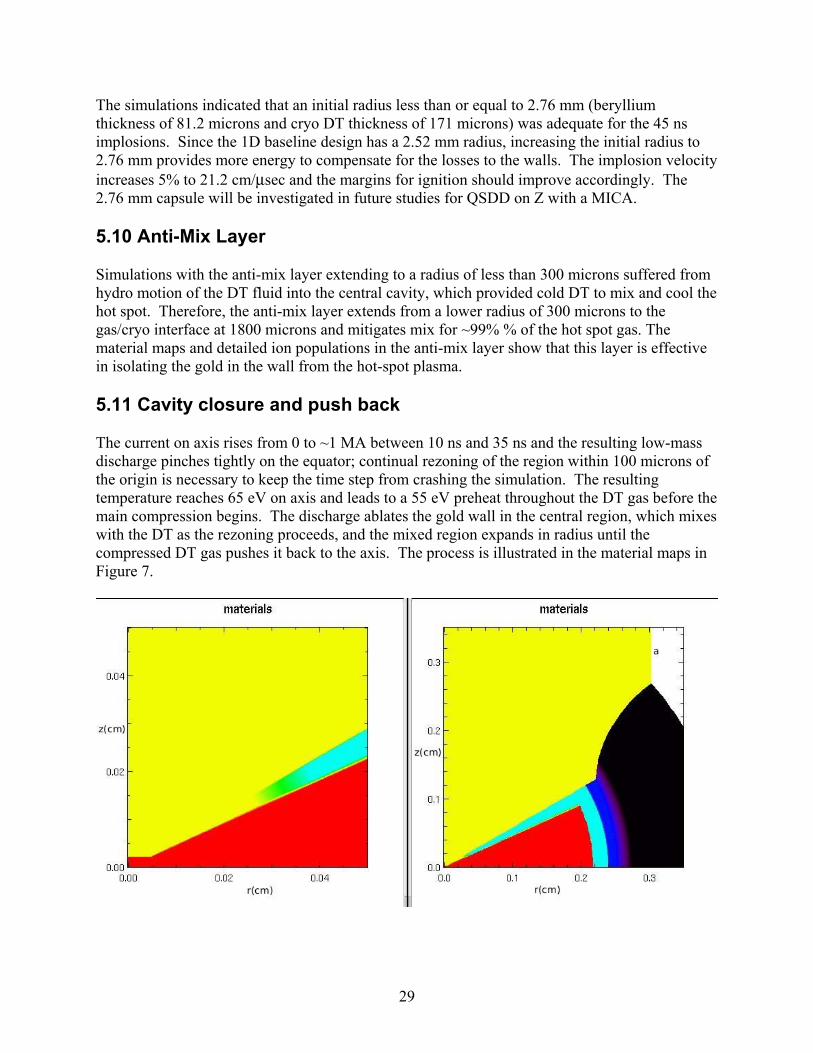
The simulations indicated that an initial radius less than or equal to 2.76 mm (beryllium thickness of 81.2 microns and cryo DT thickness of 171 microns) was adequate for the 45 ns implosions. Since the 1D baseline design has a 2.52 mm radius, increasing the initial radius to 2.76 mm provides more energy to compensate for the losses to the walls. The implosion velocity increases 5% to 21.2 cm/μsec and the margins for ignition should improve accordingly. The 2.76 mm capsule will be investigated in future studies for QSDD on Z with a MICA. 5.10 Anti-Mix Layer Simulations with the anti-mix layer extending to a radius of less than 300 microns suffered from hydro motion of the DT fluid into the central cavity, which provided cold DT to mix and cool the hot spot. Therefore, the anti-mix layer extends from a lower radius of 300 microns to the gas/cryo interface at 1800 microns and mitigates mix for ~99% % of the hot spot gas. The material maps and detailed ion populations in the anti-mix layer show that this layer is effective in isolating the gold in the wall from the hot-spot plasma. 5.11 Cavity closure and push back The current on axis rises from 0 to ~1 MA between 10 ns and 35 ns and the resulting low-mass discharge pinches tightly on the equator; continual rezoning of the region within 100 microns of the origin is necessary to keep the time step from crashing the simulation. The resulting temperature reaches 65 eV on axis and leads to a 55 eV preheat throughout the DT gas before the main compression begins. The discharge ablates the gold wall in the central region, which mixes with the DT as the rezoning proceeds, and the mixed region expands in radius until the compressed DT gas pushes it back to the axis. The process is illustrated in the material maps in Figure 7.

30

31

32
Figure 7: Material maps of the central cavity (left) and the whole implosion above the
equator (right) at a) 0 ns, b) 20 ns, c) 30 ns, d) 35 ns, e) 40 ns, f) 41.3 ns, and g) 41.775 ns

33
5.12 Wall Motion in End game and PdV losses As shown in Figure 8, the 2D implosion is very similar to a 1D implosion until ~ 40 ns, which is ~5 ns before burn occurs in the 1D implosion. At this time, the gold wall begins to move axially.
Figure 8: Material maps of the central cavity of the implosion at a) 0ns , b) 20ns , c) 30ns, and d) 40 ns. The sequence shows the initial expansion of the electrode plasma and DT
layer on the gold electrode until the compressing DT gas reforms the central cavity. The resulting PdV energy loss from the implosion to the expanding wall cools the plasma from its maximum of 2.98 keV on the equator and spoils the burn. Mitigating this expansion is the next major challenge for QSDD on Z.

34
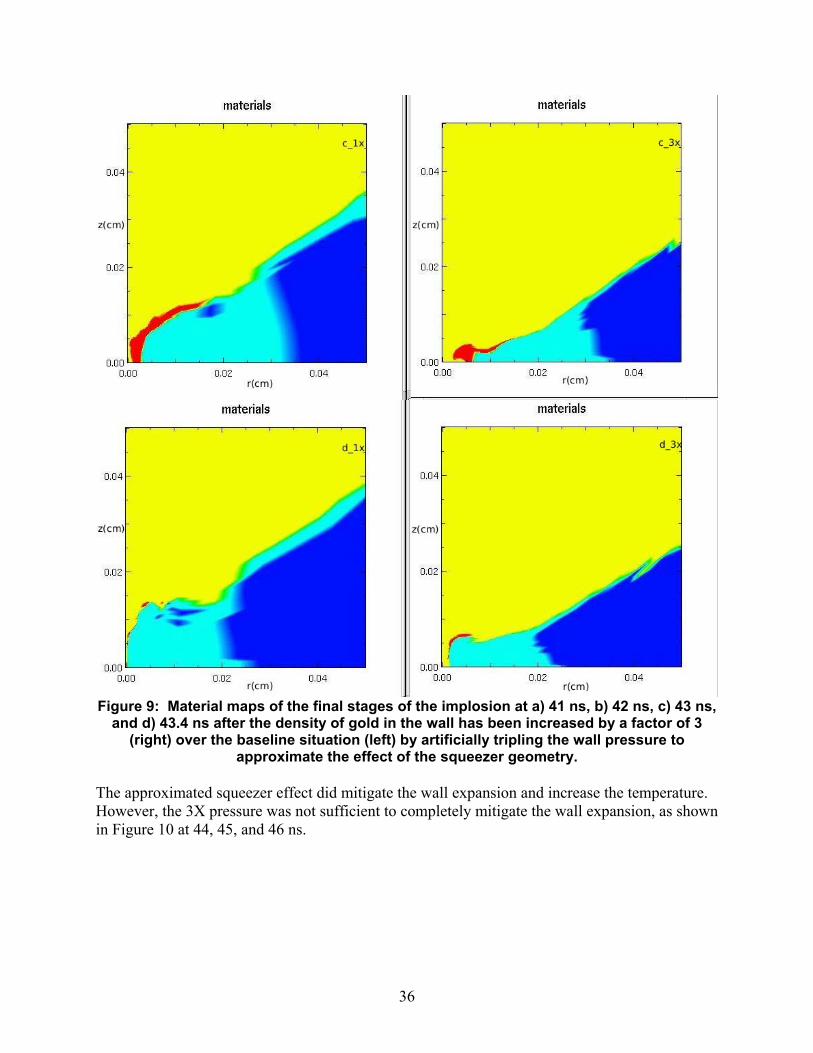
We attempted to provide more gold on axis and use the pressure of the implosion to form the cavity. However, the few attempts showed that the expansion was not sufficiently mitigated by this approach and that a significant amount of the gold remained on axis and reduced the hot-spot ρr of the DT and reduced the DT temperature. In principle, the wall expansion can be mitigated by dramatically increasing the implosion velocity and reducing the time for hot-spot compressive heating. However, obtaining a velocity significantly greater than 20 cm/microsecond with a Z class driver requires a large radius capsule with a very thin (and unstable) pusher for single shell QSDD capsules. 5.13 2-D Optimization with Simulation of Squeezer Geometry We propose driving the walls axially inward with implosions adjacent to the main implosion to squeeze the hot-spot and prevent its expansion. We approximated the effect by increasing the number of ions—therefore, increasing the pressure--in each zone of the wall material at approximately 40 ns. Simulations with increases of more than a factor of 3 in number density imploded the wall too early and the DT gas could not reach a sufficiently small radius. The burn fizzled because the ρr was too low. The material maps for the real wall simulations (left) and real wall simulations with a factor of 3 increase in the particle number density in the gold wall—and hence a factor of 3 in the wall internal energy density and pressure--at 40 ns (right) are shown in Figure 9. The comparison shows that the squeezer approach delays the axial wall expansion by ~2.4 ns and reduces the volume of the expansion by ~60% at t = 43.4 ns.
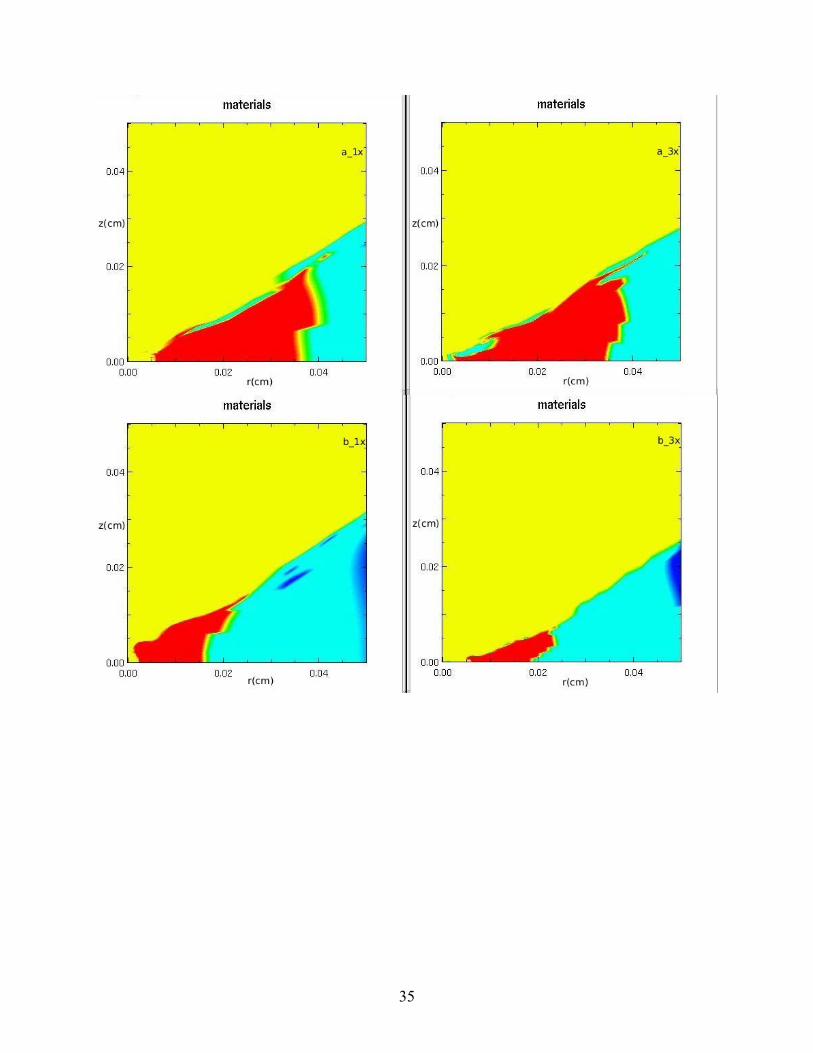
35
36
Figure 9: Material maps of the final stages of the implosion at a) 41 ns, b) 42 ns, c) 43 ns,
and d) 43.4 ns after the density of gold in the wall has been increased by a factor of 3 (right) over the baseline situation (left) by artificially tripling the wall pressure to
approximate the effect of the squeezer geometry. The approximated squeezer effect did mitigate the wall expansion and increase the temperature. However, the 3X pressure was not sufficient to completely mitigate the wall expansion, as shown in Figure 10 at 44, 45, and 46 ns.

37
Figure 10: Material maps of the central 500 microns of the implosion with the pressure in
the gold wall artificially increased by 3X at 40 ns: a) 44 ns , b) 45 ns, and c) 46 ns The burn would have occurred at 45 ns but the wall expansion cools the plasma. Fully self-consistent and integrated simulations of the QSDD implosion with adjacent squeezer implosions are required to explore this proposed mitigation further. Such simulations are beyond the scope of this LDRD but we recommend that they be undertaken in future work on the QSDD concept. 5.14 Gas-filled single shell driven by MICA scale 1.4 pulse to ignition Figure 11 illustrates a gas-filled gold shell quasi-spherical z-pinch target to be driven by a MICA scaled 1.4 pulse. The driver of this system is 52 MA with a 40 ns rise time. The time to ignition is 41 ns. The shell weighs 14 mg. If the shell is made of titanium at density 4.5 g/cc, it would be 47 µm thick at the equator and 67 µm thick at 30 degrees latitude. The thickness varies with latitude as the inverse of the cube of the cosine of the latitude. This variation is greater the square of the cosine of the latitude to prevent the implosion from occurring prematurely along the glide plane. In the computer simulation of the implosion, the shell is made of gold and is started at a density of 4.5 g/cc. Gold is used in the simulation because its conductivity is better known than the conductivity of other high and medium Z alternatives. In practice titanium might be used because it has greater tensile strength than gold and has a higher burst pressure limit than gold. The simulation is run with the glide planes set as a perfectly reflecting immoveable boundary. The shell is filled with approximately 40 atmospheres pressure of DT weighing 500 µg. The shell reaches a maximum implosion velocity of 24.3 cm/µs, and a maximum implosion kinetic energy of 430 kJ.

38
Figure 11: Gas-filled quasi-spherical shell driven by a ZR MICA pulse with current scaled
up by a factor of 1.4. The yield of this system is 36 MJ with a 24% burn fraction and a 230 ps burn fwhm. The Amendt tau value, defined as the burn time minus the fall line time and the resulting difference divided by the burn fwhm, is 0.1. The yield with 25% of the radius to the fall line duded is 17.6 MJ. As previously mentioned, the simulations of this system were run with fixed glide planes. With glide plane interactions included, the pressures in the fuel near peak compression are high enough to cause the glide plane gap to open and reduce the fuel pressure. In this simulation with fixed glide planes, the fuel pressure rises from 20 Gbar at 500 ps before the onset of ignition to 150 Gbar when ignition conditions are reached. 5.15 Growth of RT instability in Gas-filled single shell driven by MICA pulse We have simulated the growth of the Rayleigh-Taylor (RT) instability in a quasi-spherical shell driven by a MICA scale 1.0 pulse. The load for the simulation is depicted in Figure 12. The shell is 9.8 mm in diameter made of beryllium weighing 22 mg. The driving pulse is 40 MA and

39
the load is designed to implode in 60 ns, which is longer than the implosion time of the load in Section 5.14. The shell is 70 µm thick at the equator and 105 µm thick at 30 degrees latitude. An 11-atmosphere fill pressure of DT provides 560 µg of fuel. The RT instability is seeded by applying a 1000 Å amplitude perturbation to the outside of the shell with a period of 5 degrees. The simulation crashed at 55 ns into the run with a DT radius at crash of 0.18 cm. The simulation crashed due to negative volume zones in the spikes of the RT instability. At the time of the crash the RT amplitude on the outside of the shell was 240 µm, the amplitude on the inside of the shell was 100 µm and the total thickness of the shell was 600 µm. The inside of the shell at the glide plane was beginning to run ahead of the rest of the implosion and it appeared that this wall instability effect, discussed in section 5.8, would dominate the RT instability in determining the final convergence.
Figure 12: Gas-filled Be shell target with 1000 Å amplitude 5 degree period perturbation
to seed simulation of RT instability.

40
5.16 Quasi-spherical shells driven by wire-arrays to ignition at 100 ns implosion times In order to drive quasi-spherical shells with the longer implosion times characteristic of machines that are available today, it may be possible to drive a quasi-spherical fusion target with an imploding wire array as depicted in Figure 13. A cylindrical wire array is the outer load assembly and may strike an inner target with velocities of 60 cm/µs or even higher.
Figure 13: Liner-driven quasi-sphere (LDQS) for a 60 MA, 100 ns machine
The load shown in Figure 13 is designed for a 60 MA 100 ns driver. The wire array at a 2 cm radius weighs 24 mg/cm. The on-axis target is 2 mg of cryogenic DT that extends from the center outward to a radius of 0.17 cm. A 30 µm thick gold shell that weighs 10.5 mg contains the cryogenic fuel. The load of Figure 13 has been simulated in LASNEX with the wire-array approximated as a thin shell. The glide planes extend all the way out to the wire-array to simplify the simulation. In practice the glide planes would only extend to roughly twice the diameter of the target, and more than one target could be fielded on each shot. The simulation reported in this section is run with perfectly reflecting immoveable glide planes.

41
Due to the relative inductances of the two shells and the skin depth of the outer shell, the inner shell does conduct about 2.5 MA on average throughout the current pulse. This causes the inner shell to begin imploding at a velocity of about 0.4 cm/µs. Before the outer array impacts the inner shell, the inner shell/DT boundary has imploded from 0.17 cm to 0.11 cm. The current penetration to the inner shell has several beneficial effects. The inner gold shell is tamped by the current and does not significantly ablate. The gold shell begins to slowly implode and launches a slow shock into the DT fuel that provides some convergence and increases the density just behind the slow shock. Essentially the implosion of the DT fuel becomes a two-shock system, and it is the density increase of the second shock arriving on axis that ultimately triggers ignition of the fuel. The slow implosion proceeds for a convergence of approximately 2 before the fast implosion of the wire-array overcomes it. It is important that the two shocks be timed so that the fast shock overcomes the slow shock before the slow shock reaches axis. If the slow implosion proceeds to the axis before the fast shock overtakes it, the slow implosion will go unstable, and the target for the fast shock will not be symmetric. The current penetration can be prevented in the simulation by giving the outer shell a high initial temperature of 10 eV. In this case the inner gold shell draws no current and completely ablates and expands out to a 0.5 cm radius before the outer shell impacts it. This has detrimental effects. The gold becomes an internal sink of energy as the outer shell does PdV work on it rather than on the DT. Upon recompression the gold inner shell is more likely to deform and implode early at the glide plane. In the simulation with the beneficial current penetration, the outer wire-array accelerates to 60 cm/µs before impacting the inner target. After collision with the inner gold shell, the maximum velocity of the shell/DT interface is 34 cm /µs. The DT fuel is slowly compressed at 0.4 cm/µs throughout the current pulse, and then rapidly compressed at 34 cm/µs after the wire array impacts the inner gold shell. The total implosion kinetic energy of the wire-array is 5.5 MJ. As the wire-array is roughly 2 cm long, the kinetic energy per unit length is 2.75 MJ/cm. With the inner target being about 0.2 cm long, only up to 550 kJ is available to compress the inner shell. A cylindrical wire-array would be able to compress more than one quasi-spherical target in a single shot. The yield from the simulation of this target is 201 MJ with a burn fraction of 33%. The radius of the fuel at ignition is roughly 200 µm, giving a total convergence of the fuel to ignition of 8.5. Another advantage of this system is that it is not strictly volumetric ignition. We estimate that roughly 20% of the fuel ignites and propagates outward to the remaining 80% of the fuel. The ignition is provided by the stagnation of the second faster shock. In this system, ignition does not rely on ongoing heating and compression by PdV work after the stagnation of the fast shock. The shock stagnation itself ignites the fuel, and this is possible due to the first step in the density profile provided by the slow shock.

42
Another advantage to this two-shock system over a one-shock system is that the pressure in the fuel that forces the glide planes to expand is not as great and is not of as long duration as it is in a one-shock design that relies primarily on adiabatic compression. Thus the glide planes should not expand as much in the two-shock system as they would in the one shock system of Figure 11 driven by MICA. The on-axis pressure in the two-shock system rises from 10 GBar to an ignition pressure of 130 Gbar in only 300 ps. In closing this section, we wish to reemphasize that a cylindrical wire-array can drive more than one of these quasi-spherical targets in one shot and that a cylindrical wire-array is compatible with longer 100 ns implosion times. A schematic of a cylindrical wire array driving two quasi-spherical loads is shown in Figure 14.
Figure 14: LDQS with two on-axis targets 5.17 Quasi-spherical shells driven by wire-arrays at 150 ns implosion times for refurbished Z A design for a quasi-spherical gas-filled shell driven by a wire-array for the refurbished Z at 28 MA and 150 ns implosion time is shown in figure 15.

43
The driving wire-array weighs 5.7 mg/cm and is positioned at a 2.6 cm radius. If cryogenic DT were used as the fuel, the pellet radius would have to be less than 1 mm radius to keep the amount of DT less than 400 µg. The leakage current to the inner shell is enough to implode a 1 mm radius shell before the main drive of the imploding wire array arrives. Therefore, the design has a 0.18 cm radius beryllium shell filled with DT gas. The shell as shown in Figure 15 is 48 µm thick, weighs 1.8 mg and is filled with approximately 120 atmospheres giving a DT fill mass of 300 µg.
Figure 15: LDQS target system for ZR The beryllium shell draws an average current of 1 MA throughout the current pulse as the wire-array implodes. The beryllium shell does not pre-implode but rather acts like an exploding pusher during the bulk of the current drive. The outer boundary of the beryllium shell expands out to a radius of 0.25 cm, as the wire-array is about to impact it. The inner surface of the beryllium shell pushes the DT fuel to a radius of 0.07 cm just before the main drive of the impacting wire array. The maximum velocity of the Be/DT interface due to the impact of the wire-array is 40 cm/µs. The radius of the DT at peak compression is 0.015 cm for a total fuel convergence of 12. The

44
average temperature of the DT at peak compression is 3.3 keV. At the same time, the average temperature of the beryllium shell is 0.9 keV. At peak compression the fuel ρr was 0.45 g/cm2. The yield from this load, which did not ignite, was 67 kJ. In this system roughly 60% of the plasma energy internal to the wire-array is in the beryllium. Larger machines would permit using higher Z materials that do not heat as much as beryllium for the shell. Also larger machines will permit using cryogenic DT encased in a thin high-Z liner. Both of these effects will increase the amount of internal energy delivered to the DT relative to the confining shell.

45
6.0 SUMMARY OF RISKS AND MITIGATIONS
QSDD has many risks as well as substantial potential benefit. The work on this LDRD has explored many of these risks and their mitigations, which are summarized in the following Table.
Table 4: Summary of Risks and Mitigations Risk Mitigations
MITL Closure MICA requires 1 mm MITL gaps for 38 MA but Stygar15 data on Z shows closure of 1 mm gaps at 19 MA with a cylindrical z-pinch--after the voltage spike of the pinch L-dot and after the current has fallen substantially. • QSDD has dL/dr = constant, so voltage spike is small. • LASNEX simulations of the MITL electrode dynamics indicate ~0.1
mm closure for each electrode for increasing current waveform of QSDD.
• More experiments are needed.
Implosion Symmetry Polar asymmetry • Tailor rcryo to give shock simultaneity for ∂/∂Θ ~ 0. • Tailor rBe to give mass/area ~sec2Θ for acceleration. Magnetic Rayleigh Taylor Instability • Magnetic field diffusion reduces growth for λ < 2π(ρ/(∂ρ/∂r). Wall instability • Drive time <40 ns mitigates the instability per Hussey, Roderick, and
Kloc14 • Anti-mix layer mitigates the instability in LASNEX simulations of
QSDD.
Fuel-Pusher Mix Pusher/fuel mix • Used beryllium pusher instead of gold. • Designed with Peter Amendt3 criteria for mix of gold in cryo in
double shell implosions. • Designed with David Young2 criteria on mix at interfaces. Conical-Wall/fuel mix • Used cryo DT anti-mix layer on the gold wall. Cavity-wall/fuel mix • Accept the loss of DT in the gold plasma on axis.
Wall Motion Conical-Wall Motion • Use gold to tamp expansion • Implode in 45 ns. Cavity-Wall Motion • Gold on axis deforms into cavity. • Explore effectiveness of adjacent pre-implosions to provide axial
impulse and squeeze main implosion to mitigate cavity expansion.
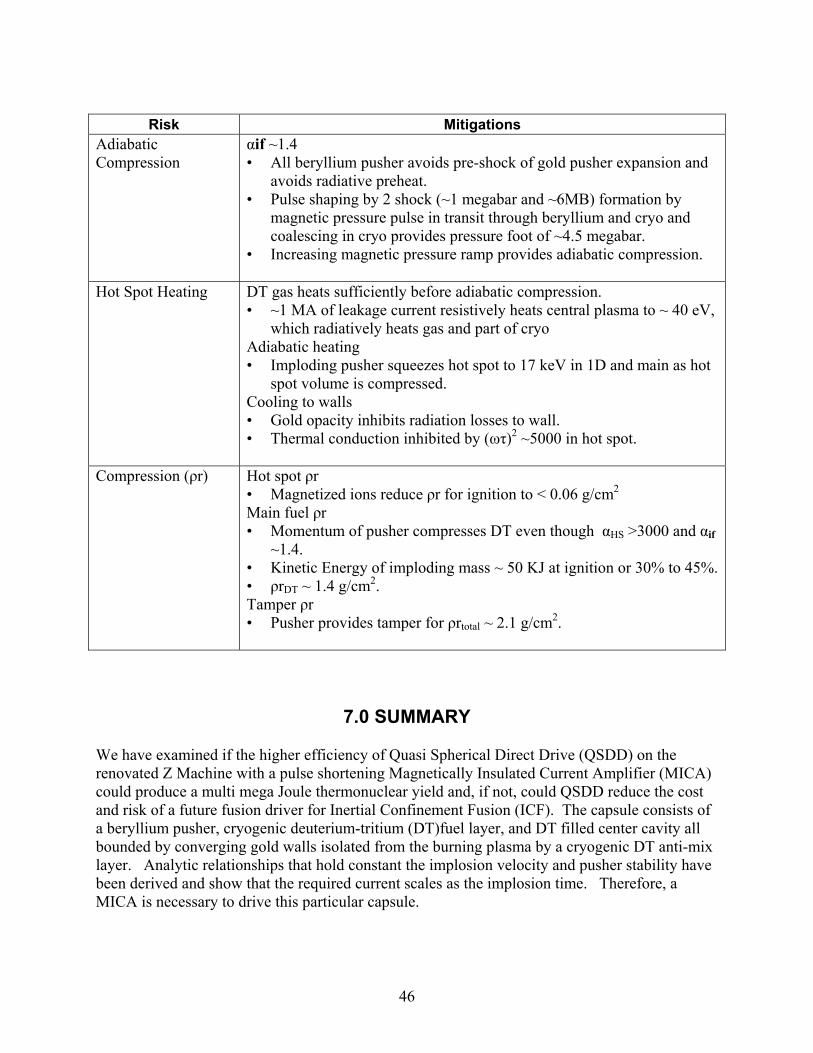
46
Risk Mitigations
Adiabatic Compression
αif ~1.4 • All beryllium pusher avoids pre-shock of gold pusher expansion and
avoids radiative preheat. • Pulse shaping by 2 shock (~1 megabar and ~6MB) formation by
magnetic pressure pulse in transit through beryllium and cryo and coalescing in cryo provides pressure foot of ~4.5 megabar.
• Increasing magnetic pressure ramp provides adiabatic compression.
Hot Spot Heating DT gas heats sufficiently before adiabatic compression. • ~1 MA of leakage current resistively heats central plasma to ~ 40 eV,
which radiatively heats gas and part of cryo Adiabatic heating • Imploding pusher squeezes hot spot to 17 keV in 1D and main as hot
spot volume is compressed. Cooling to walls • Gold opacity inhibits radiation losses to wall. • Thermal conduction inhibited by (ωτ)2 ~5000 in hot spot.
Compression (ρr) Hot spot ρr • Magnetized ions reduce ρr for ignition to < 0.06 g/cm2 Main fuel ρr • Momentum of pusher compresses DT even though αHS >3000 and αif
~1.4. • Kinetic Energy of imploding mass ~ 50 KJ at ignition or 30% to 45%. • ρrDT ~ 1.4 g/cm2. Tamper ρr • Pusher provides tamper for ρrtotal ~ 2.1 g/cm2.
7.0 SUMMARY We have examined if the higher efficiency of Quasi Spherical Direct Drive (QSDD) on the renovated Z Machine with a pulse shortening Magnetically Insulated Current Amplifier (MICA) could produce a multi mega Joule thermonuclear yield and, if not, could QSDD reduce the cost and risk of a future fusion driver for Inertial Confinement Fusion (ICF). The capsule consists of a beryllium pusher, cryogenic deuterium-tritium (DT)fuel layer, and DT filled center cavity all bounded by converging gold walls isolated from the burning plasma by a cryogenic DT anti-mix layer. Analytic relationships that hold constant the implosion velocity and pusher stability have been derived and show that the required current scales as the implosion time. Therefore, a MICA is necessary to drive this particular capsule.
47
1D and 2D LASNEX simulations with the first treatment of realistic walls integrated with the imploding plasma quantified the risks and the effectiveness of their mitigations. We have optimized the LASNEX parameters for QSDD and mitigated the following risks: Closure of the vacuum gap in the power feed, the magnetic Rayleigh-Taylor instability, the wall instability, inadequate sphericity of the implosion, insufficient hot-spot heating, inadequately low α in the main fuel, insufficient ρr product for ignition, pusher-fuel mix, and inadequate margin in the implosion energy. Although the mix-degraded 1D yield is computed to be ~30 MJ on Z with a MICA, unmitigated wall expansion under the > 100 gigabar pressure just before burn prevents ignition in the 2D simulations.
8.0 CONCLUSIONS The QSDD simulations for Z with a MICA support the following conclusions:
1. Significant thermonuclear yields on Z with a MICA appear to be possible with QSDD if the expansion of the wall in the final convergence can be controlled. 2. The Nernst (E ~ B x grad_T) effect is important in QSDD 3. LASNEX calculation of tau_e,i consistent with LMD conductivity needs to be incorporated with magnetic transport effects in thermal and electrical transport and Nernst effects
9.0 RECOMMENDATIONS
The QSDD simulations for Z with a MICA revealed one generally applicable and high-value improvement in LASNEX and four QSDD-specific recommendations as follows:
1. Improve the calculation of the electron-ion collision time τe,i so that the electrical and thermal flux-limited transport and the electric field generation from the Nernst effect near the axis are all self-consistent and are consistent with Lee-Moore-Desjarlais’s Quantum Molecular Dynamic theory for hydrogen and beryllium in a large magnetic field with (1+ω2τ2)>> 1). 2. Simulate the potential of adjacent implosions in the squeezer geometry to mitigate cavity expansion and corresponding PdV energy loss at the final implosion. 3. Optimize the capsule with 2D LASNEX simulations for Z with a MICA. 4. Determine the required fabrication tolerance for the capsule to ensure the stability of the pusher to the magnetic Rayleigh-Taylor instability. 5. Improve the LDQS simulations to include wall interactions and run LDQS simulations with the glide planes pulled apart to reduce the effects of gap closure by the wall at the hot spot and of wall motion at peak compression.

48
10.0 REFERENCES
1T. J. Nash, J. P. VanDevender, N. Roderick, D. H. McDaniel, “Quasi-spherical Direct Drive Fusion” SAND2007-0235, Sandia National Laboratories, Albuquerque, NM, January 2007. 2D. L. Youngs, “Modeling turbulent mixing by Rayleigh-Taylor Instability” Physica D 37, no.1-3, p. 270-87 (July 1989) 3Peter Amendt, H. F. Robey, H.-S. Park, R. E. Tipton, R. E. Turner, J. L Milovich, M. Bono, R. Hibbard, H. Louis, R. Wallace, and V. Yu. Glebov, “Holhraum-driven ignition-like double-shell implosion experiments on OMEGA” Phys Rev Lett 94, 065004 (2005) 4M. P. Desjarlais, J. D. Kress, and L. A. Collins, “Electrical conductivity for warm, dense aluminum plasmas and liquids” Phys. Rev. E 66, 025401 (2002) 5 M. P. Desjarlais, “Practical Improvements to the Lee-More Conductivity Near the Metal-Insulator Transition” Contrib. Plasma Phys. 41 2-3, 267−270 (2001) 6 E. M. Epperlain and M. G. Haines, “Plasma transport coefficients in a magnetic field by direct numerical solution of the Fokker-Planck equation” Phys. Fluids 29 (4) pp1029-1041 (April 1986) 7 R. A. Vesey, Sandia National Laboratories, Albuquerque, NM Private communication (2007) 8 Stefano Atzeni and Jurgen Meyer-ter-vehn The Physics of Inertial Fusion: Beam-Plasma Interaction, Hydrodynamics, Hot Dense Matter Oxford University Press (2004) pp196-201. 9 D. Shvarts “Studies of thermal electron transport in laser fusion plasmas” Laser Plasma Interactions 3 (ed. M. B. Hooper), Proceedings of the 29th Scottish Universities Summer School in Physics, SUSSP Publications, Edinburgh (1986) 10 J. U. Brackbill and S. R. Goldman, “Magnetohydrodynamics in Laser Fusion-- Fluid Modeling of Energy Transport in Laser Targets” Communications on Pure and Applied Mathematics 36, 4 p 415-436 (1983). 11 J . P. Chittenden and M. G. Haines, “Nernst and Ettinghausen effects in the dense Z-pinch: their impact upon equilibria and runaway electrons” J. Phys. D: Appl. Phys. 26 pp. 1048-1056 (1993). 12 J. Degnan, F. Lehr, J. Beason, et al, “Electromagnetic Implosion of Spherical Liner” Phys. Rev. Lett. 74, 98, (1995) 13 R. W. Lemke, J. E. Bailey, G. A. Chandler, T. J. Nash, S. A. Slutz, and T. A. Mehlhorn “Amplitude reduction of nonuniformities induced by magnetic Rayleigh-Taylor instabilities in Z-pinch dynamic hohlraums” Phys. of Plasmas 12, 012703 (2005) 14 T. W. Hussey, N.F. Roderick and D.A. Kloc, "Scaling of (MHD) Instabilities in Imploding Plasma Liners," J. Appl. Phys., 51 (3) 1452, Mar 1980. 15 W. A. Stygar, H. C. Ives, D. L. Fehl, M.E. Cuneo, M. G. Mazarakis, J. E. Bailey, G. R. Bennett, D. E. Bliss, G. A. Chandler, R. J. Leeper, M. K. Matzen, D. H. McDaniel, J. S. McGurn, J. L. McKenney, L. P. Mix, D. J. Muron, J. L. Porter, J. J. Ramirez, L. E. Ruggles, J. F. Seamen, W. W. Simpson, C. S. Speas, R. B. Spielman, K. W. Struve, J. A. Torres, R. A. Vessey,

49
T. C. Wagoner, T. L. Gililand, M. L. Horry, D. O. Jobe, S. E. Lazier, J. A. Mills, T. D. Mulville, J. H. Pyle, T. M. Romero, J. J. Seamen, and R.M. Smelser “X-ray emission from z pinches at 107 A: Current scaling, gap closure, and shot-to-shot fluctuations” Phys. Rev. E 69, 046403 (2004) 16 Stephen E. Rosenthal, Michael P. Desjarlais, Rick Bernard Spielman, W. A. Stygar, J. R. Asay, Melissa R. Douglas,C. A. Hall, M. H. Frese, R. L. Morse, and D. B. Reisman “MHD Modeling of Conductors at Ultrahigh Current Density” IEEE Trans. on Plasma Sci. 28, (5) pp 1427-1433 (2000) 17 R. B. Spielman, S. Chantrenne, D. H. McDaniel “Energy Losses in High Current Density Conductors” Proceedings of the IEEE Pulsed Power Conference, Albuquerque, New Mexico (2007) 18 D. E. Bliss, M. E. Cuneo, B. M. Jones, K. W. Struve, W. A. Stygar, E. M.Waisman “The Dynamics of Radiation Driven Gap Closure Across MegaGauss Fields on Z “, Proceedings of the IEEE Conference on Plasma Science, Albuquerque, NM (2007) 19 Yu. L. Bakshaev, A. V. Bartov, P. I. Blinov, A. S. Chernenko, S. A. Dan’ko, Yu. G. Kalinin, A. S. Kingsep, V. D. Korolev, V. I. Mizhiritskioe, V. P. Smirnov, A. Yu. Shashkov, P. V. Sasorov, and S. I. Tkachenko “Study of the Dynamics of the Electrode Plasma in a High-Current Magnetically Insulated Transmission Line” Plasma Physics Reports, 2007, Vol. 33, No. 4, pp. 259–270, Original publication in Russian is published in Fizika Plazmy, 2007, Vol. 33, No. 4, pp. 291–303.
50
Distribution 3 MS0125 Pace VanDevender 12101 1 MS1168 Dillon McDaniel 1168 1 MS1181 Marcus Knudson 1646 1 MS1186 Roger Vesey 1674 1 MS1186 Steve Slutz 1674 1 MS1186 Mark Herrmann 1674 1 MS1186 Mike Desjarlais 1640 1 MS1186 Ray Lemke 1641 1 MS1186 Kyle Cochrane 1641 1 MS1190 Keith Matzen 1600 1 MS1191 John Porter 1670 3 MS1196 Tom Nash 1677 1 MS0899 Technical Library 9536 (electronic copy) 1 MS0123 D. Chavez, LDRD Office 1011