Embed Size (px)
Citation preview

Quarterly
Review of the
Software
Industry
Q2 2013
Member: FINRA/SIPC

2
About Navidar
Navidar is an investment banking firm, providing companies and investors, in dynamic industries with
strategic M&A advice, capital raising solutions, vital insights and breakthrough opportunities.
■ Big Firm Experience Combined with Senior Banker Attention
■ Global Relationships With Top Tier Investors and World-Leading Companies
■ Greater Creativity & Customized Solutions
■ Focused on Middle Corridor of the United States
Navidar’s Differentiation
“Navidar consistently provided sound, unbiased
advice and we felt that they always put Techniks’
interests ahead of their own.”
John Stagge, Co-President of Techniks
“Navidar’s global reach, understanding of current
technology trends, and ability to navigate complex
deal issues really sets them apart from the
competition.”
Eric Tobias, CEO of iGoDigital
“Senior banker attention led to a creative deal
structure which resulted in a better outcome for our
shareholders.”
Joel Haspel, Founder and CEO of Sentient Health
“Navidar’s ability to quickly understand our business
and its drivers, deal-savvy banking team and global
reach set them apart.”
Chris Welsh, General Manager, MWM Acoustics
Has been acquired by
Sellside Advisor
December 2012
Has been acquired by
Sellside Advisor
December 2012
Has been acquired by
Sellside Advisor
October 2012
Has been acquired by
Sellside Advisor
October 2012
Has been acquired by
Sellside Advisor
July 2011
Has been acquired by
Sellside Advisor
July 2011
Has been acquired by
Sellside Advisor
October 2011
Has been acquired by
Sellside Advisor
October 2011

3
Navidar at a Glance
Experienced Strategic Advisors
Advising Dynamic Companies
Executed Over 300 Deals,
Nearly $70B of Transaction Volume
Creative Insights &
Customized Solutions
International Expertise
$8.4B of Transaction Volume
Contact Us
Austin Office New York Office Indianapolis Office Minneapolis Office
400 W. 15th Street,
Suite 325
Austin, TX 78701
1350 Avenue of the
Americas, 2nd Floor
New York, NY 10019
11711 N. Meridian
Street, Suite 325
Carmel, IN 46032
120 Sixth Street South
Suite 1200
Minneapolis, MN 55402
(T) 512-765-6970 (T) 212-994-7500 (T) 317-559-3910 (T) 612-314-0010
Stephen Day Managing Principal
Tim Walsh Managing Principal
Christopher Day Managing Principal
Steve Schmidt Managing Director
Financing
$31.5B
47%
M&A
$35.9B
53%
M&A
Corporate
Finance
Advisory
Capital
Raising
Pu
blic C
om
pa
nies
Pri
va
te C
om
pa
nie
s
Asia
$4.9B
58%
Europe
$2.2B
26%
Canada
$1.3B
16%
Technology Internet/
E-Commerce
SaaS
SoftwareBusiness
Services
MedTech and
HCITSpecialty
Manufacturing
Technology Internet/
E-Commerce
SaaS
SoftwareBusiness
Services
MedTech and
HCITSpecialty
Manufacturing
4
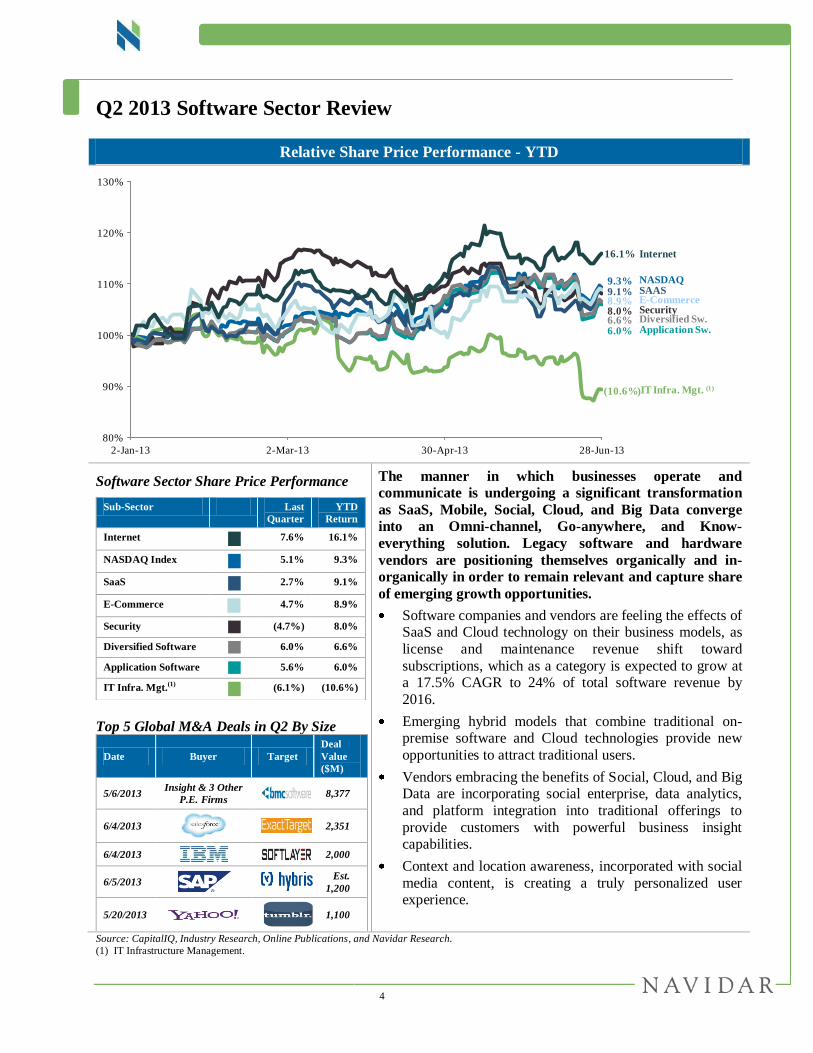
Q2 2013 Software Sector Review
Relative Share Price Performance - YTD
Software Sector Share Price Performance
Top 5 Global M&A Deals in Q2 By Size
Date Buyer Target
Deal
Value
($M)
5/6/2013 Insight & 3 Other
P.E. Firms 8,377
6/4/2013
2,351
6/4/2013 2,000
6/5/2013
Est.
1,200
5/20/2013
1,100
Sub-Sector Last
Quarter
YTD
Return
Internet
7.6% 16.1%
NASDAQ Index
5.1% 9.3%
SaaS
2.7% 9.1%
E-Commerce
4.7% 8.9%
Security (4.7%) 8.0%
Diversified Software 6.0% 6.6%
Application Software 5.6% 6.0%
IT Infra. Mgt.(1)
(6.1%) (10.6%)
The manner in which businesses operate and
communicate is undergoing a significant transformation
as SaaS, Mobile, Social, Cloud, and Big Data converge
into an Omni-channel, Go-anywhere, and Know-
everything solution. Legacy software and hardware
vendors are positioning themselves organically and in-
organically in order to remain relevant and capture share
of emerging growth opportunities.
Software companies and vendors are feeling the effects of SaaS and Cloud technology on their business models, as
license and maintenance revenue shift toward
subscriptions, which as a category is expected to grow at a 17.5% CAGR to 24% of total software revenue by
2016.
Emerging hybrid models that combine traditional on-premise software and Cloud technologies provide new
opportunities to attract traditional users.
Vendors embracing the benefits of Social, Cloud, and Big Data are incorporating social enterprise, data analytics,
and platform integration into traditional offerings to
provide customers with powerful business insight capabilities.
Context and location awareness, incorporated with social
media content, is creating a truly personalized user experience.
Source: CapitalIQ, Industry Research, Online Publications, and Navidar Research.
(1) IT Infrastructure Management.
80%
90%
100%
110%
120%
130%
2-Jan-13 2-Mar-13 30-Apr-13 28-Jun-13
9.3%9.1%
(10.6%)
6.0%
8.0%8.9%
16.1%
6.6%
NASDAQSAAS
IT Infra. Mgt. (1)
Application Sw.
SecurityE-Commerce
Internet
Diversified Sw.

5
Software Sector M&A Review
Source: CapitalIQ and Industry Research.
Global Software M&A Deals – Since 2010 Commentary
The Software sector dominated technology
transaction activity, comprising 66% of
overall technology deal volume and 63%
of overall technology deal value in the
quarter.
Global transaction volume decreased 20%
in Q2 2013, compared to Q2 2012, from 771 to 613 acquisitions. Deal value fell
9%, from $24.2 billion to $22.0 billion
(The peak for transaction volume and
value during the past 18 months occurred in Q2 2012).
- There were five software acquisitions
above $1 billion in value in Q2 2013, compared to one such transaction in
Q1 2013.
U.S. transaction volume in Q2 2013
decreased, however, total U.S. transaction
value in Q2 2013 reached a 30-month high.
U.S. Transaction volume decreased 12%
in Q2 2013, as compared to Q2 2012, from 331 to 295 acquisitions. U.S.
transaction value in Q2 2013 grew more
than 8%, from $15.1 billion to $16.3
billion, primarily driven by the $8.4 billion acquisition of BMC Software.
U.S. Middle Market transaction activity
increased sequentially, but has not
rebounded to historical levels.
Transaction volume decreased 51% in Q2
2013, as compared to Q2 2012, from 81 to
40 acquisitions. Deal value fell 45%, from $4.2 billion to $2.3 billion.
Transaction volume increased 11%
sequentially in Q2 2013, from 36 to 40
acquisitions. Deal value increased 130%,
from $1.0 billion to $2.3 billion.
U.S. Software M&A Deals – Since 2010
U.S. Middle Market M&A (<$500M) – Since 2010
Val
ue
($b
n)
$5.9
$21.6
$23.4
$16.8 $16.7
$18.4
$33.1
$15.5
$19.4
$24.2
$15.2
$19.6
$6.1
$22.0
659
648
646
650
729
704
689720
702
771
724692
558
613
0
100
200
300
400
500
600
700
800
$0
$10
$20
$30
$40
Q1 Q2 Q3 Q4 Q1 Q2 Q3 Q4 Q1 Q2 Q3 Q4 Q1 Q2N
o. o
f Deals
2010 2011 2012 2013
Valu
e (
$b
n)
$3.5
$17.7 $18.1
$12.5
$10.9
$12.8 $14.8
$12.6
$6.0
$15.1
$10.0
$11.8
$2.8
$16.3
325296 318
291
340
297
321 328
324
331
332
334
281
295
0
100
200
300
400
$0
$5
$10
$15
$20
$25
Q1 Q2 Q3 Q4 Q1 Q2 Q3 Q4 Q1 Q2 Q3 Q4 Q1 Q2
No
. of D
eals
2010 2011 2012 2013
Val
ue
($m
n)
$2,280
$4,797
$3,946
$4,718 $4,545
$4,862
$4,363
$3,409
$4,082 $4,218
$3,446
$2,053
$1,017
$2,338
77
85
81
88
97
8284
76
71
81
71
54
36
40
0
20
40
60
80
100
$0
$1,000
$2,000
$3,000
$4,000
$5,000
$6,000
$7,000
Q1 Q2 Q3 Q4 Q1 Q2 Q3 Q4 Q1 Q2 Q3 Q4 Q1 Q2
No
. of D
eals
2010 2011 2012 2013

6
Software Sector M&A Review (Cont.)
Top 10 Global Software M&A Transactions in Q2 2013
U.S. Technology M&A Activity by Sub-Sector
U.S. Software M&A Deal Volume by Size
Q2 2012 Q2 2013 Q1 2013
$ in millions
except # Number of
Deals
Total Deal
Value
Number of
Deals
Total Deal
Value
Number of
Deals
Total Deal
Value
< $50M 62 872 27 226 29 292
$50M to $100M 7 533 5 394 3 183
$100M to $250M 7 958 6 983 4 542
$250M to $500M 5 1,855 2 735 - -
$500M to $1000M 3 2,420 - - 1 794
>$1B 3 8,478 4 13,962 1 1,015
Undisclosed 244 - 251 - 243 -
Grand Total 331 15,117 295 16,300 281 2,826 Source: CapitalIQ and Industry Research.
Note: EV = Enterprise Value (Equity Value + Debt + Minority Interest – Cash and Cash Equivalents).
(1) Q1’13 excludes the proposed buyout of Dell for $29.8 billion.
Announced
Date Buyer Target
Trn. Value
($USDmm)
EV/Rev.
(x)
EV/EBITDA
(x)
06/27/2013 Adobe Systems (U.S.) Neolane (France) 600.0 10.3x NA
06/05/2013 SAP (Germany) Hybris (Germany) ~1,200.0 NA NA
06/04/2013 Salesforce.com (U.S.) ExactTarget (U.S.) 2,350.6 7.1x NA
06/04/2013 IBM (U.S.) SoftLayer Technologies (U.S.) 2,000.0 NA NA
05/21/2013 Temasek Holdings (Singapore) Markit Group (U.K.) 500.0 NA NA
05/20/2013 Yahoo (U.S.) Tumblr (U.S.) 1,100.0 84.6x NA
05/08/2013 OMERS Private Equity (Canada) Civica (U.K.) 607.8 1.9x 10.3x
05/06/2013 Insight Venture Partners & 4 Others (U.S.) BMC Software (U.S.) 8,367.8 3.1x 11.2x
04/29/2013 Alibaba Group Holding (China) Weibo.com (China) 586.0 NA NA
04/01/2013 The Nasdaq OMX Group (U.S.) BGS Partners - e-speed Platform 1,234.5 12.4x NA
M&A Deal Value ($ billions) M&A Deal Volume
$11.0
$20.4
$12.9
$20.2
$6.5
$25.9
Q1'12
Q2'12
Q3'12
Q4'12
Q1'13
Q2'13
Software Semiconductor
Hardware IT Services
(1)
516
494
506
522
447
446
Q1'12
Q2'12
Q3'12
Q4'12
Q1'13
Q2'13
Software Semiconductor
Hardware IT Services
(1)

7
Software Sector M&A Review
Review of Selected Software Transactions in Q2
Cloud/SaaS
salesforce.com acquired ExactTarget for $2.35B EV, which implied 5.7x NTM revenue.
The acquisition will add a portfolio of digital marketing services to salesforce.com’s CRM suite, and
further complement saleforce.com’s previous acquisitions of Buddy Media in 2012 and Radian 6 in 2011.
ExactTarget’s capabilities in interactive and email marketing, and marketing automation accelerate the
leadership of salesforce.com’s marketing Cloud platform, while allowing ExactTarget’s clients to
leverage salesforce.com’s sales and service CRM solutions to enhance end-to-end user experiences.
ExactTarget is a provider of cross-channel digital marketing SaaS solutions. Headquartered in Indianapolis, the
Company has global presence with offices across New York, Toronto, Munich, Stockholm, Singapore, Sydney, and Sao Paulo.
IBM acquired SoftLayer for $2B EV.
This acquisition will complement and extend IBM’s existing SmartCloud portfolio, which is on track to
deliver $7B in annual Cloud revenue in just 18 months since the division was formed.
Additionally, SoftLayer will expand IBM’s reach into new clients, including both “born-on-the-Cloud”
companies and traditional enterprises.
IBM plans to add SoftLayer to its SmartCloud business unit, forming the new Cloud Services division,
which will target a market that is expected to double by 2016 to $105 billion.
SoftLayer Technologies, based in Dallas, specializes in hosting and Cloud infrastructure, and is one of the world’s
largest hosting companies, with nearly 25,000 customers. SoftLayer specializes in public Clouds and data-center
networks that manage computing and software for businesses remotely, an area where Amazon dominates.
Trulia acquired Market Leader for $336M EV, which implied 5.4x NTM revenue.
Through the acquisition, Trulia intends to create a combined platform that services the entire real estate
market, including consumers, brokerages, agents, and franchisors.
Market Leader is a provider of on-demand CRM and marketing solutions for the real estate industry. Headquartered
in Kirkland, WA, Market Leader had operating revenues of approximately $45 million in 2012. The combined
company will have over 46,000 premium subscribers, which will be a major competitive advantage over rival
Zillow, as both companies compete for share of the $24 billion real estate marketing and software market.
Thoma Bravo acquired Keynote Systems for $399M EV, which implied 2.7x NTM revenue and
18.8x NTM EBITDA.
The acquisition provides Keynote the opportunity to expand its nascent mobile enterprise business by
partnering with major telecom players to deliver 4G and next-generation solutions.
Keynote, based in San Mateo, CA, is a prominent player in Internet and mobile Cloud testing and monitoring, and
maintains one of the world’s largest on-demand performance monitoring and testing infrastructures for Web and
mobile sites. With over 7,000 measurement computers and mobile devices in 275 locations globally, it enables
companies to continuously test and improve their online and mobile experience.
Source: CapitalIQ, Press Releases, Equity Research, Online Publications, Industry Research, and Navidar Research.
Note: EV = Enterprise Value (Equity Value + Debt + Minority Interest – Cash and Cash Equivalents)
and NTM = Next Twelve Months.

8
Software Sector M&A Review (Cont.)
Fujitsu acquired RunMyProcess for $20M EV.
This acquisition will enable Fujitsu to add iPAAS capabilities to its Cloud offerings as it expands its
global Cloud business.
RunMyProcess SAS, based in France, is a venture-backed company founded in 2007 that offers Integration Platform-as-a-Service (iPAAS), which provides customers the ability to build and deploy next-generation business-
critical applications by integrating and combining existing services and assets from both Cloud and on-premise
based solutions. RunMyProcess has more than 300 active projects in 45 countries.
Mobile
Cisco acquired Ubiquisys for $310M EV.
By acquiring Ubiquisys, Cisco can leverage its mobility and Wi-Fi capabilities to enhance Ubiquisys’
small-cell technologies for use in the next generation of cellular-connected networks.
Based in Swindon, U.K., Ubiquisys provides communication technology for large-scale adoption of small cells in
mobile and hybrid networks. Since its founding in 2004, Uniquisys has raised over $84 million in venture capital,
over 6 rounds, from investors including 5 Continents, Accel Management, Advent, Atlas, Google Ventures, and T-
Mobile Ventures.
LinkedIn Corporation acquired Pulse for $90M EV.
The acquisition will strengthen LinkedIn’s professional publishing platform for professionals and content
publishers.
Pulse, owned by Alphonso Labs and founded in Palo Alto, CA in 2010, is a news reader and mobile content
distribution platform, with over 30 million users in more than 190 countries. Alphonso Labs raised $9 million in
2011 from investors including New Enterprise Associates and Greycroft Partners. The transaction, valued at $90
million in a combination of 90% stock and 10% cash, builds upon the $119 million acquisition of professional
content-sharing site SlideShare in May 2012.
TripAdvisor acquired GateGuru. Valuation was not disclosed.
The acquisition is a direct expansion of TripAdvisor’s services, as the company looks to extend its online,
user-generated content database of reviews for destinations, hotels, and other travel-related information.
The acquisition of GateGuru follows a series of travel-related mobile and social startups acquired in
2013, including CruiseWise in May 2013, and TinyPost and JetSetter in March 2013.
GateGuru, founded in 2011 and headquartered in New York, is an operator of mobile applications that provide real-
time information on airports, flights, and weather. GateGuru brings to TripAdvisor 200 million monthly active users.
Yahoo acquired GhostBird Software and Loki Studios. Valuations were not disclosed.
These acquisitions are a part of Yahoo’s strategy to strengthen its mobile offerings and counter the loss of
display advertising share to Facebook and Google.
With these acquisitions, Yahoo is also looking to expand its pool of engineering resources and enhance its
presence in the Social Marketing segment.
GhostBird, based in Toronto, creates photography applications, including advanced iOS apps. California-based Loki
Studios is a mobile gaming start-up that develops games based on user location information such as weather,
temperature, and date, to make the gaming experience more “real.”
Source: CapitalIQ, Press Releases, Equity Research, Online Publications, Industry Research, and Navidar Research.
Note: EV = Enterprise Value (Equity Value + Debt + Minority Interest – Cash and Cash Equivalents)
and NTM = Next Twelve Months.
9
Software Sector M&A Review (Cont.)
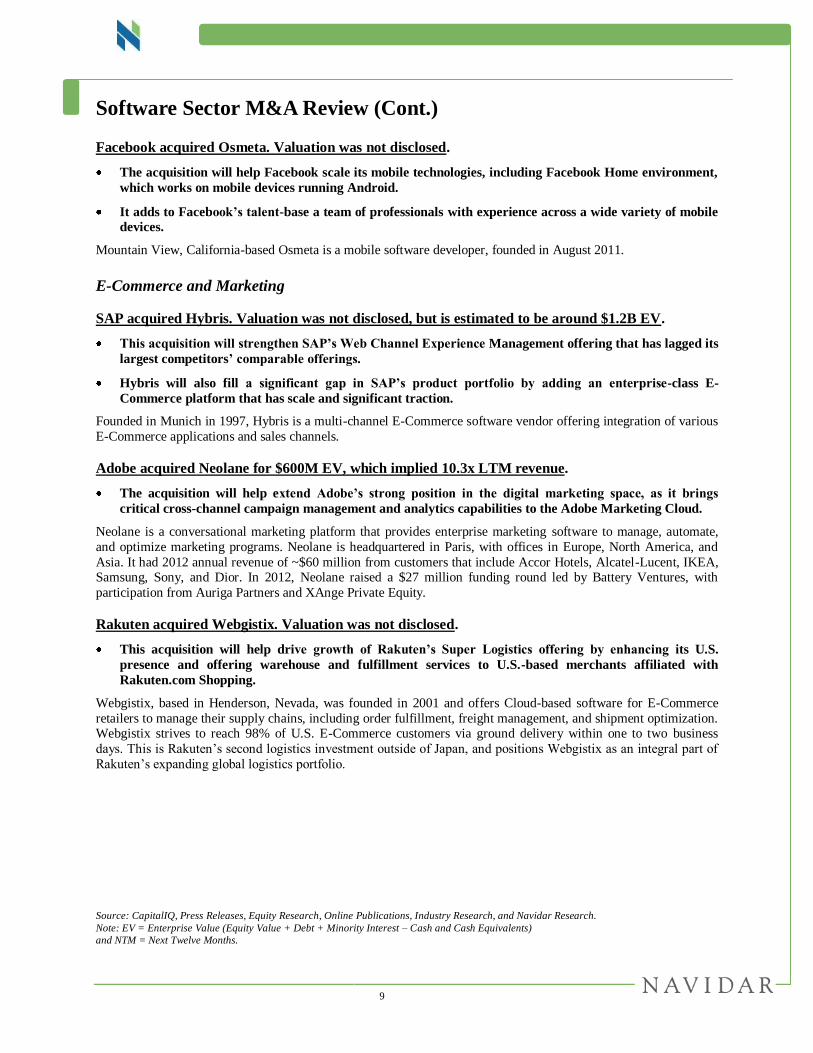
Facebook acquired Osmeta. Valuation was not disclosed.
The acquisition will help Facebook scale its mobile technologies, including Facebook Home environment,
which works on mobile devices running Android.
It adds to Facebook’s talent-base a team of professionals with experience across a wide variety of mobile
devices.
Mountain View, California-based Osmeta is a mobile software developer, founded in August 2011.
E-Commerce and Marketing
SAP acquired Hybris. Valuation was not disclosed, but is estimated to be around $1.2B EV.
This acquisition will strengthen SAP’s Web Channel Experience Management offering that has lagged its
largest competitors’ comparable offerings.
Hybris will also fill a significant gap in SAP’s product portfolio by adding an enterprise-class E-
Commerce platform that has scale and significant traction.
Founded in Munich in 1997, Hybris is a multi-channel E-Commerce software vendor offering integration of various
E-Commerce applications and sales channels.
Adobe acquired Neolane for $600M EV, which implied 10.3x LTM revenue.
The acquisition will help extend Adobe’s strong position in the digital marketing space, as it brings
critical cross-channel campaign management and analytics capabilities to the Adobe Marketing Cloud.
Neolane is a conversational marketing platform that provides enterprise marketing software to manage, automate,
and optimize marketing programs. Neolane is headquartered in Paris, with offices in Europe, North America, and
Asia. It had 2012 annual revenue of ~$60 million from customers that include Accor Hotels, Alcatel-Lucent, IKEA, Samsung, Sony, and Dior. In 2012, Neolane raised a $27 million funding round led by Battery Ventures, with
participation from Auriga Partners and XAnge Private Equity.
Rakuten acquired Webgistix. Valuation was not disclosed.
This acquisition will help drive growth of Rakuten’s Super Logistics offering by enhancing its U.S.
presence and offering warehouse and fulfillment services to U.S.-based merchants affiliated with
Rakuten.com Shopping.
Webgistix, based in Henderson, Nevada, was founded in 2001 and offers Cloud-based software for E-Commerce
retailers to manage their supply chains, including order fulfillment, freight management, and shipment optimization. Webgistix strives to reach 98% of U.S. E-Commerce customers via ground delivery within one to two business
days. This is Rakuten’s second logistics investment outside of Japan, and positions Webgistix as an integral part of
Rakuten’s expanding global logistics portfolio.
Source: CapitalIQ, Press Releases, Equity Research, Online Publications, Industry Research, and Navidar Research.
Note: EV = Enterprise Value (Equity Value + Debt + Minority Interest – Cash and Cash Equivalents)
and NTM = Next Twelve Months.

10
Software Sector M&A Review (Cont.)
Social
Yahoo acquired Tumblr for $1.1B EV, which implied 84.6x LTM Revenue.
The acquisition reflects Yahoo’s desire to remain relevant with the next generation of Internet users.
Yahoo’s CEO Marissa Mayer expects the combination could grow Yahoo’s audience by 50%, to a billion
monthly users, while allowing Tumblr to utilize Yahoo’s search algorithms to enhance its own user’s
discovery capabilities.
Tumblr, a New York-based social media platform created in 2007, enables users to share text, audio, photos, and
videos across all devices in a blog-style layout. Tumblr hosts 105 million different “micro-blogs,” with 300 million
monthly unique visitors, and is attracting over 100,000 new users daily. Yahoo will operate Tumblr as a stand-alone entity, with product development continuing to reside within Tumblr.
Google acquired Waze and Wavii. Valuations were not disclosed, but are estimated to be ~$1.1B
EV and ~$30M EV, respectively.
The integration of Waze’s mobile application, which combines inputs from over 50 million users to
improve directions, and display traffic and road-hazard details, will provide Google a competitive edge
over Apple.
The acquisition of Wavii will help Google improve its search capabilities and add new display capabilities
for Google’s database of people, places, and things around the globe.
Waze provides map software that enables automobile drivers to build and use real-time road intelligence on
smartphones. Over $67 million of venture capital has been invested into the Company since it was established in
2008. Recently, in October 2011, it raised $30 million in funding from Hong Kong-based Horizons Ventures and
Kleiner Perkins Caufield & Byer’s Digital Growth Fund. Wavii provides a natural language processing platform that
personalizes news feeds to users, summarizing web content related to their interest.
LinkedIn Corporation acquired Maybe. Valuation was not disclosed.
The acquisition is part of LinkedIn’s strategy to expand analytics into the social and mobile space.
Maybe offers online and social decision-making services. The acquisition follows LinkedIn’s earlier acquisition of
the news reading application, Pulse, in April 2013.
Yahoo acquired GoPollGo. Valuation was not disclosed.
The acquisition expands Yahoo’s efforts in real-time social and mobile feedback collection and analytics.
Founded in 2011 and headquartered in Palo Alto, CA, GoPollGo offers a social polling tool that allows consumers
to create polls and share them on various social media platforms, such as Facebook and Twitter.
Source: CapitalIQ, Press Releases, Equity Research, Online Publications, Industry Research, and Navidar Research.
Note: EV = Enterprise Value (Equity Value + Debt + Minority Interest – Cash and Cash Equivalents)
and NTM = Next Twelve Months.

11
Software Sector M&A Review (Cont.)
Big Data
Salesforce.com acquired EdgeSpring for $80M EV.
Edgespring’s patent-pending technologies will allow salesforce.com to enhance its analytics portfolio by
offering the parsing of unstructured intelligence data, providing a new generation of decision-making
platforms to its enterprise clientele.
Headquartered in San Mateo, CA, EdgeSpring offers a BI platform that accelerates and simplifies the building of
analytics applications to gain insights across various types or structures of data. The Company raised a total of $11
million in financing, including a $9 million Series A from Kleiner Perkins Caufield & Byers and Lightspeed
Ventures.
Wipro acquired minority stake in Opera Solutions for $30M EV.
This investment will help Wipro extend its leadership in the Big Data analytics space, as it combines
Opera Solutions’ machine learning expertise and pre-discovered predictive signals and algorithms, with
its domain and technology expertise, to create a comprehensive, industry-specific solution.
Headquartered in New York, Opera Solutions provides predictive and prescriptive analytics to businesses and
governments globally. Opera Solutions is one of the largest companies in the predictive data analytics space, with revenues of ~$100 million in 2012. In 2011, Opera Solutions received $84 million in funding from Silver Lake
Sumeru, Accel-KKR, and three other investors.
IT Infrastructure Management
Investor Group acquired BMC Software for $8.4B EV, which implied 3.0x NTM revenue and 7.6x
NTM EBITDA.
As a private company, BMC plans to become more aggressive in managing Cloud-computing
applications and mobile devices.
BMC Software provides system and service management solutions for enterprises, and had $2.2 billion of revenue
in its fiscal year ended March 2013, of which 40 percent of its sales came from managing IBM’s mainframe
computers. BMC has had a difficult time gaining market share in the server software industry, which has been
moving to companies’ data centers as customers rely more on programs delivered over the Web. The investor group
included Insight Venture Partners, GIC Special Investments, Bain Capital, and Golden Gate Capital.
SolarWinds acquired N-able Technologies International for $120M EV.
The acquisition will help SolarWinds better address the IT management problems faced by small
enterprises, whose smaller workforces rely on advanced remote access and automation capabilities to
efficiently service their platforms.
N-able Technologies provides a spring-board for SolarWinds to offer multi-tenant solutions to a wide
range of MSPs, from its previously large, single-tenant framework that limited interaction with these
providers.
SolarWinds estimates that N-able Technologies will add an additional $4.0 billion worldwide market
opportunity to its current offerings.
N-able Technologies International provides Cloud-based remote monitoring and management (RMM) and service
automation software for Managed Service Providers (MSP). N-able Technologies International, based in Ottawa,
Canada, serves over 91,000 small businesses and sells its products through 2,600 MSPs.
Source: CapitalIQ, Press Releases, Equity Research, Online Publications, Industry Research, and Navidar Research.
Note: EV = Enterprise Value (Equity Value + Debt + Minority Interest – Cash and Cash Equivalents)
and NTM = Next Twelve Months.

12
Software Sub-Sector – Public Company Equity Market Performance
Application Software
Selected segment participants out-
performed the overall equity market by
0.5% in Q2 2013, as the movement to
Cloud-based ERP and CRM systems is
expected to contribute significantly to
future growth. Though new sales are in
decline, on-premise software is still generating lucrative maintenance revenues
for license-based software providers.
Significant Share Price Fluctuations:
Dealertrack Technologies 23.0% Q1 EPS and revenue beat Street expectations. Focus on selling broader
Machine-to-Machine solutions to dealerships led to increased momentum in subscription products and was a primary driver of revenue growth.
OpenText 17.9% FQ3 revenue was up 16% YoY, primarily driven by a significant increase in
license revenue (+13% YoY).
Company declared its first ever dividend, a non-cumulative quarterly
dividend payment of $0.30 on June 21, 2013.
MicroStrategy (15.6%) Q1 revenue missed Street expectations, primarily due to a large dip in
product licenses revenues (down 24%).
Autodesk (15.0%) FQ1 2014 revenue guidance was at the bottom-end of earlier guidance, and
well below Street expectations, stemming from weakening macro sentiments and a more difficult selling environment.
Diversified Players
Selected segment participants out-
performed the overall equity market by 0.9%. Large potential growth opportunities
still exist in emerging markets, where
significant revenue share comes from new
software licenses fees. More mature IT
regions have shifted focus to CRM, SaaS,
and Public Cloud solutions as their top
priorities.
Significant Share Price Fluctuations:
Microsoft 20.7% FQ3 Windows Division revenue realized growth of 23%, due to increasing adoption of Office 365, Windows Azure, Xbox LIVE, and Skype Cloud
services.
Adobe Systems 5.0% FQ2 EPS beat Street expectations, driven largely from a 14% increase in
Creative Cloud subscriptions as compared to FQ1.
SAP (9.4%) Downgraded by HSBC from Overweight to Neutral, citing license sales seasonality and valuation metrics being close to highs leaving limited
upside in valuation.
Source: CapitalIQ, Equity Research, Industry Research, and Navidar Research.
97%
102%
107%
112%
1-Apr-13 23-Apr-13 15-May-13 6-Jun-13 28-Jun-13
NASDAQ Diversified
6.0%
5.1%
97%
102%
107%
112%
1-Apr-13 23-Apr-13 15-May-13 6-Jun-13 28-Jun-13
NASDAQ Application
5.6%
5.1%

13
Software Sub-Sector – Public Company Equity Market
Performance (Cont.)
E-Commerce
Selected segment participants under-
performed the overall equity market by
0.4%. While E-Commerce sales are expected to grow by 17% in 2013, there
has been an estimated 70% increase in
number of E-Commerce companies over
the same period. Legacy B2B E-
Commerce platforms are continuing their
enhancement of B2C cross-channel
capabilities in mobile and social to remain
relevant.
Significant Share Price Fluctuations:
Orbitz Worldwide 44.9% Q1 revenue and EPS beat Street expectations, primarily driven by higher hotel volume and increasing airline revenues.
Groupon 43.5% Q1 revenue beat Street expectations, with the number of active customers sharply increasing and record North American mobile transactions
performance.
ValueClick (14.2%) Q2 revenue guidance missed Street expectations, with a stagnant growth forecast for Q3.
eBay (7.2%) Q1 revenue and EPS missed Street expectations, with a diminished future outlook, as a result of poor macroeconomic conditions in Europe.
Internet
Selected segment participants out-
performed the overall equity market by
2.5%. Average time spent online continues
to rise, reaching over three hours daily, as
usage of social networks and digital video
platforms continue to grow. Advances in Big Data technologies are helping SEOs
expand their uses of structured data to
answer search queries with increasing
accuracy.
Significant Share Price Fluctuations:
Yelp 51.9% Q1 revenue beat Street expectations, driven by a record number of monthly
unique visitors, local business accounts, and cumulative reviews on the site.
Google 9.9% Non-GAAP EPS in Q1 beat Street expectations, due to an unusually high
increase in aggregate paid clicks on Google sites and those of network members.
AOL (4.9%) Revenue in Q1 missed Street expectations, due in large part to the continued
decline in total subscription revenue.
Source: CapitalIQ, Equity Research, Industry Research, and Navidar Research.
95%
100%
105%
110%
1-Apr-13 23-Apr-13 15-May-13 6-Jun-13 28-Jun-13
NASDAQ E-Commerce
4.7%
5.1%
95%
100%
105%
110%
115%
1-Apr-13 23-Apr-13 15-May-13 6-Jun-13 28-Jun-13
NASDAQ Internet
7.6%
5.1%

14
Software Sub-Sector – Public Company Equity Market
Performance (Cont.)
SaaS
Significant Share Price Fluctuations:
Demandware 67.5% Q1 revenue beat Street expectations, driven by large growth in subscription
revenues and record numbers of live sites added in the quarter.
Responsys 64.7% Q1 revenue beat Street expectations, primarily driven by strong volume in
digital marketing messages and higher-than-anticipated professional services demand.
LivePerson (33.3%) Headwinds from the LP Marketer and LP Insights platforms, as well as
EMEA headwinds, prompted management to downgrade revenue and EPS guidance far below Street expectations.
Vocus (19.5%) Q1 2013 revenue and EPS missed Street expectations, primarily from a
significant decrease in new annual subscription customers added compared to the same period last year.
Security
Selected segment participants under-
performed the overall equity market by
9.8%. Advanced attack toolkits, including Stuxnet and Flame, are nearly impossible
to detect, and shift the segment towards
white-listing application-specific security
suites. Mobile malware and security end-
point breaches are the largest risk to
mobility in the enterprise.
Significant Share Price Fluctuations:
Imperva 18.4% Revenue in Q1 beat Street expectations, with strong growth in services and
subscriptions revenues.
Fortinet (23.8%) Q1 revenue and billings missed guidance, primarily due to a difficult global
macroeconomic environment and uncertainty in geopolitical issues.
Symantec (8.1%) Weak sales in Q1 and diminished profit forecast for FQ1 2014 were due to a
slumping PC market, which adversely affected the consumer security business.
Source: CapitalIQ, Equity Research, Industry Research, and Navidar Research.
95%
100%
105%
110%
1-Apr-13 23-Apr-13 15-May-13 6-Jun-13 28-Jun-13
NASDAQ SAAS
2.7%
5.1%
90%
95%
100%
105%
110%
1-Apr-13 23-Apr-13 15-May-13 6-Jun-13 28-Jun-13
NASDAQ Security
(4.7%)
5.1%
Although the selected segment participants
under-performed the overall equity market
by 2.4%, SAAS is continuing to gain
traction at a rapid rate. Nearly half of
North American organizations confirmed
that they now evaluate Cloud-based
solutions when they are buying software.
Perpetual license revenues have been
shrinking since 2004 while subscription
revenues are forecasted to grow at a 17.5% CAGR to reach 24% of total software
revenue by 2016, up from 12.5% in 2012.

15
Software Sub-Sector – Public Company Equity Market
Performance (Cont.)
IT Infrastructure Management (IT Infra. Mgt.)
Significant Share Price Fluctuations:
Infoblox 38.0% FQ3 revenue, EPS and respective future guidance beat Street expectations, with strong demand across all geographic regions and verticals.
Falconstor Software (47.3%) Revenues in Q1 missed Street expectations, as unpredictable performance
from one of the biggest Chinese OEM partners weighed on the quarter.
SolarWinds (33.4%) Q1 revenue missed Street expectations, with Management lowering its
revenue outlook for FY13, primarily driven by slow growth in new license sales.
F5 Networks (21.7%) Revenue in Q1 missed Street expectations, as longer sales cycles,
particularly in the telecom and U.S. federal sales verticals, led to disappointing performance in the quarter.
Source: CapitalIQ, Equity Research, Industry Research, and Navidar Research.
Selected segment participants under-
performed the overall equity market by
11.2%, as growth in Machine-to-Machine
networks and data creation has yet to
reach levels previously predicted.
Relational databases are still prevalent in
most IT management systems, but a
growing shift towards transactional systems that integrate with NoSQL
databases provide opportunities for future
growth in Big Data capabilities. The
largest growth opportunities exist in
Network Access Control; Gartner predicts
15% growth in 2013, as companies look to
better track applications and access of
users on their networks.
90%
95%
100%
105%
110%
1-Apr-13 23-Apr-13 15-May-13 6-Jun-13 28-Jun-13
NASDAQ IT Infra. Mgt.
(6.1%)
5.1%

16
Comparable Public Company Operating Metrics – Software Sector
Enterprise Value/CY 2013E Rev. CY 2013E Rev. Growth%
Enterprise Value/CY 2013E EBITDA CY 2013E EBITDA Margin %
Price/Earnings 2013E Price-to-Earnings Growth Ratio 2013E
Source: CapitalIQ.
Note: Market Data as of Q2 2013 Quarter End.
Note: Estimates Based on Consensus of Equity Research Analyst Estimates.
Note: Multiples Excludes Outlier for EV/CY Rev. > 15x, EV/CY EBITDA > 35x, P/E > 50x, and PEG > 3x.
Note: CY = Calendar Year, LTM = Last Twelve Months, and NTM = Next Twelve Months.
Note: EV = Enterprise Value (Equity Value + Debt + Minority Interest – Cash and Cash Equivalents).
(1) IT Infrastructure Management
5.7x5.2x
5.0x
4.1x
3.4x3.3x
2.7x
0.0x
0.5x
1.0x
1.5x
2.0x
2.5x
3.0x
3.5x
4.0x
4.5x
5.0x
5.5x
6.0x
Internet Security SAAS IT Infra. Diversified Application E-Commerce(1)
25.1%
20.9%
14.8% 14.1% 13.6%
11.5%
3.8%
0.0%
3.0%
6.0%
9.0%
12.0%
15.0%
18.0%
21.0%
24.0%
27.0%
SAAS Internet E-Commerce IT Infra. Security Application Diversified(1)
18.2x
14.4x14.1x
13.1x
11.6x10.3x 9.7x
0.0x
2.0x
4.0x
6.0x
8.0x
10.0x
12.0x
14.0x
16.0x
18.0x
20.0x
SAAS Security E-Commerce IT Infra. Internet Application Diversified(1)
39.2%37.1%
36.3%34.1%
29.2%
18.8% 18.3%
0.0%
7.0%
14.0%
21.0%
28.0%
35.0%
42.0%
Security Diversified Internet IT Infra. Application E-Commerce SAAS(1)
30.9x27.9x
25.2x
20.8x
18.3x 18.3x 16.7x
0.0x
4.0x
8.0x
12.0x
16.0x
20.0x
24.0x
28.0x
32.0x
SAAS E-Commerce Internet Security IT Infra. Application Diversified(1)
1.54x 1.52x 1.45x1.33x 1.31x 1.28x 1.27x
0.0x
0.2x
0.4x
0.6x
0.8x
1.0x
1.2x
1.4x
1.6x
Security Diversified SAAS Internet Application E-Commerce IT Infra.(1)
Average
Average
Average
Average
Average
Average

17
Comparable Public Company Operating Metrics – Software
Sector (Cont.)
LTM Gross Margin % 5-Year Net Income Growth %
LTM Sales & Marketing Expense as a % of Revenue LTM R&D Expense as a % of Revenue
Source: CapitalIQ.
Note: Market Data as of Q2 2013 Quarter End.
Note: Estimates Based on Consensus of Equity Research Analyst Estimates.
Note: Multiples Excludes Outlier for EV/CY Rev. > 15x, EV/CY EBITDA > 35x, P/E > 50x, and PEG > 3x.
Note: CY = Calendar Year, LTM = Last Twelve Months, and NTM = Next Twelve Months.
(1) IT Infrastructure Management
81.3% 80.1% 79.8%75.7%
66.7%
64.4%60.2%
0.0%
10.0%
20.0%
30.0%
40.0%
50.0%
60.0%
70.0%
80.0%
90.0%
IT Infra. Security Diversified Application SAAS Internet E-Commerce(1)
26.1%
22.5%
18.1%
16.5% 16.3%
15.5%
10.7%
0.0%
4.0%
8.0%
12.0%
16.0%
20.0%
24.0%
28.0%
SAAS E-Commerce Internet Security IT Infra. Application Diversified(1)
40.0% 38.7%
32.6%
29.2% 28.0%28.0%
22.1%
0.0%
6.0%
12.0%
18.0%
24.0%
30.0%
36.0%
42.0%
SAAS IT Infra. Security Application Internet Diversified E-Commerce(1)
18.5%
17.1%16.5% 15.9% 14.8%
13.9%
11.3%
0.0%
4.0%
8.0%
12.0%
16.0%
20.0%
Internet SAAS IT Infra. Application Diversified Security E-Commerce(1)
LTM G&A Expense as a % of Revenue
15.7%
14.3%
10.9%
9.8% 9.0%8.9%
6.4%
0.0%
3.0%
6.0%
9.0%
12.0%
15.0%
18.0%
SAAS Internet Application IT Infra. E-Commerce Security Diversified(1)
Average
Average
Average
Average
Average

18
Valuation & Revenue Growth Correlation – Public Software Companies
Source: CapitalIQ. Estimates Based on Consensus of Equity Research Analyst Estimates.
Note: Market Data as of Q2 2013 Quarter End. Note: CY = Calendar Year.
Note: EV = Enterprise Value (Equity Value + Debt + Minority Interest – Cash and Cash Equivalents).
ORCL
VMW
SYMC
CTXS
CA
RHT
FFIVBMC
SWI
CVLT
TIBX
RVBD
BLOX
PRO
-5.0%
0.0%
5.0%
10.0%
15.0%
20.0%
25.0%
30.0%
35.0%
0.0x 1.0x 2.0x 3.0x 4.0x 5.0x 6.0x 7.0x 8.0x
CY 2013E Revenue Growth %
EV/CY2013E Revenue
IT Infrastructure Management (IT Infra. Mgt.)
MSFT
ADSK
SAP
INTU
ORCL
ANSS
OTEX
PMTC
MANH
TRAK
MSTR
BIRTQAD
-3.0%
0.0%
3.0%
6.0%
9.0%
12.0%
15.0%
18.0%
0.0x 1.0x 2.0x 3.0x 4.0x 5.0x 6.0x 7.0x 8.0x
CY 2013E Revenue Growth %
EV/CY2013E Revenue
Application
SYMCCHKP
VRSN
FTNT
FIRE
IMPV
0.0%
5.0%
10.0%
15.0%
20.0%
25.0%
30.0%
0.0x 1.0x 2.0x 3.0x 4.0x 5.0x 6.0x 7.0x 8.0x
CY 2013E Revenue Growth %
EV/CY2013E Revenue
Security
MSFT
ORCL
SAP
ADBE
SYMC
-8.0%
-3.0%
2.0%
7.0%
12.0%
17.0%
0.0x 1.0x 2.0x 3.0x 4.0x 5.0x 6.0x
CY 2013E Revenue Growth %
EV/CY2013E Revenue
Diversified
CRM
IL
NOW
CNQRULTI
QLIKGWRE
CSOD
ET
RP
SNCR
JIVELOCK
DWRE
LPSN
SPSC
SQI
CALD
CARBLOGM
TNGO
MKTGCTCT
SREVVOCS
BV
INTU
0.0%
10.0%
20.0%
30.0%
40.0%
50.0%
60.0%
70.0%
0.0x 2.0x 4.0x 6.0x 8.0x 10.0x 12.0x 14.0x
CY 2013E Revenue Growth %
EV/CY2013E Revenue
SAAS
AMZN
EBAY
PCLN
EXPE
MELI
GRPN
VCLKVPRT
OWW
DRIV
NILEOSTK
0.0%
3.0%
6.0%
9.0%
12.0%
15.0%
18.0%
21.0%
24.0%
27.0%
0.0x 2.0x 4.0x 6.0x 8.0x 10.0x
CY 2013E Revenue Growth %
EV/CY2013E Revenue
E-Commerce
GOOG
FB
YHOO
AOL
YELP
-10.0%
0.0%
10.0%
20.0%
30.0%
40.0%
50.0%
60.0%
0.0x 1.0x 2.0x 3.0x 4.0x 5.0x 6.0x 7.0x 8.0x 9.0x 10.0x
CY 2013E Revenue Growth %
EV/CY2013E Revenue
Internet

19
Appendix

20
Appendix– Comparable Public Company Analysis
Application– Valuation Metrics
Application– Operating Metrics
Source: CapitalIQ. Estimates Based on Consensus of Equity Research Analyst Estimates.
Note: Market Data as of Q2 2013 Quarter End.
Note: Multiples Excludes Outlier for EV/CY Rev. > 15x, EV/CY EBITDA > 35x, P/E > 50x, and PEG > 3x.
Note: LTM = Last Twelve Months, CY = Calendar Year, PE = Price/Earnings Ratio, PEG = Price-to-Earnings Growth Ratio.
Note: EV = Enterprise Value (Equity Value + Debt + Minority Interest – Cash and Cash Equivalents).
($Millions, except per share values) Valuation Metrics Operating Metrics
2013E 2014E 2013E 2014E 2013E 2014E 2013E 2014E
Application
Microsoft $34.55 97% 1.32x $288,489.0 ($59,023.0) $229,466.0 2.7x 2.6x 6.7x 6.0x 11.7x 10.8x 1.28x 1.19x
Oracle $30.71 84% 1.07x $142,212.1 ($13,722.0) $128,987.1 3.4x 3.2x 6.8x 6.4x 11.0x 10.1x 1.06x 0.98x
SAP AG $73.04 87% 1.26x $87,098.9 $558.7 $87,677.4 3.8x 3.5x 11.0x 9.7x 16.3x 14.4x 1.26x 1.11x
Intuit $61.04 89% 1.10x $18,124.3 ($1,496.0) $16,628.3 3.5x 3.3x 9.2x 8.6x 17.5x 16.6x 1.36x 1.28x
Autodesk $33.94 82% 1.23x $7,629.7 ($1,342.1) $6,287.6 2.6x 2.5x 9.5x 8.3x 17.3x 15.0x 1.56x 1.34x
Ansys $73.10 90% 1.32x $6,813.4 ($624.9) $6,188.5 7.2x 6.5x 14.3x 12.9x 24.4x 22.1x 1.64x 1.48x
NetSuite $91.74 96% 1.95x $6,768.8 ($176.7) $6,592.1 NM 12.7x NM NM NM NM NM NM
Splunk $46.36 97% 1.79x $4,812.7 ($331.3) $4,481.5 NM 12.3x NM NM NM NM NM NM
OpenText $68.47 93% 1.53x $4,012.8 $126.6 $4,139.4 2.9x 2.8x 9.7x 9.0x 12.2x 11.3x 0.71x 0.65x
PTC $24.53 94% 1.39x $2,930.9 $67.3 $2,998.2 2.3x 2.2x 9.6x 8.3x 13.7x 11.8x 0.77x 0.66x
Aspen Technology $28.79 87% 1.31x $2,697.9 ($169.6) $2,528.3 7.8x 6.3x NM 21.3x NM 37.4x NM 2.88x
Manhattan Associates $77.16 96% 1.88x $1,501.7 ($108.5) $1,393.1 3.4x 3.1x 13.2x 11.5x 23.7x 21.3x NM NM
Dealertrack Technologies $35.43 98% 1.52x $1,540.8 ($6.6) $1,534.2 3.3x 3.0x 13.4x 11.4x 28.4x 24.4x 1.85x 1.60x
MicroStrategy $86.96 63% 1.05x $982.7 ($330.2) $652.5 1.1x 1.0x 13.1x 9.2x NM 28.5x NM 1.21x
Actuate $6.64 92% 1.34x $314.2 ($67.3) $246.9 1.7x 1.6x 8.5x 7.3x 17.0x 14.6x 1.14x 0.97x
QAD $11.48 79% 1.03x $176.5 ($57.4) $119.2 0.5x 0.4x 8.8x 5.3x 26.7x 16.5x 1.78x 1.10x
Average 3.3x 4.2x 10.3x 9.7x 18.3x 18.2x 1.31x 1.27x
Median 3.1x 3.0x 9.6x 8.8x 17.2x 15.7x 1.28x 1.19x
Stock Price% of 52-
Week High
Current
Stock Price
as a Multiple
of 52-Wk low
Equity Value Net Debt Ent. Value
EV/CY Revenue EV/CY EBITDA P/E PEG Ratio
($Millions, except per share values) Operating Metrics
5-Yr NI
2013E 2014E 2013E 2014E Growth % LTM LTM LTM LTM
Application
Microsoft $34.55 97% 1.32x $288,489.0 ($59,023.0) $229,466.0 14.7% 4.4% 41.1% 44.1% 9.1% 75.3% 19.5% 13.4% 5.8%
Oracle $30.71 84% 1.07x $142,212.1 ($13,722.0) $128,987.1 2.7% 4.5% 49.4% 50.2% 10.4% 80.9% 19.7% 13.0% 2.9%
SAP AG $73.04 87% 1.26x $87,098.9 $558.7 $87,677.4 7.8% 9.3% 34.5% 35.7% 13.0% 71.6% 24.0% 13.9% 5.5%
Intuit $61.04 89% 1.10x $18,124.3 ($1,496.0) $16,628.3 12.0% 8.4% 38.6% 38.1% 12.9% 83.2% 28.1% 16.0% 9.3%
Autodesk $33.94 82% 1.23x $7,629.7 ($1,342.1) $6,287.6 2.7% 7.5% 27.9% 29.6% 11.1% 89.2% 37.5% 26.1% 10.9%
Ansys $73.10 90% 1.32x $6,813.4 ($624.9) $6,188.5 8.4% 9.5% 50.1% 50.5% 14.9% 87.6% NM 16.9% NM
NetSuite $91.74 96% 1.95x $6,768.8 ($176.7) $6,592.1 32.0% 27.5% NA NA 28.1% 68.5% 50.0% 17.6% 12.1%
Splunk $46.36 97% 1.79x $4,812.7 ($331.3) $4,481.5 37.3% 33.4% NA NA NM 89.1% 65.0% 22.0% 16.5%
OpenText $68.47 93% 1.53x $4,012.8 $126.6 $4,139.4 11.0% 5.3% 30.0% 30.9% 17.3% 71.4% 21.3% 12.3% 8.3%
PTC $24.53 94% 1.39x $2,930.9 $67.3 $2,998.2 5.4% 5.2% 23.5% 26.0% 17.9% 70.8% 29.2% 17.2% 9.4%
Aspen Technology $28.79 87% 1.31x $2,697.9 ($169.6) $2,528.3 18.7% 23.4% NA 29.6% 13.0% 82.7% 32.2% 21.2% 16.8%
Manhattan Associates $77.16 96% 1.88x $1,501.7 ($108.5) $1,393.1 9.7% 9.7% 25.6% 26.6% NM 56.3% 11.7% 11.7% 9.9%
Dealertrack Technologies $35.43 98% 1.52x $1,540.8 ($6.6) $1,534.2 17.8% 13.3% 25.1% 25.9% 15.3% 43.2% 0.1% 3.0% NM
MicroStrategy $86.96 63% 1.05x $982.7 ($330.2) $652.5 (2.3%) 9.1% 8.6% 11.1% 23.5% 73.9% 36.7% 16.7% 17.1%
Actuate $6.64 92% 1.34x $314.2 ($67.3) $246.9 2.9% 7.5% 20.3% 22.1% 15.0% 84.1% 37.9% 17.8% 15.7%
QAD $11.48 79% 1.03x $176.5 ($57.4) $119.2 3.0% 7.7% 5.2% 8.0% 15.0% 84.0% 25.1% 15.8% 12.7%
Average 11.5% 11.6% 29.2% 30.6% 15.5% 75.7% 29.2% 15.9% 10.9%
Median 9.1% 8.7% 27.9% 29.6% 14.9% 78.1% 28.1% 16.4% 10.4%
GM S&M Mgn.R&D Mgn.G&A Mgn.CY EBITDA Margin
Stock Price% of 52-
Week High
Current
Stock Price
as a Multiple
of 52-Wk low
Equity Value Net Debt Ent. Value
CY Rev. Growth

21
Appendix– Comparable Public Company Analysis (Cont.)
Diversified– Valuation Metrics
Diversified– Operating Metrics
Source: CapitalIQ. Estimates Based on Consensus of Equity Research Analyst Estimates.
Note: Market Data as of Q2 2013 Quarter End.
Note: Multiples Excludes Outlier for EV/CY Rev. > 15x, EV/CY EBITDA > 35x, P/E > 50x, and PEG > 3x.
Note: LTM = Last Twelve Months, CY = Calendar Year, PE = Price/Earnings Ratio, PEG = Price-to-Earnings Growth Ratio.
Note: EV = Enterprise Value (Equity Value + Debt + Minority Interest – Cash and Cash Equivalents).
($Millions, except per share values) Valuation Metrics Operating Metrics
2013E 2014E 2013E 2014E 2013E 2014E 2013E 2014E
Diversified
Microsoft $34.55 97% 1.32x $288,489.0 ($59,023.0) $229,466.0 2.7x 2.6x 6.7x 6.0x 11.7x 10.8x 1.28x 1.19x
Oracle $30.71 84% 1.07x $142,212.1 ($13,722.0) $128,987.1 3.4x 3.2x 6.8x 6.4x 11.0x 10.1x 1.06x 0.98x
SAP AG $73.04 87% 1.26x $87,098.9 $558.7 $87,677.4 3.8x 3.5x 11.0x 9.7x 16.3x 14.4x 1.26x 1.11x
Adobe Systems $45.56 97% 1.54x $22,883.0 ($2,340.1) $20,542.9 5.0x 4.6x 17.5x 14.1x 31.4x 27.0x 2.50x 2.14x
Symantec $22.48 89% 1.72x $15,660.4 ($1,656.0) $14,004.4 2.0x 2.0x 6.4x 5.5x 13.0x 10.8x 1.50x 1.24x
Average 3.4x 3.2x 9.7x 8.3x 16.7x 14.6x 1.52x 1.33x
Median 3.4x 3.2x 6.8x 6.4x 13.0x 10.8x 1.28x 1.19x
Stock Price% of 52-
Week High
Current
Stock Price
as a Multiple
of 52-Wk low
Equity Value Net Debt Ent. Value
EV/CY Revenue EV/CY EBITDA P/E PEG Ratio
($Millions, except per share values) Operating Metrics
5-Yr NI
2013E 2014E 2013E 2014E Growth % LTM LTM LTM LTM
Diversified
Microsoft $34.55 97% 1.32x $288,489.0 ($59,023.0) $229,466.0 14.7% 4.4% 41.1% 44.1% 9.1% 75.3% 19.5% 13.4% 5.8%
Oracle $30.71 84% 1.07x $142,212.1 ($13,722.0) $128,987.1 2.7% 4.5% 49.4% 50.2% 10.4% 80.9% 19.7% 13.0% 2.9%
SAP AG $73.04 87% 1.26x $87,098.9 $558.7 $87,677.4 7.8% 9.3% 34.5% 35.7% 13.0% 71.6% 24.0% 13.9% 5.5%
Adobe Systems $45.56 97% 1.54x $22,883.0 ($2,340.1) $20,542.9 (6.9%) 8.5% 28.6% 32.7% 12.6% 87.4% 36.9% 18.7% 11.2%
Symantec $22.48 89% 1.72x $15,660.4 ($1,656.0) $14,004.4 0.7% 3.8% 31.9% 35.6% 8.7% 84.0% 39.6% 14.7% 6.5%
Average 3.8% 6.1% 37.1% 39.7% 10.7% 79.8% 28.0% 14.8% 6.4%
Median 2.7% 4.5% 34.5% 35.7% 10.4% 80.9% 24.0% 13.9% 5.8%
GM S&M Mgn.R&D Mgn.G&A Mgn.CY EBITDA Margin
Stock Price% of 52-
Week High
Current
Stock Price
as a Multiple
of 52-Wk low
Equity Value Net Debt Ent. Value
CY Rev. Growth

22
Appendix – Comparable Public Company Analysis (Cont.)
E-Commerce– Valuation Metrics
E-Commerce–Operating Metrics
Source: CapitalIQ. Estimates Based on Consensus of Equity Research Analyst Estimates.
Note: Market Data as of Q2 2013 Quarter End.
Note: Multiples Excludes Outlier for EV/CY Rev. > 15x, EV/CY EBITDA > 35x, P/E > 50x, and PEG > 3x.
Note: LTM = Last Twelve Months, CY = Calendar Year, PE = Price/Earnings Ratio, PEG = Price-to-Earnings Growth Ratio.
Note: EV = Enterprise Value (Equity Value + Debt + Minority Interest – Cash and Cash Equivalents).
($Millions, except per share values) Valuation Metrics Operating Metrics
2013E 2014E 2013E 2014E 2013E 2014E 2013E 2014E
E-Commerce
Amazon.com $277.69 98% 1.31x $126,416.4 ($4,855.0) $121,561.4 1.6x 1.3x 24.1x 19.3x NM NM NM NM
eBay $51.72 89% 1.36x $67,121.7 ($4,886.0) $62,235.7 3.8x 3.3x 11.5x 9.8x 18.8x 15.9x 1.16x 0.99x
priceline.com $826.67 98% 1.49x $42,639.6 ($3,719.4) $39,111.1 5.9x 5.0x 15.7x 12.9x 21.1x 17.6x 1.02x 0.86x
Expedia $60.15 88% 1.38x $8,128.8 ($839.8) $7,755.2 1.6x 1.4x 8.7x 7.5x 18.0x 15.1x 1.45x 1.22x
Mercadolibre $107.76 84% 1.68x $4,757.9 ($197.6) $4,564.4 9.8x 7.8x 27.1x 21.3x 40.2x 30.6x 1.47x 1.12x
Groupon $8.55 80% 3.29x $5,656.3 ($1,165.7) $4,488.3 1.8x 1.6x 15.1x 12.8x 47.5x 29.5x 1.74x 1.08x
ValueClick, $24.71 77% 1.64x $1,883.2 ($49.1) $1,834.1 2.5x 2.2x 7.3x 6.4x 13.4x 11.9x 0.84x 0.75x
Vistaprint N.V. $49.37 99% 1.75x $1,611.6 $187.2 $1,798.8 1.5x 1.3x 11.6x 9.9x 23.2x 16.9x 1.08x 0.79x
Orbitz Worldwide $8.03 92% 3.88x $846.8 $230.2 $1,077.0 1.3x 1.3x 7.7x 7.2x 20.1x 19.1x 0.73x 0.70x
Digital River $18.77 99% 1.47x $662.0 ($336.8) $325.2 0.8x 0.8x 8.1x 5.4x 31.3x 30.0x NM NM
Blue Nile $37.78 87% 1.65x $468.2 ($39.8) $428.4 0.9x 0.8x 17.8x 14.5x 46.6x 36.3x 2.30x 1.79x
Overstock.com $28.20 99% 4.61x $666.9 ($81.9) $585.0 0.5x 0.4x 14.0x 12.1x 26.7x 21.4x 1.02x 0.82x
Average 2.7x 2.3x 14.1x 11.6x 27.9x 22.2x 1.28x 1.01x
Median 1.6x 1.4x 12.8x 11.0x 23.2x 19.1x 1.12x 0.92x
Stock Price% of 52-
Week High
Current
Stock Price
as a Multiple
of 52-Wk low
Equity Value Net Debt Ent. Value
EV/CY Revenue EV/CY EBITDA P/E PEG Ratio
($Millions, except per share values) Operating Metrics
5-Yr NI
2013E 2014E 2013E 2014E Growth % LTM LTM LTM LTM
E-Commerce
Amazon.com $277.69 98% 1.31x $126,416.4 ($4,855.0) $121,561.4 22.1% 22.5% 6.8% 6.9% 45.4% 25.4% 4.0% 7.8% 0.6%
eBay $51.72 89% 1.36x $67,121.7 ($4,886.0) $62,235.7 15.9% 16.9% 33.3% 33.2% 16.1% 69.8% 20.2% 11.2% 10.8%
priceline.com $826.67 98% 1.49x $42,639.6 ($3,719.4) $39,111.1 25.2% 19.6% 37.8% 38.4% 20.6% 78.7% 29.9% NM 4.1%
Expedia $60.15 88% 1.38x $8,128.8 ($839.8) $7,755.2 20.1% 13.4% 18.5% 18.9% 12.4% 77.5% 43.5% 12.2% 8.5%
Mercadolibre $107.76 84% 1.68x $4,757.9 ($197.6) $4,564.4 25.1% 24.8% 36.0% 36.7% 27.4% 78.8% 19.6% 7.7% 11.2%
Groupon $8.55 80% 3.29x $5,656.3 ($1,165.7) $4,488.3 9.6% 10.2% 11.6% 12.5% 27.3% 65.4% 11.4% NM NM
ValueClick, $24.71 77% 1.64x $1,883.2 ($49.1) $1,834.1 12.0% 12.2% 34.0% 34.4% 15.9% 62.2% 12.8% 9.8% 10.6%
Vistaprint N.V. $49.37 99% 1.75x $1,611.6 $187.2 $1,798.8 10.8% 9.0% 12.6% 13.6% 21.4% 65.7% 38.3% 13.9% 9.1%
Orbitz Worldwide $8.03 92% 3.88x $846.8 $230.2 $1,077.0 6.4% 3.9% 16.8% 17.4% 27.4% 80.7% 33.1% NM NM
Digital River $18.77 99% 1.47x $662.0 ($336.8) $325.2 3.6% 1.7% 10.0% 14.8% 10.0% 81.6% 41.3% 16.4% 14.8%
Blue Nile $37.78 87% 1.65x $468.2 ($39.8) $428.4 13.5% 13.2% 5.3% 5.8% 20.3% 18.7% 5.1% NM NM
Overstock.com $28.20 99% 4.61x $666.9 ($81.9) $585.0 12.9% 7.3% 3.4% 3.6% 26.1% 18.3% 5.9% NM 10.9%
Average 14.8% 12.9% 18.8% 19.7% 22.5% 60.2% 22.1% 11.3% 9.0%
Median 13.2% 12.7% 14.7% 16.1% 21.0% 67.8% 19.9% 11.2% 10.6%
GM S&M Mgn.R&D Mgn.G&A Mgn.CY EBITDA Margin
Stock Price% of 52-
Week High
Current
Stock Price
as a Multiple
of 52-Wk low
Equity Value Net Debt Ent. Value
CY Rev. Growth

23
Appendix– Comparable Public Company Analysis (Cont.)
Internet– Valuation Metrics
Internet– Operating Metrics
Source: CapitalIQ. Estimates Based on Consensus of Equity Research Analyst Estimates.
Note: Market Data as of Q2 2013 Quarter End.
Note: Multiples Excludes Outlier for EV/CY Rev. > 15x, EV/CY EBITDA > 35x, P/E > 50x, and PEG > 3x.
Note: LTM = Last Twelve Months, CY = Calendar Year, PE = Price/Earnings Ratio, PEG = Price-to-Earnings Growth Ratio.
Note: EV = Enterprise Value (Equity Value + Debt + Minority Interest – Cash and Cash Equivalents).
($Millions, except per share values) Valuation Metrics Operating Metrics
2013E 2014E 2013E 2014E 2013E 2014E 2013E 2014E
Internet
Google $880.37 96% 1.57x $292,076.9 ($42,722.0) $249,354.9 4.1x 3.5x 11.4x 9.6x 19.0x 16.4x 1.16x 1.00x
Facebook $24.88 55% 1.42x $60,157.5 ($7,211.0) $52,946.5 7.8x 6.2x 14.8x 11.6x 43.3x 31.9x 1.57x 1.16x
Yahoo $25.13 91% 1.72x $27,206.6 ($2,977.2) $24,275.5 5.4x 5.2x 14.7x 14.2x 18.5x 17.0x 1.59x 1.46x
AOL $36.48 83% 1.34x $2,825.4 ($363.6) $2,473.0 1.1x 1.1x 5.7x 5.4x 19.9x 16.5x 0.99x 0.83x
Yelp $34.77 96% 2.13x $2,240.6 ($94.5) $2,146.1 9.8x 6.9x NM NM NM NM NM NM
Average 5.7x 4.6x 11.6x 10.2x 25.2x 20.4x 1.33x 1.11x
Median 5.4x 5.2x 13.0x 10.6x 19.5x 16.8x 1.37x 1.08x
Stock Price% of 52-
Week High
Current
Stock Price
as a Multiple
of 52-Wk low
Equity Value Net Debt Ent. Value
EV/CY Revenue EV/CY EBITDA P/E PEG Ratio
($Millions, except per share values) Operating Metrics
5-Yr NI
2013E 2014E 2013E 2014E Growth % LTM LTM LTM LTM
Internet
Google $880.37 96% 1.57x $292,076.9 ($42,722.0) $249,354.9 20.2% 16.7% 36.2% 36.8% 16.4% 57.7% 11.8% 13.0% 7.5%
Facebook $24.88 55% 1.42x $60,157.5 ($7,211.0) $52,946.5 32.6% 25.9% 53.0% 53.6% 27.5% 72.7% 17.4% 28.0% 17.6%
Yahoo $25.13 91% 1.72x $27,206.6 ($2,977.2) $24,275.5 (9.1%) 3.1% 36.5% 36.5% 11.7% 68.1% 21.9% 17.9% 11.2%
AOL $36.48 83% 1.34x $2,825.4 ($363.6) $2,473.0 2.1% 3.1% 19.5% 19.9% 20.0% 30.8% NM NM 17.0%
Yelp $34.77 96% 2.13x $2,240.6 ($94.5) $2,146.1 58.6% 43.5% NA NA 15.0% 92.9% 61.0% 15.1% 18.3%
Average 20.9% 18.5% 36.3% 36.7% 18.1% 64.4% 28.0% 18.5% 14.3%
Median 20.2% 16.7% 36.4% 36.6% 16.4% 68.1% 19.6% 16.5% 17.0%
GM S&M Mgn.R&D Mgn.G&A Mgn.CY EBITDA Margin
Stock Price% of 52-
Week High
Current
Stock Price
as a Multiple
of 52-Wk low
Equity Value Net Debt Ent. Value
CY Rev. Growth

24
Appendix– Comparable Public Company Analysis (Cont.)
SaaS– Valuation Metrics
SaaS– Operating Metrics
Source: CapitalIQ. Estimates Based on Consensus of Equity Research Analyst Estimates.
Note: Market Data as of Q2 2013 Quarter End.
Note: Multiples Excludes Outlier for EV/CY Rev. > 15x, EV/CY EBITDA > 35x, P/E > 50x, and PEG > 3x.
Note: LTM = Last Twelve Months, CY = Calendar Year, PE = Price/Earnings Ratio, PEG = Price-to-Earnings Growth Ratio. Note: EV = Enterprise Value (Equity Value + Debt + Minority Interest – Cash and Cash Equivalents).
($Millions, except per share values) Valuation Metrics Operating Metrics
2013E 2014E 2013E 2014E 2013E 2014E 2013E 2014E
SAAS
salesforce.com $38.18 80% 1.27x $22,523.7 ($405.5) $22,118.3 5.6x 4.5x NM 26.1x NM NM NM NM
Intuit $61.04 89% 1.10x $18,124.3 ($1,496.0) $16,628.3 3.5x 3.3x 9.2x 8.6x 17.5x 16.6x 1.36x 1.28x
Workday $64.09 92% 1.42x $11,087.6 ($784.4) $10,303.1 NM NM NM NM NM NM NM NM
NetSuite $91.74 96% 1.95x $6,768.8 ($176.7) $6,592.1 NM 12.7x NM NM NM NM NM NM
ServiceNow $40.39 92% 1.79x $5,424.4 ($338.9) $5,085.5 12.8x 8.8x NM NM NM NM NM NM
Concur Technologies $81.38 96% 1.41x $4,543.5 ($208.3) $4,335.3 7.6x 6.1x 34.8x 27.9x NM NM NM NM
The Ultimate Software Group $117.29 99% 1.38x $3,242.6 ($68.5) $3,174.2 7.8x 6.3x NM 28.2x NM NM NM NM
Qlik Technologies $28.27 90% 1.69x $2,460.1 ($214.7) $2,245.4 4.7x 3.9x NM 26.5x NM 46.7x NM 1.23x
Guidewire Software $42.05 96% 1.79x $2,413.9 ($154.1) $2,259.8 7.4x 5.9x NM NM NM NM NM NM
Cornerstone OnDemand $43.30 94% 1.99x $2,209.7 ($69.3) $2,140.5 11.8x 8.3x NM NM NM NM NM NM
ExactTarget $33.72 100% 1.95x $2,348.5 ($101.0) $2,247.5 5.9x 4.9x NM NM NM NM NM NM
RealPage $18.34 68% 1.09x $1,404.8 ($22.8) $1,382.0 3.6x 3.0x 15.1x 12.2x 31.1x 25.1x 1.24x 1.00x
Synchronoss Technologies $30.87 94% 1.81x $1,184.7 ($57.2) $1,127.4 3.3x 2.7x 10.7x 8.2x 23.2x 18.7x 0.93x 0.75x
Jive Software $18.17 83% 1.71x $1,210.8 ($133.6) $1,077.2 7.2x 5.5x NM NM NM NM NM NM
LifeLock $11.71 94% 1.72x $1,018.0 ($145.3) $872.7 2.5x 2.1x 21.3x 15.4x 34.3x 24.5x NM NM
Demandware $42.41 100% 1.99x $1,279.2 ($102.1) $1,177.1 11.9x 8.8x NM NM NM NM NM NM
LivePerson $8.96 46% 1.12x $493.2 ($94.8) $398.4 2.3x 2.0x 19.1x 13.8x 44.8x 33.2x 1.95x 1.45x
SPS Commerce $55.00 96% 1.94x $825.8 ($72.6) $753.2 7.5x 6.3x NM NM NM NM NM NM
SciQuest $25.05 96% 1.91x $569.0 ($46.1) $522.9 5.7x 4.7x 29.2x 21.4x NM 49.1x NM 1.96x
ServiceSource International $9.32 67% 2.32x $716.0 ($116.8) $599.2 2.2x 1.9x 27.9x 19.6x NM NM NM NM
Bazaarvoice $9.43 50% 1.48x $686.2 ($95.3) $590.9 3.3x 2.8x NM NM NM NM NM NM
LogMeIn $24.46 71% 1.52x $594.7 ($205.2) $389.5 2.4x 2.1x 13.1x 10.9x 49.9x 31.6x 2.39x 1.51x
Tangoe $15.43 68% 1.34x $575.7 ($30.4) $545.3 2.9x 2.5x 17.3x 13.6x 22.4x 18.4x NM NM
Responsys $14.31 95% 2.62x $706.4 ($105.4) $601.1 3.1x 2.7x 21.8x 17.9x NM NM NM NM
Constant Contact $16.07 76% 1.40x $493.5 ($97.3) $396.2 1.4x 1.2x 8.8x 7.3x 24.0x 19.4x 0.83x 0.67x
IntraLinks Holdings $7.26 99% 1.84x $399.1 $1.2 $400.4 1.8x 1.7x 11.4x 10.0x NM 42.7x NM 2.85x
Vocus $10.52 51% 1.31x $221.9 ($40.1) $259.3 1.4x 1.2x 15.4x 9.7x NM 31.9x NM 1.59x
Carbonite $12.39 92% 2.15x $321.8 ($56.5) $265.3 2.5x 2.0x NM NM NM NM NM NM
Callidus Software $6.59 99% 1.83x $247.5 $39.6 $287.1 2.7x 2.4x NM 21.1x NM 38.8x NM 1.94x
Average 5.0x 4.3x 18.2x 16.6x 30.9x 30.5x 1.45x 1.48x
Median 3.5x 3.1x 16.4x 14.6x 27.5x 31.6x 1.30x 1.45x
Stock Price% of 52-
Week High
Current
Stock Price
as a Multiple
of 52-Wk low
Equity Value Net Debt Ent. Value
EV/CY Revenue EV/CY EBITDA P/E PEG Ratio
($Millions, except per share values) Operating Metrics
5-Yr NI
2013E 2014E 2013E 2014E Growth % LTM LTM LTM LTM
SAAS
salesforce.com $38.18 80% 1.27x $22,523.7 ($405.5) $22,118.3 29.6% 25.2% NA 17.1% 27.3% 77.2% 52.7% 14.4% 14.2%
Intuit $61.04 89% 1.10x $18,124.3 ($1,496.0) $16,628.3 12.0% 8.4% 38.6% 38.1% 12.9% 83.2% 28.1% 16.0% 9.3%
Workday $64.09 92% 1.42x $11,087.6 ($784.4) $10,303.1 60.4% 50.7% NA NA 44.0% 58.5% 44.4% 38.3% 14.4%
NetSuite $91.74 96% 1.95x $6,768.8 ($176.7) $6,592.1 32.0% 27.5% NA NA 28.1% 68.5% 50.0% 17.6% 12.1%
ServiceNow $40.39 92% 1.79x $5,424.4 ($338.9) $5,085.5 63.1% 45.9% NA NA 40.7% 59.8% 43.5% 17.5% 13.3%
Concur Technologies $81.38 96% 1.41x $4,543.5 ($208.3) $4,335.3 24.2% 23.3% 21.7% 21.9% 24.5% 71.7% 42.5% 10.8% 16.1%
The Ultimate Software Group $117.29 99% 1.38x $3,242.6 ($68.5) $3,174.2 23.0% 22.8% NA 22.4% 27.2% 57.3% 21.8% 17.4% 8.0%
Qlik Technologies $28.27 90% 1.69x $2,460.1 ($214.7) $2,245.4 22.9% 19.9% NA 14.8% 38.0% 88.1% 54.7% 11.7% 20.2%
Guidewire Software $42.05 96% 1.79x $2,413.9 ($154.1) $2,259.8 17.3% 24.8% NA NA NM 55.0% 18.8% 22.8% 11.6%
Cornerstone OnDemand $43.30 94% 1.99x $2,209.7 ($69.3) $2,140.5 54.4% 41.7% NA NA 40.2% 70.4% 61.1% 12.3% 21.1%
ExactTarget $33.72 100% 1.95x $2,348.5 ($101.0) $2,247.5 29.3% 21.5% NA NA 30.0% 64.7% 40.5% 19.2% 13.4%
RealPage $18.34 68% 1.09x $1,404.8 ($22.8) $1,382.0 19.8% 18.1% 23.7% 24.8% 25.0% 60.4% 24.7% 14.5% 12.0%
Synchronoss Technologies $30.87 94% 1.81x $1,184.7 ($57.2) $1,127.4 25.5% 20.8% 30.8% 33.3% 25.0% 58.5% NM 19.5% NM
Jive Software $18.17 83% 1.71x $1,210.8 ($133.6) $1,077.2 32.1% 29.3% NA NA 30.0% 61.4% 55.4% 35.6% 14.8%
LifeLock $11.71 94% 1.72x $1,018.0 ($145.3) $872.7 27.4% 19.2% 11.6% 13.5% NM 71.8% 44.7% 11.0% 10.4%
Demandware $42.41 100% 1.99x $1,279.2 ($102.1) $1,177.1 24.8% 34.3% NA NA 15.0% 69.7% 45.9% 19.5% 19.4%
LivePerson $8.96 46% 1.12x $493.2 ($94.8) $398.4 12.3% 14.2% 11.8% 14.3% 22.9% 76.8% 32.5% 19.3% 21.4%
SPS Commerce $55.00 96% 1.94x $825.8 ($72.6) $753.2 30.0% 19.2% NA NA 24.0% 70.8% 38.9% 10.6% 16.8%
SciQuest $25.05 96% 1.91x $569.0 ($46.1) $522.9 36.9% 22.6% 19.7% 21.9% 25.0% 68.8% 26.5% 28.5% 13.4%
ServiceSource International $9.32 67% 2.32x $716.0 ($116.8) $599.2 10.2% 14.4% 8.0% 10.0% 25.0% 42.5% 23.6% 8.5% 17.1%
Bazaarvoice $9.43 50% 1.48x $686.2 ($95.3) $590.9 21.3% 17.4% NA NA NM 65.6% 47.8% 20.6% 26.0%
LogMeIn $24.46 71% 1.52x $594.7 ($205.2) $389.5 14.7% 14.0% 18.7% 19.8% 20.9% 89.2% 51.4% 18.1% 19.5%
Tangoe $15.43 68% 1.34x $575.7 ($30.4) $545.3 23.5% 16.5% 16.5% 18.0% NM 54.2% 16.2% 10.9% 15.4%
Responsys $14.31 95% 2.62x $706.4 ($105.4) $601.1 17.9% 16.5% 14.3% 15.0% 16.3% 54.1% 29.0% 9.0% 11.1%
Constant Contact $16.07 76% 1.40x $493.5 ($97.3) $396.2 13.4% 11.5% 15.7% 17.0% 28.9% 70.9% 42.1% 15.2% 12.6%
IntraLinks Holdings $7.26 99% 1.84x $399.1 $1.2 $400.4 2.3% 4.8% 15.8% 17.3% 15.0% 71.7% 43.8% 9.7% 23.8%
Vocus $10.52 51% 1.31x $221.9 ($40.1) $259.3 10.3% 10.5% 8.9% 12.8% 20.0% 80.2% 57.0% 6.9% 17.0%
Carbonite $12.39 92% 2.15x $321.8 ($56.5) $265.3 25.2% 23.5% NA NA 27.5% 65.4% 47.5% 22.8% 13.9%
Callidus Software $6.59 99% 1.83x $247.5 $39.6 $287.1 12.0% 13.4% NA 11.3% 20.0% 48.1% 33.7% 17.3% 20.2%
Average 25.1% 21.8% 18.3% 19.1% 26.1% 66.7% 40.0% 17.1% 15.7%
Median 23.5% 19.9% 16.2% 17.2% 25.0% 68.5% 43.0% 17.3% 14.6%
GM S&M Mgn.R&D Mgn.G&A Mgn.CY EBITDA Margin
Stock Price% of 52-
Week High
Current
Stock Price
as a Multiple
of 52-Wk low
Equity Value Net Debt Ent. Value
CY Rev. Growth
25
Appendix– Comparable Public Company Analysis (Cont.)
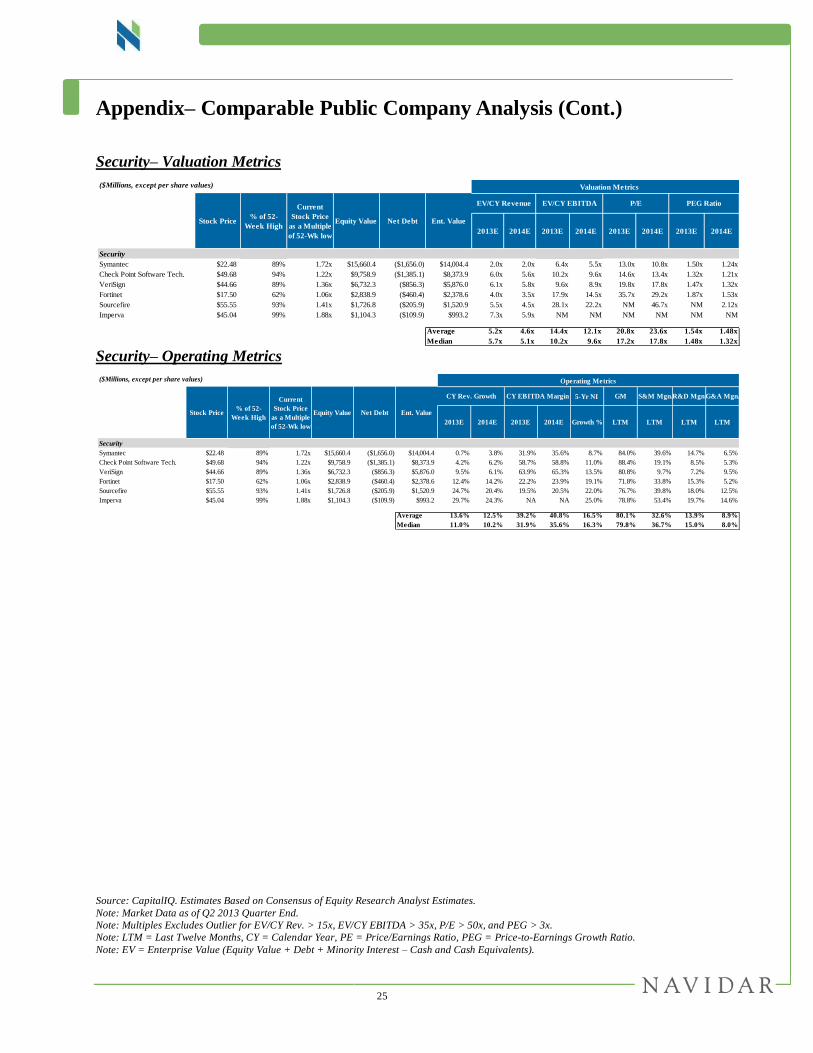
Security– Valuation Metrics
Security– Operating Metrics
Source: CapitalIQ. Estimates Based on Consensus of Equity Research Analyst Estimates.
Note: Market Data as of Q2 2013 Quarter End.
Note: Multiples Excludes Outlier for EV/CY Rev. > 15x, EV/CY EBITDA > 35x, P/E > 50x, and PEG > 3x.
Note: LTM = Last Twelve Months, CY = Calendar Year, PE = Price/Earnings Ratio, PEG = Price-to-Earnings Growth Ratio.
Note: EV = Enterprise Value (Equity Value + Debt + Minority Interest – Cash and Cash Equivalents).
($Millions, except per share values) Valuation Metrics Operating Metrics
2013E 2014E 2013E 2014E 2013E 2014E 2013E 2014E
Security
Symantec $22.48 89% 1.72x $15,660.4 ($1,656.0) $14,004.4 2.0x 2.0x 6.4x 5.5x 13.0x 10.8x 1.50x 1.24x
Check Point Software Tech. $49.68 94% 1.22x $9,758.9 ($1,385.1) $8,373.9 6.0x 5.6x 10.2x 9.6x 14.6x 13.4x 1.32x 1.21x
VeriSign $44.66 89% 1.36x $6,732.3 ($856.3) $5,876.0 6.1x 5.8x 9.6x 8.9x 19.8x 17.8x 1.47x 1.32x
Fortinet $17.50 62% 1.06x $2,838.9 ($460.4) $2,378.6 4.0x 3.5x 17.9x 14.5x 35.7x 29.2x 1.87x 1.53x
Sourcefire $55.55 93% 1.41x $1,726.8 ($205.9) $1,520.9 5.5x 4.5x 28.1x 22.2x NM 46.7x NM 2.12x
Imperva $45.04 99% 1.88x $1,104.3 ($109.9) $993.2 7.3x 5.9x NM NM NM NM NM NM
Average 5.2x 4.6x 14.4x 12.1x 20.8x 23.6x 1.54x 1.48x
Median 5.7x 5.1x 10.2x 9.6x 17.2x 17.8x 1.48x 1.32x
Stock Price% of 52-
Week High
Current
Stock Price
as a Multiple
of 52-Wk low
Equity Value Net Debt Ent. Value
EV/CY Revenue EV/CY EBITDA P/E PEG Ratio
($Millions, except per share values) Operating Metrics
5-Yr NI
2013E 2014E 2013E 2014E Growth % LTM LTM LTM LTM
Security
Symantec $22.48 89% 1.72x $15,660.4 ($1,656.0) $14,004.4 0.7% 3.8% 31.9% 35.6% 8.7% 84.0% 39.6% 14.7% 6.5%
Check Point Software Tech. $49.68 94% 1.22x $9,758.9 ($1,385.1) $8,373.9 4.2% 6.2% 58.7% 58.8% 11.0% 88.4% 19.1% 8.5% 5.3%
VeriSign $44.66 89% 1.36x $6,732.3 ($856.3) $5,876.0 9.5% 6.1% 63.9% 65.3% 13.5% 80.8% 9.7% 7.2% 9.5%
Fortinet $17.50 62% 1.06x $2,838.9 ($460.4) $2,378.6 12.4% 14.2% 22.2% 23.9% 19.1% 71.8% 33.8% 15.3% 5.2%
Sourcefire $55.55 93% 1.41x $1,726.8 ($205.9) $1,520.9 24.7% 20.4% 19.5% 20.5% 22.0% 76.7% 39.8% 18.0% 12.5%
Imperva $45.04 99% 1.88x $1,104.3 ($109.9) $993.2 29.7% 24.3% NA NA 25.0% 78.8% 53.4% 19.7% 14.6%
Average 13.6% 12.5% 39.2% 40.8% 16.5% 80.1% 32.6% 13.9% 8.9%
Median 11.0% 10.2% 31.9% 35.6% 16.3% 79.8% 36.7% 15.0% 8.0%
GM S&M Mgn.R&D Mgn.G&A Mgn.CY EBITDA Margin
Stock Price% of 52-
Week High
Current
Stock Price
as a Multiple
of 52-Wk low
Equity Value Net Debt Ent. Value
CY Rev. Growth

26
Appendix– Comparable Public Company Analysis (Cont.)
IT Infrastructure Management– Valuation Metrics
IT Infrastructure Management – Operating Metrics
Source: CapitalIQ. Estimates Based on Consensus of Equity Research Analyst Estimates.
Note: Market Data as of Q2 2013 Quarter End.
Note: Multiples Excludes Outlier for EV/CY Rev. > 15x, EV/CY EBITDA > 35x, P/E > 50x, and PEG > 3x.
Note: LTM = Last Twelve Months, CY = Calendar Year, PE = Price/Earnings Ratio, PEG = Price-to-Earnings Growth Ratio.
Note: EV = Enterprise Value (Equity Value + Debt + Minority Interest – Cash and Cash Equivalents).
Valuation Metrics
2013E 2014E 2013E 2014E 2013E 2014E 2013E 2014E
IT Infrastructure Management
Oracle $30.71 84% 1.07x $142,212.1 ($13,722.0) $128,987.1 3.36x 3.2x 6.8x 6.4x 11.0x 10.1x 1.05x 0.97x
Vmware $66.99 65% 1.03x $28,683.6 ($4,873.0) $24,196.9 4.67x 4.1x 11.6x 10.4x 20.4x 17.8x 1.04x 0.91x
Symantec $22.48 89% 1.72x $15,660.4 ($1,656.0) $14,004.4 2.03x 2.0x 6.4x 5.5x 12.2x 10.8x 1.41x 1.24x
Citrix Systems $60.36 70% 1.07x $11,294.8 ($657.9) $10,636.9 3.59x 3.2x 11.0x 9.8x 19.5x 17.2x 1.17x 1.03x
CA Technologies $28.62 96% 1.33x $12,962.7 ($1,361.0) $11,601.7 2.58x 2.6x 6.8x 6.8x 10.2x 10.8x 1.58x 1.67x
Red Hat $47.82 80% 1.06x $9,052.0 ($853.6) $8,198.4 5.56x 4.8x 19.8x 16.5x 37.4x 31.7x 1.61x 1.36x
F5 Networks $68.80 62% 1.02x $5,421.4 ($522.8) $4,898.5 3.31x 2.9x 8.7x 7.3x 15.2x 13.1x 1.07x 0.92x
BMC Software $45.13 94% 1.27x $6,383.8 ($169.4) $6,214.4 2.72x 2.7x 7.3x 7.2x 12.0x 11.5x 1.06x 1.02x
SolarWinds $38.81 63% 1.02x $2,918.4 ($265.8) $2,652.6 7.87x 6.3x 14.7x 12.2x 25.4x 20.9x 1.21x 1.00x
Splunk $46.36 97% 1.79x $4,812.7 ($331.3) $4,481.5 NM 12.3x NM NM NM NM NM NM
CommVault Systems $75.89 86% 1.97x $3,527.4 ($435.9) $3,091.5 5.59x 4.8x 24.5x 19.6x NM 41.9x NM 1.85x
TIBCO Software $21.41 65% 1.18x $3,512.4 ($194.4) $3,318.0 3.15x 2.9x 12.0x 10.2x 22.0x 17.8x 1.72x 1.40x
Riverbed Technology $15.56 64% 1.17x $2,542.9 $115.6 $2,658.4 2.47x 2.2x 8.5x 7.4x 15.7x 13.0x 0.94x 0.78x
Infoblox $29.26 97% 2.13x $1,465.2 ($191.7) $1,273.5 5.27x 4.3x NM 30.6x NM 49.2x NM 2.46x
PROS Holdings $29.95 94% 2.35x $836.1 ($82.5) $753.6 5.19x 4.3x 32.4x 27.0x NM NM NM NM
Falconstor Software $1.37 47% 1.12x $65.7 ($27.4) $38.3 NM NM NM NM NM NM NM NM
Average 4.1x 4.2x 13.1x 12.6x 18.3x 20.5x 1.26x 1.28x
Median 3.5x 3.2x 11.0x 10.0x 15.7x 17.2x 1.17x 1.03x
Stock Price% of 52-
Week High
Current
Stock Price
as a Multiple
of 52-Wk low
Equity Value Net Debt Ent. Value
EV/CY Revenue EV/CY EBITDA P/E PEG Ratio
Operating Metrics
5-Yr NI
2013E 2014E 2013E 2014E Growth % LTM LTM LTM LTM
IT Infrastructure Management
Oracle $30.71 84% 1.07x $142,212.1 ($13,722.0) $128,987.1 3.2% 3.9% 49.2% 50.3% 10.4% 80.9% 19.7% 13.0% 2.9%
Vmware $66.99 65% 1.03x $28,683.6 ($4,873.0) $24,196.9 12.4% 14.8% 40.4% 39.2% 19.5% 85.1% 36.0% 21.8% 7.9%
Symantec $22.48 89% 1.72x $15,660.4 ($1,656.0) $14,004.4 0.7% 3.8% 31.9% 35.6% 8.7% 84.0% 39.6% 14.7% 6.5%
Citrix Systems $60.36 70% 1.07x $11,294.8 ($657.9) $10,636.9 14.7% 13.0% 32.6% 32.5% 16.6% 87.1% 41.6% 17.9% 9.2%
CA Technologies $28.62 96% 1.33x $12,962.7 ($1,361.0) $11,601.7 (3.9%) 0.2% 37.7% 37.7% 6.5% 86.3% 27.5% 10.6% 8.8%
Red Hat $47.82 80% 1.06x $9,052.0 ($853.6) $8,198.4 15.3% 15.0% 28.2% 29.4% 23.2% 84.7% 38.9% 20.1% 10.3%
F5 Networks $68.80 62% 1.02x $5,421.4 ($522.8) $4,898.5 4.4% 14.0% 38.2% 39.8% 14.3% 82.9% 32.8% 13.7% 6.8%
BMC Software $45.13 94% 1.27x $6,383.8 ($169.4) $6,214.4 4.1% 1.5% 37.3% 37.0% 11.3% 73.1% 30.9% 7.2% 10.7%
SolarWinds $38.81 63% 1.02x $2,918.4 ($265.8) $2,652.6 25.4% 24.8% 53.7% 51.9% 21.0% 93.0% 27.2% 10.6% 12.8%
Splunk $46.36 97% 1.79x $4,812.7 ($331.3) $4,481.5 37.3% 33.4% NA NA NM 89.1% 65.0% 22.0% 16.5%
CommVault Systems $75.89 86% 1.97x $3,527.4 ($435.9) $3,091.5 17.3% 15.3% 22.8% 24.7% 22.6% 86.9% 50.0% 9.6% 10.1%
TIBCO Software $21.41 65% 1.18x $3,512.4 ($194.4) $3,318.0 2.8% 9.1% 26.2% 28.2% 12.8% 71.5% 31.7% 15.7% 7.0%
Riverbed Technology $15.56 64% 1.17x $2,542.9 $115.6 $2,658.4 28.6% 11.1% 28.9% 29.9% 16.7% 74.8% 41.1% 17.7% 7.2%
Infoblox $29.26 97% 2.13x $1,465.2 ($191.7) $1,273.5 25.5% 22.7% NA 14.0% 20.0% 78.4% 51.9% 20.1% 10.5%
PROS Holdings $29.95 94% 2.35x $836.1 ($82.5) $753.6 23.2% 21.3% 16.0% 15.8% 24.2% 70.7% NM 23.3% NM
Falconstor Software $1.37 47% 1.12x $65.7 ($27.4) $38.3 NM NA NA NA NM 72.3% 46.5% 25.9% 18.9%
Average 14.1% 13.6% 34.1% 33.3% 16.3% 81.3% 38.7% 16.5% 9.8%
Median 14.7% 14.0% 32.6% 34.1% 16.7% 83.5% 38.9% 16.7% 9.2%
CY EBITDA Margin
Stock Price% of 52-
Week High
Current
Stock Price
as a Multiple
of 52-Wk low
Equity Value Net Debt Ent. Value
CY Rev. Growth GM S&M Mgn.R&D Mgn.G&A Mgn.

27
Appendix– Q2 Selected Software M&A Transactions
Selected Global Software M&A Comparables (Deals > $ 10 million)
Source: CapitalIQ.
Note: (1) Excludes Outlier Multiples for Transactions with EV/Rev. > 8x, and EV/EBITDA > 24x.
Note: EV = Enterprise Value (Equity Value + Debt + Minority Interest – Cash and Cash Equivalents).
Valuation Metrics
Date Target Acquirer
Transaction
Value
($USDmm)
Enterprise
Value
($USDmm)
EV/LTM
Revenues
EV/LTM
EBITDA
Software Sector
06/28/2013 Bravura Solutions Ironbridge Capital Pty $54 $171 1.42x 7.9x
06/28/2013 Neo MTEL CO E-Film CO $13 $64 6.07x NA
06/27/2013 Neolane SA Adobe Systems $600 $600 NM NA
06/24/2013 Keynote Systems Thoma Bravo $399 $341 2.75x 23.1x
06/24/2013 Society6, Demand Media $94 $94 6.29x NA
06/20/2013 Composite Software Cisco Systems $180 $180 NA NA
06/19/2013 Exacq Technologies Tyco International $150 $150 2.73x NA
06/17/2013 Panopticon Software Datawatch Corp. $31 $31 6.28x NA
06/17/2013 prairieFyre Software Mitel Networks Corp. $24 $20 NA NA
06/17/2013 ICT Automatisering NV DPA Group NV $43 $46 0.45x 14.2x
06/17/2013 Veramark Technologies Hubspoke Holdings $13 $12 0.75x 11.6x
06/13/2013 Simplex Holdings The Carlyle Group $284 $216 1.23x 7.1x
06/13/2013 JustChalo OpenTable $11 $11 NA NA
06/13/2013 Terashop S.p.A., MisterPrice,
ePlaza and Bow e-commerce websites
Banzai Commerce $11 $11 NA NA
06/11/2013 Veritape Eckoh $17 $17 NM NA
06/11/2013 Fontworks Softbank Technology $18 $21 NA NA
06/07/2013 EdgeSpring Salesforce.com $80 $80 NA NA
06/05/2013 IQS AvantIQ Wolters Kluwer Corporate Legal Svc. $12 $12 NA NA
06/04/2013 ISS Group P2 Energy Solutions $43 $37 1.84x NM
06/04/2013 ExactTarget Salesforce.com $2,351 $2,250 7.09x NA
06/04/2013 SoftLayer Technologies IBM $2,000 $2,000 NA NA
05/31/2013 d-cyphaTrade ASX $53 $53 NA NA
05/30/2013 Tweddle Group , Tweddle Connect Business Nuance Communications $80 $80 NA NA
05/29/2013 Apriso Corp. Dassault Systemes $205 $205 NA NA
05/29/2013 JouleX Cisco Systems $107 $107 NA NA
05/28/2013 WebCollage Answers Corporation $37 $37 NA NA
05/24/2013 Automattic Tiger Global Management $50 - NA NA
05/21/2013 N-able Technologies Int. SolarWinds Worldwide $120 $120 NA NA
05/21/2013 Markit Group Temasek Holdings $500 $5,000 NA NA
05/20/2013 Cronto VASCO Data Security Int. $22 $22 NA NA
05/14/2013 Brain Force Holding Pierer Industrie $24 $22 0.21x 10.2x
05/08/2013 Civica OMERS Private Equity $608 $608 1.93x 10.3x
05/08/2013 Market Leader Trulia $336 $314 6.59x NA
05/07/2013 Hosting Internet Hizmetleri Telecity Group $45 $45 NA NA
05/07/2013 Microlink Solutions Berhad Formis Holdings Berhad $19 $16 0.96x 4.1x
05/07/2013 Opera Solutions Wipro $30 - NA NA
05/06/2013 Stonesoft Oyj McAfee $372 $379 6.98x NA
05/06/2013 AccessKenya Group Dimension Data Holdings $44 $44 1.93x 5.4x
05/06/2013 BMC Software Insight Venture Partners & 3 Others $8,377 $6,866 3.12x 11.2x
05/06/2013 PPStream, iQIYI.com $370 $370 NA NA
05/06/2013 CNFOL.COM Company Xiamen 35.Com Technology Co $34 $34 NA NA
05/05/2013 ALL Rail Technology Darby Overseas Investments $15 $15 NA NA
05/03/2013 Quindell Property Services Quindell Portfolio $54 $54 NA NA
05/02/2013 Morningstar Sweden Morningstar Europe $13 $17 NA NA
05/02/2013 TriTek Solutions Perficient $19 $19 0.97x NA
05/02/2013 KSD Software Norway AS The Descartes Systems Group $31 $31 3.20x NA
05/01/2013 AwesomenessTV, DreamWorks Animation SKG $150 $150 NA NA
04/30/2013 Mascus Danmark Mascus International $14 $14 2.16x NA
04/30/2013 Dream Industries Essedel Oy $30 $101 NA NA
04/30/2013 FastPencil Courier New Media $18 $18 NA NA

28
Appendix– Q2 Selected Software M&A Transactions (Cont.)
Source: CapitalIQ.
Note: (1) Excludes Outlier Multiples for Transactions with EV/Rev. > 8x, and EV/EBITDA > 24x.
Note: EV = Enterprise Value (Equity Value + Debt + Minority Interest – Cash and Cash Equivalents).
Valuation Metrics
Date Target Acquirer
Transaction
Value
($USDmm)
Enterprise
Value
($USDmm)
EV/LTM
Revenues
EV/LTM
EBITDA
Software Sector
04/29/2013 Revera Telecom Corporation of New Zealand $83 $83 1.93x 7.4x
04/29/2013 Arkoon Network Security Cassidian SAS $21 $17 1.05x 6.0x
04/29/2013 Weibo.com Alibaba Group Holding $586 - NA NA
04/26/2013 E-surfing Media Co. China Telecommunications Corp. $194 $242 NA NA
04/25/2013 Relational Networks Software $25 $25 NA NA
04/24/2013 Idhasoft Prism Informatics $20 $117 NA NA
04/23/2013 Radiant Communications Frontier Networks $15 $9 0.29x 4.6x
04/22/2013 Webhallen Sverige Komplett ASA $21 $21 NA NA
04/18/2013 iter8 Quindell Portfolio $26 $26 NA NA
04/17/2013 BLACKIRON Data ULC Rogers Business Solutions $195 $195 5.95x 15.4x
04/17/2013 Supercell Oy Institutional Venture Partners & 2 Others $130 $778 7.78x NA
04/16/2013 Logo Yazilim Sanayi ve Ticaret AS Mediterra Private Equity $27 $78 2.94x NA
04/11/2013 Alphonso Labs LinkedIn $90 $90 NA NA
04/11/2013 Advent Software TPG Advisors VI $190 $1,204 3.30x 14.6x
04/08/2013 RunMyProcess SAS Fujitsu $20 $20 NM NA
04/08/2013 Alti SA TCS $98 $98 0.60x NA
04/08/2013 ENMAX Envision Shaw Communications $221 $221 NA NA
04/05/2013 1st Holdings ORIX Corp. $322 $298 2.25x 6.0x
04/01/2013 SGCM Pte Singapore Press $48 $48 NA NA
04/01/2013 BGC Partners, , e-speed Platform The Nasdaq OMX Group $1,235 $1,235 NM NA
Average (1) 3.03x 9.9x
Median (1) 2.21x 9.1x

29
Appendix – Public Software Groupings
IT Infrastructure Management
Company Name Ticker
Oracle ORCL
Vmware VMW
Symantec SYMC
Citrix Systems CTXS
CA Technologies CA
Red Hat RHT
F5 Networks FFIV
BMC Software BMC
SolarWinds SWI
Splunk SPLK
CommVault Systems CVLT
TIBCO Software TIBX
Riverbed Technology RVBD
Infoblox BLOX
PROS Holdings PRO
Falconstor Software FALC
Application
Company Name Ticker
Microsoft MSFT
Oracle ORCL
SAP AG SAP
Intuit INTU
Autodesk ADSK
Ansys ANSS
NetSuite N
Splunk SPLK
OpenText OTEX
PTC PMTC
Aspen Technology AZPN
Manhattan Associates MANH
Dealertrack Technologies TRAK
MicroStrategy MSTR
Actuate BIRT
QAD QADA
Security
Company Name Ticker
Symantec SYMC
Check Point Software Tech. CHKP
VeriSign VRSN
Fortinet FTNT
Sourcefire FIRE
Imperva IMPV
Diversified
Company Name Ticker
Microsoft MSFT
Oracle ORCL
SAP AG SAP
Adobe Systems ADBE
Symantec SYMC
E-Commerce
Company Name Ticker
Amazon.com AMZN
eBay EBAY
priceline.com PCLN
Expedia EXPE
Mercadolibre MELI
Groupon GRPN
ValueClick, VCLK
Vistaprint N.V. VPRT
Orbitz Worldwide OWW
Digital River DRIV
Blue Nile NILE
Overstock.com OSTK
SaaS
Company Name Ticker
salesforce.com CRM
Intuit INTU
Workday WDAY
NetSuite N
ServiceNow NOW
Concur Technologies CNQR
Ultimate Software Group ULTI
Qlik Technologies QLIK
Guidewire Software GWRE
Cornerstone OnDemand CSOD
ExactTarget ET
RealPage RP
Synchronoss Tech. SNCR
Jive Software JIVE
LifeLock LOCK
Demandware DWRE
LivePerson LPSN
SPS Commerce SPSC
SciQuest SQI
ServiceSource Int. SREV
Bazaarvoice BV
LogMeIn LOGM
Tangoe TNGO
Responsys MKTG
Constant Contact CTCT
IntraLinks Holdings IL
Vocus VOCS
Carbonite CARB
Callidus Software CALD
Internet
Company Name Ticker
Google GOOG
Facebook FB
Yahoo YHOO
AOL AOL
Yelp YELP

30
Disclaimer
This Quarterly Report (the “Quarterly”) has been prepared solely for informational purposes and may not be used or
relied upon for any purpose other than as specifically contemplated by a written agreement with us.
This Quarterly is not intended to provide the sole basis for evaluating, and should not be considered a
recommendation with respect to, any transaction or other matter. This Quarterly does not constitute an offer, or the
solicitation of an offer, to buy or sell any securities or other financial product, to participate in any transaction or to
provide any investment banking or other services, and should not be deemed to be a commitment or undertaking of
any kind on the part of Navidar Group LLC (“Navidar”) or any of its affiliates to underwrite, place or purchase any
securities or to provide any debt or equity financing or to participate in any transaction, or a recommendation to buy
or sell any securities, to make any investment or to participate in any transaction or trading strategy.
Although the information contained in this Quarterly has been obtained or compiled from sources deemed reliable,
neither Navidar nor any of its affiliates make any representation or warranty, express or implied, as to the accuracy
or completeness of the information contained herein and nothing contained herein is, or shall be relied upon as, a
promise or representation whether as to the past, present or future performance. The information set forth herein
may include estimates and/or involve significant elements of subjective judgment and analysis. No representations
are made as to the accuracy of such estimates or that all assumptions relating to such estimates have been considered
or stated or that such estimates will be realized. The information contained herein does not purport to contain all of
the information that may be required to evaluate a participation in any transaction and any recipient hereof should
conduct its own independent analysis of the data referred to herein. We assume no obligation to update or otherwise
revise these materials.
Navidar and its affiliates do not provide legal, tax or accounting advice. Prior to making any investment or
participating in any transaction, you should consult, to the extent necessary, your own independent legal, tax,
accounting and other professional advisors to ensure that any transaction or investment is suitable for you in the
light of your financial capacity and objectives.