Embed Size (px)
Citation preview

1 Q1 2014
Quarterly results
Q1 2014 Rolv Erik Ryssdal, CEO
Trond Berger, CFO 7 May 2014

Two columns Bullet-textslide Header, max two lines
Text:
Click on ’Increase Indent’
for changing Bullet-level
To get back,
click on ’Decrease Indent’
Steady underlying revenue growth of 14% (incl Spain).
Stable, high margins for established operations
Main sites in Norway, Sweden and France continue to develop well
Milanuncios acquisition in Spain expected to be closed in Q2
Positioning Leboncoin.fr to capture the real estate potential in France
Investments in New ventures NOK 141 million (224 million). In addition
investments in JVs (not affecting EBITDA) of NOK 186 million
Focus on mobile product innovation
Q1 2014
Mixed development in Media Houses
Stable revenues and firm margins for VG and Aftonbladet with their
strong online positions
Accelerated print advertising decline for subscription newspapers,
while continuing online growth
Further development of digital products and subscription models
combined with cost measures
Content revenues larger than ad revenues for Schibsted Norge
Steady growth and margin improvement for personal finance services
Online Classifieds
Media Houses
2
Q1 2014 Highlights

Bullet-textslide Header, max two lines
Text:
Click on ’Increase Indent’
for changing Bullet-level
To get back,
click on ’Decrease Indent’
Turn off ’CLASSIFICED’ via
1. ’Insert’ / ’Header & Footer’
2. Deactivate by clicking off the
Footer Checkbox
3. Check ’Apply to All’
NOKm Q1 2013 Q1 2014
Operating revenues 3,587 3,710
Gross operating profit (EBITDA) 297 410
EBITDA ex. Investment phase 521 551
EBITDA margin 8 % 11 %
EBITDA margin ex. Investment phase 15 % 15 %
EBITDA Online classifieds ex Investment phase 391 454
EBITDA Online classifieds, Investment phase -224 -141
EBITDA Media houses 199 175
3 Q1 2014
Continued online growth, stable margins before investments in New ventures
Q1 highlights
EBITDA ex Investment phase increased with 6%
Underlying revenue growth 2%
Online classifieds joint ventures and associated companies,
not affecting EBITDA, NOK -186 million (-16 million)
3587 3710
15% 15%
0%
6%
12%
18%
24%
0
1000
2000
3000
4000
Q1 13 Q1 14
NOKm
Revenues
EBITDA margin
EBITDA margin ex. Investment phase

Two columns Bullet-textslide Header, max two lines
Text:
Click on ’Increase Indent’
for changing Bullet-level
To get back,
click on ’Decrease Indent’
Amendments of reporting structure
With effect from 1 January 2014,
changes to IFRS requires accounting
for investments in joint ventures to
change from proportionate
consolidation to the equity method
P&L is restated according to this for
2013
Joint ventures and associated
companies are not part of EBITDA, but
included in EBIT
Detailed background figures on
Schibsted Classified Media still show
figures with a proportionate
consolidation for joint ventures
Discontinuing separate EBITDA-reporting
on print and online media
Online/offline split will be maintained on revenues
Details on D&A and EBITA will be discontinued. Focus on EBITDA
Schibsted Sweden is reorganized, and reporting will be amended correspondingly
“Publishing” established as a new unit 1. Aftonbladet including some units that has
been taken over from Tillväxtmedier (Klart.se, Minimedia, and certain other)
2. SvD
4 Q1 2014
Media house changes as
of Q1 2014
Changes related to establishment
of new Online classifieds JVs

Bullet-textslide Header, max two lines
Text:
Click on ’Increase Indent’
for changing Bullet-level
To get back,
click on ’Decrease Indent’
Turn off ’CLASSIFICED’ via
1. ’Insert’ / ’Header & Footer’
2. Deactivate by clicking off the
Footer Checkbox
3. Check ’Apply to All’
Online classifieds
31 %
Media Houses online 23 %
Media Houses Offline
Advertising 16 %
Media Houses subscription
11 %
Media Houses single copy
14 %
Other 5 %
Continued progress in digitalization Revenues Q1 2014 Percentage
EBITDA* ex New Ventures Q1 2014 Percentage
Q1 2014 5
EBITDA* Q1 2014 Percentage
Online share
54% (45%)
Q1 highlights
*) EBITDA excluding HQ
and Other operations
Online Classifieds
64 %
Media Houses
36 %
Online Classifieds
72 %
Media Houses
28 %

Online classifieds
6 Q1 2014

Two columns Bullet-textslide Header, max two lines
Text:
Click on ’Increase Indent’
for changing Bullet-level
To get back,
click on ’Decrease Indent’
14% growth (19% ex Spain), stable margins for Established operations
7 Q1 2014
Large established
- Consistent strong performance
Other established
- Large untapped potential
Figures in NOK million
Online classifieds
• Good growth in Italy,
Austria, Malaysia, Ireland
and Hungary
• Decline in Spain 625
712
885
343 375
471
Q1 12 Q1 13 Q1 14
Revenue EBITDA
233 232 258
42 48 26
Q1 12 Q1 13 Q1 14
Revenue EBITDA
*EBITDA and share of profit from joint ventures and associated companies
*

Two columns Bullet-textslide Header, max two lines
Text:
Click on ’Increase Indent’
for changing Bullet-level
To get back,
click on ’Decrease Indent’
48% 44%
41%
0%
20%
40%
60%
80%
0
100
200
300
400
Q1 12 Q1 13 Q1 14
Revenues EBITDA margin
NO
K m
illio
n
Norway
Steady growth in revenues
8 Q1 2014
+10%* Revenue and volume growth in all
verticals except jobs
Positive Easter effect in 2014
Freemium strategy to boost traffic and
volumes for private miscellaneous to be
gradually implemented, starting in Q2
Lendo Norway taken over by Finn as of
Q1, reinforcing the personal finance
strategy (reduces the EBITDA margin
with 2%-points)
Online classifieds – Large established
*) Underlying growth, adjusted for acquisitions and divestments.

Two columns Bullet-textslide Header, max two lines
Text:
Click on ’Increase Indent’
for changing Bullet-level
To get back,
click on ’Decrease Indent’
Strong volumes in real estate, slowdown with market in jobs
9 Q1 2014
Volumes of jobs declined
along with the market
High activity in the real
estate market
0
5 000
10 000
15 000
20 000
25 000
30 000
35 000
Jan Feb Mar Apr Mai Jun Jul Aug Sep Okt Nov Des
2010 2011 2012 2013 2014
Total real estate listings +19% in Q1 2014
*) NAV is the The Norwegian Labour and Welfare Service
0,0 %
0,3 %
0,5 %
0,8 %
1,0 %
1,3 %
1,5 %
1,8 %
2,0 %
2,3 %
2,5 %
2,8 %
3,0 %
0
10 000
20 000
30 000
40 000
jan
. 10
mai.
10
se
p. 10
jan
. 11
mai.
11
se
p. 11
jan
. 12
mai.
12
se
p. 12
jan
. 13
mai.
13
se
p.
13
jan
. 14
Unem
poym
ent
Tota
l positio
ns
NAV* FINN Unempoyment %
Finn recruitment volumes
-11% in Q1 Y/Y

Two columns Bullet-textslide Header, max two lines
Text:
Click on ’Increase Indent’
for changing Bullet-level
To get back,
click on ’Decrease Indent’
52% 47%
51%
0%
20%
40%
60%
80%
100%
0
50
100
150
200
250
Q1 12 Q1 13 Q1 14
Revenues EBITDA margin
SE
K m
illio
n
Sweden
10 Q1 2014
Good growth, supported by improved market
Good growth in revenues and
EBITDA in Q1
Volume improvements in the car vertical
Strategic exclusivity agreements with
four real estate agents in place
Integration of job portal StepStone
according to plan (affects EBITDA
margin negatively with 2%-points)
New iPhone app launched
+13%*
Online classifieds – Large established
*) Underlying growth, adjusted for acquisitions and divestments.

Two columns Bullet-textslide Header, max two lines
Text:
Click on ’Increase Indent’
for changing Bullet-level
To get back,
click on ’Decrease Indent’
New real estate section on Blocket – exclusivity with four agents
11 Q1 2014

Two columns Bullet-textslide Header, max two lines
Text:
Click on ’Increase Indent’
for changing Bullet-level
To get back,
click on ’Decrease Indent’
69% 70% 68%
0%
20%
40%
60%
80%
0
5
10
15
20
25
30
35
40
Q1 12 Q1 13 Q1 14
Revenues EBITDA margin
+26%
France
Online classifieds – Large established E
UR
mill
ion
Continued growth with a broad range of growth drivers
12 Q1 2014
Continued good growth driven by display
advertising, premium placements and
professional listing fees
New ads per day +8%
Continued improvement of the strong
positions in the professional car market
Real estate sale agreement terminates at
year end

Two columns Bullet-textslide Header, max two lines
Text:
Click on ’Increase Indent’
for changing Bullet-level
To get back,
click on ’Decrease Indent’
Significant potential in real estate
Total market around 23,000
agents
668,000 objects sold in 2013*,
of which 70% through agents
and 30% C2C
Online real estate market
estimated to be around EUR
250 million per year**
Standalone strategy to be
implemented as Spir
agreement expires end 2014
13 Q1 2014
LAYOUT TO BE
REFINED *) Source: FNAIM
Source: Mediametrie **) Source: xerfi precepta 2011/Leboncoin
Two columns Bullet-textslide Header, max two lines
Text:
Click on ’Increase Indent’
for changing Bullet-level
To get back,
click on ’Decrease Indent’
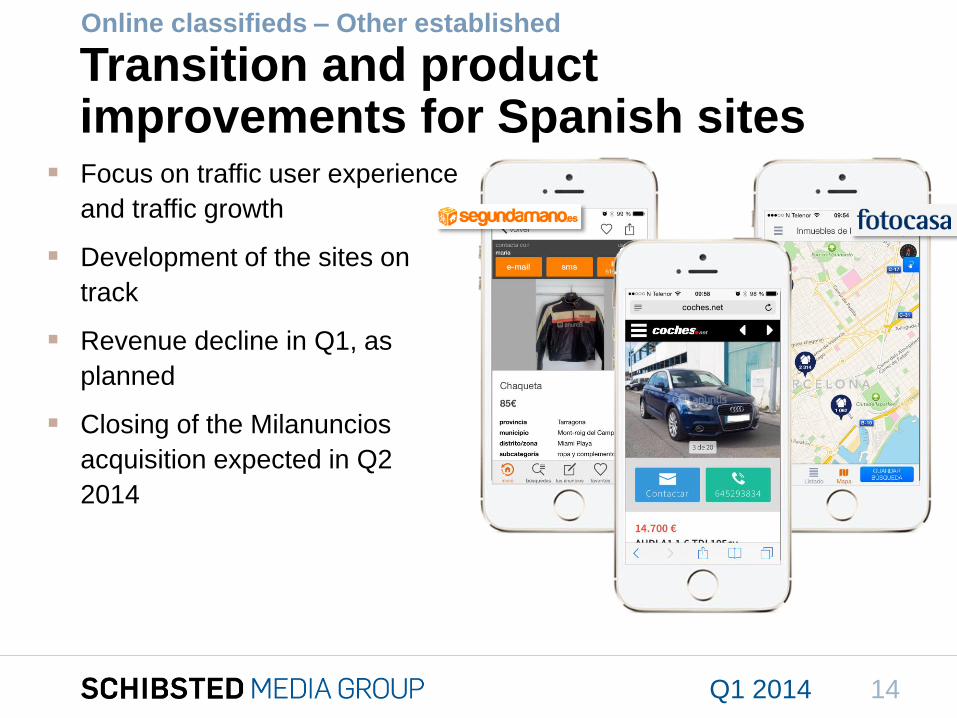
Transition and product improvements for Spanish sites
Focus on traffic user experience
and traffic growth
Development of the sites on
track
Revenue decline in Q1, as
planned
Closing of the Milanuncios
acquisition expected in Q2
2014
14 Q1 2014
Online classifieds – Other established
STATUS ON
SPAIN

Two columns Bullet-textslide Header, max two lines
Text:
Click on ’Increase Indent’
for changing Bullet-level
To get back,
click on ’Decrease Indent’
0
40 000
80 000
120 000
160 000
200 000
240 000
280 000
Q1 Q2 Q3 Q4 Q1 Q2 Q3 Q4 Q1 Q2 Q3 Q4 Q1
2011 2012 2013 2014
Increased investments in new markets yield significant growth
Investment spending of NOK 141 million in New ventures (224 million)
In addition NOK 186 million (16 million) of investments in JVs and associated companies (not part of EBITDA)
Developing leading market positions
Continued good growth in inflow of new ads per day
+199% for Bomnegocio (Brazil)
Good growth in several markets
+154% Yapo (Chile)
+52% Tori (Finland)
+61% Berniaga (Indonesia)
15 Q1 2014
Online classifieds – Investment phase
Daily new ads, investment phase companies
+60%
Note: the graph include figures for (alphabetical order): Ayosdito,
Berniaga, Bikhir, Bomnegocio, Custojusto, Jofogas, Kapaza,
Kufar, Segundamano.mx, Tocmai, Tori, Tutti and Yapo.

Two columns Bullet-textslide Header, max two lines
Text:
Click on ’Increase Indent’
for changing Bullet-level
To get back,
click on ’Decrease Indent’ 6 000
8 000
10 000
12 000
14 000
16 000
Jun13
Jul13
Aug13
Sep13
Oct13
Nov13
Dec13
Jan14
Feb14
Mar14
Total unique visitors (1000)
20 000
30 000
40 000
50 000
60 000
70 000
Jun13
Jul13
Aug13
Sep13
Oct13
Nov13
Dec13
Jan14
Feb14
Mar14
Total visits (1,000)
150
200
250
300
350
400
450
500
Jun13
Jul13
Aug13
Sep13
Oct13
Nov13
Dec13
Jan14
Feb14
Mar14
Total minutes (million)
Bomnegocio.com OLX.com.br
250
300
350
400
450
500
550
600
650
Jun13
Jul 13 Aug13
Sep13
Oct13
Nov13
Dec13
Jan14
Feb14
Mar14
Total pages viewed (million)
Bomnegocio.com OLX.com.br
Good growth for Bomnegocio and key competitor in Brazil
16 Q1 2014

Media houses
17 Q1 2014

Chart-slide Header, max two lines
Text:
All fonts in charts are
Arial Regular, 18 pt
Single copy papers: Steady online growth, investments in new digital products
Norway Sweden
18 Q1 2014
World class digital media houses
Online advertising share 70% (62%)
Main digital growth drivers are mobile and web TV
9% 12%
9%
0%
10%
20%
30%
40%
50%
60%
0
100
200
300
400
500
600
Q1 12 Q1 13 Q1 14
Mill
ion
NO
K
Online revenues Offline revenues
EBITDA margin
14% 15% 15%
0%
10%
20%
30%
40%
50%
60%
0
100
200
300
400
500
600
Q1 12 Q1 13 Q1 14
Mill
ion
NO
K
Online revenues Offline revenues
EBITDA margin

Bullet-textslide Header, max two lines
Text:
Click on ’Increase Indent’
for changing Bullet-level
To get back,
click on ’Decrease Indent’
Turn off ’CLASSIFICED’ via
1. ’Insert’ / ’Header & Footer’
2. Deactivate by clicking off the
Footer Checkbox
3. Check ’Apply to All’ 19 Q1 2014
Strong mobile traffic growth – record high reach for Aftonbladet
World class digital media houses
Example Aftonbladet
And mobile
revenues follow:
+35% in Q1 2014

Two columns Bullet-textslide Header, max two lines
Text:
Click on ’Increase Indent’
for changing Bullet-level
To get back,
click on ’Decrease Indent’
Mixed development for subscription newspapers
20 Q1 2014
13% 10% 10%
-20%
-10%
0%
10%
20%
30%
40%
50%
60%
-200
-100
0
100
200
300
400
500
600
Q1 12 Q1 13 Q1 14
Revenues
14% 10%
0%
-20%
-10%
0%
10%
20%
30%
40%
50%
60%
-200
-100
0
100
200
300
400
500
600
Q1 12 Q1 13 Q1 14
Revenues
13% 8% 8%
-20%
-10%
0%
10%
20%
30%
40%
50%
60%
-200
-100
0
100
200
300
400
500
600
Q1 12 Q1 13 Q1 14
Revenues
-2% 0%
-12% -20%
-10%
0%
10%
20%
30%
40%
50%
60%
-200
-100
0
100
200
300
400
500
600
Q1 12 Q1 13 Q1 14
Revenues
World class digital media houses – subscription newspapers
Online advertising revenues +20% Y/Y
Print advertising revenues -17% (positive Easter effect in Q1 2014)
Increased circulation revenues – print/digital bundles well received
Total cost reduced by 1%

Two columns Bullet-textslide Header, max two lines
Text:
Click on ’Increase Indent’
for changing Bullet-level
To get back,
click on ’Decrease Indent’
Stabilizing circulation volume and revenues driven by digital products
21 Q1 2014
Total circulation revenues +7% Y/Y
Circulation volume including digital and bundled subscriptions +1%
World class digital media houses – subscription newspapers
New Aftenposten
iPad app
launched April
2014

Two columns Bullet-textslide Header, max two lines
Text:
Click on ’Increase Indent’
for changing Bullet-level
To get back,
click on ’Decrease Indent’
Solid progress for Schibsted Growth
Underlying revenue growth of 12% for Schibsted Growth in Sweden
Excluding Hitta, the growth was 27%
Increased revenues and operational improvements resulted in margin expansion
Strong growth for personal finance and coupon business Let’s Deal
Invested in French price comparison site Monsieur Drive
22 Q1 2014
Schibsted Growth (Sweden)
World class digital media houses
17%
10%
24%
0%
5%
10%
15%
20%
25%
30%
0
50
100
150
200
250
Q1 12 Q1 13 Q1 14
Mill
ion
SE
K
Hitta.se
Schibsted Growth Other
EBITDA margin

Two columns Bullet-textslide Header, max two lines
Text:
Click on ’Increase Indent’
for changing Bullet-level
To get back,
click on ’Decrease Indent’
SPiD reaches 2.8 million registered users in Norway and Sweden
A key tool to increase share of
logged in users
Same login for Finn, VG,
Aftenposten, Aftonbladet and
most other Schibsted products
Key building stone for advanced
data analytics and targeted
advertising
Enabler for peer-to-peer payment
services on online classifieds
sites
Roll out in Blocket.se to come
later this year
23 Q1 2014
50% of the Norwegian population over 16 years has a SPiD account
Single sign in and payment services

Financials
24 Q1 2014

Bullet-textslide Header, max two lines
Text:
Click on ’Increase Indent’
for changing Bullet-level
To get back,
click on ’Decrease Indent’
Turn off ’CLASSIFICED’ via
1. ’Insert’ / ’Header & Footer’
2. Deactivate by clicking off the
Footer Checkbox
3. Check ’Apply to All’
Continued good online performance, increased investments in New ventures
Revenues
Q1 2014
EBITDA margin
Q1 14 Q1 13
Underlying
change
y/y*
*) Growth adjusted for acquisitions, divestments and currency fluctuations
Q1 2014
Online
share of
revenues
25
Financials
Schibsted Media Group 3 710 2 % 54 % 11 % 8 %
Online Classifieds 1 151 14 % 100 % 27 % 18 %*) 19 % growth ex Spain
Online Classifieds ex Investment phase 1 123 13 % 100 % 40 % 42 %
- Finn.no 376 10 % 100 % 41 % 44 %
- Blocket.se/Bytbil.se 209 13 % 100 % 51 % 47 %
- Leboncoin.fr 299 26 % 100 % 68 % 70 %
Schibsted Norge media house 1 542 -2 % 21 % 7 % 10 %
Schibsted Sverige media house 952 -1 % 48 % 9 % 6 %

Bullet-textslide Header, max two lines
Text:
Click on ’Increase Indent’
for changing Bullet-level
To get back,
click on ’Decrease Indent’
Turn off ’CLASSIFICED’ via
1. ’Insert’ / ’Header & Footer’
2. Deactivate by clicking off the
Footer Checkbox
3. Check ’Apply to All’ 26 Q1 2014
EBITDA development in Q1
EBITDA
Q1 2014
410
Other
(9)
Online
classifieds
ex
Investment
Phase
63
Media
Houses
International
(7)
Schibsted
Sverige
32
Schibsted
Norge
(49)
EBITDA
Q1 2013
297
Online
classifieds
Investment
phase
83
Reduced EBITDA
effect as a result
of JV accounting
Mill
ion
NO
K
Financials

Bullet-textslide Header, max two lines
Text:
Click on ’Increase Indent’
for changing Bullet-level
To get back,
click on ’Decrease Indent’
Turn off ’CLASSIFICED’ via
1. ’Insert’ / ’Header & Footer’
2. Deactivate by clicking off the
Footer Checkbox
3. Check ’Apply to All’
Income statement Schibsted Group
Q1 2014 27
NOK 83 million
decreased
investment Y/Y in
online classifieds
New ventures.
High tax rate mainly
as losses in Online
classifieds start up
phase are not tax
deductible.
Financials
JVs (mainly online
classifieds New
ventures) reported
with the equity
method as of Q1
2014. 2013 figures
restated.
Full year
(NOK million) Q1 2014 Q1 2013* 2013*
Operating revenues 3 710 3 587 14 870
Operating expenses (3 300) (3 290) (13 093)
Gross operating profit (EBITDA) 410 297 1 777
Depreciation and amortization (114) (117) (476)
Share of profit (loss) of JVs and associates (202) (26) (123)
Impairment loss (9) - (150)
Other income and expenses 45 (7) 647
Operating profit (loss) 130 147 1 675
Net financial items (29) (40) (185)
Profit (loss) before taxes 101 107 1 490
Taxes (125) (46) (453)
Profit (loss) (24) 61 1 037
EPS (NOK) -0,32 0,50 9,43
EPS - adjusted (NOK) -0,69 0,55 3,90
*) Restated figures

Two columns Bullet-textslide Header, max two lines
Text:
Click on ’Increase Indent’
for changing Bullet-level
To get back,
click on ’Decrease Indent’
0
500
1 000
1 500
2 000
2 500
3 000
3 500
< 1 yr < 2yrs
< 3yrs
< 4yrs
< 5yrs
> 5yrs
Other interest-bearing debt Bonds FRNs and CPs
Drawn bankfacilities Undrawn bankfacilities
Stable, strong financial position. New bonds issued at favorable terms
Net Interest Bearing Debt
NOK 1.8 billion
NIBD/EBITDA* at 0.8x end of Q1
New bond issuance of NOK 600
million in April 2014
• 3 month NIBOR +110bp
• 7 years maturity
• Maintaining a diversified debt portfolio
High CAPEX in Q1 as a result of
preparations for co-location in Oslo
Q1 2014
Debt maturity profile
MNOK
28
Financials
*) NIBD/EBITDA according to bank definition.

Bullet-textslide Header, max two lines
Text:
Click on ’Increase Indent’
for changing Bullet-level
To get back,
click on ’Decrease Indent’
Turn off ’CLASSIFICED’ via
1. ’Insert’ / ’Header & Footer’
2. Deactivate by clicking off the
Footer Checkbox
3. Check ’Apply to All’
Key financial figures Earnings per share Cash flow from operating activities/share
CAPEX Net interest bearing debt
NOK NOK
CAPEX (NOK million) and CAPEX/Sales (%) Net interest bearing debt (NOK) and
Ratio of Net interest bearing debt/LTM EBITDA
Note:
NIBD/EBITDA
according to
bank definition.
Q1 2014 29
Financials
1,55 2,47
1,91
-4,62
0,50
1,72
-0,73
7,94
-0,32
-6,00
-4,00
-2,00
0,00
2,00
4,00
6,00
8,00
10,00
Q112 Q212 Q312 Q412 Q113 Q213 Q313 Q413 Q114
1,17
2,65 3,45
4,63
-3,54
2,18 3,05
4,98
-0,57
-6,00
-4,00
-2,00
0,00
2,00
4,00
6,00
8,00
Q112 Q212 Q312 Q412 Q113 Q213 Q313 Q413 Q114
1662 1834
1528 1437
1858
2111
2585
1131
1771
0,8 0,9 0,7 0,7 1,0 1,1 1,5 0,6 0,8
0
1000
2000
3000
Q112 Q212 Q312 Q412 Q113 Q213 Q313 Q413 Q114
79 94 92
101 92 94
131
203
171
2,2 2,5 2,6 2,7 2,6 2,4 3,7
5,3 4,6
0
25
50
75
100
125
150
175
200
225
Q112 Q212 Q312 Q412 Q113 Q213 Q313 Q413 Q114

Two columns Bullet-textslide Header, max two lines
Text:
Click on ’Increase Indent’
for changing Bullet-level
To get back,
click on ’Decrease Indent’
Dividend of NOK 3.50 proposed
Depending on:
Macroeconomic outlook
Investment requirements
NOK 3.50 (unchanged) dividend
proposed for 2013
In the high end of the target range
A balanced dividend level in a period
of investment in online classifieds
growth and digital transition
Equals NOK 376 million based on
total number of shares outstanding
30 Q1 2014
3,50
0,00
0,50
1,00
1,50
2,00
2,50
3,00
3,50
4,00
4,50
5,00
19
99
20
00
20
01
20
02
20
03
20
04
20
05
20
06
20
07
20
08
20
09
20
10
20
11
20
12
20
13*
*) Proposed by the Board of Directors Historic dividend per share adjusted for effect of rights issue in 2009
NOK per share Dividend policy (summary)
Schibsted targets a pay-out ratio over time
in the range of 25% to 40% of cash flow
Financials

Two columns Bullet-textslide Header, max two lines
Text:
Click on ’Increase Indent’
for changing Bullet-level
To get back,
click on ’Decrease Indent’
Amendments of reporting structure
With effect from 1 January 2014,
changes to IFRS requires accounting
for investments in joint ventures to
change from proportionate
consolidation to the equity method
P&L is restated according to this for
2013
Joint ventures and associated
companies are not part of EBITDA, but
included in EBIT
Details on Schibsted Classified Media
still show figures with a proportionate
consolidation for joint ventures
Discontinuing separate EBITDA-reporting
on print and online media
Online/offline split will be maintained on revenues
Details on D&A and EBITA will be discontinued. Focus on EBITDA
Schibsted Sweden is reorganized, and reporting will be amended correspondingly
“Publishing” established as a new unit 1. Aftonbladet including some units that has
been taken over from Tillväxtmedier (Klart.se, Minimedia, and certain other)
2. SvD
31 Q1 2014
Financials
Media house changes as
of Q1 2014
Changes related to establishment
of new Online classifieds JVs

Two columns Bullet-textslide Header, max two lines
Text:
Click on ’Increase Indent’
for changing Bullet-level
To get back,
click on ’Decrease Indent’
JVs reported with the equity method reduces revenues
32 Q1 2014
Revenues
from JVs
2013
reported
2013
restated
15 232 362
14 870
Negative effect on revenues
Change 2013
reported
2013
restated
1 672 105
1 777
Positive impact on EBITDA
Change 2013
reported
2013
restated
1 562
525 1 037
Negative effect on net profit
Share of profit in JVs and
associated companies are
reported below the EBITDA,
included in EBIT
Significant change, as the
revaluation of 701 Search in
connection with the share sale
to Telenor (one off) is reversed
in the restated figures.
The main effect is from
20 Minutes France

Bullet-textslide Header, max two lines
Text:
Click on ’Increase Indent’
for changing Bullet-level
To get back,
click on ’Decrease Indent’
Turn off ’CLASSIFICED’ via
1. ’Insert’ / ’Header & Footer’
2. Deactivate by clicking off the
Footer Checkbox
3. Check ’Apply to All’
Reported profit (loss) before taxes 101
- Share of profit (loss) of joint ventures and associated companies -202
- Other losses for which no deferred tax benefit is recognized* -160
- Gain on remeasurement of previously held equity interest in
business combinations achieved in stages 37
"Adjusted" tax base 426
Taxes 125
Adjusted effective tax rate (125/426) 29 %
33 Q1 2014
High reported tax rate. Underlying rate of around 29%
Financials
*) Mainly online classifieds New ventures that are not in JVs.
Schibsted reports a high tax rate mainly as losses in Online classifieds start up phase are not tax deductible

Outlook
Q1 2014 34

Bullet-textslide Header, max two lines
Text:
Click on ’Increase Indent’
for changing Bullet-level
To get back,
click on ’Decrease Indent’
Turn off ’CLASSIFICED’ via
1. ’Insert’ / ’Header & Footer’
2. Deactivate by clicking off the
Footer Checkbox
3. Check ’Apply to All’
Continued growth potential in the established sites
Continued relatively high investments in New ventures to be
expected going forward. Focus on core markets and expansion in
selected new geographies
Finn.no turn free for certain private categories to boost user
engagement. 2014 negative revenue effect NOK 40 million expected
Positioning Leboncoin.fr to capture the real estate potential in
France
35 Q1 2014
Outlook
Online Classifieds
Media Houses
Digital transition program progressing as planned
Online growth and cost reduction set to partly mitigate effects of
print revenue declines
Softer macro in Norway expected to put pressure on print
advertising – particularly recruitment
Overall expectation for some margin contraction in media
houses during the print-to-digital transition period going forward

Appendices Spreadsheet containing detailed Q1 2014 and Historical and analytical
Information can be downloaded from www.schibsted.com/ir
36 Q1 2014

Chart-slide Header, max two lines
Text:
All fonts in charts are
Arial Regular, 18 pt
Schibsted ASA basic data
Ticker Oslo Stock Exchange: SCH
Reuters: SBST.OL
Bloomberg: SCH NO
Number of shares (2 May 2014) 108,003,615
Treasury shares (2 May 2014) 611,851
Number of shares outstanding 107,391,764
Free float* 73%
Share price (2 May 2014) NOK 338.20
Market cap (2 May 2014) NOK 36.5 bn., EUR 4.4 bn.,
USD 6.1 bn., GBP 3.6 bn.
Average daily trading volume LTM 242,000 shares
*) Total number of shares excluding treasury shares and shares owned by Blommenholm Industrier AS.
37 Q1 2014
Appendices

Bullet-textslide Header, max two lines
Text:
Click on ’Increase Indent’
for changing Bullet-level
To get back,
click on ’Decrease Indent’
Turn off ’CLASSIFICED’ via
1. ’Insert’ / ’Header & Footer’
2. Deactivate by clicking off the
Footer Checkbox
3. Check ’Apply to All’ 38 Q1 2014
Shareholder register
Data as of 31 March 2014. Updated information at: www.schibsted.com/en/ir/Share/Shareholders/
Appendices
Data as of 31 March 2014
Rank Name Holding Share
1 Blommenholm Industrier AS 28,188,589 26.1 %
2 Folketrygdfondet 7,486,976 6.9 %
3 NWT Media AS 4,292,239 4.0 %
4 State Street Bank And Trust Co.* 4,000,000 3.7 %
5 JP Morgan Clearing Corp. * 3,302,000 3.1 %
6 The Northern Trust Company Ltd. * 2,672,320 2.5 %
7 Goldman Sachs & Co Equity Segregation * 2,542,180 2.4 %
8 The Bank Of New York Mellon * 2,139,745 2.0 % Data as of 2 April 2014
9 Morgan Stanley & Co LLC * 1,980,200 1.8 % % of foreign shareholders** 56.7 %
10 Clearstream Banking S.A. * 1,902,283 1.8 % Number of shareholders 4,581
11 UBS AG, London Branch * 1,889,134 1.7 % Number of shares 108,003,615
12 J.P. Morgan Chase Bank N.A. London * 1,858,202 1.7 % Shares ow ned by Schibsted 655,075
13 Credit Suisse Securities (Usa) LLC * 1,760,994 1.6 %
14 J.P. Morgan Chase Bank N.A. London * 1,221,669 1.1 % Largest countries of ownership
15 Montague Place Custody Services * 1,154,447 1.1 % Norw ay** 43.3 %
16 State Street Bank & Trust Company * 1,138,128 1.1 % USA 27.0 %
17 The Northern Trust Co. * 1,107,493 1.0 % United Kingdom 14.0 %
18 The Northern Trust Co. * 1,079,586 1.0 % Sw eden** 5.9 %
19 Deutsche Bank AG * 1,078,051 1.0 % Luxembourg 2.7 %
20 Svenska Handelsbanken AB * 955,577 0.9 % Australia 1.9 %
Source: VPS
*) Nominee accounts
**) NWT Media AS is counted for as a Sw edish shareholder.

Bullet-textslide Header, max two lines
Text:
Click on ’Increase Indent’
for changing Bullet-level
To get back,
click on ’Decrease Indent’
Turn off ’CLASSIFICED’ via
1. ’Insert’ / ’Header & Footer’
2. Deactivate by clicking off the
Footer Checkbox
3. Check ’Apply to All’ 39 Q1 2014
Shareholder analysis – top 25 holders
The shareholder ID data are provided by Nasdaq OMX. The data are
obtained through the analysis of beneficial ownership and fund
manager information provided in replies to disclosure of ownership
notices issued to all custodians on the Schibsted share register.
Whilst every reasonable effort is made to verify all data, neither
Nasdaq OMX or Schibsted can guarantee the accuracy of the
analysis.
Source: Nasdaq OMX.
Data as of 15 April 2014.
Updated information at:
www.schibsted.com/en/ir/Share/Shareholders/
Appendices
Rank Fund manager % Shares
1 Blommenholm Industrier AS 26.10 28,188,589
2 Luxor Capital Group, L.P. 9.93 10,722,618
3 Folketrygdfondet 6.42 6,928,511
4 Baillie Gifford & Co. 6.26 6,760,851
5 NWT Media As 3.70 4,000,000
6 Alecta pensionsförsäkring, ömsesidigt 3.06 3,302,000
7 Caledonia (Private) Investments Pty Limited 2.89 3,125,819
8 SAFE Investment Company Limited 1.91 2,061,763
9 Capital Research Global Investors 1.76 1,902,283
10 Marathon Asset Management LLP 1.70 1,836,935
11 Taube, Hodson, Stonex Partners, LLP 1.54 1,661,556
12 Cadian Capital Management LP 1.49 1,613,672
13 Tw eedy, Brow ne Company LLC 1.39 1,500,952
14 Nordea Funds Oy 1.02 1,102,445
15 Danske Capital (Norw ay) 1.01 1,094,300
16 Fidelity Worldw ide Investment (UK) Ltd. 1.01 1,093,634
17 Platinum Investment Management Ltd. 0.97 1,047,517
18 The Vanguard Group, Inc. 0.95 1,029,164
19 Adelphi Capital LLP 0.91 986,197
20 Sw edbank Robur AB 0.90 972,900
21 New brook Capital Advisors, L.P. 0.89 956,364
22 Storebrand Kapitalforvaltning AS 0.87 940,434
23 Handelsbanken Asset Management 0.86 932,256
24 DNB Asset Management AS 0.86 930,163
25 KLP Forsikring 0.86 927,104

Key financial figures
Full year
2014 2013 2013
Gross operating profit (EBITDA) (NOK million) 410 297 1 777
Gross operating profit (EBITDA) ex new ventures (NOK million) 551 521 2 647
Operating margins (%):
Operating margin (EBITDA) 11 8 12
Operating margin (EBITDA) ex new ventures 15 15 18
EPS (NOK) (0.32) 0.50 9.43
Net cash flow from operating activities (NOK million) (61) (380) 716
Cash flow from operating activities per share (NOK) (0.57) (3.54) 6.67
Profit attributable to owners of the parent (35) 53 1 011
Average number of shares (1 000) 107.349 107.157 107.274
Q1
Q1 2014 40

Bullet-textslide Header, max two lines
Text:
Click on ’Increase Indent’
for changing Bullet-level
To get back,
click on ’Decrease Indent’
Turn off ’CLASSIFICED’ via
1. ’Insert’ / ’Header & Footer’
2. Deactivate by clicking off the
Footer Checkbox
3. Check ’Apply to All’
Capital structure Full year
2014 2013 2013
Investments (NOK million):
Operational investments (capex) 171 92 520
Shares and other holdings 475 22 935
Interest bearing borrowings (NOK million) 2 078 2 518 2 317
Net interest bearing debt (NOK million) 1 771 1 913 1 115
Interest bearing debt ratio (%) 13 16 14
Equity ratio(%) 1)
48 41 46
Q1
1) Treasury shares are offset against equity
Q1 2014 41

Bullet-textslide Header, max two lines
Text:
Click on ’Increase Indent’
for changing Bullet-level
To get back,
click on ’Decrease Indent’
Turn off ’CLASSIFICED’ via
1. ’Insert’ / ’Header & Footer’
2. Deactivate by clicking off the
Footer Checkbox
3. Check ’Apply to All’
Advertising – Print editions
1) Column meters
2) SEK million
Volume1) Change Revenues Change
Per Q1 2014 2013-2014 (NOK million) 2013-2014
Schibsted Norge,
subscription newspapers 24 715 (15) % 331 (18) %
Verdens Gang 2 695 (3) % 57 (21) %
Aftonbladet 2)2 458 (30) % 59 (14) %
Svenska Dagbladet 2)5 172 (3) % 93 (10) %
Q1 2014 42

Two columns Bullet-textslide Header, max two lines
Text:
Click on ’Increase Indent’
for changing Bullet-level
To get back,
click on ’Decrease Indent’
Key operations – Online classifieds
43 Q1 2014
Appendices
Q1 Q1 FY
Finn.no (MNOK) 2014 2013 2013
Operating revenues 376 332 1,406
EBITDA 155 145 691
EBITDA margin 41 % 44 % 49 %
Q1 Q1 FY
Blocket.se/Bytbil.se (MSEK) 2014 2013 2013
Operating revenues 223 192 866
EBITDA 114 90 448
EBITDA margin 51 % 47 % 52 %
Q1 Q1 FY
Leboncoin.fr (MEUR) 2014 2013 2013
Operating revenues 35.8 28.4 124.3
EBITDA 24.5 19.8 83.6
EBITDA margin 68 % 70 % 67 %

Two columns Bullet-textslide Header, max two lines
Text:
Click on ’Increase Indent’
for changing Bullet-level
To get back,
click on ’Decrease Indent’
Key operations – Media houses
44 Q1 2014
Norway
Sweden
Appendices
Q1 Q1 FY
Verdens Gang (MNOK) 2014 2013 2013
Operating revenues 492 477 1,951
of which offline 320 340 1,365
of which online 172 137 586
EBITDA 72 73 313
EBITDA margin 15 % 15 % 16 %
Schibsted Norge subscription Q1 Q1 FY
newspapers (MNOK) 2014 2013 2013
Operating revenues 858 897 3,571
of which offline 734 824 3,214
of which online 124 73 357
EBITDA 45 77 365
EBITDA margin 5 % 9 % 10 %
Q1 Q1 FY
Aftonbladet (MSEK) 2014 2013 2013
Operating revenues 486 494 2,051
of which offline 315 341 1,430
of which online 171 153 621
EBITDA 45 57 287
EBITDA margin 9 % 12 % 14 %
Q1 Q1 FY
SvD (MSEK) 2014 2013 2013
Operating revenues 242 253 1,033
EBITDA 2 (11) 1
EBITDA margin 1 % (4 %) 0 %
Schibsted Growth Q1 Q1 FY
(MSEK) 2014 2013 2013
Operating revenues 240 202 857
EBITDA 58 21 131
EBITDA margin 24 % 10 % 15 %

Bullet-textslide Header, max two lines
Text:
Click on ’Increase Indent’
for changing Bullet-level
To get back,
click on ’Decrease Indent’
Turn off ’CLASSIFICED’ via
1. ’Insert’ / ’Header & Footer’
2. Deactivate by clicking off the
Footer Checkbox
3. Check ’Apply to All’
2006 Schibsted International Classifieds & Search – launch of
Willhaben.at and LeBoncoin.fr
2006 Acquisition of selected assets of Trader Classified Media
(International Classifieds Acquired)
2006 Divestment of ownership in TV 2
2006 Divestment of ownership TV4
2007 Media Norge approved by Schibsted’s general meeting
2009 Rolv Erik Ryssdal new CEO
2009 Media Norge and Schibsted Sverige established
2009 Increased ownership in Finn.no and InfoJobs.net
2009 Non core activities Metronome, Retriever, Basefarm,
Teleadress divested
2010 Increased ownership in Leboncoin.fr from 50% to 100%
2011 Merger with Media Norge.
2011 The Blocket-copy Bomnegocio.com launched in Brazil
2011 Schibsted Norge AS established
2013 Full ownership in Anuntis Segundamano
2013 SnT Classifieds established with Telenor as partner
1839 Chr. Schibsted Forlag (publishing house) founded
1860 Christiania Adresseblad launched in Oslo – renamed
Aftenposten in 1861
1966 Takeover of VG
1989 Reorganisation from a private family company to a limited
company
1992 Listing at the Oslo Stock Exchange with a growth strategy
declaration
1992 First TV and film investments
1995 First New Media/Internet investments
1995 First investments in Kanal 2 in Estonia
1996 Acquisition of Aftonbladet
1998 Acquisition of Svenska Dagbladet
1998 Investment in Eesti Meedia Group
1999 Launch of the free newspaper concept 20 Minutes
2000 Launch of Finn
2003 Acquisition of Blocket
2005 Acquisition of Hitta.se
2005 Launch of Sesam and acquisition of Internettkatalogen
Historical development
See also: http://www.schibsted.com/en/About-Schibsted/History/
45 Q1 2014
Appendices

Bullet-textslide Header, max two lines
Text:
Click on ’Increase Indent’
for changing Bullet-level
To get back,
click on ’Decrease Indent’
Turn off ’CLASSIFICED’ via
1. ’Insert’ / ’Header & Footer’
2. Deactivate by clicking off the
Footer Checkbox
3. Check ’Apply to All’
Visit Schibsted’s homepages
www.schibsted.com/ir
Jo Christian Steigedal, VP Investor Relations
Tel: +47 2310 6600
Mobile: +47 415 08 733
Investor information
Schibsted ASA
Apotekergaten 10, P.O. Box 490 Sentrum, NO-0105 Oslo
Tel: +47 23 10 66 00. Fax: +47 23 10 66 01. E-mail:
www.schibsted.com
46 Q1 2014
Appendices

Q1 2014 47