Embed Size (px)
Citation preview
1
Quarterly Benefits Summary - Great Britain statistics to May 2015 This release aims to give users a structured overview of National Statistics on DWP administered benefits and sanctions, together with early estimates of inactive benefit caseload statistics. To provide a more complete picture of DWP responsibility, statistics on Housing Benefit (administered by Local Authorities), Universal Credit and Child Support are also included.
Main findings (at May 2015 unless otherwise stated)
Contact Lead Statistician: Katie Dodd
Data and Analytics, Technology
Department for Work and Pensions Room BP5201, Benton Park
Road, Longbenton, Newcastle-upon-Tyne
NE98 1YX Telephone: 0191 2166263
Email: [email protected]
Press Office: 0203 267 5129
@DWPgovuk @dwppressoffice
ISBN: 978-1-78425-369-1 Published: 11th November 15
Next Publication: 17th February 16
Contents Introduction 2
Working Age Client Group 3 Jobseeker’s Allowance 4
ESA/Incapacity Benefits 5 Income Support 7
Widow’s Benefit/Bereavement Benefit 8 JSA & ESA Sanctions 9
Universal Credit 13 ESA/IB & ISLP Early Estimates 14
Pensioner Client Group (SP, PC) 17 Disabled & Carers (DLA, PIP, AA, CA, IIDB) 19
Families & Children (CSA) 23 Maternity Allowance 24
Housing Benefit 25 Known Issues, Changes and Revisions 26
Working Age Client Group 4.9 million claimants of working age benefits
down 268 thousand since May 2014
Employment and Support Allowance / Incapacity Benefits (ESA/IB) 2.52 million claimants (2.34 million on ESA)
up 51 thousand since May 2014
Lone Parents on Income Support (ISLP) 442 thousand claimants
down 33 thousand since May 2014
State Pension (SP) 13 million claimants
up 6 thousand since May 2014
Pension Credit (PC) 2.1 million claimants (2.51 million including partners)
down 174 thousand since May 2014
Disability Living Allowance (DLA) 3.08 million claimants
down 153 thousand since May 2014
Attendance Allowance (AA) 1.45 million claimants
down 5 thousand since May 2014
Carer's Allowance (CA) 738 thousand claimants (further 413 thousand people entitled)
up 62 thousand since May 2014
Housing Benefit (HB) at August 2015 4.79 million claimants
down 139 thousand since August 2014 Decisions to apply an ESA sanction
70 thousand new regime sanction decisions
to June 2015
Decisions to apply a JSA sanction 1.82 million new regime sanction decisions
to June 2015
Working Age IS Lone Parents - EARLY ESTIMATE* 435 thousand claimants
at September 2015
ESA / Incapacity Benefits - EARLY ESTIMATE** 2.505 million claimants (7.5% of these are in receipt of National Insurance Credits)
at September 2015
*,** To give an indication of their accuracy, over the past year the ISLP and ESA/IB early estimates have been revised by an average of 0.3 per cent
Yearly Trend
2
Introduction This release contains the latest Department for Work and Pensions National and Official Statistics.
In this document DWP has traditionally administered benefits to a range of claimants who may, or may not have more than one interaction with the department. These benefits include Attendance Allowance, Bereavement Benefit, Carer’s Allowance, Disability Living Allowance, Employment and Support Allowance, Housing Benefit, Income Support, Incapacity Benefit/Severe Disablement Allowance, Jobseeker’s Allowance, Maternity Allowance, Pension Credit, State Pension, Personal Independence Payments and Widow’s Benefit. As well as providing users with an overview of individual benefit statistics, this release attempts to provide a summary of Working Age and Pensionable Age client groups and statistical group breakdowns such as Jobseekers, Employment and Support Allowance/incapacity benefits, Lone Parents, Carers, Other income related benefits, Disabled, and Bereaved. The statistics are released quarterly in February, May, August and November and are primarily sourced from data originally collected via administrative systems. All regular series are full National Statistics except working age inactive benefit early estimates, Personal Independence Payments and sanctions (which are official statistics) and Universal Credit statistics (which are experimental). Further information is available here.
The early estimates for working age inactive benefit client groups are released monthly and are designed to give indicative, timely information; they are not a substitute for the National Statistics. They will be replaced by the quarterly National Statistics covering the same period when they are published. The National Statistics are the finalised figures.
These statistics were released on 11th November 2015 according to the arrangements approved by the UK Statistics Authority. Not all DWP National Statistics are covered by this release. Some statistics have their own first release, but links to these are given throughout.
The UK Statistics Authority has designated these statistics as National Statistics, in accordance with the Statistics and Registration Service Act 2007 and signifying compliance with the Code of Practice for Official Statistics.
Designation can be broadly interpreted to mean that the statistics: • meet identified user needs; • are well explained and readily accessible; • are produced according to sound methods; and • are managed impartially and objectively in the public interest.
Once statistics have been designated as National Statistics it is a statutory requirement that the Code of Practice shall continue to be observed.
Future Releases
The next release will be on 17th February 16. This will contain benefits data to August 2015. For more details see our background information note.
Supplementary statistics
National benefit data (from 100% sources) underlying the charts and figures featured in this summary are available via our internet-based 100% tabulation tool.
The 100% tabulation tool includes further breakdowns by age, gender, duration of benefit, ethnicity and lower level geography e.g. region, local authority, parliamentary constituency. Statistics on Housing Benefit claimants/weekly amounts, Personal Independence Payments, JSA/ESA sanction decisions and Universal Credit are now available via Stat-Xplore, an interactive way for users to create their own statistical tables and related breakdowns. If you need a more detailed breakdown for a particular benefit (for example the type of JSA in payment) you may need to use our 5% sample data which has more detail but less comprehensive coverage. However, 100% data should always be used in preference to 5% estimates (where available), as they are more accurate and form DWP’s headline statistics. Statistics are also released via the NOMIS website and lower geographical statistics are available via the Neighbourhood Statistics website.
3
0
500
1,000
1,500
2,000
2,500
3,000
2000
2001
2002
2003
2004
2005
2006
2007
2008
2009
2010
2011
2012
2013
2014
2015
Thousands
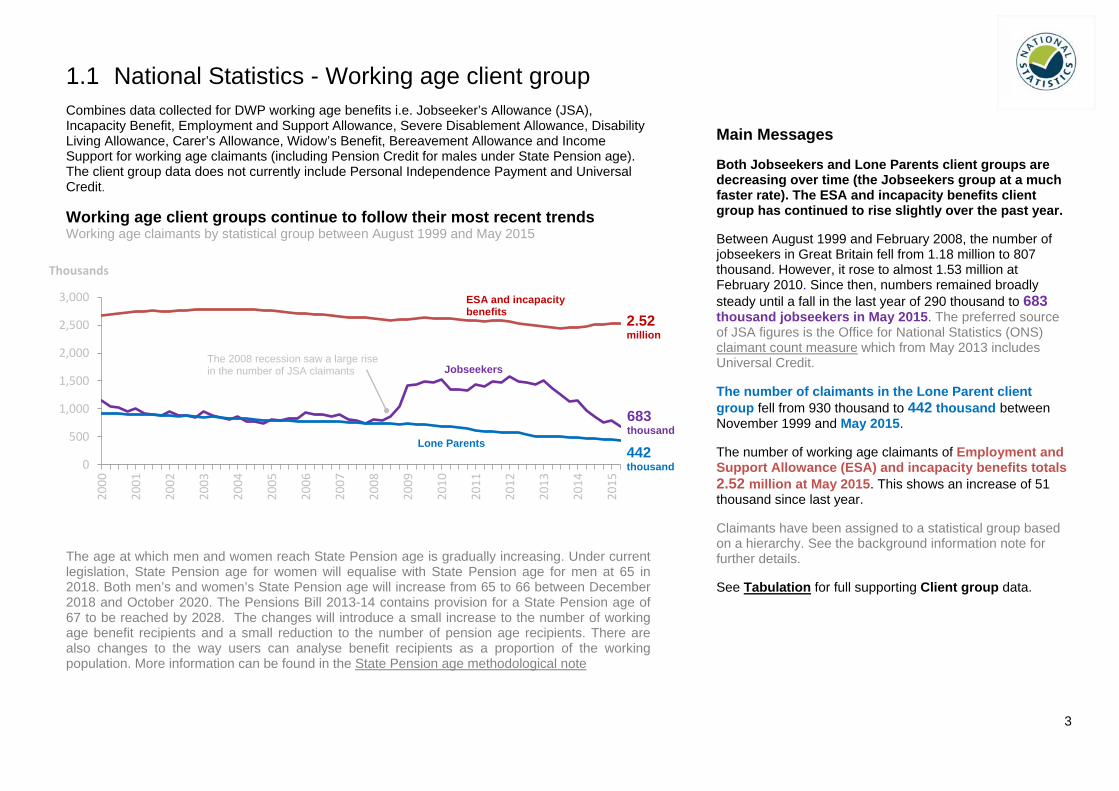
1.1 National Statistics - Working age client group Combines data collected for DWP working age benefits i.e. Jobseeker’s Allowance (JSA), Incapacity Benefit, Employment and Support Allowance, Severe Disablement Allowance, Disability Living Allowance, Carer’s Allowance, Widow’s Benefit, Bereavement Allowance and Income Support for working age claimants (including Pension Credit for males under State Pension age). The client group data does not currently include Personal Independence Payment and Universal Credit.
Working age client groups continue to follow their most recent trends Working age claimants by statistical group between August 1999 and May 2015
The age at which men and women reach State Pension age is gradually increasing. Under current legislation, State Pension age for women will equalise with State Pension age for men at 65 in 2018. Both men’s and women’s State Pension age will increase from 65 to 66 between December 2018 and October 2020. The Pensions Bill 2013-14 contains provision for a State Pension age of 67 to be reached by 2028. The changes will introduce a small increase to the number of working age benefit recipients and a small reduction to the number of pension age recipients. There are also changes to the way users can analyse benefit recipients as a proportion of the working population. More information can be found in the State Pension age methodological note
Main Messages
Both Jobseekers and Lone Parents client groups are decreasing over time (the Jobseekers group at a much faster rate). The ESA and incapacity benefits client group has continued to rise slightly over the past year.
Between August 1999 and February 2008, the number of jobseekers in Great Britain fell from 1.18 million to 807 thousand. However, it rose to almost 1.53 million at February 2010. Since then, numbers remained broadly steady until a fall in the last year of 290 thousand to 683 thousand jobseekers in May 2015. The preferred source of JSA figures is the Office for National Statistics (ONS) claimant count measure which from May 2013 includes Universal Credit.
The number of claimants in the Lone Parent client group fell from 930 thousand to 442 thousand between November 1999 and May 2015.
The number of working age claimants of Employment and Support Allowance (ESA) and incapacity benefits totals 2.52 million at May 2015. This shows an increase of 51 thousand since last year.
Claimants have been assigned to a statistical group based on a hierarchy. See the background information note for further details.
See Tabulation for full supporting Client group data.
442 thousand
2.52 million
683 thousand
ESA and incapacity benefits
Jobseekers
Lone Parents
The 2008 recession saw a large rise in the number of JSA claimants
4
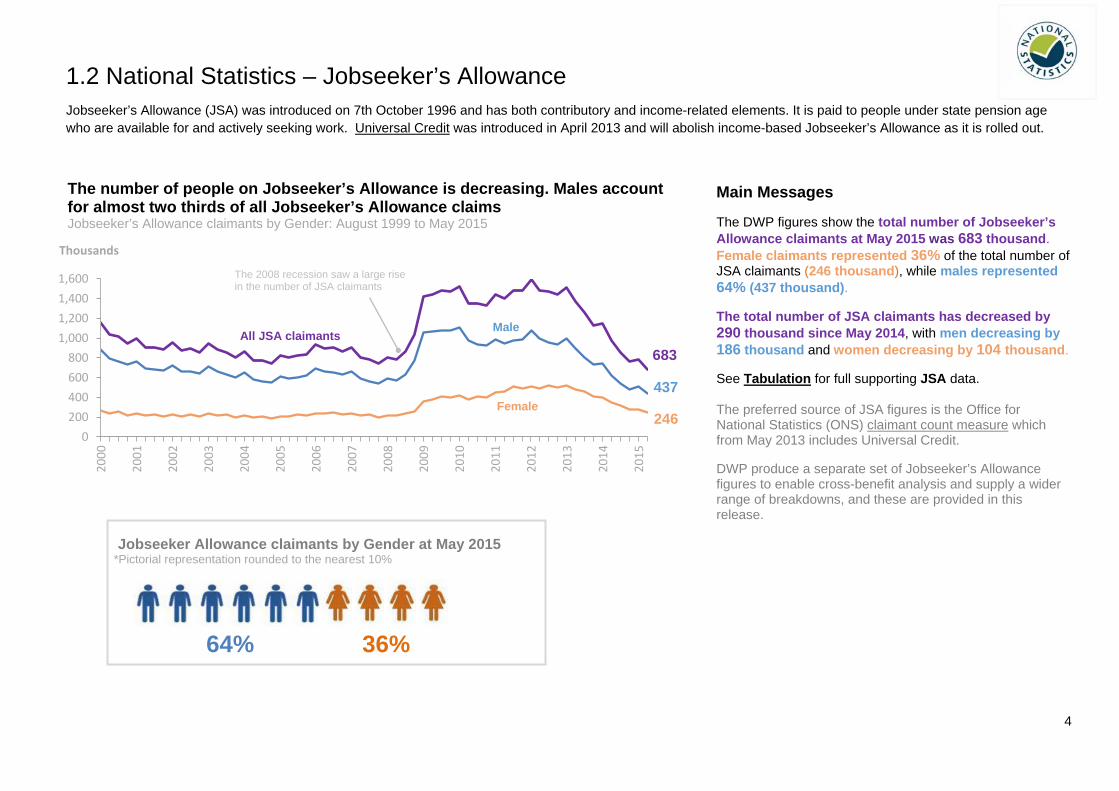
1.2 National Statistics – Jobseeker’s Allowance Jobseeker’s Allowance (JSA) was introduced on 7th October 1996 and has both contributory and income-related elements. It is paid to people under state pension age who are available for and actively seeking work. Universal Credit was introduced in April 2013 and will abolish income-based Jobseeker’s Allowance as it is rolled out.
Jobseeker Allowance claimants by Gender at May 2015 *Pictorial representation rounded to the nearest 10%
Main Messages
The DWP figures show the total number of Jobseeker’s Allowance claimants at May 2015 was 683 thousand. Female claimants represented 36% of the total number of JSA claimants (246 thousand), while males represented 64% (437 thousand).
The total number of JSA claimants has decreased by 290 thousand since May 2014, with men decreasing by 186 thousand and women decreasing by 104 thousand.
See Tabulation for full supporting JSA data.
The preferred source of JSA figures is the Office for National Statistics (ONS) claimant count measure which from May 2013 includes Universal Credit.
DWP produce a separate set of Jobseeker’s Allowance figures to enable cross-benefit analysis and supply a wider range of breakdowns, and these are provided in this release.
0200400600800
1,0001,2001,4001,600
2000
2001
2002
2003
2004
2005
2006
2007
2008
2009
2010
2011
2012
2013
2014
2015
Thousands
The number of people on Jobseeker’s Allowance is decreasing. Males account for almost two thirds of all Jobseeker’s Allowance claims Jobseeker’s Allowance claimants by Gender: August 1999 to May 2015
246
437
683 All JSA claimants
Male
Female
64% 36%
The 2008 recession saw a large rise in the number of JSA claimants
5
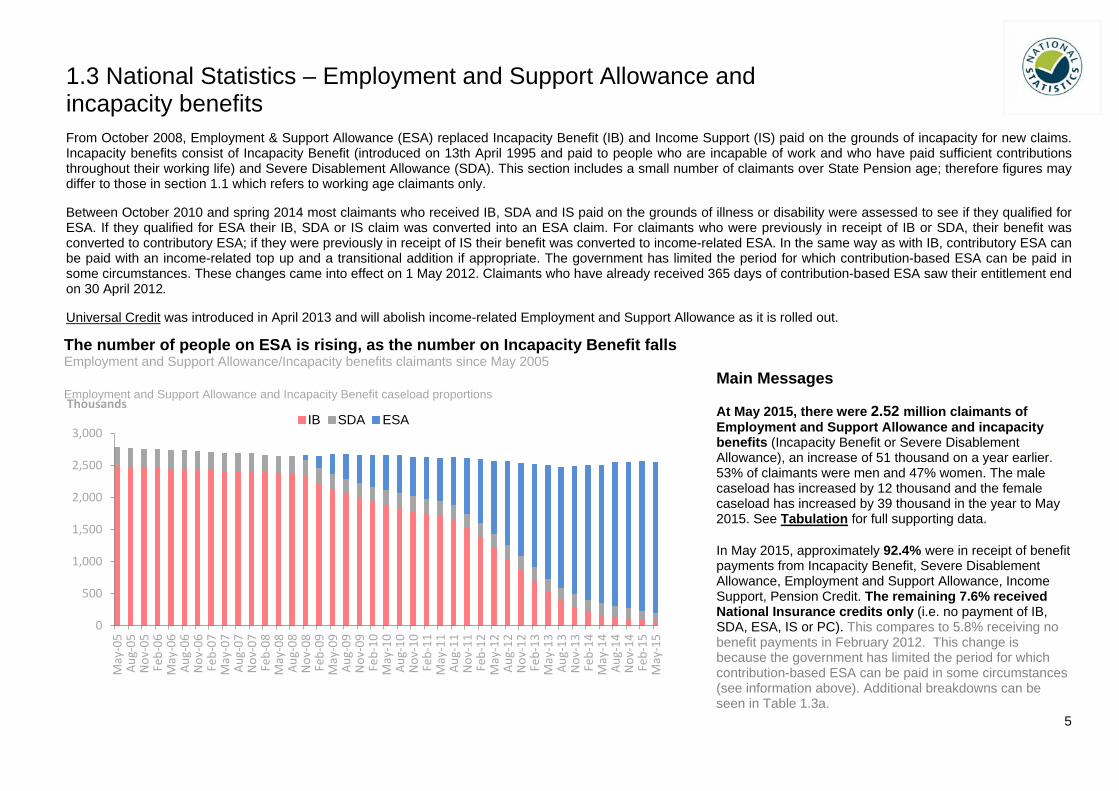
1.3 National Statistics – Employment and Support Allowance and incapacity benefits From October 2008, Employment & Support Allowance (ESA) replaced Incapacity Benefit (IB) and Income Support (IS) paid on the grounds of incapacity for new claims. Incapacity benefits consist of Incapacity Benefit (introduced on 13th April 1995 and paid to people who are incapable of work and who have paid sufficient contributions throughout their working life) and Severe Disablement Allowance (SDA). This section includes a small number of claimants over State Pension age; therefore figures may differ to those in section 1.1 which refers to working age claimants only.
Between October 2010 and spring 2014 most claimants who received IB, SDA and IS paid on the grounds of illness or disability were assessed to see if they qualified for ESA. If they qualified for ESA their IB, SDA or IS claim was converted into an ESA claim. For claimants who were previously in receipt of IB or SDA, their benefit was converted to contributory ESA; if they were previously in receipt of IS their benefit was converted to income-related ESA. In the same way as with IB, contributory ESA can be paid with an income-related top up and a transitional addition if appropriate. The government has limited the period for which contribution-based ESA can be paid in some circumstances. These changes came into effect on 1 May 2012. Claimants who have already received 365 days of contribution-based ESA saw their entitlement end on 30 April 2012.
Universal Credit was introduced in April 2013 and will abolish income-related Employment and Support Allowance as it is rolled out.
Main Messages At May 2015, there were 2.52 million claimants of Employment and Support Allowance and incapacity benefits (Incapacity Benefit or Severe Disablement Allowance), an increase of 51 thousand on a year earlier. 53% of claimants were men and 47% women. The male caseload has increased by 12 thousand and the female caseload has increased by 39 thousand in the year to May 2015. See Tabulation for full supporting data.
In May 2015, approximately 92.4% were in receipt of benefit payments from Incapacity Benefit, Severe Disablement Allowance, Employment and Support Allowance, Income Support, Pension Credit. The remaining 7.6% received National Insurance credits only (i.e. no payment of IB, SDA, ESA, IS or PC). This compares to 5.8% receiving no benefit payments in February 2012. This change is because the government has limited the period for which contribution-based ESA can be paid in some circumstances (see information above). Additional breakdowns can be seen in Table 1.3a.
The number of people on ESA is rising, as the number on Incapacity Benefit falls Employment and Support Allowance/Incapacity benefits claimants since May 2005 Employment and Support Allowance and Incapacity Benefit caseload proportions
0
500
1,000
1,500
2,000
2,500
3,000
May
-05
Aug-
05N
ov-0
5Fe
b-06
May
-06
Aug-
06N
ov-0
6Fe
b-07
May
-07
Aug-
07N
ov-0
7Fe
b-08
May
-08
Aug-
08N
ov-0
8Fe
b-09
May
-09
Aug-
09N
ov-0
9Fe
b-10
May
-10
Aug-
10N
ov-1
0Fe
b-11
May
-11
Aug-
11N
ov-1
1Fe
b-12
May
-12
Aug-
12N
ov-1
2Fe
b-13
May
-13
Aug-
13N
ov-1
3Fe
b-14
May
-14
Aug-
14N
ov-1
4Fe
b-15
May
-15
ThousandsIB SDA ESA
6
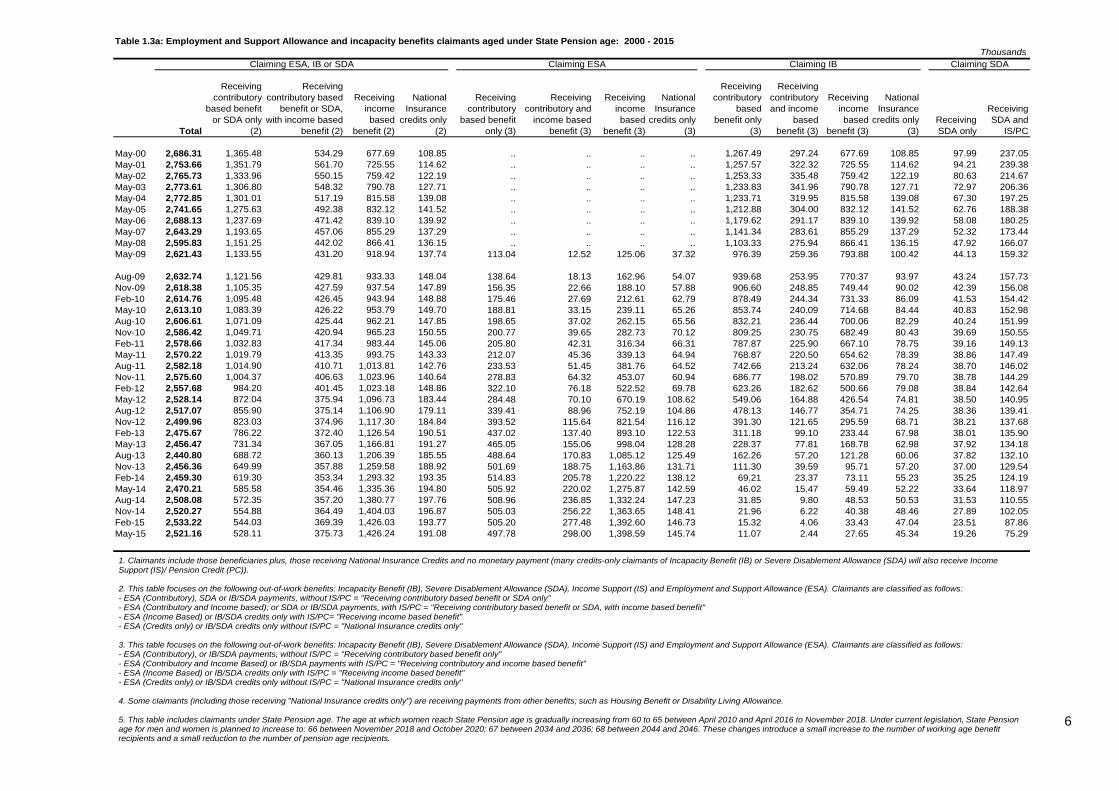
Table 1.3a: Employment and Support Allowance and incapacity benefits claimants aged under State Pension age: 2000 - 2015Thousands
Total
Receiving contributory
based benefit or SDA only
(2)
Receiving contributory based
benefit or SDA, with income based
benefit (2)
Receiving income based
benefit (2)
National Insurance
credits only (2)
Receiving contributory
based benefit only (3)
Receiving contributory and
income based benefit (3)
Receiving income based
benefit (3)
National Insurance
credits only (3)
Receiving contributory
based benefit only
(3)
Receiving contributory and income
based benefit (3)
Receiving income based
benefit (3)
National Insurance
credits only (3)
Receiving SDA only
Receiving SDA and
IS/PC
May-00 2,686.31 1,365.48 534.29 677.69 108.85 .. .. .. .. 1,267.49 297.24 677.69 108.85 97.99 237.05May-01 2,753.66 1,351.79 561.70 725.55 114.62 .. .. .. .. 1,257.57 322.32 725.55 114.62 94.21 239.38May-02 2,765.73 1,333.96 550.15 759.42 122.19 .. .. .. .. 1,253.33 335.48 759.42 122.19 80.63 214.67May-03 2,773.61 1,306.80 548.32 790.78 127.71 .. .. .. .. 1,233.83 341.96 790.78 127.71 72.97 206.36May-04 2,772.85 1,301.01 517.19 815.58 139.08 .. .. .. .. 1,233.71 319.95 815.58 139.08 67.30 197.25May-05 2,741.65 1,275.63 492.38 832.12 141.52 .. .. .. .. 1,212.88 304.00 832.12 141.52 62.76 188.38May-06 2,688.13 1,237.69 471.42 839.10 139.92 .. .. .. .. 1,179.62 291.17 839.10 139.92 58.08 180.25May-07 2,643.29 1,193.65 457.06 855.29 137.29 .. .. .. .. 1,141.34 283.61 855.29 137.29 52.32 173.44May-08 2,595.83 1,151.25 442.02 866.41 136.15 .. .. .. .. 1,103.33 275.94 866.41 136.15 47.92 166.07May-09 2,621.43 1,133.55 431.20 918.94 137.74 113.04 12.52 125.06 37.32 976.39 259.36 793.88 100.42 44.13 159.32
Aug-09 2,632.74 1,121.56 429.81 933.33 148.04 138.64 18.13 162.96 54.07 939.68 253.95 770.37 93.97 43.24 157.73Nov-09 2,618.38 1,105.35 427.59 937.54 147.89 156.35 22.66 188.10 57.88 906.60 248.85 749.44 90.02 42.39 156.08Feb-10 2,614.76 1,095.48 426.45 943.94 148.88 175.46 27.69 212.61 62.79 878.49 244.34 731.33 86.09 41.53 154.42May-10 2,613.10 1,083.39 426.22 953.79 149.70 188.81 33.15 239.11 65.26 853.74 240.09 714.68 84.44 40.83 152.98Aug-10 2,606.61 1,071.09 425.44 962.21 147.85 198.65 37.02 262.15 65.56 832.21 236.44 700.06 82.29 40.24 151.99Nov-10 2,586.42 1,049.71 420.94 965.23 150.55 200.77 39.65 282.73 70.12 809.25 230.75 682.49 80.43 39.69 150.55Feb-11 2,578.66 1,032.83 417.34 983.44 145.06 205.80 42.31 316.34 66.31 787.87 225.90 667.10 78.75 39.16 149.13May-11 2,570.22 1,019.79 413.35 993.75 143.33 212.07 45.36 339.13 64.94 768.87 220.50 654.62 78.39 38.86 147.49Aug-11 2,582.18 1,014.90 410.71 1,013.81 142.76 233.53 51.45 381.76 64.52 742.66 213.24 632.06 78.24 38.70 146.02Nov-11 2,575.60 1,004.37 406.63 1,023.96 140.64 278.83 64.32 453.07 60.94 686.77 198.02 570.89 79.70 38.78 144.29Feb-12 2,557.68 984.20 401.45 1,023.18 148.86 322.10 76.18 522.52 69.78 623.26 182.62 500.66 79.08 38.84 142.64May-12 2,528.14 872.04 375.94 1,096.73 183.44 284.48 70.10 670.19 108.62 549.06 164.88 426.54 74.81 38.50 140.95Aug-12 2,517.07 855.90 375.14 1,106.90 179.11 339.41 88.96 752.19 104.86 478.13 146.77 354.71 74.25 38.36 139.41Nov-12 2,499.96 823.03 374.96 1,117.30 184.84 393.52 115.64 821.54 116.12 391.30 121.65 295.59 68.71 38.21 137.68Feb-13 2,475.67 786.22 372.40 1,126.54 190.51 437.02 137.40 893.10 122.53 311.18 99.10 233.44 67.98 38.01 135.90May-13 2,456.47 731.34 367.05 1,166.81 191.27 465.05 155.06 998.04 128.28 228.37 77.81 168.78 62.98 37.92 134.18Aug-13 2,440.80 688.72 360.13 1,206.39 185.55 488.64 170.83 1,085.12 125.49 162.26 57.20 121.28 60.06 37.82 132.10Nov-13 2,456.36 649.99 357.88 1,259.58 188.92 501.69 188.75 1,163.86 131.71 111.30 39.59 95.71 57.20 37.00 129.54Feb-14 2,459.30 619.30 353.34 1,293.32 193.35 514.83 205.78 1,220.22 138.12 69.21 23.37 73.11 55.23 35.25 124.19May-14 2,470.21 585.58 354.46 1,335.36 194.80 505.92 220.02 1,275.87 142.59 46.02 15.47 59.49 52.22 33.64 118.97Aug-14 2,508.08 572.35 357.20 1,380.77 197.76 508.96 236.85 1,332.24 147.23 31.85 9.80 48.53 50.53 31.53 110.55Nov-14 2,520.27 554.88 364.49 1,404.03 196.87 505.03 256.22 1,363.65 148.41 21.96 6.22 40.38 48.46 27.89 102.05Feb-15 2,533.22 544.03 369.39 1,426.03 193.77 505.20 277.48 1,392.60 146.73 15.32 4.06 33.43 47.04 23.51 87.86May-15 2,521.16 528.11 375.73 1,426.24 191.08 497.78 298.00 1,398.59 145.74 11.07 2.44 27.65 45.34 19.26 75.29
Claiming ESA, IB or SDA Claiming ESA Claiming IB Claiming SDA
1. Claimants include those beneficiaries plus, those receiving National Insurance Credits and no monetary payment (many credits-only claimants of Incapacity Benefit (IB) or Severe Disablement Allowance (SDA) will also receive Income Support (IS)/ Pension Credit (PC)).
2. This table focuses on the following out-of-work benefits: Incapacity Benefit (IB), Severe Disablement Allowance (SDA), Income Support (IS) and Employment and Support Allowance (ESA). Claimants are classified as follows:- ESA (Contributory), SDA or IB/SDA payments, without IS/PC = "Receiving contributory based benefit or SDA only"- ESA (Contributory and Income based); or SDA or IB/SDA payments, with IS/PC = "Receiving contributory based benefit or SDA, with income based benefit"- ESA (Income Based) or IB/SDA credits only with IS/PC= "Receiving income based benefit"- ESA (Credits only) or IB/SDA credits only without IS/PC = "National Insurance credits only"
3. This table focuses on the following out-of-work benefits: Incapacity Benefit (IB), Severe Disablement Allowance (SDA), Income Support (IS) and Employment and Support Allowance (ESA). Claimants are classified as follows:- ESA (Contributory), or IB/SDA payments, without IS/PC = "Receiving contributory based benefit only"- ESA (Contributory and Income Based) or IB/SDA payments with IS/PC = "Receiving contributory and income based benefit"- ESA (Income Based) or IB/SDA credits only with IS/PC = "Receiving income based benefit"- ESA (Credits only) or IB/SDA credits only without IS/PC = "National Insurance credits only"
4. Some claimants (including those receiving "National Insurance credits only") are receiving payments from other benefits; such as Housing Benefit or Disability Living Allowance.
5. This table includes claimants under State Pension age. The age at which women reach State Pension age is gradually increasing from 60 to 65 between April 2010 and April 2016 to November 2018. Under current legislation, State Pension age for men and women is planned to increase to: 66 between November 2018 and October 2020; 67 between 2034 and 2036; 68 between 2044 and 2046. These changes introduce a small increase to the number of working age benefit recipients and a small reduction to the number of pension age recipients.
7
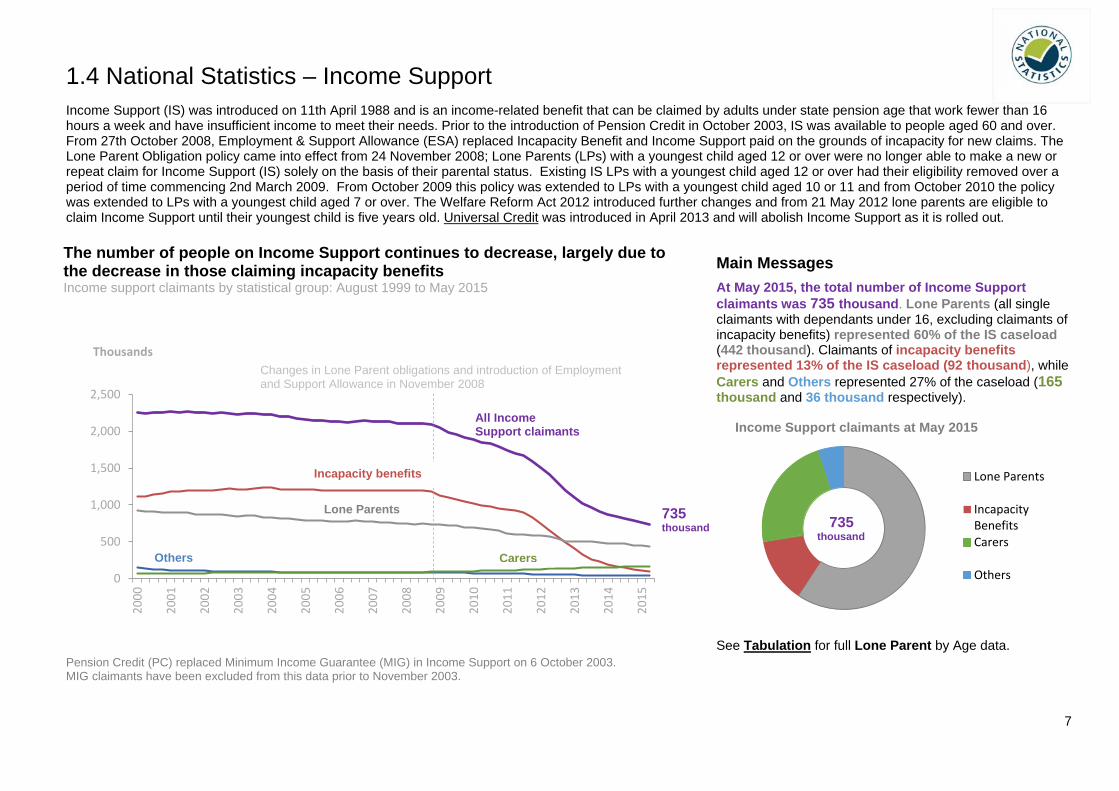
1.4 National Statistics – Income Support Income Support (IS) was introduced on 11th April 1988 and is an income-related benefit that can be claimed by adults under state pension age that work fewer than 16 hours a week and have insufficient income to meet their needs. Prior to the introduction of Pension Credit in October 2003, IS was available to people aged 60 and over. From 27th October 2008, Employment & Support Allowance (ESA) replaced Incapacity Benefit and Income Support paid on the grounds of incapacity for new claims. The Lone Parent Obligation policy came into effect from 24 November 2008; Lone Parents (LPs) with a youngest child aged 12 or over were no longer able to make a new or repeat claim for Income Support (IS) solely on the basis of their parental status. Existing IS LPs with a youngest child aged 12 or over had their eligibility removed over a period of time commencing 2nd March 2009. From October 2009 this policy was extended to LPs with a youngest child aged 10 or 11 and from October 2010 the policy was extended to LPs with a youngest child aged 7 or over. The Welfare Reform Act 2012 introduced further changes and from 21 May 2012 lone parents are eligible to claim Income Support until their youngest child is five years old. Universal Credit was introduced in April 2013 and will abolish Income Support as it is rolled out.
Pension Credit (PC) replaced Minimum Income Guarantee (MIG) in Income Support on 6 October 2003. MIG claimants have been excluded from this data prior to November 2003.
Main Messages
At May 2015, the total number of Income Support claimants was 735 thousand. Lone Parents (all single claimants with dependants under 16, excluding claimants of incapacity benefits) represented 60% of the IS caseload (442 thousand). Claimants of incapacity benefits represented 13% of the IS caseload (92 thousand), while Carers and Others represented 27% of the caseload (165 thousand and 36 thousand respectively).
See Tabulation for full Lone Parent by Age data.
All Income Support claimants
Income Support claimants at May 2015
Lone Parents
IncapacityBenefitsCarers
Others0
500
1,000
1,500
2,000
2,500
2000
2001
2002
2003
2004
2005
2006
2007
2008
2009
2010
2011
2012
2013
2014
2015
Thousands
The number of people on Income Support continues to decrease, largely due to the decrease in those claiming incapacity benefits Income support claimants by statistical group: August 1999 to May 2015
735 thousand
All Income Support claimants
Lone Parents
Incapacity benefits
Carers Others
Changes in Lone Parent obligations and introduction of Employment and Support Allowance in November 2008
735 thousand
8
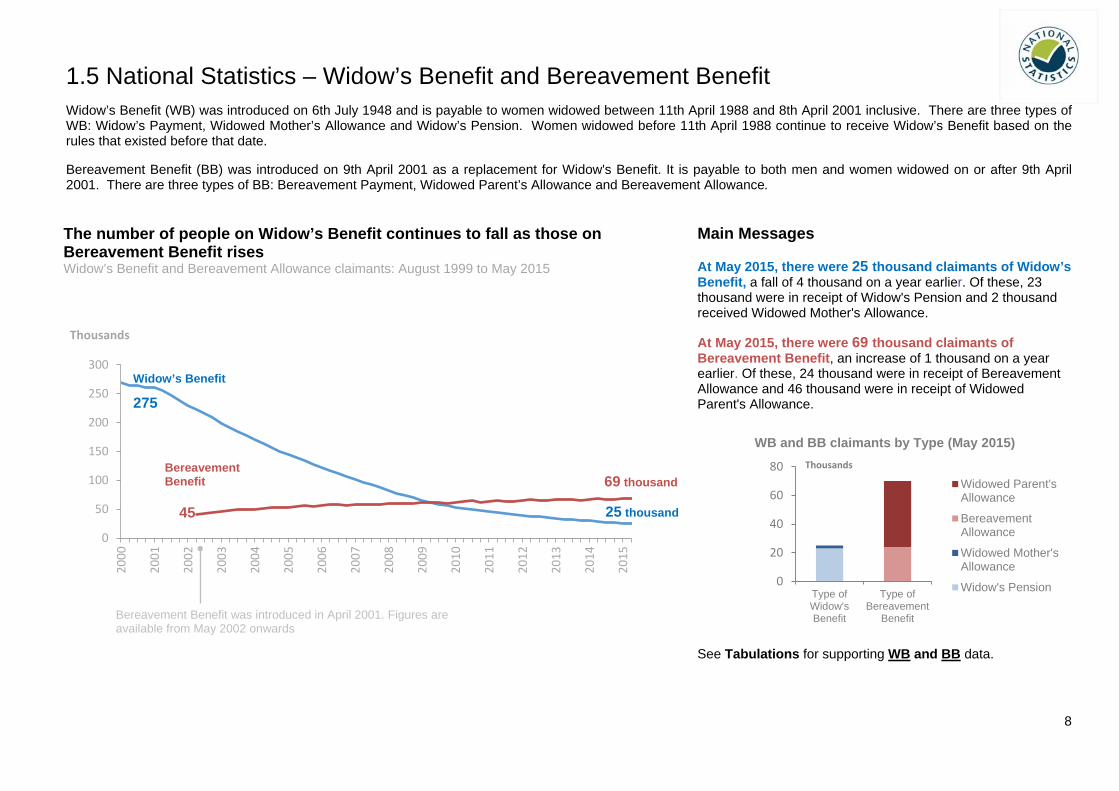
1.5 National Statistics – Widow’s Benefit and Bereavement Benefit Widow’s Benefit (WB) was introduced on 6th July 1948 and is payable to women widowed between 11th April 1988 and 8th April 2001 inclusive. There are three types of WB: Widow’s Payment, Widowed Mother’s Allowance and Widow’s Pension. Women widowed before 11th April 1988 continue to receive Widow’s Benefit based on the rules that existed before that date.
Bereavement Benefit (BB) was introduced on 9th April 2001 as a replacement for Widow's Benefit. It is payable to both men and women widowed on or after 9th April 2001. There are three types of BB: Bereavement Payment, Widowed Parent’s Allowance and Bereavement Allowance.
Main Messages
At May 2015, there were 25 thousand claimants of Widow’s Benefit, a fall of 4 thousand on a year earlier. Of these, 23 thousand were in receipt of Widow's Pension and 2 thousand received Widowed Mother's Allowance.
At May 2015, there were 69 thousand claimants of Bereavement Benefit, an increase of 1 thousand on a year earlier. Of these, 24 thousand were in receipt of Bereavement Allowance and 46 thousand were in receipt of Widowed Parent's Allowance.
See Tabulations for supporting WB and BB data.
0
50
100
150
200
250
300
2000
2001
2002
2003
2004
2005
2006
2007
2008
2009
2010
2011
2012
2013
2014
2015
Thousands
0
20
40
60
80
Type ofWidow'sBenefit
Type ofBereavement
Benefit
Thousands
WB and BB claimants by Type (May 2015)
Widowed Parent'sAllowance
BereavementAllowance
Widowed Mother'sAllowance
Widow's Pension
275
The number of people on Widow’s Benefit continues to fall as those on Bereavement Benefit rises Widow’s Benefit and Bereavement Allowance claimants: August 1999 to May 2015
25 thousand
Bereavement Benefit
45
Bereavement Benefit was introduced in April 2001. Figures are available from May 2002 onwards
Widow’s Benefit
69 thousand
9
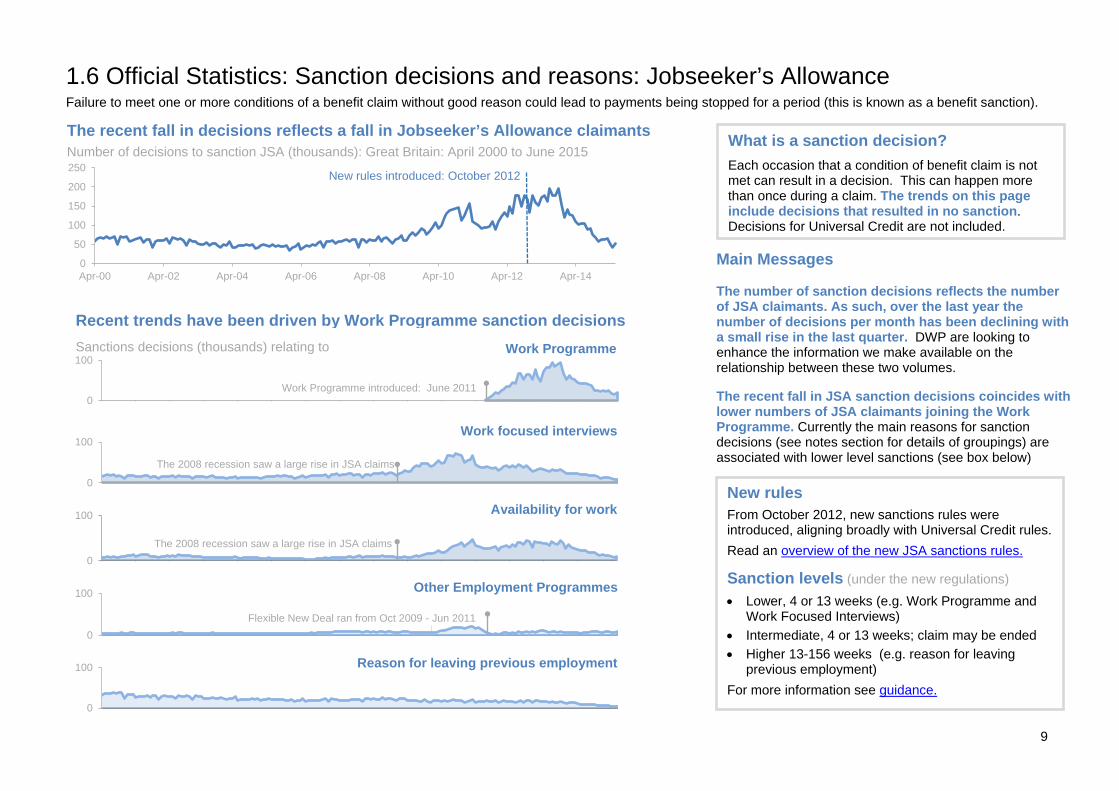
1.6 Official Statistics: Sanction decisions and reasons: Jobseeker’s Allowance Failure to meet one or more conditions of a benefit claim without good reason could lead to payments being stopped for a period (this is known as a benefit sanction).
Main Messages
The number of sanction decisions reflects the number of JSA claimants. As such, over the last year the number of decisions per month has been declining with a small rise in the last quarter. DWP are looking to enhance the information we make available on the relationship between these two volumes.
The recent fall in JSA sanction decisions coincides with lower numbers of JSA claimants joining the Work Programme. Currently the main reasons for sanction decisions (see notes section for details of groupings) are associated with lower level sanctions (see box below)
0
50
100
150
200
250
Apr-00 Apr-02 Apr-04 Apr-06 Apr-08 Apr-10 Apr-12 Apr-14
0
100
Apr-
00
Apr-
01
Apr-
02
Apr-
03
Apr-
04
Apr-
05
Apr-
06
Apr-
07
Apr-
08
Apr-
09
Apr-
10
Apr-
11
Apr-
12
Apr-
13
Apr-
14
Apr-
15
0
100
Apr-
00
Apr-
01
Apr-
02
Apr-
03
Apr-
04
Apr-
05
Apr-
06
Apr-
07
Apr-
08
Apr-
09
Apr-
10
Apr-
11
Apr-
12
Apr-
13
Apr-
14
Apr-
15
0
100
Apr-
00
Apr-
01
Apr-
02
Apr-
03
Apr-
04
Apr-
05
Apr-
06
Apr-
07
Apr-
08
Apr-
09
Apr-
10
Apr-
11
Apr-
12
Apr-
13
Apr-
14
Apr-
15
0
100
Apr-
00
Apr-
01
Apr-
02
Apr-
03
Apr-
04
Apr-
05
Apr-
06
Apr-
07
Apr-
08
Apr-
09
Apr-
10
Apr-
11
Apr-
12
Apr-
13
Apr-
14
Apr-
15
0
100
Apr-
00
Apr-
01
Apr-
02
Apr-
03
Apr-
04
Apr-
05
Apr-
06
Apr-
07
Apr-
08
Apr-
09
Apr-
10
Apr-
11
Apr-
12
Apr-
13
Apr-
14
Apr-
15
Recent trends have been driven by Work Programme sanction decisions
The recent fall in decisions reflects a fall in Jobseeker’s Allowance claimants
Number of decisions to sanction JSA (thousands): Great Britain: April 2000 to June 2015
Work Programme
Work Programme introduced: June 2011
New rules introduced: October 2012
The 2008 recession saw a large rise in JSA claims
Other Employment Programmes
Reason for leaving previous employment
Work focused interviews
Availability for work
The 2008 recession saw a large rise in JSA claims
Flexible New Deal ran from Oct 2009 - Jun 2011
Sanctions decisions (thousands) relating to
New rules From October 2012, new sanctions rules were introduced, aligning broadly with Universal Credit rules. Read an overview of the new JSA sanctions rules.
Sanction levels (under the new regulations) • Lower, 4 or 13 weeks (e.g. Work Programme and
Work Focused Interviews) • Intermediate, 4 or 13 weeks; claim may be ended • Higher 13-156 weeks (e.g. reason for leaving
previous employment) For more information see guidance.
What is a sanction decision? Each occasion that a condition of benefit claim is not met can result in a decision. This can happen more than once during a claim. The trends on this page include decisions that resulted in no sanction. Decisions for Universal Credit are not included.
10
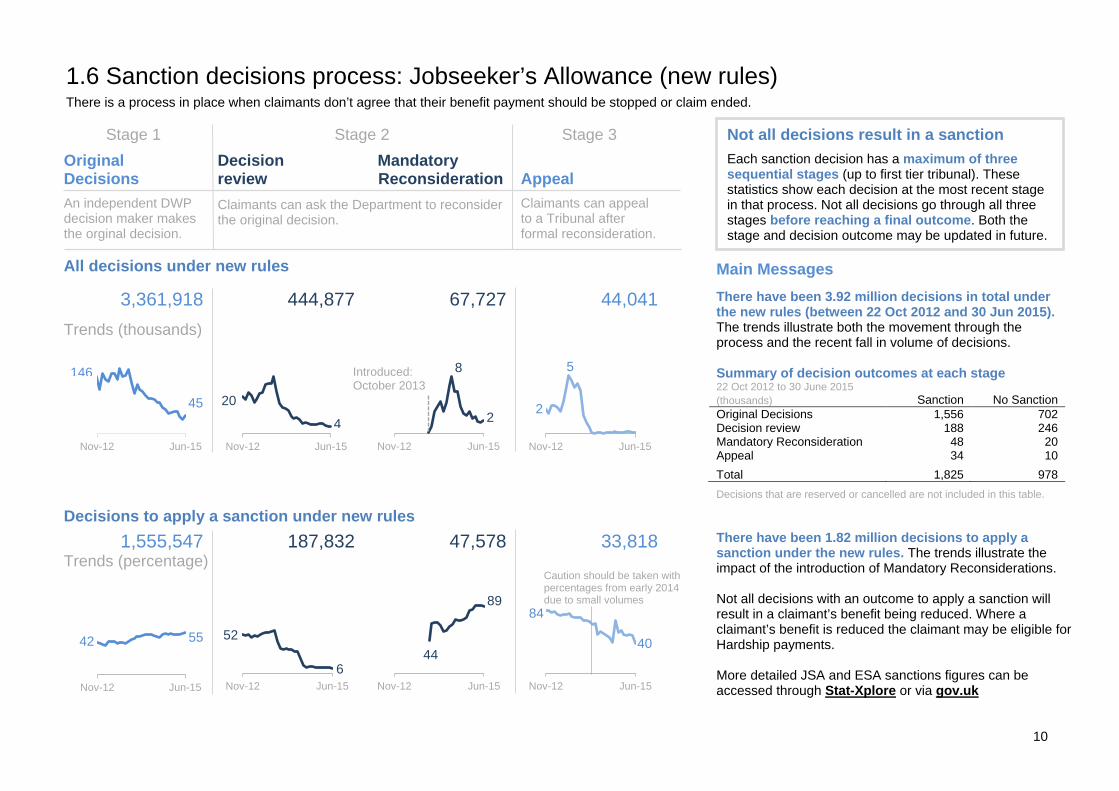
1.6 Sanction decisions process: Jobseeker’s Allowance (new rules) There is a process in place when claimants don’t agree that their benefit payment should be stopped or claim ended.
Stage 1 Stage 2 Stage 3
Original Decisions
An independent DWP decision maker makes the orginal decision.
Decision Mandatory review Reconsideration
Claimants can ask the Department to reconsider the original decision.
Appeal
Claimants can appeal to a Tribunal after formal reconsideration.
All decisions under new rules
3,361,918 444,877 67,727 44,041 Trends (thousands)
Decisions to apply a sanction under new rules 1,555,547 187,832 47,578 33,818
Trends (percentage)
Main Messages There have been 3.92 million decisions in total under the new rules (between 22 Oct 2012 and 30 Jun 2015). The trends illustrate both the movement through the process and the recent fall in volume of decisions. Summary of decision outcomes at each stage 22 Oct 2012 to 30 June 2015 (thousands) Sanction No Sanction Original Decisions 1,556 702 Decision review 188 246 Mandatory Reconsideration 48 20 Appeal 34 10
Total 1,825 978
Decisions that are reserved or cancelled are not included in this table.
There have been 1.82 million decisions to apply a sanction under the new rules. The trends illustrate the impact of the introduction of Mandatory Reconsiderations. Not all decisions with an outcome to apply a sanction will result in a claimant’s benefit being reduced. Where a claimant’s benefit is reduced the claimant may be eligible for Hardship payments. More detailed JSA and ESA sanctions figures can be accessed through Stat-Xplore or via gov.uk
Nov-12 Jun-15 Nov-12 Jun-15 Nov-12 Jun-15 Nov-12 Jun-15
Nov-12 Jun-15 Nov-12 Jun-15 Nov-12 Jun-15 Nov-12 Jun-15
146
45
20
4
2 2
44 42 55 52
6
89 84
40
Introduced: October 2013
Not all decisions result in a sanction
Each sanction decision has a maximum of three sequential stages (up to first tier tribunal). These statistics show each decision at the most recent stage in that process. Not all decisions go through all three stages before reaching a final outcome. Both the stage and decision outcome may be updated in future.
8 5
Caution should be taken with percentages from early 2014 due to small volumes
11
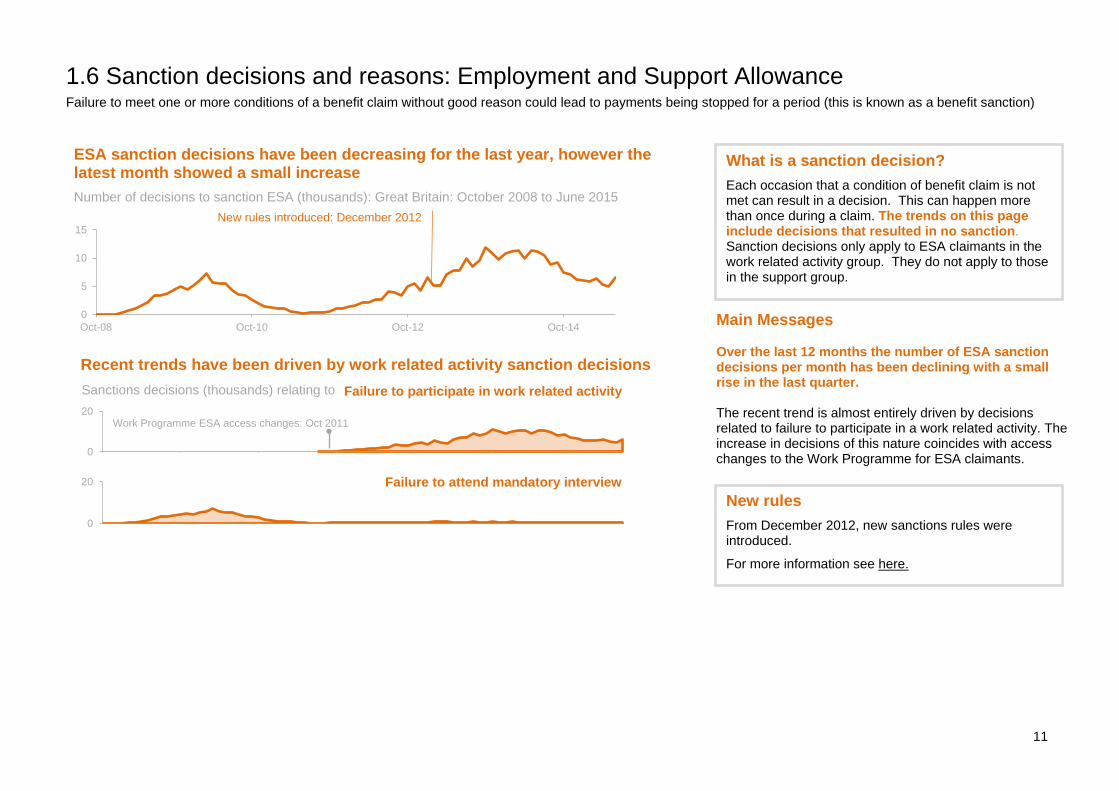
1.6 Sanction decisions and reasons: Employment and Support Allowance Failure to meet one or more conditions of a benefit claim without good reason could lead to payments being stopped for a period (this is known as a benefit sanction)
Main Messages
Over the last 12 months the number of ESA sanction decisions per month has been declining with a small rise in the last quarter.
The recent trend is almost entirely driven by decisions related to failure to participate in a work related activity. The increase in decisions of this nature coincides with access changes to the Work Programme for ESA claimants.
0
5
10
15
Oct-08 Oct-10 Oct-12 Oct-14
0
20
Oct
-08
Oct
-09
Oct
-10
Oct
-11
Oct
-12
Oct
-13
Oct
-14
0
20
Oct
-08
Oct
-09
Oct
-10
Oct
-11
Oct
-12
Oct
-13
Oct
-14
New rules introduced: December 2012
ESA sanction decisions have been decreasing for the last year, however the latest month showed a small increase
Number of decisions to sanction ESA (thousands): Great Britain: October 2008 to June 2015
Work Programme ESA access changes: Oct 2011
Recent trends have been driven by work related activity sanction decisions Failure to participate in work related activity Sanctions decisions (thousands) relating to
Failure to attend mandatory interview New rules From December 2012, new sanctions rules were introduced.
For more information see here.
What is a sanction decision? Each occasion that a condition of benefit claim is not met can result in a decision. This can happen more than once during a claim. The trends on this page include decisions that resulted in no sanction. Sanction decisions only apply to ESA claimants in the work related activity group. They do not apply to those in the support group.
12
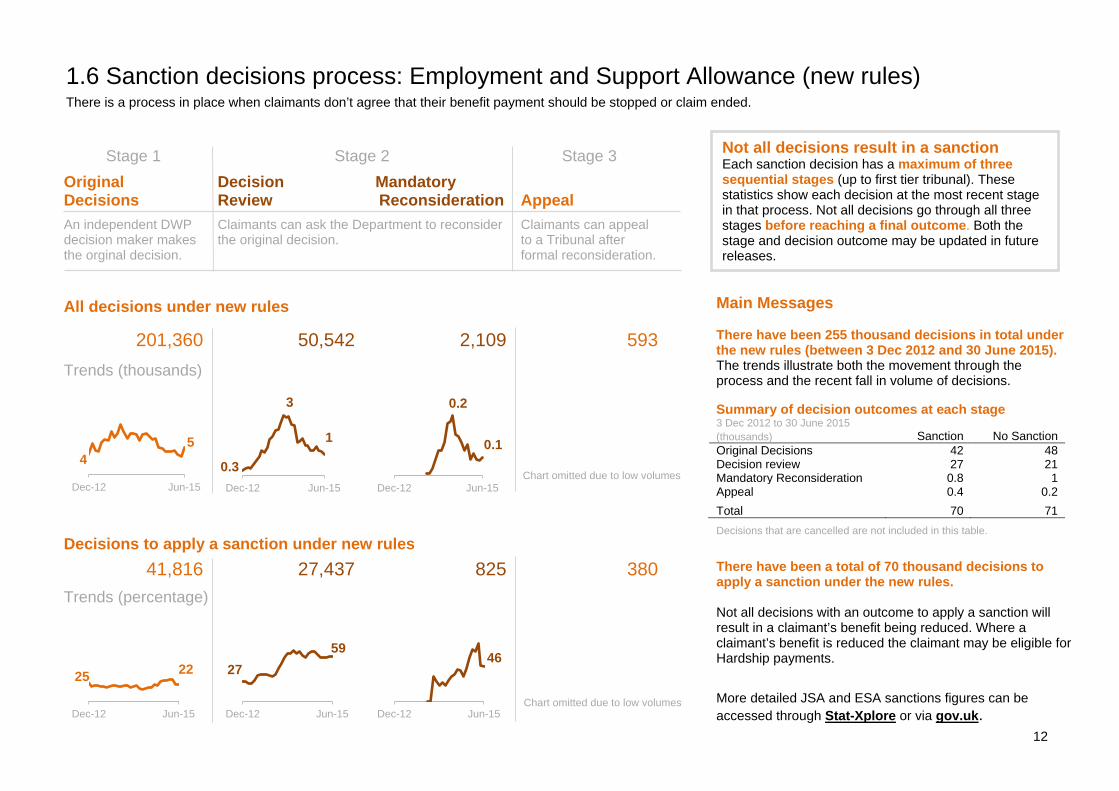
1.6 Sanction decisions process: Employment and Support Allowance (new rules) There is a process in place when claimants don’t agree that their benefit payment should be stopped or claim ended.
Stage 1 Stage 2 Stage 3
Original Decisions
An independent DWP decision maker makes the orginal decision.
Decision Mandatory Review Reconsideration
Claimants can ask the Department to reconsider the original decision.
Appeal
Claimants can appeal to a Tribunal after formal reconsideration.
All decisions under new rules
201,360 50,542 2,109 593 Trends (thousands)
Decisions to apply a sanction under new rules 41,816 27,437 825 380
Trends (percentage)
Main Messages
There have been 255 thousand decisions in total under the new rules (between 3 Dec 2012 and 30 June 2015). The trends illustrate both the movement through the process and the recent fall in volume of decisions.
Summary of decision outcomes at each stage 3 Dec 2012 to 30 June 2015 (thousands) Sanction No Sanction Original Decisions 42 48 Decision review 27 21 Mandatory Reconsideration 0.8 1 Appeal 0.4 0.2
Total 70 71
Decisions that are cancelled are not included in this table.
There have been a total of 70 thousand decisions to apply a sanction under the new rules. Not all decisions with an outcome to apply a sanction will result in a claimant’s benefit being reduced. Where a claimant’s benefit is reduced the claimant may be eligible for Hardship payments.
More detailed JSA and ESA sanctions figures can be accessed through Stat-Xplore or via gov.uk.
Dec-12 Jun-15 Dec-12 Jun-15 Dec-12 Jun-15
Dec-12 Jun-15 Dec-12 Jun-15 Dec-12 Jun-15
4 5
0.3
1 0.1
25 22 27 59
46
Not all decisions result in a sanction Each sanction decision has a maximum of three sequential stages (up to first tier tribunal). These statistics show each decision at the most recent stage in that process. Not all decisions go through all three stages before reaching a final outcome. Both the stage and decision outcome may be updated in future releases.
Chart omitted due to low volumes
Chart omitted due to low volumes
3 0.2
13
0
50,000
100,000
150,000
0
5,000
10,000
15,000
20,000
25,000
0
2,000
4,000
6,000
8,000
29-Oct-14 29-Oct-15
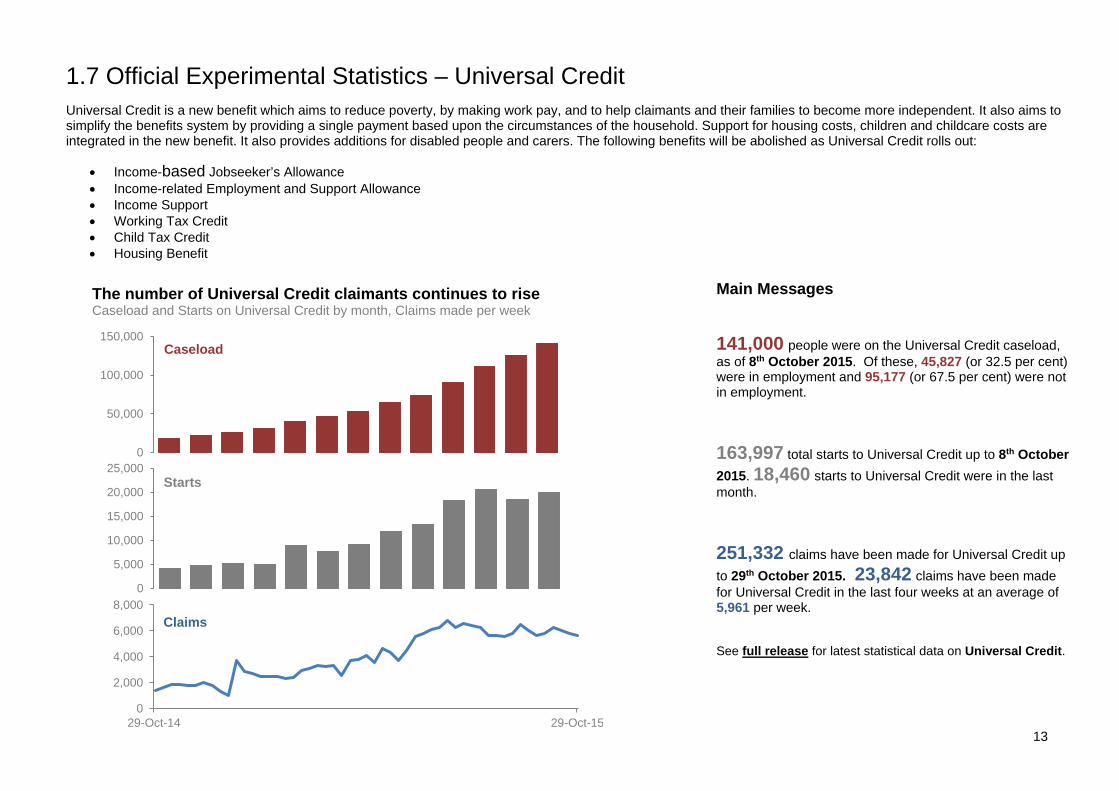
1.7 Official Experimental Statistics – Universal Credit Universal Credit is a new benefit which aims to reduce poverty, by making work pay, and to help claimants and their families to become more independent. It also aims to simplify the benefits system by providing a single payment based upon the circumstances of the household. Support for housing costs, children and childcare costs are integrated in the new benefit. It also provides additions for disabled people and carers. The following benefits will be abolished as Universal Credit rolls out:
• Income-based Jobseeker’s Allowance • Income-related Employment and Support Allowance • Income Support • Working Tax Credit • Child Tax Credit • Housing Benefit
Main Messages
141,000 people were on the Universal Credit caseload, as of 8th October 2015. Of these, 45,827 (or 32.5 per cent) were in employment and 95,177 (or 67.5 per cent) were not in employment.
163,997 total starts to Universal Credit up to 8th October 2015. 18,460 starts to Universal Credit were in the last month.
251,332 claims have been made for Universal Credit up to 29th October 2015. 23,842 claims have been made for Universal Credit in the last four weeks at an average of 5,961 per week.
See full release for latest statistical data on Universal Credit.
The number of Universal Credit claimants continues to rise Caseload and Starts on Universal Credit by month, Claims made per week
Claims
Starts
Caseload
14
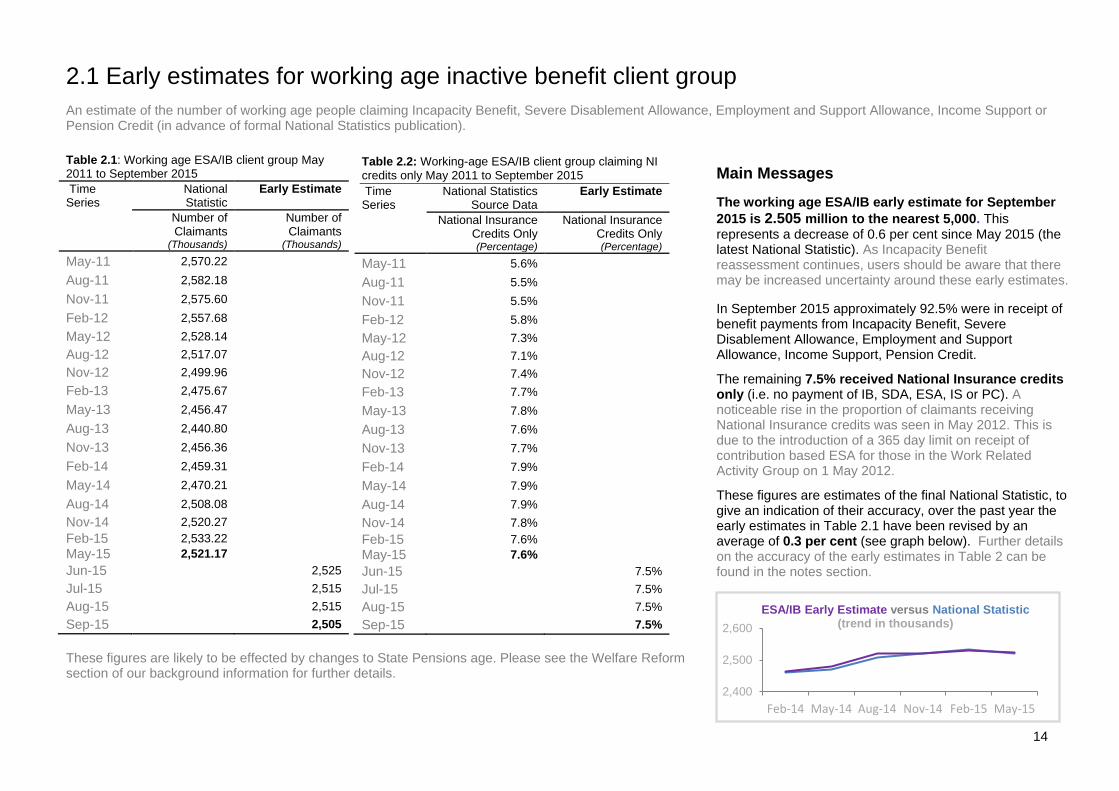
2.1 Early estimates for working age inactive benefit client groupAn estimate of the number of working age people claiming Incapacity Benefit, Severe Disablement Allowance, Employment and Support Allowance, Income Support or Pension Credit (in advance of formal National Statistics publication).
Table 2.2: Working-age ESA/IB client group claiming NI credits only May 2011 to September 2015 Time Series
National Statistics Source Data
Early Estimate
National Insurance Credits Only (Percentage)
National Insurance Credits Only (Percentage)
May-11 5.6% Aug-11 5.5% Nov-11 5.5% Feb-12 5.8% May-12 7.3% Aug-12 7.1% Nov-12 7.4% Feb-13 7.7% May-13 7.8% Aug-13 7.6% Nov-13 7.7% Feb-14 7.9% May-14 7.9% Aug-14 7.9% Nov-14 7.8% Feb-15 7.6% May-15 7.6% Jun-15 7.5% Jul-15 7.5% Aug-15 7.5% Sep-15 7.5%
These figures are likely to be effected by changes to State Pensions age. Please see the Welfare Reform section of our background information for further details.
Main Messages The working age ESA/IB early estimate for September 2015 is 2.505 million to the nearest 5,000. This represents a decrease of 0.6 per cent since May 2015 (the latest National Statistic). As Incapacity Benefit reassessment continues, users should be aware that there may be increased uncertainty around these early estimates.
In September 2015 approximately 92.5% were in receipt of benefit payments from Incapacity Benefit, Severe Disablement Allowance, Employment and Support Allowance, Income Support, Pension Credit.
The remaining 7.5% received National Insurance credits only (i.e. no payment of IB, SDA, ESA, IS or PC). A noticeable rise in the proportion of claimants receiving National Insurance credits was seen in May 2012. This is due to the introduction of a 365 day limit on receipt of contribution based ESA for those in the Work Related Activity Group on 1 May 2012.
These figures are estimates of the final National Statistic, to give an indication of their accuracy, over the past year the early estimates in Table 2.1 have been revised by an average of 0.3 per cent (see graph below). Further details on the accuracy of the early estimates in Table 2 can be found in the notes section.
2,400
2,500
2,600
Feb-14 May-14 Aug-14 Nov-14 Feb-15 May-15
ESA/IB Early Estimate versus National Statistic (trend in thousands)
Table 2.1: Working age ESA/IB client group May 2011 to September 2015 Time Series
National Statistic
Early Estimate
Number of Claimants
(Thousands)
Number of Claimants
(Thousands) May-11 2,570.22 Aug-11 2,582.18 Nov-11 2,575.60 Feb-12 2,557.68 May-12 2,528.14 Aug-12 2,517.07 Nov-12 2,499.96 Feb-13 2,475.67 May-13 2,456.47 Aug-13 2,440.80 Nov-13 2,456.36 Feb-14 2,459.31 May-14 2,470.21 Aug-14 2,508.08 Nov-14 2,520.27 Feb-15 2,533.22 May-15 2,521.17 Jun-15 2,525 Jul-15 2,515 Aug-15 2,515 Sep-15 2,505
15
2.1 Early estimates for working age inactive benefit client group
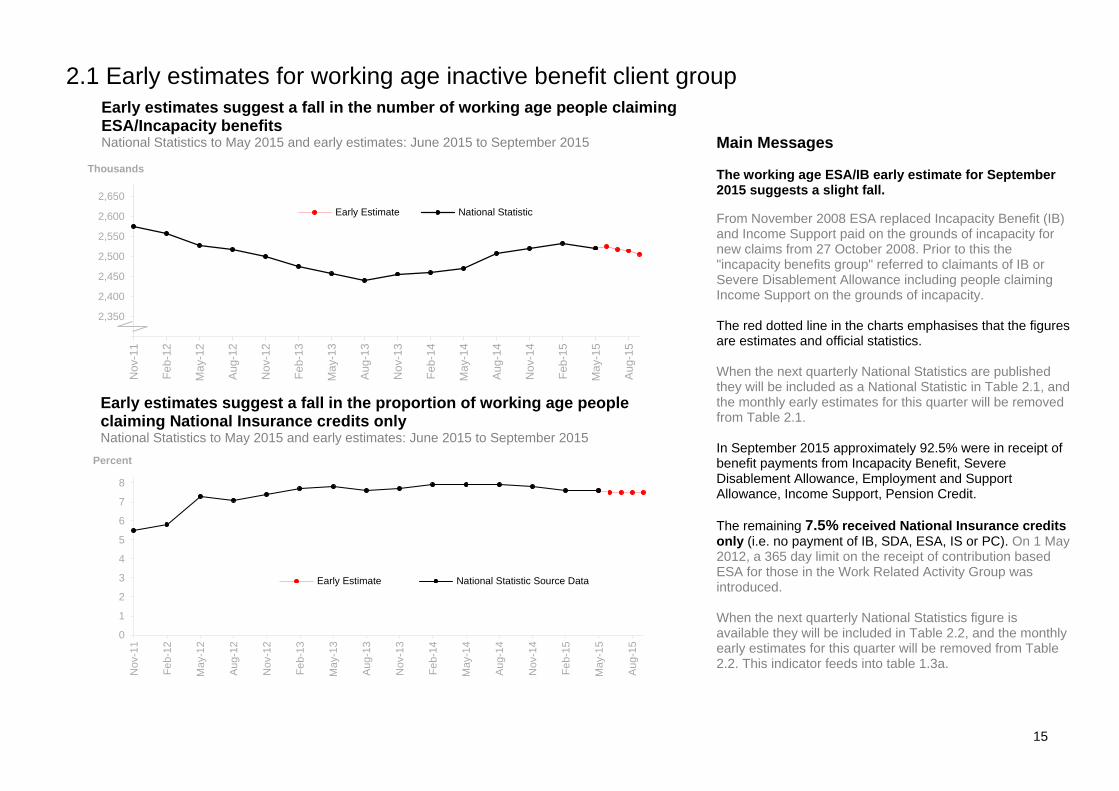
Main Messages The working age ESA/IB early estimate for September 2015 suggests a slight fall.
From November 2008 ESA replaced Incapacity Benefit (IB) and Income Support paid on the grounds of incapacity for new claims from 27 October 2008. Prior to this the "incapacity benefits group" referred to claimants of IB or Severe Disablement Allowance including people claiming Income Support on the grounds of incapacity. The red dotted line in the charts emphasises that the figures are estimates and official statistics. When the next quarterly National Statistics are published they will be included as a National Statistic in Table 2.1, and the monthly early estimates for this quarter will be removed from Table 2.1. In September 2015 approximately 92.5% were in receipt of benefit payments from Incapacity Benefit, Severe Disablement Allowance, Employment and Support Allowance, Income Support, Pension Credit. The remaining 7.5% received National Insurance credits only (i.e. no payment of IB, SDA, ESA, IS or PC). On 1 May 2012, a 365 day limit on the receipt of contribution based ESA for those in the Work Related Activity Group was introduced. When the next quarterly National Statistics figure is available they will be included in Table 2.2, and the monthly early estimates for this quarter will be removed from Table 2.2. This indicator feeds into table 1.3a.
0
1
2
3
4
5
6
7
8
Nov
-11
Feb-
12
May
-12
Aug
-12
Nov
-12
Feb-
13
May
-13
Aug
-13
Nov
-13
Feb-
14
May
-14
Aug
-14
Nov
-14
Feb-
15
May
-15
Aug
-15
Percent
Early Estimate National Statistic Source Data
Early estimates suggest a fall in the number of working age people claiming ESA/Incapacity benefits National Statistics to May 2015 and early estimates: June 2015 to September 2015
Early estimates suggest a fall in the proportion of working age people claiming National Insurance credits only National Statistics to May 2015 and early estimates: June 2015 to September 2015
2,300
2,350
2,400
2,450
2,500
2,550
2,600
2,650
Nov
-11
Feb-
12
May
-12
Aug
-12
Nov
-12
Feb-
13
May
-13
Aug
-13
Nov
-13
Feb-
14
May
-14
Aug
-14
Nov
-14
Feb-
15
May
-15
Aug
-15
Thousands
Early Estimate National Statistic
16
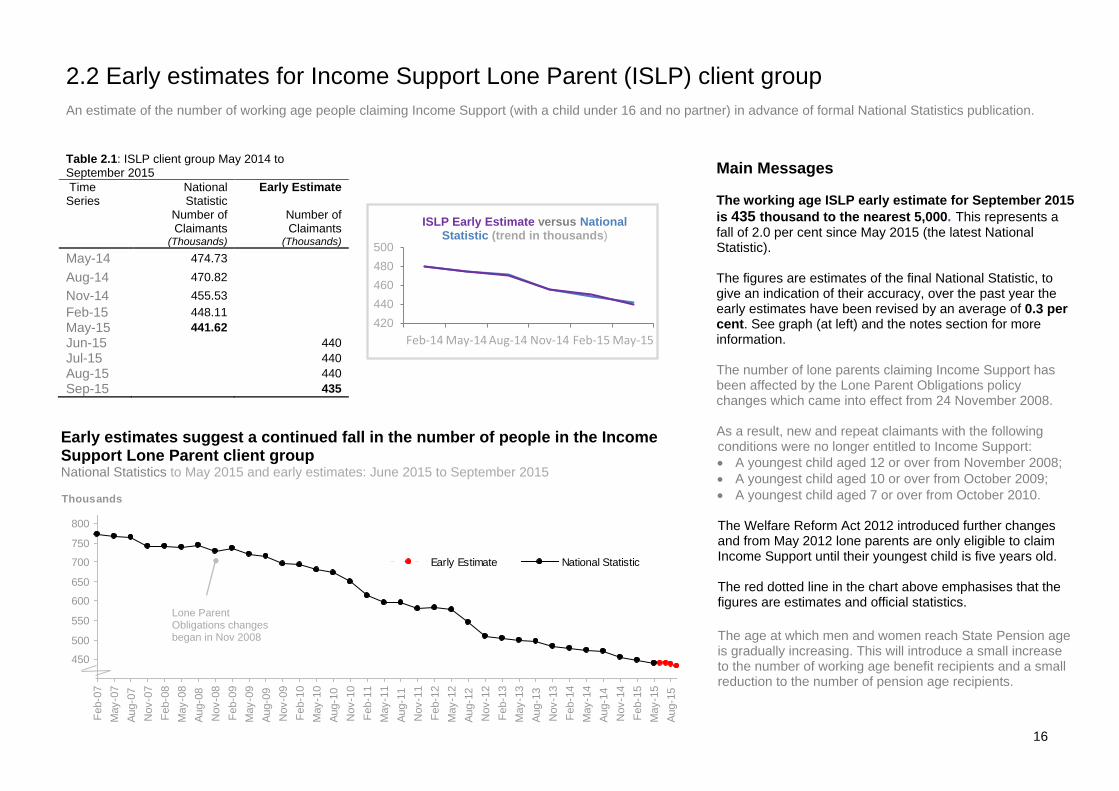
2.2 Early estimates for Income Support Lone Parent (ISLP) client group An estimate of the number of working age people claiming Income Support (with a child under 16 and no partner) in advance of formal National Statistics publication.
Main Messages The working age ISLP early estimate for September 2015 is 435 thousand to the nearest 5,000. This represents a fall of 2.0 per cent since May 2015 (the latest National Statistic). The figures are estimates of the final National Statistic, to give an indication of their accuracy, over the past year the early estimates have been revised by an average of 0.3 per cent. See graph (at left) and the notes section for more information. The number of lone parents claiming Income Support has been affected by the Lone Parent Obligations policy changes which came into effect from 24 November 2008. As a result, new and repeat claimants with the following conditions were no longer entitled to Income Support: • A youngest child aged 12 or over from November 2008; • A youngest child aged 10 or over from October 2009; • A youngest child aged 7 or over from October 2010. The Welfare Reform Act 2012 introduced further changes and from May 2012 lone parents are only eligible to claim Income Support until their youngest child is five years old. The red dotted line in the chart above emphasises that the figures are estimates and official statistics. The age at which men and women reach State Pension age is gradually increasing. This will introduce a small increase to the number of working age benefit recipients and a small reduction to the number of pension age recipients.
420440460480500
Feb-14 May-14 Aug-14 Nov-14 Feb-15 May-15
ISLP Early Estimate versus National Statistic (trend in thousands)
Table 2.1: ISLP client group May 2014 to September 2015 Time Series
National Statistic
Early Estimate
Number of Claimants
(Thousands)
Number of Claimants
(Thousands) May-14 474.73 Aug-14 470.82 Nov-14 455.53 Feb-15 448.11 May-15 441.62 Jun-15 440 Jul-15 440 Aug-15 440 Sep-15 435
400
450
500
550
600
650
700
750
800
Feb-
07M
ay-0
7Au
g-07
Nov
-07
Feb-
08M
ay-0
8Au
g-08
Nov
-08
Feb-
09M
ay-0
9Au
g-09
Nov
-09
Feb-
10M
ay-1
0Au
g-10
Nov
-10
Feb-
11M
ay-1
1Au
g-11
Nov
-11
Feb-
12M
ay-1
2Au
g-12
Nov
-12
Feb-
13M
ay-1
3Au
g-13
Nov
-13
Feb-
14M
ay-1
4Au
g-14
Nov
-14
Feb-
15M
ay-1
5Au
g-15
Thousands
Early Estimate National Statistic
Early estimates suggest a continued fall in the number of people in the Income Support Lone Parent client group National Statistics to May 2015 and early estimates: June 2015 to September 2015
Lone Parent Obligations changes began in Nov 2008
17
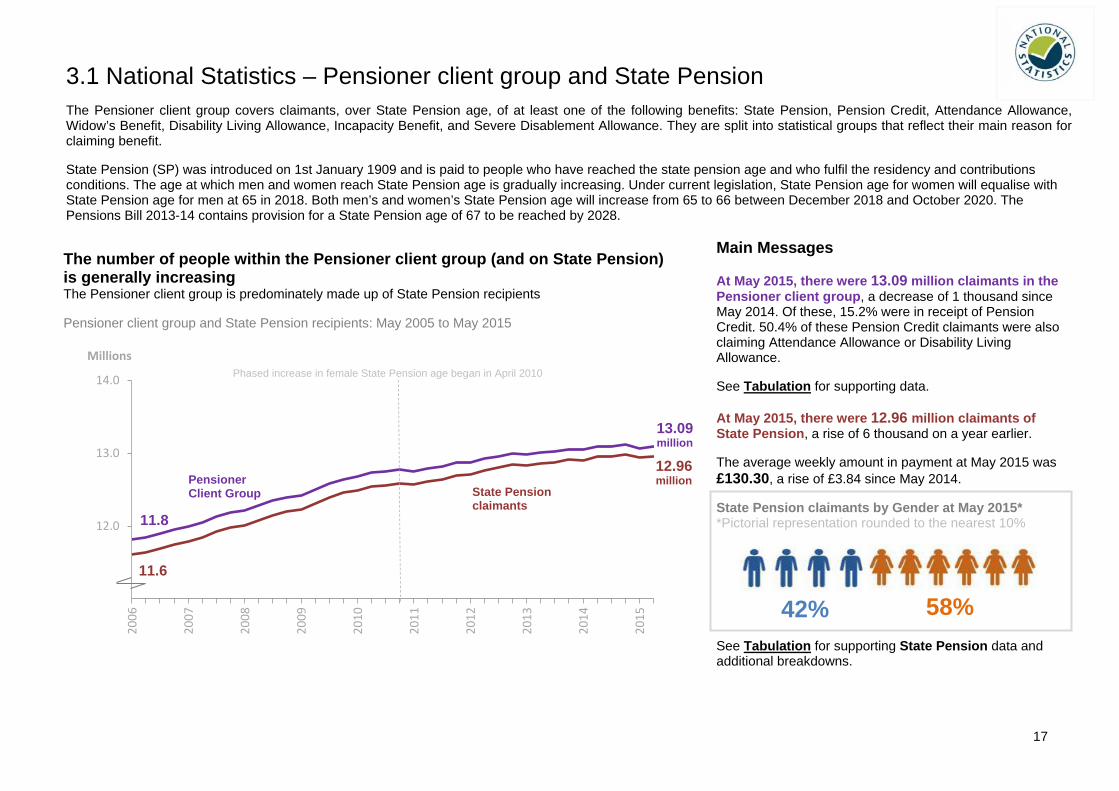
3.1 National Statistics – Pensioner client group and State Pension The Pensioner client group covers claimants, over State Pension age, of at least one of the following benefits: State Pension, Pension Credit, Attendance Allowance, Widow’s Benefit, Disability Living Allowance, Incapacity Benefit, and Severe Disablement Allowance. They are split into statistical groups that reflect their main reason for claiming benefit.
State Pension (SP) was introduced on 1st January 1909 and is paid to people who have reached the state pension age and who fulfil the residency and contributions conditions. The age at which men and women reach State Pension age is gradually increasing. Under current legislation, State Pension age for women will equalise with State Pension age for men at 65 in 2018. Both men’s and women’s State Pension age will increase from 65 to 66 between December 2018 and October 2020. The Pensions Bill 2013-14 contains provision for a State Pension age of 67 to be reached by 2028.
Main Messages At May 2015, there were 13.09 million claimants in the Pensioner client group, a decrease of 1 thousand since May 2014. Of these, 15.2% were in receipt of Pension Credit. 50.4% of these Pension Credit claimants were also claiming Attendance Allowance or Disability Living Allowance.
See Tabulation for supporting data. At May 2015, there were 12.96 million claimants of State Pension, a rise of 6 thousand on a year earlier.
The average weekly amount in payment at May 2015 was £130.30, a rise of £3.84 since May 2014.
State Pension claimants by Gender at May 2015* *Pictorial representation rounded to the nearest 10%
See Tabulation for supporting State Pension data and additional breakdowns.
11.0
12.0
13.0
14.0
2006
2007
2008
2009
2010
2011
2012
2013
2014
2015
Millions
The number of people within the Pensioner client group (and on State Pension) is generally increasing The Pensioner client group is predominately made up of State Pension recipients Pensioner client group and State Pension recipients: May 2005 to May 2015
12.96 million
11.6
13.09million
11.8
State Pension claimants
Pensioner Client Group
42%
58%
Phased increase in female State Pension age began in April 2010
18
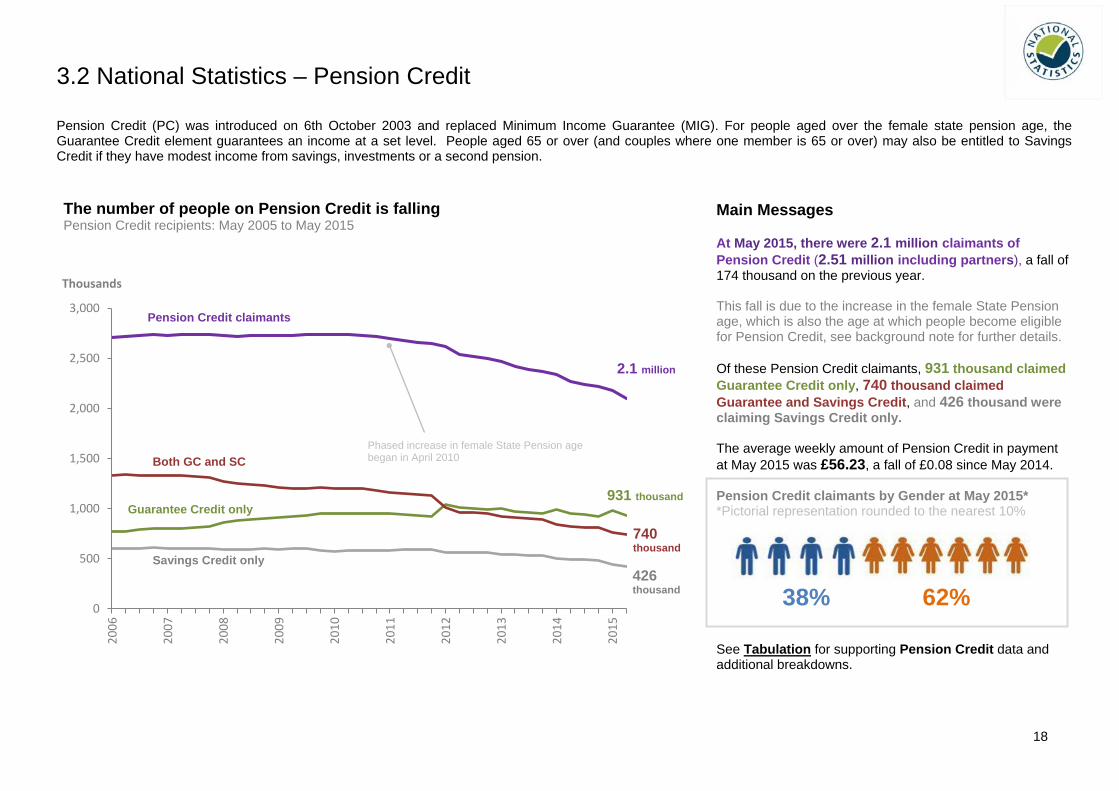
3.2 National Statistics – Pension Credit Pension Credit (PC) was introduced on 6th October 2003 and replaced Minimum Income Guarantee (MIG). For people aged over the female state pension age, the Guarantee Credit element guarantees an income at a set level. People aged 65 or over (and couples where one member is 65 or over) may also be entitled to Savings Credit if they have modest income from savings, investments or a second pension.
Main Messages At May 2015, there were 2.1 million claimants of Pension Credit (2.51 million including partners), a fall of 174 thousand on the previous year. This fall is due to the increase in the female State Pension age, which is also the age at which people become eligible for Pension Credit, see background note for further details. Of these Pension Credit claimants, 931 thousand claimed Guarantee Credit only, 740 thousand claimed Guarantee and Savings Credit, and 426 thousand were claiming Savings Credit only. The average weekly amount of Pension Credit in payment at May 2015 was £56.23, a fall of £0.08 since May 2014. Pension Credit claimants by Gender at May 2015* *Pictorial representation rounded to the nearest 10%
See Tabulation for supporting Pension Credit data and additional breakdowns.
0
500
1,000
1,500
2,000
2,500
3,000
2006
2007
2008
2009
2010
2011
2012
2013
2014
2015
Thousands
The number of people on Pension Credit is falling Pension Credit recipients: May 2005 to May 2015
2.1 million
Phased increase in female State Pension age began in April 2010
931 thousand
740 thousand
426 thousand
Guarantee Credit only
Both GC and SC
Savings Credit only
Pension Credit claimants
38%
62%
19
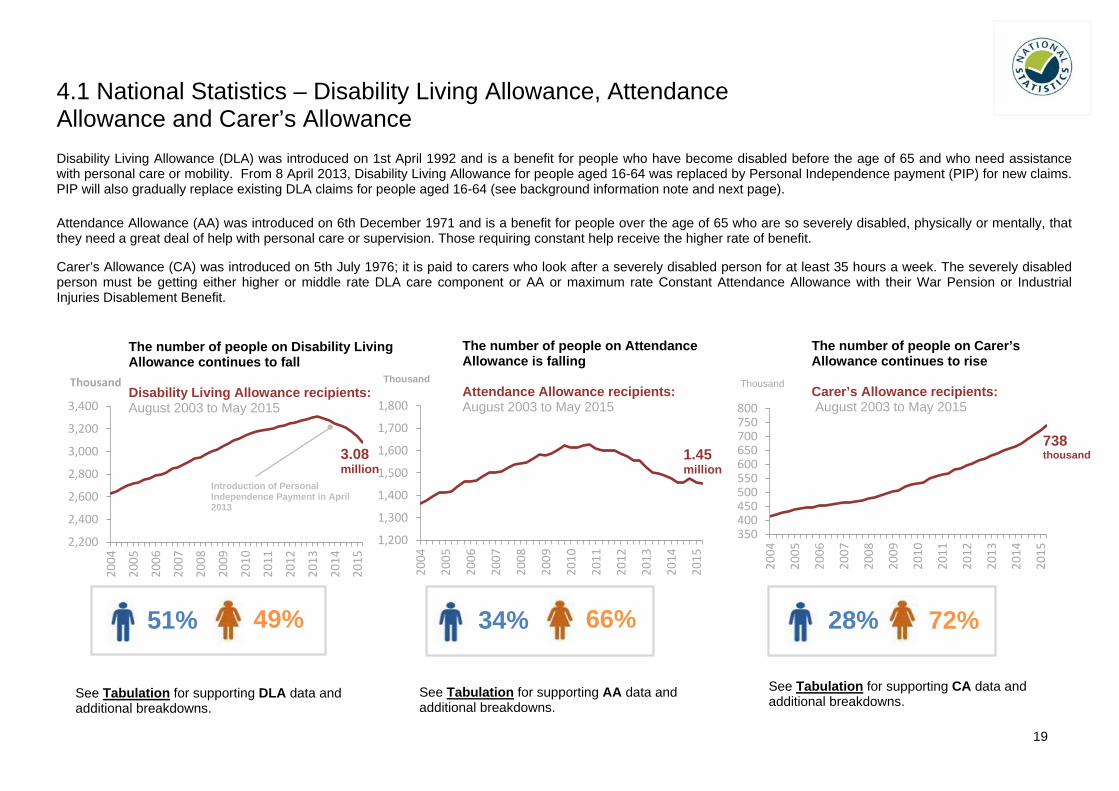
4.1 National Statistics – Disability Living Allowance, Attendance Allowance and Carer’s Allowance Disability Living Allowance (DLA) was introduced on 1st April 1992 and is a benefit for people who have become disabled before the age of 65 and who need assistance with personal care or mobility. From 8 April 2013, Disability Living Allowance for people aged 16-64 was replaced by Personal Independence payment (PIP) for new claims. PIP will also gradually replace existing DLA claims for people aged 16-64 (see background information note and next page).
Attendance Allowance (AA) was introduced on 6th December 1971 and is a benefit for people over the age of 65 who are so severely disabled, physically or mentally, that they need a great deal of help with personal care or supervision. Those requiring constant help receive the higher rate of benefit.
Carer’s Allowance (CA) was introduced on 5th July 1976; it is paid to carers who look after a severely disabled person for at least 35 hours a week. The severely disabled person must be getting either higher or middle rate DLA care component or AA or maximum rate Constant Attendance Allowance with their War Pension or Industrial Injuries Disablement Benefit.
2,200
2,400
2,600
2,800
3,000
3,200
3,400
2004
2005
2006
2007
2008
2009
2010
2011
2012
2013
2014
2015
Thousand
1,200
1,300
1,400
1,500
1,600
1,700
1,80020
04
2005
2006
2007
2008
2009
2010
2011
2012
2013
2014
2015
Thousand
350400450500550600650700750800
2004
2005
2006
2007
2008
2009
2010
2011
2012
2013
2014
2015
Thousand
3.08 million
The number of people on Attendance Allowance is falling Attendance Allowance recipients: August 2003 to May 2015
The number of people on Disability Living Allowance continues to fall Disability Living Allowance recipients: August 2003 to May 2015
The number of people on Carer’s Allowance continues to rise Carer’s Allowance recipients: August 2003 to May 2015
1.45 million
738 thousand
Introduction of Personal Independence Payment in April 2013
See Tabulation for supporting DLA data and additional breakdowns.
See Tabulation for supporting AA data and additional breakdowns.
See Tabulation for supporting CA data and additional breakdowns.
51% 49%
34% 66%
28% 72%
20
4.2 National Statistics – Disability Living Allowance, Attendance Allowance and Carer’s Allowance
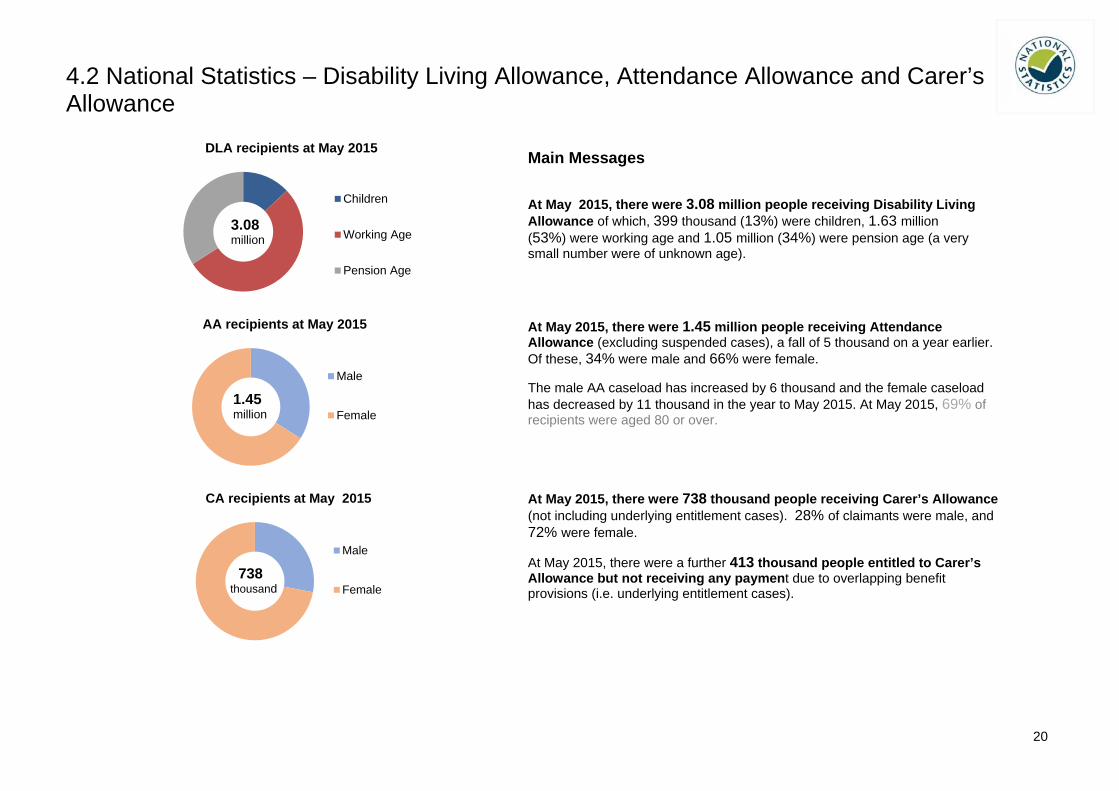
Main Messages
At May 2015, there were 3.08 million people receiving Disability Living Allowance of which, 399 thousand (13%) were children, 1.63 million (53%) were working age and 1.05 million (34%) were pension age (a very small number were of unknown age).
At May 2015, there were 1.45 million people receiving Attendance Allowance (excluding suspended cases), a fall of 5 thousand on a year earlier. Of these, 34% were male and 66% were female.
The male AA caseload has increased by 6 thousand and the female caseload has decreased by 11 thousand in the year to May 2015. At May 2015, 69% of recipients were aged 80 or over.
At May 2015, there were 738 thousand people receiving Carer’s Allowance (not including underlying entitlement cases). 28% of claimants were male, and 72% were female.
At May 2015, there were a further 413 thousand people entitled to Carer’s Allowance but not receiving any payment due to overlapping benefit provisions (i.e. underlying entitlement cases).
DLA recipients at May 2015
Children
Working Age
Pension Age
AA recipients at May 2015
Male
Female
CA recipients at May 2015
Male
Female
3.08 million
1.45 million
738 thousand
21
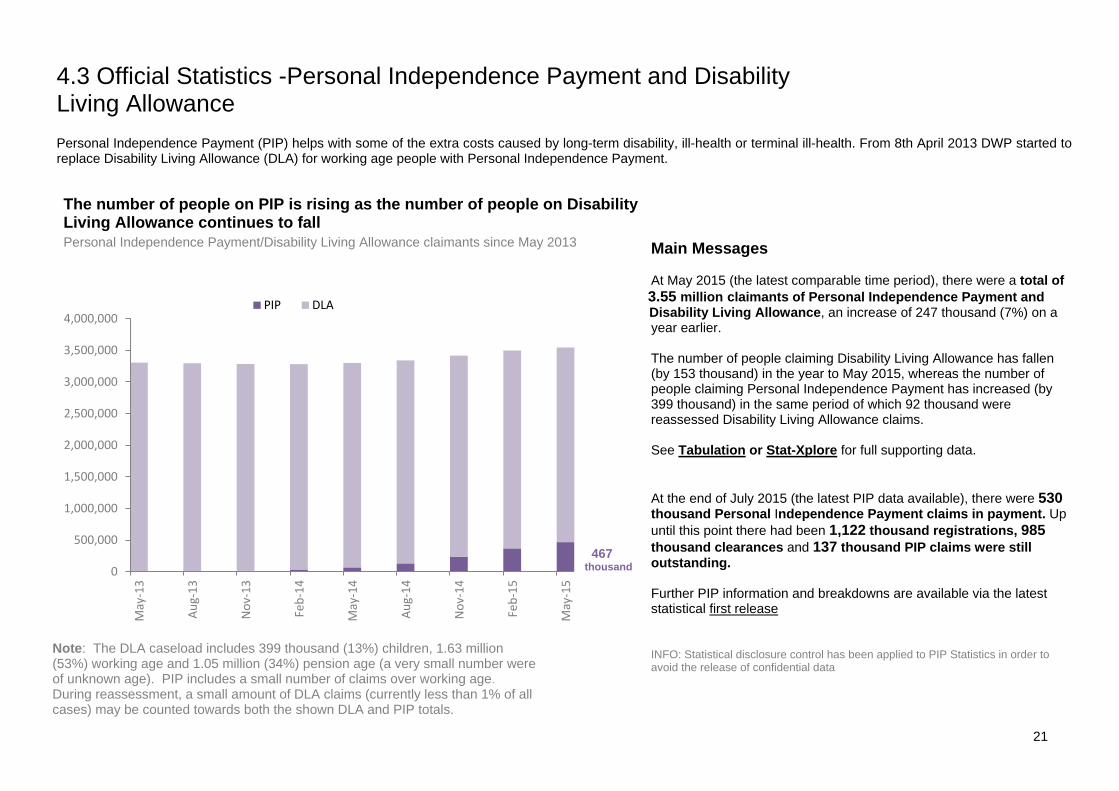
4.3 Official Statistics -Personal Independence Payment and Disability Living Allowance Personal Independence Payment (PIP) helps with some of the extra costs caused by long-term disability, ill-health or terminal ill-health. From 8th April 2013 DWP started to replace Disability Living Allowance (DLA) for working age people with Personal Independence Payment.
Main Messages
At May 2015 (the latest comparable time period), there were a total of 3.55 million claimants of Personal Independence Payment and Disability Living Allowance, an increase of 247 thousand (7%) on a year earlier.
The number of people claiming Disability Living Allowance has fallen (by 153 thousand) in the year to May 2015, whereas the number of people claiming Personal Independence Payment has increased (by 399 thousand) in the same period of which 92 thousand were reassessed Disability Living Allowance claims.
See Tabulation or Stat-Xplore for full supporting data.
At the end of July 2015 (the latest PIP data available), there were 530 thousand Personal Independence Payment claims in payment. Up until this point there had been 1,122 thousand registrations, 985 thousand clearances and 137 thousand PIP claims were still outstanding.
Further PIP information and breakdowns are available via the latest statistical first release
INFO: Statistical disclosure control has been applied to PIP Statistics in order to avoid the release of confidential data
0
500,000
1,000,000
1,500,000
2,000,000
2,500,000
3,000,000
3,500,000
4,000,000
May
-13
Aug-
13
Nov
-13
Feb-
14
May
-14
Aug-
14
Nov
-14
Feb-
15
May
-15
PIP DLA
Note: The DLA caseload includes 399 thousand (13%) children, 1.63 million (53%) working age and 1.05 million (34%) pension age (a very small number were of unknown age). PIP includes a small number of claims over working age. During reassessment, a small amount of DLA claims (currently less than 1% of all cases) may be counted towards both the shown DLA and PIP totals.
467 thousand
The number of people on PIP is rising as the number of people on Disability Living Allowance continues to fall
Personal Independence Payment/Disability Living Allowance claimants since May 2013
22
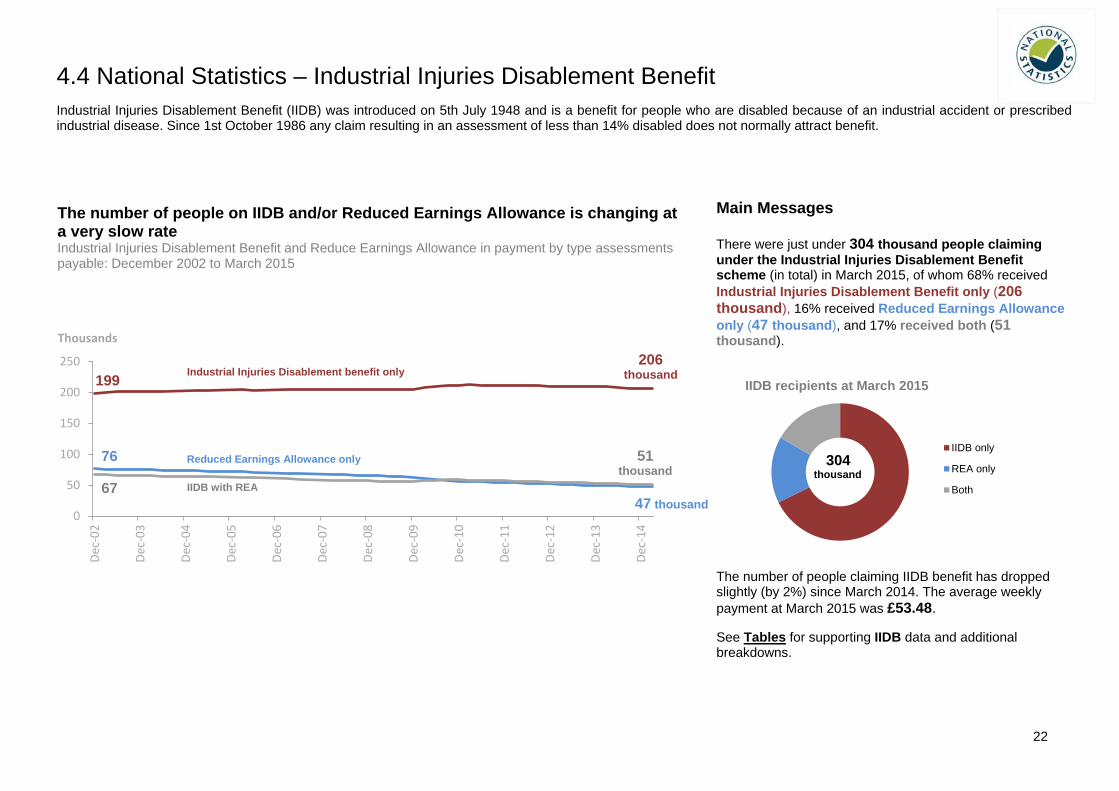
4.4 National Statistics – Industrial Injuries Disablement Benefit Industrial Injuries Disablement Benefit (IIDB) was introduced on 5th July 1948 and is a benefit for people who are disabled because of an industrial accident or prescribed industrial disease. Since 1st October 1986 any claim resulting in an assessment of less than 14% disabled does not normally attract benefit.
Main Messages There were just under 304 thousand people claiming under the Industrial Injuries Disablement Benefit scheme (in total) in March 2015, of whom 68% received Industrial Injuries Disablement Benefit only (206 thousand), 16% received Reduced Earnings Allowance only (47 thousand), and 17% received both (51 thousand).
The number of people claiming IIDB benefit has dropped slightly (by 2%) since March 2014. The average weekly payment at March 2015 was £53.48.
See Tables for supporting IIDB data and additional breakdowns.
0
50
100
150
200
250
Dec-
02
Dec-
03
Dec-
04
Dec-
05
Dec-
06
Dec-
07
Dec-
08
Dec-
09
Dec-
10
Dec-
11
Dec-
12
Dec-
13
Dec-
14
Thousands
IIDB recipients at March 2015
IIDB only
REA only
Both
The number of people on IIDB and/or Reduced Earnings Allowance is changing at a very slow rate Industrial Injuries Disablement Benefit and Reduce Earnings Allowance in payment by type assessments payable: December 2002 to March 2015
206 thousand
47 thousand
51 thousand
199
67
76
Industrial Injuries Disablement benefit only
Reduced Earnings Allowance only
IIDB with REA
304 thousand
23
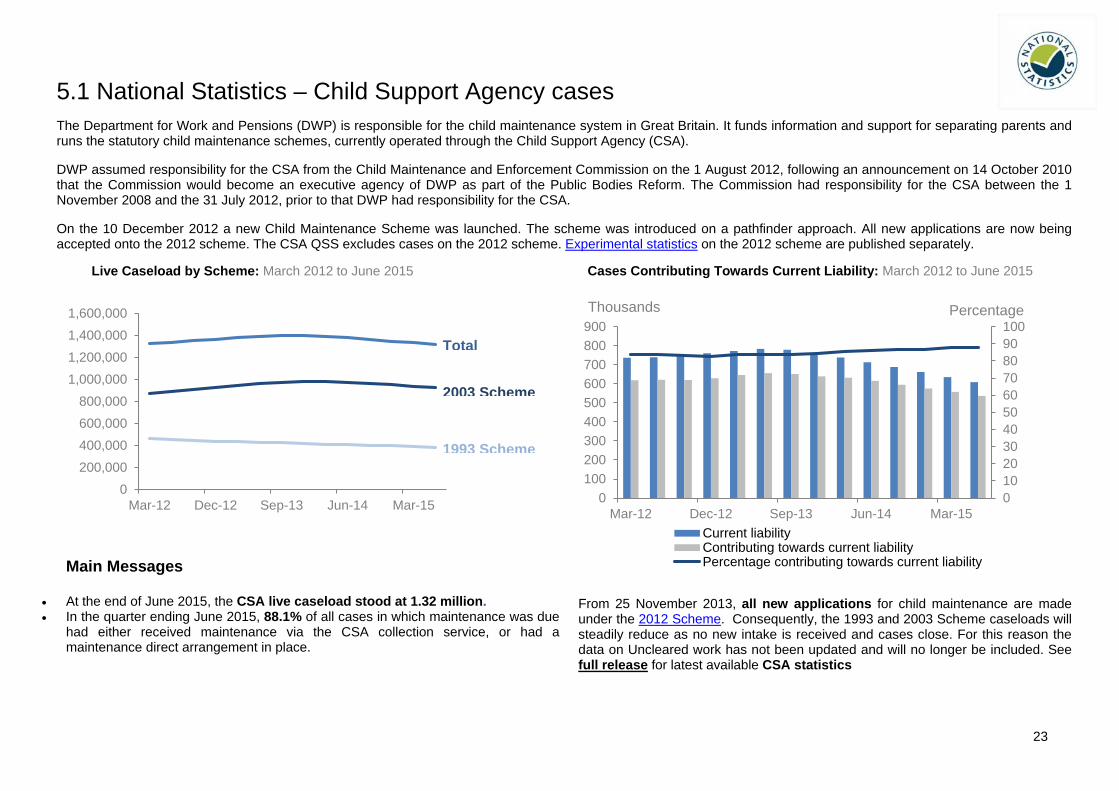
5.1 National Statistics – Child Support Agency cases The Department for Work and Pensions (DWP) is responsible for the child maintenance system in Great Britain. It funds information and support for separating parents and runs the statutory child maintenance schemes, currently operated through the Child Support Agency (CSA).
DWP assumed responsibility for the CSA from the Child Maintenance and Enforcement Commission on the 1 August 2012, following an announcement on 14 October 2010 that the Commission would become an executive agency of DWP as part of the Public Bodies Reform. The Commission had responsibility for the CSA between the 1 November 2008 and the 31 July 2012, prior to that DWP had responsibility for the CSA.
On the 10 December 2012 a new Child Maintenance Scheme was launched. The scheme was introduced on a pathfinder approach. All new applications are now being accepted onto the 2012 scheme. The CSA QSS excludes cases on the 2012 scheme. Experimental statistics on the 2012 scheme are published separately.
Main Messages
• At the end of June 2015, the CSA live caseload stood at 1.32 million. • In the quarter ending June 2015, 88.1% of all cases in which maintenance was due
had either received maintenance via the CSA collection service, or had a maintenance direct arrangement in place.
From 25 November 2013, all new applications for child maintenance are made under the 2012 Scheme. Consequently, the 1993 and 2003 Scheme caseloads will steadily reduce as no new intake is received and cases close. For this reason the data on Uncleared work has not been updated and will no longer be included. See full release for latest available CSA statistics
0200,000400,000600,000800,000
1,000,0001,200,0001,400,0001,600,000
Mar-12 Dec-12 Sep-13 Jun-14 Mar-15 0102030405060708090100
0100200300400500600700800900
Mar-12 Dec-12 Sep-13 Jun-14 Mar-15Current liabilityContributing towards current liabilityPercentage contributing towards current liability
Thousands Percentage
2003 Scheme
1993 Scheme
Total
Live Caseload by Scheme: March 2012 to June 2015 Cases Contributing Towards Current Liability: March 2012 to June 2015
24
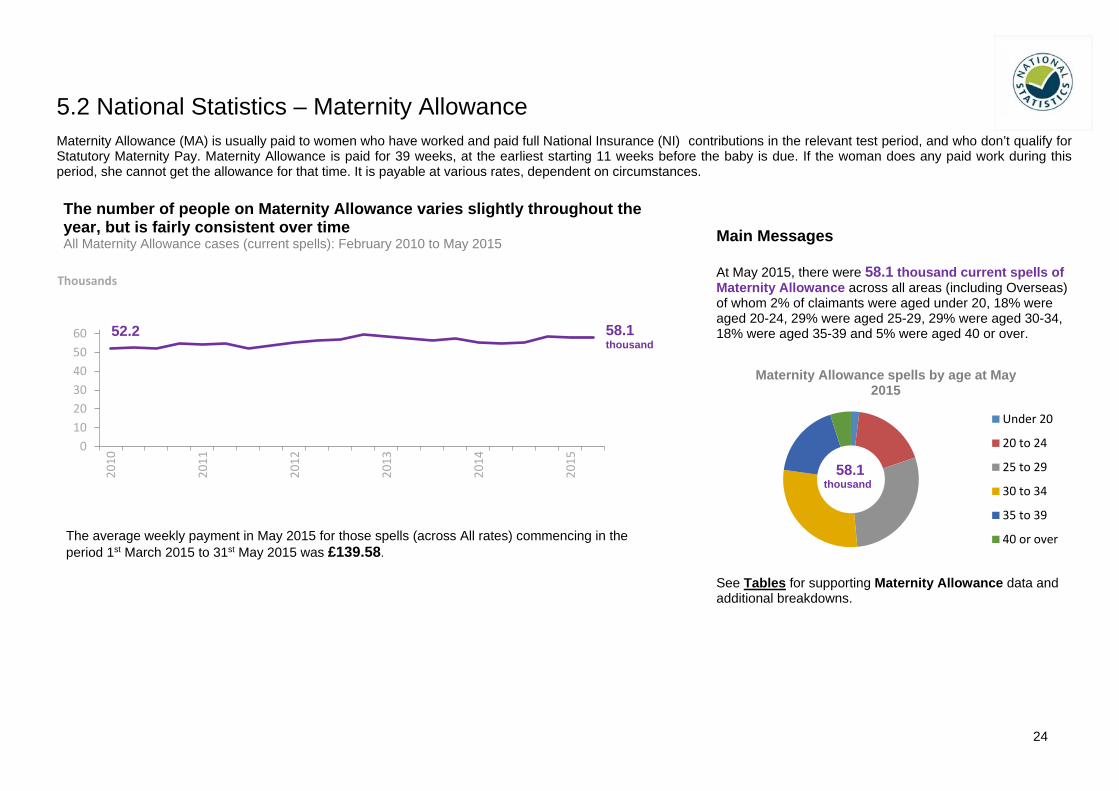
5.2 National Statistics – Maternity Allowance Maternity Allowance (MA) is usually paid to women who have worked and paid full National Insurance (NI) contributions in the relevant test period, and who don’t qualify for Statutory Maternity Pay. Maternity Allowance is paid for 39 weeks, at the earliest starting 11 weeks before the baby is due. If the woman does any paid work during this period, she cannot get the allowance for that time. It is payable at various rates, dependent on circumstances.
The average weekly payment in May 2015 for those spells (across All rates) commencing in the period 1st March 2015 to 31st May 2015 was £139.58.
Main Messages At May 2015, there were 58.1 thousand current spells of Maternity Allowance across all areas (including Overseas) of whom 2% of claimants were aged under 20, 18% were aged 20-24, 29% were aged 25-29, 29% were aged 30-34, 18% were aged 35-39 and 5% were aged 40 or over.
See Tables for supporting Maternity Allowance data and additional breakdowns.
0102030405060
2010
2011
2012
2013
2014
2015
Thousands
Maternity Allowance spells by age at May 2015
Under 20
20 to 24
25 to 29
30 to 34
35 to 39
40 or over
The number of people on Maternity Allowance varies slightly throughout the year, but is fairly consistent over time All Maternity Allowance cases (current spells): February 2010 to May 2015
58.1 thousand
52.2
58.1 thousand
25
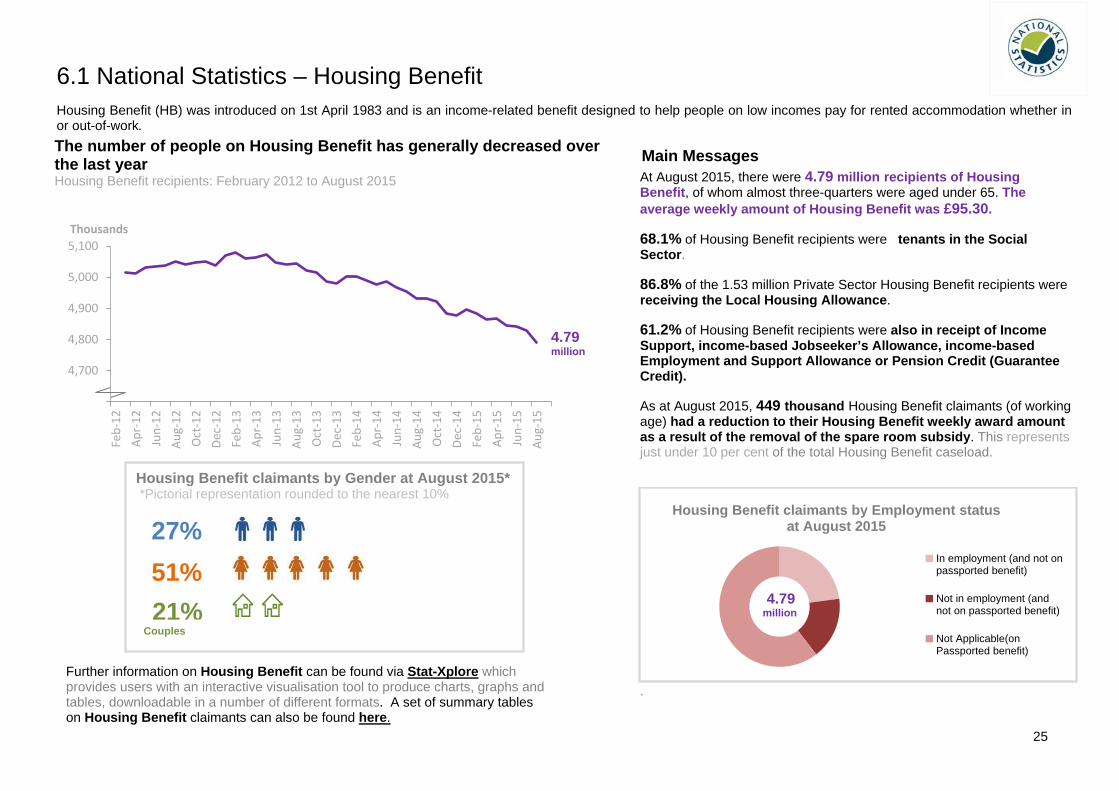
6.1 National Statistics – Housing Benefit Housing Benefit (HB) was introduced on 1st April 1983 and is an income-related benefit designed to help people on low incomes pay for rented accommodation whether in or out-of-work.
Housing Benefit claimants by Gender at August 2015* *Pictorial representation rounded to the nearest 10%
Further information on Housing Benefit can be found via Stat-Xplore which provides users with an interactive visualisation tool to produce charts, graphs and tables, downloadable in a number of different formats. A set of summary tables on Housing Benefit claimants can also be found here.
Main Messages
At August 2015, there were 4.79 million recipients of Housing Benefit, of whom almost three-quarters were aged under 65. The average weekly amount of Housing Benefit was £95.30.
68.1% of Housing Benefit recipients were tenants in the Social Sector.
86.8% of the 1.53 million Private Sector Housing Benefit recipients were receiving the Local Housing Allowance.
61.2% of Housing Benefit recipients were also in receipt of Income Support, income-based Jobseeker’s Allowance, income-based Employment and Support Allowance or Pension Credit (Guarantee Credit).
As at August 2015, 449 thousand Housing Benefit claimants (of working age) had a reduction to their Housing Benefit weekly award amount as a result of the removal of the spare room subsidy. This represents just under 10 per cent of the total Housing Benefit caseload.
.
4,600
4,700
4,800
4,900
5,000
5,100
Feb-
12Ap
r-12
Jun-
12Au
g-12
Oct
-12
Dec-
12Fe
b-13
Apr-
13Ju
n-13
Aug-
13O
ct-1
3De
c-13
Feb-
14Ap
r-14
Jun-
14Au
g-14
Oct
-14
Dec-
14Fe
b-15
Apr-
15Ju
n-15
Aug-
15
Thousands
Housing Benefit claimants by Employment status at August 2015
In employment (and not onpassported benefit)
Not in employment (andnot on passported benefit)
Not Applicable(onPassported benefit)
The number of people on Housing Benefit has generally decreased over the last year Housing Benefit recipients: February 2012 to August 2015
4.79 million
27% 51% 21%
Couples
4.79 million
26
Known Issues, Changes and Revisions Due to unforeseen technical problems the Flows Tabulation Tool , due for release on 11th November, has been delayed and is not included in this release. The technical issue has now been resolved and DWP statisticians are confident that the Flows Tabulation Tool will be released by the end of November 2015.
Further presentational changes have been made to the release.
Notes DWP Benefits Statistics Our Uses and users, Methodology, Quality and Background information notes provide further information on DWP National and official benefit statistics, including some of the processes involved in developing and releasing these statistics: https://www.gov.uk/government/statistics/dwp-statistical-summary-policies-and-statements
Other National and Official Statistics Details of other National and Official Statistics produced by the Department for Work and Pensions can be found on the DWP website via the following link:
• A schedule of statistical releases over the next 12 months and a list of the most recent releases: https://www.gov.uk/government/organisations/department-for-work-pensions/about/statistics
Feedback DWP would like to hear your views on our statistical publications. If you use any of our statistics publications, we would be interested in hearing what you use them for and how well they meet your requirements. Please email DWP at [email protected]. An ongoing questionnaire, enabling DWP to target future consultations at interested users; shaping the future direction of statistics development to address user needs; and helping ensure value for money, whilst giving users a structured way of expressing their views is available at: https://www.gov.uk/government/uploads/system/uploads/attachment_data/file/205190/statistical_summary_questionnaire.doc Completed questionnaires can be returned by e-mail to [email protected] or by post to the following address: Dissemination Team Data and Analytics Department for Work and Pensions Room BP5201,Benton Park Road Longbenton, NEWCASTLE UPON TYNE NE98 1YX Users can also join the “Welfare and Benefit Statistics” community at: http://www.statsusernet.org.uk DWP announces items of interest to users via this forum, as well as replying to users’ questions.


![Welcome [nbcghanatrust.com] · 2020. 6. 11. · Negotiated Benefits Trust Company Limited – Leader in People Benefits in Africa 1 Welcome The Quarterly newsletter to the Stakeholders](https://img.dokumen.tips/doc/110x75/60d0aeacdd0e4d46e4362ab3/welcome-2020-6-11-negotiated-benefits-trust-company-limited-a-leader.jpg)