Embed Size (px)
Citation preview
Volume 1, Issue 2, July 2018 : 65 - 81
65
Quantitative Series: Factors Analysis Effect of Government
Regulation Number 46 the Year 2013 …
|
Quantitative Series: Factors Analysis Effects of
Government Regulation Number 46 the Year 2013 For
SME’s by Justice, Convenience, and Simplicity of Tax
Aspects
1Aditya Halim Perdana Kusuma Putra, 2Aan Aswari, 3Muhammad Ya’arif Arifin,
4Rina 1STIM Lasharan Jaya, 2,3Universitas Muslim Indonesia, 4STIM-LPI
email: [email protected]
ABSTRACT
In 2013 the business circle was struck by the new tax rules, namely Government
Regulations PP No. 46, 2013 on taxation regulations among UKM (SME’s) / Small Medium
Enterprises but the strong allegations issued PP 46 of 2013 is because the potential tax
revenue from the sector of UKM has not been explored to the fullest. By the required by
the taxpayer related PP. No. 46 of 2013 uses several variables, namely taxes, taxes, taxes
and tax benefits. The object of this research is the perpetrators of UKM (SMEs) in Makassar
City who do 40 people using quantitative analysis and quantitative analysis. The result of
this research indicates that the perception of justice tax has a significant effect as well as
the most dominant variable affecting taxpayer compliance, taxability perception has a
significant adverse impact on taxpayer compliance, tax perception simplicity has no
significant impact, taxpayer's judgment is not valid in testing. The overall coefficient of
determination contributes 26.5%.
Keywords: tax justice, convenience of tax, simplicity of tax, tax benefit, taxpayer
compliance
INTRODUCTION
In 2013 the business circle was struck by the new tax rules, namely Government
Regulation no. 46, 2013 on taxation laws among SMEs1.The new tax regulation is claimed
to facilitate tax payments by taxpayers in Indonesia, especially the primary target of this
Government Regulation is among SMEs (Small and Medium Enterprises)2. In some
socialisations by the Directorate General of Taxation, illustrations are often given that this
regulation should be more acceptable to SMEs because previously taxpayers are charged
25% of net profit with a static calculation with a profit margin of 7%. The above illustration
certainly looks correct but provided that the net profit margin is 7%. But what happens when
the SME business has a profit margin of only 2%, so this makes a lot of start-up companies
1 www.Minghadi.Com (2013) Pro Kontra (Peraturan Pemerintah) PP 46 Tahun 2013 | Sharing Ideas, Webpage . 2 ibid

Volume 1, Issue 2, July 2018 : 65 - 81
66
Quantitative Series: Factors Analysis Effect of Government
Regulation Number 46 the Year 2013 …
|
to be worried3 . Because it has become common knowledge, the start-up has a reasonably
long payback rate. If we simplify, most start-ups have to go through a period of loss for
several years until they can make a profit.
Government Regulation no 46 of 2013 is driven more by the spirit to facilitate the
Director General of Taxes in enforcing tax rules, especially for taxpayers who avoid
obligations4. Tax as an obligation to surrender a portion of wealth to the State treasury due
to a circumstance, event, and act which gives a specific position, but not a punishment,
according to the rules established by the government and may be imposed, but there is no
reciprocal service from the state directly, to foster general welfare 5. In (UU. No. 17 Tahun
2000) explain that Tax is a compulsory contribution to a State which is owned by an
individual or a coercive body under the Act, without obtaining direct remuneration and used
for the State for the highest possible prosperity of the people. Other than that6. Taxpayer
segmentation classified as tax subjects in PP 46 is very large, so it can provide
opportunities for the community to contribute in the implementation of the state, as well as
foster voluntary compliance in paying taxes7. Taxpayer compliance is a condition in which
the taxpayer fulfil all tax obligations and exercises his taxation rights 8. But on the other
hand, PP no 46, in 2013 has a less precise spirit, especially regarding "fairness" where the
amount of tax is determined in stages by the income of the taxpayer concerned9. There are
two tax functions, namely budgetary function (state financial resources) and regulated
functions. Type of Taxpayer compliance by10 is a formal Compliance is a situation where
the taxpayer fulfills the obligation formally in accordance with the provisions of the tax law
and material compliance is a condition where the taxpayer substantively / essentially
perform all the requirements of taxation material that is in accordance with the content
and.can also include formal agreement. For example, the time limit for the submission of
Income Tax Form (SPT-PPh)
3 ibid 4 www.Pajak.Go.Id (2013) Pengukuhan Pengusaha Kena Pajak, Direktorat Jenderal Pajak, www.Pajak.Go.Id. 5 Waluyo (2014) ‘Perpajakan Indonesia’, In Perpajakan Indonesia Edisi 11 Buku 1, p. 496. 6 UU. No. 17 Tahun 2000 (2000) ‘Undang Undang No. 17 Tahun 2000 Tentang: Pajak’, Sekretariat Negara. Jakarta. 7 www.Pajak.Go.Id (2013) Penyederhanaan Aturan Pajak Dalam Peraturan Pemerintah Nomor 46 Tahun 2013 | Direktorat Jenderal Pajak, Webpage Official Goverment. 8 Herryanto, M. And Toly, A. A. (2013) ‘Pengaruh Kesadaran Wajib Pajak, Kegiatan Sosialisasi Perpajakan, Dan Pemeriksaan Pajak Terhadap Penerimaan Pajak Penghasilan Di Kpp Pratama Surabaya Sawahan’,
Tax And Accounting Review, 1(1), pp. 125–133. 9 www.Minghadi.Com (2013) Pro Kontra (Peraturan Pemerintah) Pp 46 Tahun 2013 | Sharing Ideas, webpage . 10 Yenni Mangoting (2000) ‘Menyongsong Tax Reform 2001: Khusus Pajak Penghasilan’, Jurnal Akuntansi
Dan Keuangan, 2(2), pp. 116–126

Volume 1, Issue 2, July 2018 : 65 - 81
67
Quantitative Series: Factors Analysis Effect of Government
Regulation Number 46 the Year 2013 …
|
The plan to make the SME’s as the focus or target of taxation has been heard since
mid-201111. At that time data sources showed that MSME accounts for 61 per cent of Gross
Domestic Product, but its contribution to total tax revenue is only 5 per cent. Therefore
strong allegations that the issuance of PP 46 of 2013 is because the potential of tax
revenues from the sector of UMKM has not been maximally explored12.
Judging from the concept of fairness in the taxation (equity principle), the
imposition of Final Income Tax is not by justice because it does not reflect the ability to pay
(ability to pay). Fair taxation is that the higher the income, the higher the taxes to be paid.
This is called vertical equity or vertical equity13. In PP 46 of 2013 is also an adverse effect
(disincentive) for growth start-up in Indonesia. The main reason is that many start-up
innovations are "realtor services," such as re-sellers such as Bukalapak, Tokopedia,
Lazada which mostly connect only sellers and buyers14. Where if calculated in turn can be
seen as huge income, but with a small margin15,16. The enactment of Government
Regulation No. 46 of 2013 which requires entrepreneurs, including SME’s, to be subject to
a tax of one per cent (0,5%) of total gross/gross income of each income. But in fact, until
the end of 2017, the implementation of this policy was far from the fire because of up to
last year from about 59 million perpetrators of SME’s in Indonesia, who pay taxes only
397,000 SME’s actors17.
In 2017, the Fiscal Policy Office (BKF) of the Ministry of Finance revealed that the
review of changes in the calculation of Income Tax Rate (PPh) in the form of final tax rate
or not, is still being discussed together with the Directorate General of Taxation (DGT),
especially regarding the implementation of Government Regulation No. 46 year 201318 in
(Majalah UKM, 2014). Therefore, the occurrence of a lot of polemic in the midst of business
actors, then Finance Minister Sri Mulyani proposed a revision related to PP. No. 46 the
year 2013. A review of the Government Regulation by reducing the amount of tax payment
from 1% to 0.5% 19. And now the regulation was applied from 1% to 0,5% at Juli 2018. It
aims not to burden business actors and create a win-win solution and the principle of
"Fairness" by the government and also for the business actors themselves. Further in this
background, for the simplicity of tax in PP. No. 46 the year 2013 as intended, the imposition
11 Economy.Okezone.Com (2013) Pajak Umkm, Sederhana Tapi Tidak Adil, Online Newspaper. 12 ibid 13 Ruston Tambunan (2013) Pajak Umkm, Sederhana Tapi Tidak Adil, Online Newspaper. 14 William Henley (2018) Keadilan Dan Pajak Pedagang Di Medsos, Webpage Newspaper. 15 www.Minghadi.Com (2013) Pro Kontra (Peraturan Pemerintah) PP 46 Tahun 2013 | Sharing Ideas, Webpage . 16 Majalah Ukm (2014) PP No.46 Tahun 2013 Tidak Adil Dan Tidak Pro Pengusaha Kecil, 17 ibid 18 CNN Indonesia.com (2017) Pemerintah Masih Godok Perubahan Tarif Pph Final. 19 Www.Metrotvnews.Com (2018) Turunkan Tarif Pph Umkm, Sri Mulyani Usulkan Revisi Peraturan
Pemerintah No. 46 Tahun 2013, Online Newspaper.

Volume 1, Issue 2, July 2018 : 65 - 81
68
Quantitative Series: Factors Analysis Effect of Government
Regulation Number 46 the Year 2013 …
|
of the tax rate shall apply only to its turnover value of not more than IDR. 4.8 billion in one
year, meaning that if the taxpayer has a turnover of more than IDR. 4.8 billion in one year,
it shall be subject to the tax base by general provisions of Income Tax. The simplicity of
the tax is that in completing the charge, payment can be done at the Bank or post office or
using the e-billing system. For the simplicity of charge in the form of tax reporting, the
taxpayer may report by himself no later than 20 days before the tax period expires, or the
taxpayer is deemed to have published his tax based on the date of validation of his tax
deposit. Therefore, this study led to the collecting of several previous research results that
empirically stated that the understanding of PP. No. 46 the year 2013 has a positive and
significant effect on taxpayer compliance in their tax reporting, as some researchers
say20,21,22,23,24 states that the perception of the simplicity of tax affects the satisfaction and
compliance of taxpayers, states that the knowledge of tax utilization affect taxpayer
satisfaction and respect25, Novandini and Hasana indicates that the judgment of tax
utilization change taxpayer satisfaction and compliance, says that the perception of
convenience affect taxpayer satisfaction and respect26. in the results of his study states
that the tax justice has a significant effect on taxpayer compliance .
Objectively in this study is to test the dominant factor on implementation rather than
Government Regulation no. 46 the year 2013 on taxpayer compliance of SME actors from
the aspects of tax justice, ease of tax reporting, and simplicity in tax reporting.
METHOD
This study used a sample of 40 SMEs in Makassar City selected randomly from 15
districts27. Methods of data collection using questionnaires with scale measurement using
Likert scale (1 = strongly disagree / STS, 2 = disagree / TS, 3 = less agree / KS, 4 = Agree
20 Yasa (2015) ‘Analisis Penerapan Peraturan Pemerintah No. 46 Terhadap Kepatuhan Wajib Pajak Pada Kantor Pelayanan Pajak Pratama Denpasar Timur’, Jurnal Bisnis Dan Kewirausahaan, 11(1), pp. 70–80 21 Vina Rosella, K. (2015) ‘Pengaruhpersepsi Atas Ppnomor 46 Tahun2013 Terhadap Kepatuhanwajib Pajak’, Jurnal Ilmu & Riset Akuntansi, 4(9) 22 Imaniati, Z. Z. (2016) ‘Pengaruh Persepsi Wajib Pajak Tentang Penerapan PP No.46 Tahun 2013, Pemahaman Perpajakan, Dan Sanksi Perpajakan Terhadap Kepatuhan Wajib Pajak Usaha Mikro, Kecil, Dan Menengah Di Kota Yogyakarta’, Jurnal Nominal, V(46). 23 Carvallo, A. B. (2016) Pengaruh Penerapan Pp No. 46 Tahun 2013 Terhadap Tingkat Kepatuhan Wajib
Pajak Badan Umkm (Studi Kasus Pada Kpp Pratama Bandung Cibeunying), Fakultas Ekonomi Universitas
Widyatama. 24 Desintiani, L. (2017) ‘Pengaruh Persepsi Keadilan Perpajakan, Kemudahan Perpajakan, Dan Kesederhanaan Perhitungan Pajak Terkait Pp No. 46 Tahun 2013 Terhadap Kepatuhan Wajib Pajak Pelaku Umkm (Survei Pada Wajib Pajak Di Kpp Pratama Jakarta Palmerah) 25 Hasana, J. (2017) ‘Persepsi Kemudahan Dan Kebermanfaatan Atas Penggunaan E-Filing Terhadap Kepatuhan Wajib Pajak Melalui Penggunaan E-Filing Sebagai Variabel Intervening’. Fe Umy 26 Vina Rosella, K. (2015) ‘Pengaruhpersepsi Atas Ppnomor 46 Tahun2013 Terhadap Kepatuhanwajib Pajak’, Jurnal Ilmu & Riset Akuntansi, 4(9) 27 Putra, A. H. P. K., Said, S. And Hasan, S. (2017) ‘Implication Of External And Internal Factors Of Mall Consumers In Indonesia To Impulsive Buying Behavior’, International Journal Of Business Accounting And
Management Issn, 2(4), pp. 1–10.

Volume 1, Issue 2, July 2018 : 65 - 81
69
Quantitative Series: Factors Analysis Effect of Government
Regulation Number 46 the Year 2013 …
|
/ S and 5 = strongly agree / SS)28.The analysis method using Explanatory factor analysis
(EFA) with SPSS ver.24 analysis tool. The stages in quantitative testing in this study are
through several stages29 as follows:
1. Bivariate Correlation
2. Partial Correlation
3. KMO Test (Kaiser Meyer Olkin)
4. MSA Test (Measure Sampling Adequacy)
5. Normality Test
ANALYSIS AND DISCUSSION a. Distribution of Frequency
A total of 40 respondents of SMEs sampled in this study consisted of several
categories of business types composed of 4 types of business of clothes/clothes, consisting
of 6 kinds of fashion category, one business group engaged in the production of ready-to-
eat seasonings, and 1 for the type category of souvenirs. While involved in the type of
business batik and equipment consists of 5 SMEs, 9 SMEs involved in the food business
and 3 SMEs engaged in the kind of catering business, a group of companies involved in
printing and 6 SMEs been been involved in handicrafts/handicraft. Further data on data of
SME respondents will be described more detailed again based on the distribution table of
respondents gender and age level of respondents. The distribution of respondents by sex
and age as below.
Table 1. Frequency Distribution by Sex
Gender Frequency (Person) Percentage (%)
Male 19 47,5
Female 21 52,5 Total 40 100
Can be seen in table 4 above, that of 40 respondents, men as many as 19 people (47.5%)
while women as many as 21 people (52.5%). So it can be concluded that the dominant
respondents are from among women.
Table 2. Frequency Distribution by Age
Age Frequency (Person) Percentage (%)
18 – 25 Year 10 25
28 Aditya HPK Putra (2016) ‘Fans Vs Music Beneficiary At Music Industry In Indonesia In Seeing Through The Aspect Approach Of Marketing Mix’, In Dileep Kumar, M., P.. (Ed.) 5th International Conference On Research Method In Management And Social Sciences. Makassar: 5th International Conference On Research Method In Management And Social Sciences (Icrmms-2016), pp. 104–112 29 Aditya, H. P. (2012) ‘Analisis Pengaruh Harga, Data Demografi, Promosi Terhadap Kecenderungan Pembelian Impulsif Dan Pengaruhnya Terhadap Budaya Konsumerisme Relatif Pada Konsumen Kfc Kota Makassar’. Tesis.

Volume 1, Issue 2, July 2018 : 65 - 81
70
Quantitative Series: Factors Analysis Effect of Government
Regulation Number 46 the Year 2013 …
|
26 – 33 Year 11 27,5
34 – 41 Year 9 22,5
42 – 49 Year 4 10
Up to 50 Year 6 15 Total 40 100
It can be seen in table 5 above, that the age range of respondents who entered in
the interval class 18 - 25 Years as many as 10 people (25%), intervals 26-33 Years as
many as 11 people (27.5), 34 - 41 Years as many as 9 people (22, 5%), 42 - 49 Years as
many as 4 people (10%) and age 50 years and over as many as 6 people (15%). The result
of the translation of the frequency distribution table based on this age can be concluded
that the dominant respondents are at the age interval of 18 - 33 years.
Perception Indicators of Tax Justice (X1)
Table 2. Taxpayer's Perception Item
Code Item Frequency (person and %)
SS % S % KS % TS % STS %
X1.1 General justice 20 50 17 42.5 3 7.5 0 0 0 0
X1.2 Tax Tariff Structure 7 17.5 19 47.5 12 30 2 5 0 0
For table 2. It can be seen that the variation of questionnaire distribution for X1.1 items
dominantly centred on the answer Strongly Agree that as many as 20 people (50%), while
for item X1.2 focused on the answer agree that as many as 19 people (47.5%).
Indicators of tax perception (X2)
Table 3. Consumer Expenditure Item
Code Item Frequency (person and %)
SS % S % KS % TS % STS %
X2.1 Tax Calculation 12 30 19 47.5 7 17.5 2 5 0 0
X2.2 Tax Deposit 15 37.5 22 55 3 7.5 0 0 0 0
X2.3 Tax Reporting 10 25 22 55 6 15 2 5 0 0
X2.4 Making of SKB 12 30 23 57.5 4 10 1 2.5 0 0
Can be seen in table 3 for the perception of ease of taxation with item X2.1 answer centred
on the scale strongly agree that 19 people (47.5%), for piece X2.2 response centred on the
accepted level, i.e. 22 people (55%), for item X2. Three answers focused on the agreed
scale of 22 people (55%), and for the item, X2.4, i.e. 23 people (57.5%) centred on the
level of the answer agreed
Perception Indicator Simplicity of tax (X3)

Volume 1, Issue 2, July 2018 : 65 - 81
71
Quantitative Series: Factors Analysis Effect of Government
Regulation Number 46 the Year 2013 …
|
Table 4. Simple Tax Perception Item
Code Item Frequency (person and %)
SS % S % KS % TS % STS %
X3.1 Calculation 12 30 18 45 10 25 0 0 0 0
X3.2 Deposit 9 22.5 19 47.5 11 27.5 1 2.5 0 0
X3.3 Reporting 19 47.5 19 47.5 2 5 0 0 0 0
X3.4 Rectification of SPT 10 25 22 55 8 20 0 0 0 0
In table 4. It can be seen that the answer variation for item X3.1 centered on the agreed
answer scale i.e. 18 people (45%) although the answer less agree as many as 10 people
(25%) and who strongly agree 12 people (30%), while for the X3.2 answer item centered
on accepting 19 people (47.5%) and most of them also answered in less favorable
answers, ie as many as 11 people (27.5%). For the X3.3 item, the dominant response
centred on the agreed and strongly agreed that 19 people (47.5%) in each category and
for the article X3.4 dominant respondents answered on the accepted scale, i.e. 22 people
(55%).
Perception of Tax Benefit (X4)
Table 5. Taxpayer's Perception Item
Code Item Frequency (person and %)
SS % S % KS % TS % STS %
X4.1 Budgetair Benefits 29 72.5 10 25 1 2.5 0 0 0 0
X4.2 Regulend Benefits 21 52.5 16 40 2 5 1 2.5 0 0
X4.3 Stability Benefits 13 32.5 23 57.5 4 10 0 0 0 0
X4.4 Retribution Benefits 23 57.5 16 40 1 2.5 0 0 0 0
For table 5. The items of tax benefit perception, item X4.1 question centered on the answer
scale strongly agree as many as 29 people (72.5%), item X4.2 on the answer scale strongly
agree that 21 people (52.5%), X4.3 items as much as 23 people (57.5%) answered on the
accepted level, and item X4.4 on the answer scale strongly agree that 23 people (57.5%).
Taxpayer Compliance Indicators (Y)
Table 6. Taxpayer Compliance Item
Code Item Frequency (Person and %)
SS % S % KS % TS % STS %
Y1 Formal Compliance 13 32.5 25 62.5 2 5 0 0 0 0
Y2 Physic Compliance 22 55 17 42.5 1 2.5 0 0 0 0
For the dominant Y1 item the respondent answered on the agreed answer scale, i.e. 25
people (62.5%), and the Y2 object of respondents responded predominantly on a very
agree to scale, i.e. 22 people (55%).

Volume 1, Issue 2, July 2018 : 65 - 81
72
Quantitative Series: Factors Analysis Effect of Government
Regulation Number 46 the Year 2013 …
|
b. Validity Test
To see the correlation value can be known through the amount of Pearson
correlation. The amount of correlation test between variables is as follows:
Table 7. Validity Test
Item Person Correlation Significant Level Result
X1.1 0.663 0.000 Valid
X1.2 0.677 0.000 Valid
X2.1 0.522 0.000 Valid
X2.2 0.388 0.000 Valid
X2.3 0.623 0.000 Valid
X2.4 0.740 0.000 Valid
X3.1 0.350 0.027 Valid
X3.2 0.510 0.001 Valid
X3.4 0.597 0.000 Valid
X4.1 0.564 0.000 Valid
X4.2 0.778 0.000 Valid
X4.3 0.425 0.006 Valid
X4.4 0.494 0.001 Valid
Y1 0.578 0.000 Valid
Y2 0.743 0.000 Valid Mean of Validity Test 0.576
From the table above It can be seen that the items X1.1 and X1.2 in forming tax perception
justice variable is highly correlated that is 0.663 (X1.1) and 0.677 (X1.2) the two items of
the compilers variable perception of justice tax (X1) 0.00 <0.05). For X2.1 items correlate
normally in forming ease variable equal to 0.522 and stated significant (0.001 <0.05). Item
X2.3 correlated high with value 0.623 and also significant (0.00 <0.05), similarly item X2.4
correlated high with correlation value 0.740 and significant (0.00 <0.05). Item X2.2 has
enough correlation of 0.388 but its correlation is significant (0.013 <0.05). For X3.1 the
items correlated sufficiently with the tax simplicity variables of 0.350 and stated significant
(0.027 <0.05), Item X3.2 correlated to normal at 0.510 and significant (0.001 <0.05), item
X3.4 also correlated to normal with 0.597 and significant (0.00 <0.05). For X4.1 items
correlated normally with values of 0.564 and significant (0.00 <0.05), X4.2 items are highly
correlated with values of 0.778 and significant (0.00 <0.05), X4.3 items are normally
correlated with correlation values of 0.425 and significant (0.006 <0.005), item X4.4 is
normal correlated with a value of 0.494 and significant (0.001 <0.05). For Y1 items the
correlation is normal with the correlation value of 0.578 and significant (0.00 <0.05), the Y2
item is highly correlated with the correlation value of 0.743 and significant (0.00 <0.05).
c. Reliability Test
Reliability value can be seen based on Cronbach alpha value pursued above> 0.5.
The data reliability test is as follows:
Volume 1, Issue 2, July 2018 : 65 - 81
73
Quantitative Series: Factors Analysis Effect of Government
Regulation Number 46 the Year 2013 …
|
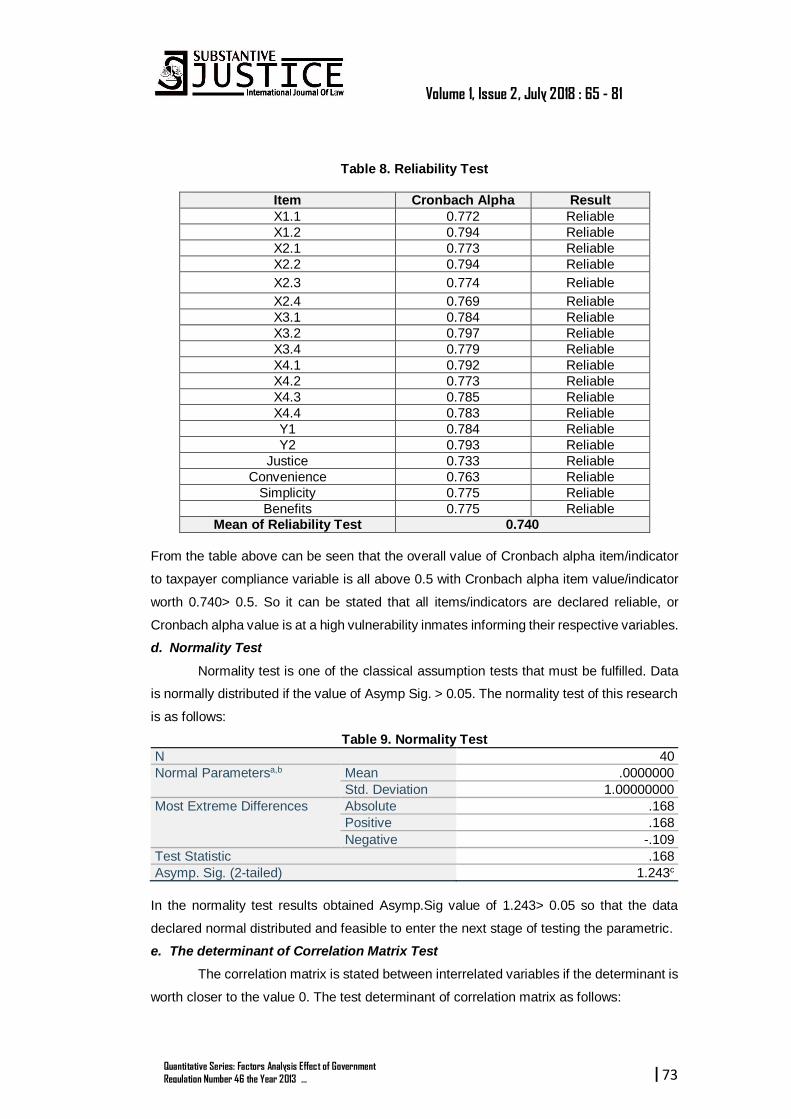
Table 8. Reliability Test
Item Cronbach Alpha Result
X1.1 0.772 Reliable
X1.2 0.794 Reliable
X2.1 0.773 Reliable
X2.2 0.794 Reliable
X2.3 0.774 Reliable
X2.4 0.769 Reliable
X3.1 0.784 Reliable
X3.2 0.797 Reliable
X3.4 0.779 Reliable
X4.1 0.792 Reliable
X4.2 0.773 Reliable
X4.3 0.785 Reliable
X4.4 0.783 Reliable
Y1 0.784 Reliable
Y2 0.793 Reliable
Justice 0.733 Reliable
Convenience 0.763 Reliable
Simplicity 0.775 Reliable
Benefits 0.775 Reliable Mean of Reliability Test 0.740
From the table above can be seen that the overall value of Cronbach alpha item/indicator
to taxpayer compliance variable is all above 0.5 with Cronbach alpha item value/indicator
worth 0.740> 0.5. So it can be stated that all items/indicators are declared reliable, or
Cronbach alpha value is at a high vulnerability inmates informing their respective variables.
d. Normality Test
Normality test is one of the classical assumption tests that must be fulfilled. Data
is normally distributed if the value of Asymp Sig. > 0.05. The normality test of this research
is as follows:
Table 9. Normality Test
N 40
Normal Parametersa,b Mean .0000000
Std. Deviation 1.00000000
Most Extreme Differences Absolute .168
Positive .168
Negative -.109
Test Statistic .168
Asymp. Sig. (2-tailed) 1.243c
In the normality test results obtained Asymp.Sig value of 1.243> 0.05 so that the data
declared normal distributed and feasible to enter the next stage of testing the parametric.
e. The determinant of Correlation Matrix Test
The correlation matrix is stated between interrelated variables if the determinant is
worth closer to the value 0. The test determinant of correlation matrix as follows:
Volume 1, Issue 2, July 2018 : 65 - 81
74
Quantitative Series: Factors Analysis Effect of Government
Regulation Number 46 the Year 2013 …
|
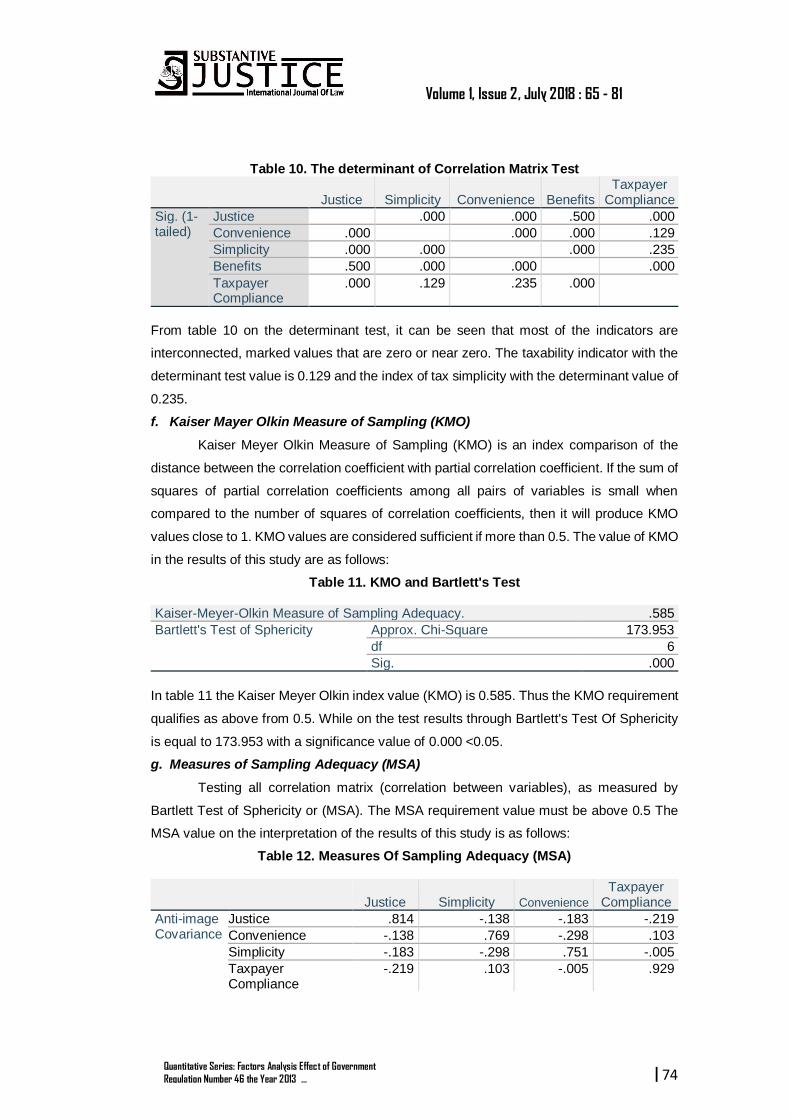
Table 10. The determinant of Correlation Matrix Test
Justice Simplicity Convenience Benefits Taxpayer
Compliance
Sig. (1-tailed)
Justice .000 .000 .500 .000
Convenience .000 .000 .000 .129
Simplicity .000 .000 .000 .235
Benefits .500 .000 .000 .000
Taxpayer Compliance
.000 .129 .235 .000
From table 10 on the determinant test, it can be seen that most of the indicators are
interconnected, marked values that are zero or near zero. The taxability indicator with the
determinant test value is 0.129 and the index of tax simplicity with the determinant value of
0.235.
f. Kaiser Mayer Olkin Measure of Sampling (KMO)
Kaiser Meyer Olkin Measure of Sampling (KMO) is an index comparison of the
distance between the correlation coefficient with partial correlation coefficient. If the sum of
squares of partial correlation coefficients among all pairs of variables is small when
compared to the number of squares of correlation coefficients, then it will produce KMO
values close to 1. KMO values are considered sufficient if more than 0.5. The value of KMO
in the results of this study are as follows:
Table 11. KMO and Bartlett's Test
Kaiser-Meyer-Olkin Measure of Sampling Adequacy. .585
Bartlett's Test of Sphericity Approx. Chi-Square 173.953
df 6
Sig. .000
In table 11 the Kaiser Meyer Olkin index value (KMO) is 0.585. Thus the KMO requirement
qualifies as above from 0.5. While on the test results through Bartlett's Test Of Sphericity
is equal to 173.953 with a significance value of 0.000 <0.05.
g. Measures of Sampling Adequacy (MSA)
Testing all correlation matrix (correlation between variables), as measured by
Bartlett Test of Sphericity or (MSA). The MSA requirement value must be above 0.5 The
MSA value on the interpretation of the results of this study is as follows:
Table 12. Measures Of Sampling Adequacy (MSA)
Justice Simplicity Convenience Taxpayer
Compliance
Anti-image Covariance
Justice .814 -.138 -.183 -.219
Convenience -.138 .769 -.298 .103
Simplicity -.183 -.298 .751 -.005
Taxpayer Compliance
-.219 .103 -.005 .929

Volume 1, Issue 2, July 2018 : 65 - 81
75
Quantitative Series: Factors Analysis Effect of Government
Regulation Number 46 the Year 2013 …
|
Anti-image Correlation
Justice .619a -.174 -.234 -.252
Convenience -.174 .585a -.392 .122
Simplicity -.234 -.392 .601a -.006
Taxpayer Compliance
-.252 .122 -.006 .632a
In table 12 in column anti-image correlation can be interpreted as follows:
1. Indicator of tax fairness (X1) value of MSA = 0.619> 0.5. This means that the tax-
only indicator has qualified for MSA
2. Taxability indicator (X2) value of MSA = 0.585> 0.5. This means the tax-ease
indicator has qualified MSA
3. The indicator of tax simplicity (X3) is the value of MSA = 0.601> 0.5. This means
the tax-ease indicator has qualified MSA
4. The tax benefit indicator (X4) does not qualify for MSA, so it is not feasible and
removed from the test variables.
5. Tax compliance indicator (Y) the value of MSA = 0.632> 0.5. This means the tax
compliance indicator meets the MSA requirements.
h. Resume of Factor Analysis (Communalities)
Communalities show the number of the variance in each variable to be taken into
account. Commonalities are the relative variance in each variable taken into account by all
components or factors. For primary component extraction, this is always equal to 1.0 for
correlation analysis. Communalities extraction is the relative variance in each variable that
is taken into account by the component. The value of Communalities on factor analysis of
this study is as follows:
Table 13. Commonalities
Initial Extraction
Justice 1.000 .631
Convenience 1.000 .696
Simplicity 1.000 .667
Taxpayer Compliance 1.000 .843
From Table 19 above it can be concluded that the perception of tax justice can explain the
value of factor at equal to 0.631 or 63.1%, the opinion of taxability can demonstrate the
importance of variance extraction factor of 0.696 or 69.9%, the perception of simplicity of
the tax with the value of variance factor of 0.667 or 66.7% tax can explain the importance
of variance factor of 0843 or 84.3%. While the perception of tax benefits is removed from
the test because it does not qualify MSA.

Volume 1, Issue 2, July 2018 : 65 - 81
76
Quantitative Series: Factors Analysis Effect of Government
Regulation Number 46 the Year 2013 …
|
i. Factors That Can Be Formed (Total Variance Explained)
Table 14. Total Varian Explained
Component Initial Eigenvalues
Total % of Variance Cumulative % Total
1 1.728 43.193 43.193 1.728
2 1.109 27.727 70.920 1.109
3 .622 15.540 86.460
4 .542 13.540 100.000
All percentage values of variance are above 1 (Initial Eigenvalues> 1) these four indicators
when summed can explain the variable of 100%.
j. Loading Factors
The loading factor value shows how much a variable correlates with the factor to
be established. The loading factor value on statistical test result is as follows:
Table 19. Rotated Component Matrix
Component
1 2
Convenience .828 -.098
Simplicity .812 .094
Taxpayer Compliance -.116 .911
Justice .542 .581
Table 19 above shows that in component 1, the taxability perception of the correlation value
is 0.828> 0.5, the perception of the simplicity of the correlation value tax is 0.812> 0.5.
While taxpayer compliance is in component 2 with a correlation value of 0.911 and the
perception of tax justice is also in component 2 with a correlation value of 0.581. So it can
be concluded the member of each factor is:
Factor 1 = X2 and X3
Factor 2 = X1 and Y
The benefit variable is not visible and is not counted in this test because the variable
is declared invalid in the previous MSA test.
k. Hypothesis Test
At this stage is in addition to factor analysis is also to determine whether the factors
that have been tested and has a correlation as a construct factor whether significant or not,
as well as to test the hypothesis. Here is the hypothesis test:
Table 20. Hypothesis Test
Model Unstandardized Coefficients
Standardized Coefficients
t Sig. B Std. Error Beta
1 (Constant) 4.083 .292 13.982 .000
Justice .225 .043 .269 5.178 .000

Volume 1, Issue 2, July 2018 : 65 - 81
77
Quantitative Series: Factors Analysis Effect of Government
Regulation Number 46 the Year 2013 …
|
Convenience -.114 .047 -.134 -2.438 .015
Simplicity .009 .076 .007 .117 .907
In table 20 of the hypothesis test as a follow-up test rather than factor analysis can be
expressed some test results as follows:
1. Perception of Tax Justice (X1) has a positive effect on taxpayer compliance (Y)
with a β coefficient value of 0.225 and significant (sig 0.000 <0.05).
2. Perception of Convenience of Tax (X2) hurts taxpayer compliance (Y) with a β
coefficient value of -0.114 and significant (sig 0.015 <0.05).
3. Perceptions of Simplicity of Tax (X3) has no significant effect on taxpayer
compliance (Y). (sig 0.907> 0.05).
The regression equation is as follows:
Taxpayer Compliance = 4.083 + 0.225 + (-0.114) + 0.009
The results of statistical tests show that:
1. The perception of fairness of taxes have a positive and significant impact on tax
compliance so it can be stated that (H0 = received, H1 = rejected)
2. The perception of taxability has a negative and significant effect on tax compliance,
so it is stated that (H0 = received, H1 = rejected)
3. The perception of the simplicity of the tax does not significantly affect taxpayer
compliance so it can be stated that (H0 = rejected, H1 = accepted)
4. Perceptions of benefits declared invalid on testing MSA, so it is concluded that the
perception of tax benefits do not have a significant effect (H0 = rejected, H1 =
accepted).
5. Perception of tax justice which is the most dominant dimension affect the
compliance of taxpayers while the perception of benefits expressed invalid effect
on taxpayer compliance. So it is stated that (H0 = rejected, H1 = received).
l. The coefficient of Determinant Test (R2)
The coefficient of determination is the test result to see how much influence of the
test variable to the dependent variable. The value of determination coefficient on the results
of statistical tests are as follows:
Table 21. Coefficient of Determinant
Model R R Square Adjusted R Square
Std. The error of the
Estimate
1 .515a .265 .263 .41613
In the test results, determination coefficient obtained the R2 value of 0.265 which means
that the perception of taxability, perceptions of tax justice, and the opinion of the simplicity

Volume 1, Issue 2, July 2018 : 65 - 81
78
Quantitative Series: Factors Analysis Effect of Government
Regulation Number 46 the Year 2013 …
|
of taxes contribute to taxpayer compliance is 26.5% while the remaining 73.5% taxpayer
compliance is influenced by other factors.
CONCLUSION 1. Tax fairness has a positive and significant impact on tax compliance
Based on the results of statistical tests stated that Persepi fairness of taxes has a
positive and significant effect on tax compliance. Fees are the most crucial factor for state
finances in ensuring the sustainability of national development without being dependent on
natural resources and foreign aid. Paying taxes is one of the obligations of citizens as
regulated in Article 23A of the 1945 Constitution. In the results of data analysis test found
that the respondents declared the application of PP tax no. 46 the year 2013, i.e. a fee of
1% of their total turnover is fair and appropriate. On the way PP. No. 46 the Year 2013 is
a mandatory assessment for the government to the SMEs business, the principle of tax
justice perceived by these respondents is also a reason why the SMEs are obedient to the
PP. No. 46 such. Taxation expressed by a statement that every citizen should participate
in government financing, to the extent possible proportionately according to his or her
ability, by comparing the income he receives with the protection he enjoys from the state.
The principle of justice in the laws of taxation legislation and the case of its implementation
must be held firmly, even if the truth is very relative.
For tax collection not to cause any obstacles or resistance, the tax collection must
meet the following requirements: (1) Tax collection must be fair (Terms of Justice). (2) Tax
collection shall be by law (Juridical Terms). (3) Does not disturb the economy (Economic
Terms). (4) Tax collection should be efficient (Terms of Financial). (5) The tax collection
system should be simple. It should be understood that the tax compliance of SMEs players
still needs to be improved again, some of which can be the cause are the first, the
perpetrators of SMEs are dominated by domestic business actors. In a fair tax system,
every taxpayer must pay tax in line with the benefits he enjoys from the government. This
approach is called the revenue and expenditure approach. In terms of raising awareness
and compliance with tax obligations, corporate and personal taxpayers also hope that the
government's efforts in optimizing the potential of taxation based on social justice The
concept of tax justice must also was applied to business people, especially those who run
their business based on e-commerce so as an effort to administer justice to all taxpayers,
tax levies in e-commerce are a must. Respondents' perceptions of fairness of PP tax
application. No. 46 the Year 2013 is also the most dominant variable affecting taxpayer
compliance because the tax justice is perceived would be useful as a feedback for the
SMEs themselves.

Volume 1, Issue 2, July 2018 : 65 - 81
79
Quantitative Series: Factors Analysis Effect of Government
Regulation Number 46 the Year 2013 …
|
2. The convenience of tax has a significant adverse effect on tax compliance
The results of statistical tests state that the perception of taxability are having a
significant impact on taxpayer compliance, but the effect is adverse or indirect. Provision
of tax is mandatory as a citizen as stipulated in the Act, meaning that even though tax
facilities have been adequate and made tax payments assessed easier but regarding the
application of tax system PP. No. 46 the Year 2013, the perception of taxability is
significant, but it does not affect indirectly.
Tax administration needs to be simplified to provide convenience and will be able
to influence taxpayer compliance. The simplification of tax administration is applied by
stipulating Government Regulation Number 46 the Year 2013. It is shown by the
consideration was taken that it is necessary to give a treatment of the provisions concerning
tax administration in the case of depositing and reporting the income tax payable.
Taxpayers no longer need to submit SPT Period but with a condition to keep doing the
calculation and the correct deposit.
3. The simplicity of taxes has no significant effect on tax compliance
The result of research stated that the perception of simplicity of charge does not
have a substantial impact on taxpayer compliance so it can be noted that the research
hypothesis is rejected. This indicates that the taxpayer of PPh UMKM after the
implementation of the government regulation number 46 the year 2013 has not been aware
of its tax obligation and suggested that the government's goal is to issue PP. No. The
purpose of this program is to improve the understanding and awareness of SMEs on the
achievement of their objectives. Rights of taxation obligations, then the socialization or
extension of taxation and socialization of PP. 46 the year 2013 to increase the willingness
of the UMKM Tax Payers in fulfilling their obligations.
Based on the observation in the field about the obstacles of the enactment of
Government Regulation no. 46 indicates that there are many obstacles to the
implementation of Government Regulation no. 46 namely the lack of taxpayer's
understanding of the procedure of charging, calculation and on Government Regulation
no. 46 itself. The number of obstacles felt by the taxpayer to be inconsistent with the
purpose of the enactment of Government Regulation no. 46 namely: Convenience for the
community in implementing tax obligations; Increase knowledge about tax benefits for the
community; The creation of social control conditions in fulfilling the tax obligations. These
constraints make PP 46 the year 2013 turns into complex complexity because it is
inconvenient to taxpayers and burden Taxpayers because the taxpayer must reproduce
his own SKB and pay with CNS sheet, thereby decreasing the value of compliance.
Volume 1, Issue 2, July 2018 : 65 - 81
80
Quantitative Series: Factors Analysis Effect of Government
Regulation Number 46 the Year 2013 …
|
4. Tax benefits have no significant effect on tax compliance
Benefit perception is not valid on MSA testing, so it is deleted in the further test,
and it is concluded that the judgment of tax benefit has no significant effect. While in
hypothesis 5 which states that the knowledge of tax benefits is the most dominant variable
effect is not substantial results. Perceptions of tax justice which is the most dominant
dimension affect taxpayer compliance.
REFERENCE
Aditya, H. P. (2012) ‘Analisis Pengaruh Harga, Data Demografi, Promosi Terhadap
Kecenderungan Pembelian Impulsif Dan Pengaruhnya Terhadap Budaya
Konsumerisme Relatif Pada Konsumen Kfc Kota Makassar’. Tesis.
Aditya HPK Putra (2016) ‘Fans Vs Music Beneficiary At Music Industry In Indonesia In Seeing
Through The Aspect Approach Of Marketing Mix’, In Dileep Kumar, M., P.. (Ed.) 5th
International Conference On Research Method In Management And Social Sciences.
Makassar: 5th International Conference On Research Method In Management And
Social Sciences (Icrmms-2016), pp. 104–112.
Carvallo, A. B. (2016) Pengaruh Penerapan Pp No. 46 Tahun 2013 Terhadap Tingkat
Kepatuhan Wajib Pajak Badan Umkm (Studi Kasus Pada Kpp Pratama Bandung
Cibeunying), Fakultas Ekonomi Universitas Widyatama.
CNN Indonesia.Com (2017) Pemerintah Masih Godok Perubahan Tarif Pph Final.
Desintiani, L. (2017) ‘Pengaruh Persepsi Keadilan Perpajakan, Kemudahan Perpajakan, Dan
Kesederhanaan Perhitungan Pajak Terkait Pp No. 46 Tahun 2013 Terhadap Kepatuhan
Wajib Pajak Pelaku Umkm (Survei Pada Wajib Pajak Di Kpp Pratama Jakarta
Palmerah)’.
Economy.Okezone.Com (2013) Pajak Umkm, Sederhana Tapi Tidak Adil, Online Newspaper.
Hasana, J. (2017) ‘Persepsi Kemudahan Dan Kebermanfaatan Atas Penggunaan E-Filing
Terhadap Kepatuhan Wajib Pajak Melalui Penggunaan E-Filing Sebagai Variabel
Intervening’. Fe Umy.
Herryanto, M. And Toly, A. A. (2013) ‘Pengaruh Kesadaran Wajib Pajak, Kegiatan Sosialisasi
Perpajakan, Dan Pemeriksaan Pajak Terhadap Penerimaan Pajak Penghasilan Di Kpp
Pratama Surabaya Sawahan’, Tax And Accounting Review, 1(1), pp. 125–133.
Imaniati, Z. Z. (2016) ‘Pengaruh Persepsi Wajib Pajak Tentang Penerapan PP No.46 Tahun
Volume 1, Issue 2, July 2018 : 65 - 81
81
Quantitative Series: Factors Analysis Effect of Government
Regulation Number 46 the Year 2013 …
|
2013, Pemahaman Perpajakan, Dan Sanksi Perpajakan Terhadap Kepatuhan Wajib
Pajak Usaha Mikro, Kecil, Dan Menengah Di Kota Yogyakarta’, Jurnal Nominal, V(46).
Majalah Ukm (2014) Pp No.46 Tahun 2013 Tidak Adil Dan Tidak Pro Pengusaha Kecil.
Noviandini, N. C. (2012) ‘Pengaruh Persepsi Kebermanfaatan, Persepsi Kemudahan
Penggunaan, Dan Kepuasan Wajib Pajak Terhadap Penggunaan E-Filling Bagi Wajib
Pajak Di Yogyakarta’, Jurnal Nominal, 1(1).
Putra, A. H. P. K., Said, S. And Hasan, S. (2017) ‘Implication Of External And Internal Factors
Of Mall Consumers In Indonesia To Impulsive Buying Behavior’, International Journal Of
Business Accounting And Management Issn, 2(4), pp. 1–10.
Ruston Tambunan (2013) Pajak Umkm, Sederhana Tapi Tidak Adil, Online Newspaper.
UU. No. 17 Tahun 2000 (2000) ‘Undang Undang No. 17 Tahun 2000 Tentang: Pajak’,
Sekretariat Negara. Jakarta.
Vina Rosella, K. (2015) ‘Pengaruhpersepsi Atas Ppnomor 46 Tahun2013 Terhadap
Kepatuhanwajib Pajak’, Jurnal Ilmu & Riset Akuntansi, 4(9).
Waluyo (2014) ‘Perpajakan Indonesia’, In Perpajakan Indonesia Edisi 11 Buku 1, p. 496.
William Henley (2018) Keadilan Dan Pajak Pedagang Di Medsos, Webpage Newspaper.
Www.Metrotvnews.Com (2018) Turunkan Tarif Pph Umkm, Sri Mulyani Usulkan Revisi
Peraturan Pemerintah No. 46 Tahun 2013, Online Newspaper.
Www.Minghadi.Com (2013) Pro Kontra (Peraturan Pemerintah) PP 46 Tahun 2013 | Sharing
Ideas, Webpage .
Www.Pajak.Go.Id (2013a) Pengukuhan Pengusaha Kena Pajak | Direktorat Jenderal Pajak,
www.Pajak.Go.Id.
Www.Pajak.Go.Id (2013b) Penyederhanaan Aturan Pajak Dalam Peraturan Pemerintah Nomor
46 Tahun 2013 | Direktorat Jenderal Pajak, Webpage Official Goverment.
Yasa (2015) ‘Analisis Penerapan Peraturan Pemerintah No. 46 Terhadap Kepatuhan Wajib
Pajak Pada Kantor Pelayanan Pajak Pratama Denpasar Timur’, Jurnal Bisnis Dan
Kewirausahaan, 11(1), pp. 70–80.
Yenni Mangoting (2000) ‘Menyongsong Tax Reform 2001: Khusus Pajak Penghasilan’, Jurnal
Akuntansi Dan Keuangan, 2(2), pp. 116–126.