Embed Size (px)
Citation preview

1
Quantitative Passive Diffusion-Adsorptive Sampling Techniques for Vapor Intrusion Assessment
Todd McAlary1, Hester Groenevelt1, Tadeusz Górecki2, Suresh Seethapathy2, Paolo Sacco3, Derrick Crump4, Brian Schumacher5, John Nocerino5, Michael Tuday6, Heidi Hayes7, Paul Johnson8; 1Geosyntec Consultants, 2University of Waterloo, 3Fondazione Salvatore Maugeri, 4Cranfield University, 5U.S. Environmental Protection Agency, 6Columbia Analytical Services, 7Air Toxics Ltd., 8Arizona State University
INTRODUCTION This paper describes interim results of research conducted to demonstrate quantitative passive diffusive sampling and analysis for volatile organic compounds (VOCs) in air and soil gas specifically for use in assessing subsurface vapor migration to indoor air (vapor intrusion). The objectives of the program are to identify whether and under what conditions passive diffusive samplers provide good quality quantitative measurement of VOC vapor concentrations and to document the study findings so that regulatory agencies have strong scientific support for accepting less-expensive alternatives to conventional monitoring methods where applicable. Four different passive samplers are being compared under both controlled laboratory conditions and field conditions with conventional active sampling and analysis as the benchmark for comparison. The four passive samplers (see Figure 1) are:
• passive automated thermal desorption (ATD) tubes (a.k.a. Perkin Elmer Tubes); • Radiello™ samplers; • SKC Ultra II™ badge samplers; and • Waterloo Membrane Samplers™.
Figure 1: Four Quantitative Passive Diffusive Samplers Evaluated
2
The passive samplers have several potential advantages over conventional active samplers, including simplicity, ability to measure longer-term time-weighted average concentrations, smaller size for ease of shipping and handling, lower cost, and a few additional advantages that are unique to one or the other sampler. To date, each of the four candidate passive technologies has been tested for some VOCs under certain conditions1,2,3,4,5,6,7,8,9,10; however, the four technologies have not been rigorously compared to each other, and additional method development is required to assess the application to monitoring of soil vapor concentrations.
Background
Currently, the most common monitoring method for vapor intrusion investigations involves drawing air or soil gas into an evacuated and passivated stainless steel container (i.e., Summa canister) through a flow controller with analysis by Environmental Protection Agency (EPA) Method TO-15. The cost is relatively high (~$200 to $400 per sample, depending on the reporting limit requested) because it includes canister rental, canister cleaning and certification, and flow controller rental in addition to the cost of analysis. For soil gas sampling in particular, it may be difficult to draw soil gas from low-permeability materials, and there are opportunities for leaks that may introduce atmospheric air to the sample. These can be controlled using a tracer gas and various forms of pneumatic testing, but the complexity of the sampling protocol increases significantly. There are also differing opinions regarding the volume to be purged prior to sample collection, the flow rate and vacuum that should be applied, and the potential for adsorption/desorption reactions with tubing, fittings and containers, and the duration over which the sample should be collected, all of which could potentially be avoided with passive samplers.
The most common alternative to whole-gas sampling is active adsorptive sampling using Automatic Thermal Desorption (ATD) tubes. The ATD tubes are filled with a selected adsorbent and gas is drawn through the tube at a controlled flow rate for a measured time, from which the total volume of gas constituting the sample can be calculated. The mass of chemicals

3
adsorbed in the tube is determined by laboratory analysis, and the concentration is calculated by dividing the measured mass by the volume of gas drawn through the tube. Active adsorptive sampling also faces several practical challenges. In some cases, the pumps have rechargeable batteries, which impose limits on how long they will run. Also, some chemicals have risk-based target concentrations for the vapor intrusion pathway that are so low, they require very large volumes of gas to be drawn through the adsorptive media to achieve the required reporting limits, which may cause unacceptable mixing or dilution of soil gas from different depth intervals. Furthermore, if the concentration of chemicals in the gas to be sampled is unknown in advance (the common case), then there is a risk that the adsorptive sites will become saturated, in which case “breakthrough” will occur, causing escape of some mass and an associated negative bias in the results. This method is also typically destructive; in other words, the sample is desorbed only once, and if the concentration is not within the calibrated range of the instrument, there is no remaining sample to re-run using a different dilution (some new instruments allow the collection of a fraction of the injected volume for potential reanalysis). Despite these drawbacks, the active adsorptive methods are so accurate they are often used to calibrate other methods.
Passive adsorptive sampling consists of an adsorbent medium that is exposed to a gas for a period of time, and VOC vapors are adsorbed through diffusion or permeation alone. The trapped mass (M) is quantified using comparable methods to active adsorbent media (solvent extraction or thermal desorption followed by gas chromatography and mass spectrophotometry, GC/MS). Calculations are used to determine the time-weighted average concentration (C) of vapors in the gas to which the sampler is exposed, as long as the uptake rate (k-1) for a particular compound is known and controlled, (“quantitative” passive sampling), otherwise the data are qualitative. It is possible to achieve lower reporting limits at no additional cost, simply by leaving the samplers for a longer exposure duration (t).
C = M/k-1t
where: C = conc t = time k-1 = uptake rate (the inverse of which is the “calibration constant”, k) Passive diffusive samplers have some potential limitations relative to the current conventional sampling methods:
1. Starvation Effect:
2.
If the air to which the sampler is exposed is stagnant, then the sampler may remove VOC vapors from the air faster than they are replenished, in which case, the sampler itself imposes a reduction in the concentrations it is intended to measure. This is referred to as the “starvation effect”, and it depends on the uptake rate of the sampler and the face velocity past the sampler.
Saturation/Competition: If passive samplers are exposed to high concentrations for extended periods of time, then the adsorbent media may become saturated, in which case, the uptake

4
rate may diminish, or more strongly adsorbed compounds may displace less strongly adsorbed compounds (i.e., competition for adsorptive sites), which could impose a bias on the concentration measurements. This can be managed if there is some advance information of expected concentrations (e.g., via field screening or historic data).
3. Matching Adsorbent Media to Target Compounds:
EXPERIMENTAL DESIGN
Different chemicals have different adsorption coefficients, and a variety of adsorbent media are available, so it may be necessary to match the adsorbent to the compounds of interest to provide a high degree of retention during sampling, and good recovery during analysis. It may not be practical to design a single passive sampler suitable for the range of compounds of potential interest for vapor intrusion investigations. This is similar to challenges of conventional active ATD tube sampling methods.
The demonstration program consists of both laboratory and field testing programs. The laboratory testing consists of low concentration (1 to 100 parts per billion {ppb}) and high concentration (1 to 100 parts per million {ppm}) tests and field testing will be done at three sites. All of the analyses for any given sampler were done by the laboratory with the most experience with them (i.e., Radiello samplers were analyzed by the Fondazione Salvatore Maugeri (FSM), the WMS samplers were analyzed by the University of Waterloo, the SKC Ultra II samplers were analyzed by Columbia Analytical Services (CAS) and the ATD tubes [active and passive] were analyzed by Air Toxics Limited (ATL)). Each component of the program is described in more detail in the subsections below.
Target Analyte List and Concentration Range for Laboratory Testing
The target analyte list was selected to represent common VOCs and span a range of properties (Table 1). The list includes chlorinated ethenes, ethanes, methanes, and aromatics, as well as benzene, naphthalene, hexane, and 2-butanone (methylethylketone, MEK). Many other compounds pose a potential concern for vapor intrusion, however, most have properties within the range represented by the compounds, which makes this list reasonably representative for comparison testing purposes. Supply gas was custom-fabricated by Scott Specialty Gases blending the target analytes in a compressed gas cylinder with balance of high purity air. Both Tenax and Carbopack were used as sorbents in the ATD tube samplers, so a total of 5 passive samplers were included in the testing program.
Table 1: Compounds Included in the Laboratory Testing Phase
CAS # Target Analyte
ORNL 2009 Indoor Air Residential Screening Level at 10-5 risk
Organic Carbon Partitioning Coefficient, Koc (mL/g)
Vapor Pressure (atm)
Water Solubility (g/L)
(ppbv)

5
71-55-6 1,1,1-Trichloroethane 40,000 110 0.163 1.33
95-63-6 1,2,4-Trimethylbenzene 62 472 0.00197 0.0708
107-06-2 1,2-Dichloroethane 1.1 174 0.107 8.52
78-93-3 2-Butanone (MEK) 75,000 134 0.1026 ~256
71-43-2 Benzene 5 59 0.125 1.75
56-23-5 Carbon Tetrachloride 1.3 174 0.148 0.793
91-20-3 Naphthalene 0.68 2,000 0.000117 0.031
110-54-3 n-Hexane 8,800 43 0.197 0.0128
127-18-4 Tetrachloroethene 3.1 155 0.0242 0.2
79-01-6 Trichloroethene 12 166 0.0948 1.1
Inter-laboratory Testing
Testing was performed to assess both the inter-laboratory (systematic) variance and the intra-laboratory variance components before the study commenced. The Youden pair experiment was executed by exposing three duplicate pairs (i.e., 6 total) of each of the five samplers (for a total of 30 samplers) to a VOC-containing atmosphere in the test chamber. The three pairs were sent to three laboratories for analysis. The difference between the results for each pair document the intra-laboratory variability, and the difference between the three laboratories documents the inter-laboratory variability. Some of the laboratories in the study team are not set up to analyze all four samplers, so external commercial laboratories were subcontracted as needed.
Low Concentration Laboratory Experiments (Simulating Indoor Air Monitoring)
The low concentration laboratory experiments (1 to 100 ppbv) included tests to assess the effects of temperature, relative humidity, concentration, exposure time and face velocity, starting out with familiarity testing, then proceeding to a one-way analysis of variance (ANOVA), and then to a two-level fractional-factorial test, which were designed with the assistance of Brian Schumacher and John Nocerino of EPA Research Labs in Las Vegas, based on published strategies11 and the Design-Expert 7.1.1 software package (http://www.statease.com/). Typical ranges of each of the independent variables were selected based on consensus among the Study Team and modified as needed based on experience gained during the familiarity testing. Familiarity tests were performed to assess the degree of control and temporal and spatial variability of the independent variables within the chamber (temperature, relative humidity, concentration of VOCs and air-flow velocity), to understand whether or not the exposure chambers perform as intended, and to demonstrate that the chambers were all equivalent.
The low concentration laboratory tests were conducted in purpose-built chambers consisting of silanized glass. Each chamber was approximately 30 cm in diameter to allow for sufficient distance between the samplers to minimize competition between the samplers. The supply gas was fed through the chamber at a rate of about 10 L/min, which provided sufficient mass flux such that the uptake by the samplers was negligible compared to the flux through the chamber. The samplers rotated inside the chamber to ensure that they were all exposed to similar

6
conditions. The face velocity was controlled at approximately 0.015, 0.18 and 0.35 m/s using motors that rotated a carousel of 20 cm diameter from which the samplers were suspended at steady rates of 1.5, 18 and 35 rotations per minute (rpm). The temperature of the chambers was controlled by a circulating thermostated ethylene glycol through flexible tubing wrapped around each chamber and covered with insulation. The design details and a photograph of the chambers are shown in Figure 2.
Figure 2: Design Details and Photograph of the Exposure Chamber
The experimental apparatus consisted of a system to purify, humidify and control the temperature of a supply of about 20 L/min of gas, which allowed two chambers to be run at the same time. Activated carbon filtration was used to purify the air inside the laboratory. Supply gas from the compressed gas tanks was metered into the purified air stream at a flow rate necessary to produce the target concentrations for each experiment. Tanks of source gas at a concentration of about 10 ppm (1 ppm for naphthalene, which has a much lower vapor pressure) and 1 ppmv concentrations for all compounds (including naphthalene) were used to ensure that the bleed rate of the source gas into the purified air stream was within a range that could be accurately measured and controlled using mass flow controllers. Humidity was controlled by passing a portion of the air stream through a glass vessel containing water and a magnetic stir-bar for agitation. For high humidity conditions, the glass vessel was also heated to minimize condensation.

7
One-way ANOVA test was performed to establish the variability in six repeated exposure tests under exactly the same conditions, with each experimental variable held at the mid-points of the range to establish the within sampler-type variance and the between sampler-type variance (i.e., to quantify the experimental “noise”). The data collected in these tests were used to establish a baseline from which changes in the factors could be conducted to assess their influence and compare the magnitude of the effect of changes relative to the magnitude of inherent variability associated with the experimental and analytical procedures.
The one-half fraction, two-level factorial design and analysis involved changing the experimental variables (factors) in various predetermined combinations in a random order such that a small number of exposure chamber experiments could be statistically analyzed to assess the effect of each factor compared to the noise (see Table 2). Active sampling using ATD tubes or Summa canisters was conducted to characterize the VOC vapor concentrations inside the chamber during each test. The measured concentration for each analyte (n~10) using each type of passive sampler (n=5) in each chamber test (n~24) compared to the concentration measured with the active sampling method represented a response. This particular experimental design is economical because it minimizes the number of chamber tests required by changing more than one factor (variable) at a time in a strategic sequence.
Table 2: Testing Sequence for the Fractional Factorial Tests
Run # Approximate Concentration
(ppbv)
Approximate Temperature
(oC)
Face Velocity (m/s)
Duration (days)
Approximate Humidity (%R.H.)
1 100 17 0.41 1 90 2 1 17 0.014 1 90 3 100 30 0.41 1 30 4 1 30 0.014 1 30 5 100 30 0.41 7 90 6 1 30 0.014 7 90 7 100 17 0.41 7 30 8 1 17 0.014 7 30 9 50 20 0.23 4 60 10 50 20 0.23 4 60 11 100 17 0.014 1 30 12 1 17 0.41 1 30 13 100 17 0.014 7 90 14 1 17 0.41 7 90 15 100 30 0.014 7 30 16 1 30 0.41 7 30 17 100 30 0.014 1 90

8
18 1 30 0.41 1 90 Note: Concentration, temperature and humidity were measured during each run Runs 9 and 10 are repeats of the ANOVA tests The first 6 ANOVA tests and Runs 1 through 8 above are included in this paper
High Concentration Range Experiments (Simulating Soil Gas Monitoring) A second set of laboratory experiments was conducted at concentrations of 1, 10, and 100 parts per million by volume (ppmv), which was designed to mimic the range of concentrations of interest in soil gas monitoring. Again, naphthalene is much less volatile than the other compounds (Table 1), so its concentrations were 10 times lower than those of the other compounds. These tests were simplified compared to the experiments designed to mimic indoor air monitoring because:
a. relative humidity
b. for soil gas is almost always nearly 100%;
temperature
c.
in soil gas is somewhat constrained by the insulating effect of the earth, especially at greater depths or directly beneath temperature-controlled buildings;
face velocity
d.
is very low for in-situ passive sampling, which is very difficult to mimic in the laboratory, so the laboratory tests were conducted using a flow-through cell with a de minimis flow rate designed for negligible starvation. Fully passive soil gas sampling is being further evaluated during the field testing phase of the program; exposure duration
The flow through cell was approximately 1 meter long, with the supply of vapors entering at the bottom and leaving at the top. The samplers were suspended from a length of nylon fishing line such that they were positioned near the bottom of the cell. This minimized the disturbance of the concentrations in the area around the samplers when the top was opened to insert the samplers. Once the atmosphere inside the cell was verified stable by active sampling, a single sampler was introduced. The source gas flowed through the cell at about 100 mL/min for 30 minutes, which was sufficient to supply each sampler with a measurable mass of each analyte, even at the low end of the concentrations range for this test. Each sampler type was tested in triplicate at each concentration in a random sequence. The concentration within the flow-through cell was verified by active sampling at the beginning, middle and end of each cohort of 15 passive sampler exposures (i.e., at each of the three concentrations to be tested) to establish a benchmark for comparison for the passive sampler results. Additional active samples were collected before the start of each test to verify the magnitude and stability of the concentrations. The concentrations measured by the passive samplers were compared to the concentrations measured using active sampling from the flow-through cell.
for passive samplers is inversely proportional to concentration, and since soil gas concentrations of interest are hundreds to millions of times higher than indoor air concentrations of interest, the exposure durations for soil gas sampling can be reduced in inverse proportion to the concentrations.

9
Field Testing
One of the three field sampling events has been conducted to date, and was focused on improving our understanding of the starvation effect during soil gas sampling, the influence of the uptake rate on the magnitude of the starvation, and testing the use of a flow-through cell as an alternative soil gas sampling approach. We already know that indoor and outdoor air sampling will have much less (if any) negative bias from the starvation effect by comparison. Therefore, this is intended to bring our knowledge and understanding of the application of passive samplers for soil gas monitoring closer to the level of our understanding of their use for indoor and outdoor air sampling. This event was conducted at 1054W 2600N, Layton, UT, a residential property near Hill AFB, which was recently purchased by Arizona State University as part of SERDP Project ER-1686.
The scope of work consisted of collecting and analyzing soil gas samples using both conventional active methods and two different applications of passive samplers (fully passive and flow-through cell). Soil gas probes were installed at a location in the front yard of the house. Seven boreholes were hand-augered to 12 ft bgs, which was expected to be the depth with the highest overall concentrations based on earlier sampling of nearby probes. The holes were arranged with one central probe completed as a conventional soil gas probe and six additional holes located in a hexagonal pattern at a distance of about 3 feet away from the central probe (close proximity to minimize spatial variability) completed as passive soil gas (PSG) probes. The PSGs were constructed of 2-inch diameter PVC to be large enough to accommodate all of the candidate samplers, which were inserted to depth of 11 feet (i.e., 1 foot above the bottom) of the 4-inch diameter hand-augured borehole. A gasket on the outside of the casing at about 11 ft bgs was used to act as a bridge to allow an annular seal of hydrated bentonite slurry between the
casing and the borehole wall from 1 to 11 feet below ground surface (Figure 3).
Conventional soil gas samples were collected from all seven probes using a Summa canister and TO-15 analysis at the beginning of the passive sampling period and a Hapsite Portable GC/MS was used to monitor temporal variability at the end of each sampling period (1 to 12 days). Passive samples were collected by lowering the samplers to 11.5 ft bgs through the center of the tube with a wire. After placement, the dead volume of the casing and the opening below the casing was purged and the top of the casing was sealed with a slip-cap covered by Saran Wrap and secured with an elastic band over the outside of the well casing. After 1 to 12 days, the sampler was removed, the next sampler was placed, and the dead volume was purged again. Purged gas was screened with a Hapsite GC/MS to assess whether VOC vapor concentrations were
Figure 3: PSG Design

10
changing during the sampling event.
The passive samplers were rotated to a new probe location until 6 sets of samples had been collected (i.e., one of each sampler type was deployed in each of the six passive sampling probes). The six passive samplers were as follows:
1) Radiello™ samplers with solvent extraction; 2) Perkin Elmer automated thermal desorption (ATD) tubes filled with Tenax TA; 3) Perkin Elmer automated thermal desorption (ATD) tubes filled with Carbopack B; 4) Waterloo Membrane Samplers™ with solvent extraction; 5) Waterloo Membrane Samplers with reduced uptake rate and thermal desorption sorbent, and 6) SKC Ultra™ badge samplers with reduced uptake rate and thermal desorption.
Collectively, these samplers had uptake rates spanning a range from as high as about 75 mL/min to as low as about 0.01 mL/min, which provided useful information regarding the relationship between the uptake rate and the starvation factor.
A second set of samples was collected from a conventional soil gas probe located beside the house (where VOC concentrations were higher) using flow-through cells. The cells consisted of 100 mL wide-mouth glass jars with Teflon lids and two ports in the lid to allow soil gas to flow through at a modest rate. Five flow-through cells were connected in parallel via a manifold attached to the soil gas probe, and a Summa canister sample was also collected for comparison purposes. A T-fitting off the probe was used for collection of Tedlar bag samples via a lung box for field screening. Four sets of samples were collected over a 2-hour period, during which time a flow of about 100 mL/min of soil gas was drawn through each flow-through cell (Figure 4).
INTERIM RESULTS The inter-laboratory test results are shown in Figure 5. The points within the ellipse are data where both laboratories returned results within about 25% of each other; therefore, the majority of the data show very good agreement between laboratories. MEK results were the least consistent, and an issue was identified with hexane contamination in some of the WMS samplers. It should be noted that the ATD tube samplers do not have measured uptake rates for hexane, carbon tetrachloride, 1,2-dichloroethane, 1,1,1-trichloroethane, MEK and naphthalene, so estimated uptake rates (0.5 mL/min) were used.
Figure 5: Youden Plot of Inter-Laboratory Test Data
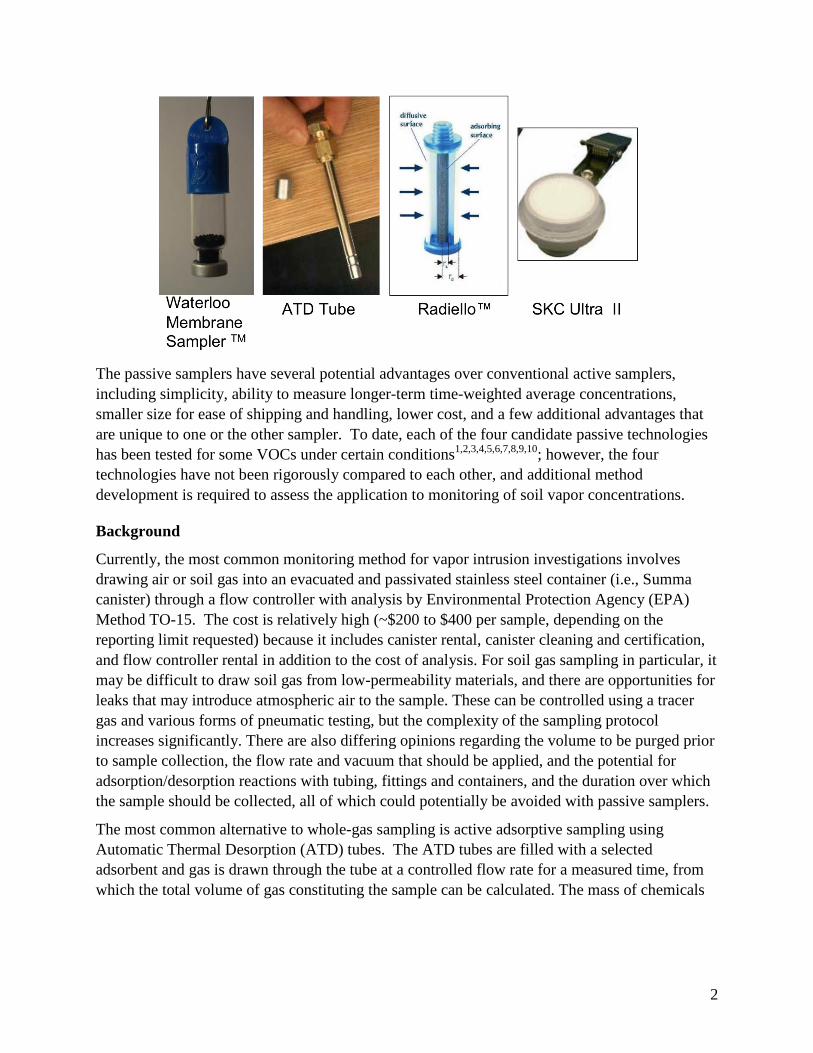
The ANOVA and Fractional Factorial tests conducted to date are shown in Figure 6. The concentrations measured with the passive samplers were divided by the concentrations measured with
Figure 4: Flow-Through Cell
11
active samplers to produce relative concentrations (C/Co). Horizontal lines are included at values of 0.75 and 1.25 indicative of a 25% precision goal.
Figure 6: Low-Concentration (1 to 100 ppbv) Chamber Tests Results to Date
The results are generally very encouraging, although there are some apparent challenges for some samplers and some conditions. Naphthalene showed a high bias for the Radiello sampler, a low bias for the WMS sampler and could not be quantified with the SCK sampler. MEK showed

12
a low bias for the ATD tubes with Carbopack, but not with Tenax. These compounds were selected because they have high Koc and water solubility, respectively, so it was anticipated that they would be challenging compared to the other VOCs. The WMS sampler had an issue with hexane contamination that was subsequently resolved. Further analysis and interpretations will be made upon completion of the fractional factorial testing.
The reproducibility for the ANOVA tests was generally very good, which confirmed that the experimental procedure and apparatus were performing as intended and that the chamber tests could be carried out consistently and reproducibly.
The high concentration testing is still in progress, but the results of initial trials during familiarity testing (Figure 7) showed similar results to the low-concentration test, in that the samplers with high uptake rates tended to have a low bias (indicative of a starvation effect), whereas naphthalene was biased low for the WMS and biased high for the Radiello, as described above.
Figure 7: High Concentration Chamber Tests Results to Date
The soil gas samples collected using flow-through cells are shown on Figure 8 for the three prevalent compounds beneath the house: 1,1,1-trichloroethane (TCA), 1,1-dichloroethene (1,1-DCE), and trichloroethene (TCE). The concentrations measured using the passive samplers (C) was divided by the coincident Summa canister result (Co), and the arithmetic average of the four consecutive sampling events was plotted as the C/Co value in Figure 8 (note 1,1-DCE was not

13
reported for the Radiello sampler). All of the average passive sampler results were within a factor of 2 of the Summa canister results, which is considered to be good agreement.
Figure 8: Flow-Through Cell Test Results (Average of 4 Tests)
The fully-passive soil gas probe test results for TCE, TCA and 11DCE are shown in Figure 9. At the time of writing, only one round of sample results was available. Each passive sampler concentration (C) was divided by the concentration measured via Summa canister from the sample probe (Co) (note 1,1-DCE was not reported for the Radiello sampler and not detected by the modified SKC sampler). The results are consistent with expectations, in that the sampler with the highest uptake rates (Radiello) showed the greatest starvation effect, and the magnitude of the starvation factor generally decreased with decreasing uptake rates.
Figure 9: Fully Passive Soil Gas Sampling Results (one round only)

14
DISCUSSION
Results to date are encouraging and indicate that the demonstration program will provide evidence that the qualitative passive samplers provide useful data for vapor intrusion assessments under some circumstances. There are different strengths and weaknesses apparent for different samplers under different conditions and for different chemicals, and this information will be useful either to identify limitations or opportunities for modifications. A detailed statistical analysis of the laboratory and field testing data is forthcoming and will be presented in subsequent reports and papers.
ACKNOWLEDGEMENTS
Funding for this work was provided by the United States Department of Defence (DOD) through the Environmental Science and Technology Certification Program (ESTCP), Project number ER-20-0830.
REFERENCES 1. Brown, V. M., Crump, D. R. and C. Yu, 1993. Long term diffusive sampling of volatile organic compounds in indoor air. Environmental Technology, Vol. 14, p.771-777.
2. Brown, V. M. and D.R. Crump, 1998. Diffusive Sampling of Volatile Organic Compounds in Ambient Air. Environmental Monitoring and Assessment, Vol. 52, p. 43-55.
3. Cocheo, V., C. Boaretto P. and Sacco, 1996. High Uptake Rate Radial Diffusive Sampler Suitable for Both Solvent and Thermal Desorption. American Industrial Hygiene Association Journal, Vol. 57, p. 897-904.

15
4. Coyne, L., et. al., 2002. Using Diffusive Samplers for Monitoring ppb Levels of Volatile Organic Compounds in Indoor Air. Presented at AirMon 02, Lillehammer, Norway.
5. Crump, D. R., 1999. Application of Diffusive Samplers. Chapter in: Salthammer, T. (ed.) Organic Indoor Air Pollutants-Occurrence, Measurement, Evaluation, Wiley-VCH, ISBN 3-527-29622-0, p. 57-71.
6. Crump, D., 2001. Application of diffusive samplers for the study of emissions in buildings. Proc. Int. conference on Measuring Air Pollutants by diffusive sampling. Montpelier, 26-28 September 2001, p. 189-196.
7. Górecki, T. and J. Namiesnik, 2002. "Passive Sampling", Trends in Analytical Chemistry, 21(4), pp. 276-291.
8. Hendricks, W.D., et. al., 2002. Feasibility of Diffusive Sampling to Monitor U.S. Military Personnel for Exposure to Toxic Chemical Substances, OSHA, SLTC, Salt Lake City, UT.
9. Hendricks, W., Performance of SKC Ultra Passive Samplers Containing Carboxen 1016, Carbotrap Z, or Chromosorb 106 When Challenged With a Mixture Containing Twenty of OSHA SLTC's Top Solvent Analytes, Methods Development Team, Industrial Hygiene Chemistry Division, OSHA, Salt Lake Technical Center, Salt Lake City, UT, February 2003. www.osha.gov and search on Ultra.
10. Zabiegala, B., M. Partyka, T. Górecki and J. Namiesnik, 2006. “Application of the GC retention index system for the determination of the calibration constants of permeation passive samplers with PDMS membranes,” Journal of Chromatography A, 1117 p. 19-30.
11. Deming, S.N. and S.L. Morgan, 1987. Experimental Design: A Chemometric Approach. Elsevier, Amsterdam.