Embed Size (px)
Citation preview
QUANTITATIVE DATA ANALYSIS
Chapter 11
LEVELS OF MEASUREMENT
• Variable attributes: the characteristics or qualities that describe a variable
• Variable attributes can be defined at four different levels of measurement– Nominal– Ordinal– Interval– Ratio
Nominal Measurement
• The lowest level of measurement
• Attributes or response categories of a variable are– mutually exclusive
Ordinal Measurement
• Second highest level of measurement
• Attributes or responses categories or a variable are– Mutually exclusive– Rank ordered
Interval Measurement
• Third highest level of measurement
• Attributes or responses categories or a variable are– Mutually exclusive– Rank ordered– Equal distance from each other
Ratio Measurement
• Highest level of measurement
• Attributes or responses categories or a variable are– Mutually exclusive– Rank ordered– Equal distance from each other– Based on a true 0 point
COMPUTER APPLICATIONS
• Variables must be coded (assigned a distinct value) for data to be processed by computer software
• The researcher must know the level of measurement for each variable to determine which statistical tests to use
DESCRIPTIVE STATISTICS
• Summarize a variable of interest and portray how that particular variable is distributed in the sample or population– Frequency distributions– Measures of Central Tendency– Measures of Variability
Frequency Distributions
• A counting of the occurrences of each response value of a variable, which can be presented in– Table form– Graphic form (Frequency Polygon)
Measures of Central Tendency
• The value that represents the typical or average score in a sample or population
• Three types:– Mode, Median, and Mean
• Normal Curve: a bell-shaped frequency polygon in which the mean, median, and mode represent the average equally (See Figure 17.4)
Mode
• The score or response value that occurs most often (i.e., has the highest frequency) in a sample or population
• Minimum level of measurement is nominal
Median
• The score or response value that divides the a distribution into two equal halves
• Minimum level of measurement is ordinal
Mean
• Calculated by summing individual scores and dividing by the total number of scores
• The most sophisticated measure of central tendency
• Minimum level of measurement is interval
Measures of Variability
• A value or values that indicated how widely scores are distributed in a sample or population; a measure of dispersion
• Two common types– Range– Standard Deviation
Range
• The distance between the minimum and maximum score in a distribution
• The larger the range, the greater the amount of variation of scores in a distribution
• Minimum level of measurement is ordinal
Standard Deviation
• A mathematically calculated value that indicates the degree to which scores in a distribution are scattered or dispersed about the mean
• The mean and standard deviation define the basic properties of the normal curve
• Minimum level of measurement is interval
INFERENTIAL STATISTICS
• Make it possible to study a sample and “infer” the findings of that study to the population from which the sample was randomly drawn
• Based on chance or probability of error– Commonly accepted levels of chance are
p < .01 (1 in 100) and p < .05 (5 in 100)
Statistics that Determine Associations
• Statistics that determine whether or not a relationship exists between two variables
• The values of one variable co-vary with the values of another variable– Chi-square (2)– Correlation (r)

Chi-Square (2)
• Used with nominal or ordinal levels of measurement
• Provides a measure of association based on observed (actual scores) and expected (statistically estimated) frequencies
• The direction or strength of the relationship between the two variables is not specified
Correlation (r)
• Typically used with interval and ratio levels of measurement
• A measure of association between two variables that also indicates direction and strength of the relationship– r=0 (no relationship), r=1.00 (perfect
relationship)– A +r value (a direct relationship), -r value (an
inverse relationship)
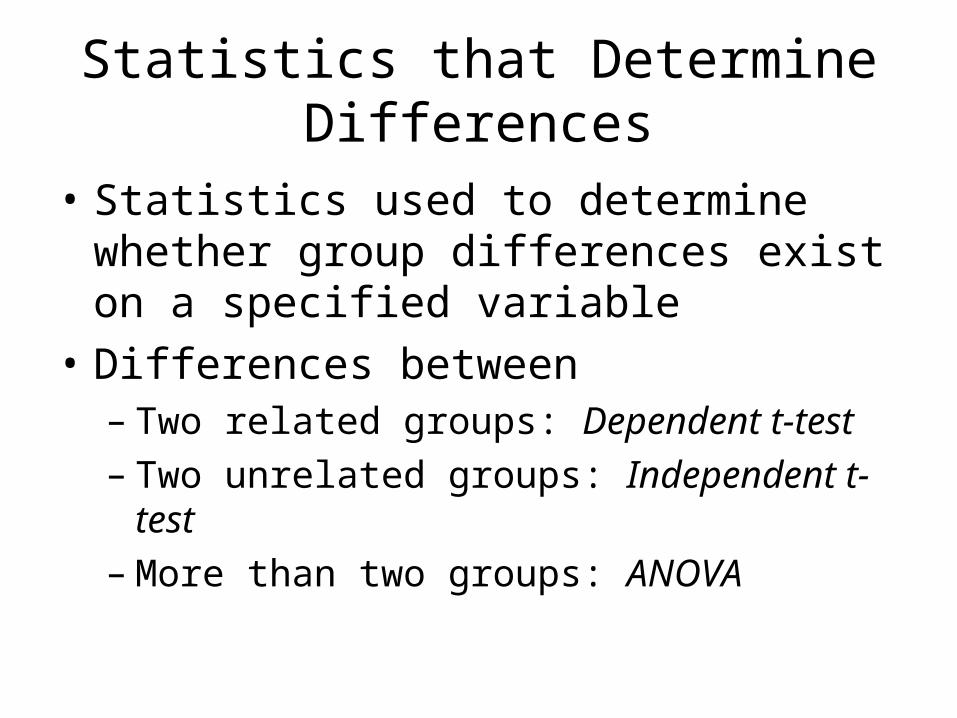
Statistics that Determine Differences
• Statistics used to determine whether group differences exist on a specified variable
• Differences between– Two related groups: Dependent t-test– Two unrelated groups: Independent t-test– More than two groups: ANOVA
Dependent t-test
• Used to compare two sets of scores provided by one group of individuals– Example: pretest and posttest scores
Independent t-test
• Used to compare two sets of scores, each provided by a different group of individuals– Example: Fathers and Mothers
One-Way Analysis of Variance
• Used to compare three or more sets of scores, each provided by a different group of individuals– Example: Fathers, Mothers, and Children
SUMMARY
• Statistics are used to analyze quantitative data
• The level of measurement must be specified for each variable
• Descriptive and Inferential statistics are used to build knowledge about a sample or population