Embed Size (px)
Citation preview

Prof. Bernd Fitzenberger, Ph.D. April 2012
Quantile Regression
Universitat Linz
Abstract: Quantile regression is increasingly used in applied economet-
ric research. The method allows to estimate the differential effects of
covariates along the conditional distribution of the response variable.
Linear quantile regression can now be estimated with most econometric
software packages. This course provides an up–to–date introduction
into linear quantile regression. The course involves computer exercises
illustrating the use of basic linear quantile regression and some ad-
vanced quantile regression techniques as well as the interpretation of
results using the software package STATA.
Outline
1. Introduction to linear quantile regression: Distance function, Asymp-
totic distribution, Properties of the estimator, Interpretation as
Method-of-Moments Estimator
Application: Mincer Earnings Equation
2. Minimum-Distance estimation of quantile regression
Application: Earnings Regression based on cell data
3. Censored Quantile Regression
4. Decomposition Analysis with Quantile Regression and Uncondi-
tional Quantile Regression
Application: Gender Wage Gap
5. Quantile Regression for Duration Analysis
Application: Duration of Unemployment
6. Quantile Regression for Panel Data

References:
Abrevaya, J. and C.M. Dahl (2008), ”The effects of birth inputs on
birthweight: evidence from quantile estimation on panel data.”
Journal of Business and Economic Statistics, 26(4):379-397.
Antonczyk, D., B. Fitzenberger, and K. Sommerfeld (2010) “Rising
Wage Inequality, the Decline of Collective Bargaining, and the
Gender Wage Gap”, Labour Economics, 17 (5), 835-847.
Angrist, J. V. Chernozhukov, and I. Fernandez (2006) “Quantile Re-
gression under Misspecification, with an Application to the U.S.
Wage Structure”, Econometrica, 74(2), 539-564.
Chamberlain, G. (1994) Quantile Regression, Censoring, and the
Structure of Wages. In: Sims, C., (ed.), Advances in Econo-
metrics: Sixth World Congress. Econometric Society Monograph,
Volume 1.
Chernozhukov, V., I. Fernandez-Val and B. Melly (2008). “Inference
on counterfactual distributions.” MIT Working Paper, 08-16.
Firpo, S., Fortin, N.M., and T. Lemieux (2009). “Unconditional
Quantile Regressions” Econometrica, vol. 77(3), 953-973.
Firpo, S., Fortin, N.M., and T. Lemieux (2011). “Occupational Tasks
and Changes in the Wage Structure”, IZA Discussion Paper 5542.
Fitzenberger, B. (1997). A Guide to Censored Quantile Regres-
sions. In: Handbook of Statistics, Volume 15: Robust Inference
(Eds. G.S. Maddala & C.R. Rao), 405-437. Amsterdam: North–
Holland.
Fitzenberger, B., Koenker, R. and J.F.Machado (2001) Economic
Applications of Quantile Regression, Special Issue of Empirical
Economics, Springer, Heidelberg.
2

Fitzenberger, B. and A. Kunze (2005) “Vocational Training and Gen-
der: Wages and Occupational Mobility among young Workers”,
Oxford Review of Economic Policy, 2005, Vol. 21(3), pp. 392-
415.
Fitzenberger, B. and Wilke, R.A. (2006) “Using Quantile Regression
for Duration Analysis”. Allgemeines Statistisches Archiv, 90(1),
105-120.
Fortin, N.M., Lemieux, T. and S. Firpo (2011). ”Decomposition
Methods”, (with T. Lemieux and S. Firpo), in O. Ashenfelter
and D. Card (eds.) Handbook of Labor Economics, Vol. 4A,
Amsterdam: North-Holland, 1-102.
Koenker, R. (2005) Quantile Regression. Econometric Society Mono-
graph, Cambridge University Press, Cambridge.
Koenker, R. and Bassett, G. (1978). Regression Quantiles. Econo-
metrica, 46, 33–50.
Koenker, R. and K.F. Hallock (2001). “Quantile Regression”, Journal
of Economic Perspectives, vol. 15(4), 143-156.
Lamarche, C. (2010). Robust penalized quantile regression estimation
for panel data, Journal of Econometrics, 157, 396-408.
Machado, J. and Mata, J. (2005). Counterfactual Decomposition of
Changes in Wage Distributions using Quantile Regression. Jour-
nal of Applied Econometrics, 20(4), 445–465.
Melly, B. (2005) “Decomposition of differences in distribution using
quantile regression”. Labour Economics 12 (4), 577-590.
Melly, B. (2006) “Public and private sector wage distributions control-
ling for endogenous sector choice”, Discussion Paper, University
of St. Gallen.
3
1. Introduction to linear quantile regression
Definition: The θ–quantile of a random variable X with cumulative
distribution function (CDF) F (x) = P (X ≤ x) is the minimum
(≡infimum) value qθ such that
qθ = F−1(θ) = infx : F (x) ≥ θ.
Example: θ = 0.5 describes the median (the 50%–value).
The θ–quantile of the sample X1, . . . , XN can be computed by the
following minimization problem:
qθ = argminz
N∑i=1
ρθ(Xi − z)
=N∑i=1
[θ · I(Xi > z) + (1− θ) · I(Xi < z)] · |Xi − z|
The so–called ”check function” ρθ is based on the absolute deviation
of residual |Xi − z| which is weighted by θ if positive and by (1− θ)
if negative.
Asymmetric loss
-
6
HHHHHHHHHHHH
ρθ(u)
θu
−(1− θ)u
u0
4

Example: For θ = 0.5 (median) positive and negative residuals are
weighted equally, i.e. the sum of absolute deviations is minimized
(Least Absolute Deviation: LAD).
Show qθ = argminN∑i=1
[θI(xi > z) + (1− θ)I(xi < z)] · (xi − z)︸ ︷︷ ︸≡ D
Order x1, ..., xN such that x1 < x2 < ... < xN (ignore equality for
simplicity)
-
x1 x2 x3 ... xk xk+1 ... xN
?
z
︸ ︷︷ ︸Ik
z ϵ (xk, xk+1) = Ik
∂D
∂z≡ Dk = (1− θ)
k∑i=1
1 + θN∑
i=k+1(−1)
= (1− θ)k − (N − k)θ
= k − θN
= constant in Ik3 cases:
i) Dk = 0 ⇔ k = θN
→ all values in Ik minimize D and represent q − quantile
→ qθ not unique (qθ ∈ Ik), e.g. qθ =xk+xk+1
2
5

ii) ∂D∂z > 0 then z is to be reduced until Dk−1 = (k − 1)− θN < 0
→ minimum at xk
-
6
@@
@@@@
@@@@
@@
D
zxk
It follows k−1N < θ < k
N , i.e. F (z) jumps above θ at z = xkTherefore qθ = xk
iii) Dk = k − θN < 0, i.e. increase z until Dk+1 > 0
→ qθ = xk+1 becausekN < θ < k+1
N
6

Semiparametric linear quantile regression
Motivation: A linear quantile regression specifies the conditional θ–
quantile qθ(Yi|X2i, . . . , Xki) of Yi as a linear function of regressors
X2i, . . . , Xki .
Model: For sample i = 1, ..., N
Yi = βθ,1 + βθ,2X2i + . . . + βθ,kXki + εθi = x′iβθ + εθi
where Xji observation i for regressor j = 2, . . . , k
qθ(εθi |xi) = 0 and εθi = Yi − x′iβθ continuously i.i.d. random
variable (conditional on xi).
Estimator for βθ = (βθ,1, . . . , βθ,k)′:
βθ = argminβ1,...,βk
N∑i=1
ρθ(Yi − x′iβθ)
=N∑i=1
[θ · I(Yi > x′iβθ)︸ ︷︷ ︸positive
residual
+(1− θ) · I(Yi < x′iβθ)︸ ︷︷ ︸negative
residual
] · |Yi − x′iβθ|
with xi = (X2i, . . . , Xki)′ .
Asymptotic distribution of βθ (i.i.d. error terms):√N(βθ − βθ) ∼ N
[0, λ ·
(N−1 ·X ′X
)−1]
with λ = θ(1−θ)fθ(0)
2 and fθ(0) the density of εθi (and Yi) at 0
(and qθ(Yi|xi), resp.) conditional on xi.
Asymptotic covariance of βθ1 and βθ2 for θ1 = θ2
Cov(βθ1, βθ2) =min(θ1, θ2)− θ1 · θ2
fθ1(0) · fθ2(0)·X ′X−1
7

Properties of quantile regression line:
i) Interpolation property: For design matrix X having full rank
(rank(X) = k), there are k linearly independent data points
with zero residual
Yi(j) = x′i(j)β with j = 1, ..., k .
The fitted line interpolates at least k data points (assuming full
rank of the regressor matrix and a unique solution of the min-
imization problem), i.e. the estimated residuals are exactly zero
for these data points. This is the case because minimization in-
volves a linear programming problem. fθ(0) can be estimated
based on the fitted residuals. However, those residuals which are
exactly zero due to the minimization process can not be used to
estimate this density.
ii) At most a share θ of observations have a negative residual and at
most a share (1 − θ) of observations have a positive residual (if
Xi contains an intercept).
M =N∑i=1
I(ui < 0) negative
Z =N∑i=1
I(ui = 0) zero
P =N∑i=1
I(ui > 0) positive
residuals
MN ≤ θ ≤ M+Z
N and PN ≤ 1− θ ≤ P+Z
N
8

Figure1:ExampleforQuantileRegressionq (YijX i)=;1+ ;2X i
Y
X
X 1X 2X 3
=0:75 =0:5 =0:25
0;75;2> 0;5;2>0;25;2
Dispersionofthe onditionalDis-
tributionofY iin reaseswithX
9
iii) Quantile crossing
x =1
N
∑xi sample mean of covariates
x′βθ2 for θ1 < θ2 non decreasing in θ, but this also does not nec-
essarily hold for all points xi = x
In fact, nonparallel lines must cross eventually violating the ordering
of predicted quantiles.
-
6
A x xi -
x′iβθ1
x′iβθ2
→ Misspecification if a considerable amount of data lies in A.
10

Asymptotic distribution of βθ for heteroscedastic, independent er-
ror terms:√N(βθ − βθ) ∼ N
[0, L−1
θ,NJθ,NL−1θ,N
]
where the k × k matrices are
Lθ,N = E1
N
∑ifθ,i(0)xi x
′i and
Jθ,N =θ(1− θ)
N·X ′X =
θ(1− θ)
N· ∑
ixi x
′i .
Asymptotic covariance:
Cov(βθ1, βθ2) = L−1θ1,N
· (min(θ1, θ2)− θ1 · θ2)N 2
X ′X · L−1θ2,N
In the case of heteroskedastic error terms, it is difficult to estimate con-
sistently the expression Lθ,N due to the observation specific densities
fθ,i(0) ≡ fθ(εθi = 0|xi) ≡ fθ(Yi = qθ(Yi|xi)|xi).
Alternatively, one can use the Design–Matrix (or pairwise, xy) Boot-
strap by resampling the entire observation vector (Yi, X2i, . . . , Xki).
The bootstrap yields automatically an estimate for the joint distribu-
tion βθ1 and βθ2 for θ1 = θ2. This way it is possible to perform tests
across the distribution.
Using estimates of the asymptotic covariance across quantiles allows
to performing tests involving estimates at different quantiles θ1, θ2.
Equality of slope coefficients implies that the difference in the condi-
tional quantiles of Yi does not vary with the respective covariate.
11

Asymptotic distribution with heteroscedastic observations and mis-
specification of linear quantile regression (Angrist, Chernozhukov, Fer-
nandez-Ival, 2006)
The linear quantile regression estimates consistently the coefficient βθwhich solves the population minimization problem (’best linear quantile
predictor’)
βθ := argminβ
E[ρθ(Y −X ′β)]
but qθ(Yi|xi) does not necessarily coincide with x′iβθ
Asymptotic distribution:√N(βθ − βθ) ∼ N
[0, L−1
θ,NJθ,NL−1θ,N
]
where Lθ,N is as above and only Jθ,N changes to
Jθ,N =1
N· ∑
i(θ − I(Yi < x′iβθ))
2xi x′i .
Note: In my previous work, I define the θ–weighted sign function
sgnθ(u) =
θ if u > 0
0 if u = 0
θ − 1 if u < 0
and sgnθ(Yi − x′iβθ) = θ − I(Yi < x′iβθ) except for zero residuals.
12

Interpret linear quantile regression as a method of moment estimator
which solves the approximate moment condition
1
N· ∑
ixi(θ − I(Yi < x′iβθ)) ≈ 0
which is asymptotically equivalent to
1
N· ∑
ixisgnθ(Yi − x′iβθ) ≈ 0
Therefore:
Jθ,N =1
N· V ar(
∑ixi(θ − I(Yi < x′iβθ)))
=1
N· V ar(
∑ixisgnθ(Yi − x′iβθ))
and for the covariance across quantiles
Jθ1,θ2,N =1
N· ∑
iCov(xi(θ1 − I(Yi < x′iβθ1)), xi(θ2 − I(Yi < x′iβθ2)))
= ...
Asymptotic distribution with heteroscedastic and dependent observa-
tions
Then,
Jθ,N =1
N· V ar(
∑ixi(θ − I(Yi < x′iβθ)
with Lθ,N unchanged. Thus, autocorrelation robust estimate has to
take account of covariance in xi(θ− I(Yi < x′iβθ) across observations
i, analogous to Newey–West or clustered standard errors.
13

Heuristic derivation of QR as Method of Moment Estimator
minN∑i=1
[θI(Yi − x′iβ > 0)− (1− θ)I(Yi − x
′iβ < 0)](Yi − x
′iβ)
=N∑i=1
[θ − I(Yi − x′iβ < 0)](Yi − x
′iβ)
Approximate FOC:
1
N
N∑i=1
[θ − I(Yi − x′iβ < 0)](−xi) = op(N
−12) ≈ 0
because data points with Yi = x′iβ are negligible asymptotically com-
pared to N.
Precisely:
1
N
N∑i=1
[θ − I(Yi − x′iβ < 0)]xi = op(N
−12)
Note: θ − I(Yi − x′iβ) = sgnθ(Yi − x
′iβ)
14

Heuristic derivation of asymptotic distribution
Yi − x′iβ = x
′iβ + ui − x
′iβ
= ui − x′i(β − β)
Assume: plimβ = β has been shown
S =1√N
∑xi[θ − I(ui − x
′i(β − β) < 0)] ≈ 0
B =1√N
∑Exi[θ − I(ui − x
′i(β − β) < 0)]
=1√N
∑E(xi)E[θ − I(ui < x
′i(β − β))|xi]︸ ︷︷ ︸
A
A = θ − Fui(x′i(β − β))
= θ − Fui(0)− fui(0)x′i(β − β)
= −fui(0)x′i(β − β)
⇒ B = − 1√N
∑Efui(0)xix
′i(β − β)
= −(1
N
∑Efui(0)xix
′i)√N(β − β)
= −Lθ,N
√N(β − β)
15

One can show:
0 ≈ 1√N
∑xi[θ − I(ui < −x′i(β − β))] = S
a
≈ 1√N
∑xi[θ − I(ui < 0)] + B
It follows
√N(β − β) ≈ ((Lθ,N)
−1 1√N
∑xi(θ − I(ui < 0))
Jθ,N = V ar
1√N
∑xi(θ − I(ui < 0))
Independence: Jθ,N =1
N
∑V ar[xi(θ − I(ui < 0))]
V ar(xi(θ − I(ui < 0))|xi) = xix′iθ(1− θ)
= V ar(I(ui < 0)|Xi)
= P (ui < 0|xi)(1− P (ui < 0|xi))= θ(1− θ)
Asymptotic distribution:
√N(β − β) ∼ N(0, L−1
θ,NJθ,NL−1θ,N)
Lθ,N =1
N
∑fui(0|xi)xix
′i
Jθ,N =θ(1− θ))
N
∑xix
′i
16

Estimation of asymptotic standard errors
i) (IID) Sparsity estimator: For iid setting require estimate of sparsity
sθ =1
fθ(0)where fθ(0) is density of Yi at qθ(Yi|xi).
sN(θ) =F−1N (θ + hN)− F−1
N (θ − hN)
2hN
where F is the distribution function of the residual (Yi − qθ(Yi|xi))
Choice of bandwidth hN
1. Bofinger (1975) based on standard density estimation asymptotics
and assuming a Gaussian distribution
hN = N−1/5
4.5ϕ4(Φ−1(θ))
(2Φ−1(θ)2 + 1)2
1/5
2. Hall and Sheather (1988) explicitly addressing confidence interval
estimation and assuming a Gaussian distribution (Koenker, 2005,
p. 140)
hN = N−1/3z2/3α
1.5ϕ2(Φ−1(θ))
2Φ−1(θ)2 + 1
1/3
where zα satisfies Φ(zα) = 1− α/2 and α is the error probability
(size) for the test.
Computation of F−1N (.)
1. Based on empirical distribution of residuals, excluding zeroes
2. Use fitted quantiles directly F−1N (θ) = x′βθ where x = 1/N
∑i xi
(difference x′(βθ+hN − βθ−hN ) is necessarily nonnegative)
17

ii) Heteroscedasticity, independence case: Need observation specific
estimate of density fθ,i(0) in matrix Lθ,N
1. Hendricks-Koenker (1991) estimate
fθ,i(0) =2hN
x′i(βθ+hN − βθ−hN )
Crossing problem: difference in denominator can be negative –
rarely happens unless model is strongly misspecified!
2. Powell (1991) estimate
Lθ,N =1
NcN
N∑i=1
K(ui(θ)/cN)xix′i
where cN is a bandwidth parameter analogous to density estima-
tion with cN → 0 and√NcN → ∞.
Specific suggestion
Lθ,N =1
NcN
N∑i=1
(I(|ui(θ)| < cN)xix′i
and cN = κ · (Φ−1(θ + hN) − Φ−1(θ − hN)) and κ is a robust
estimate of scale, e.g. κ = IQR/1.34 and IQR is interquartile
range of residuals
18

2. Minimum-Distance estimation of quantile regression
Linear Quantile Regression for Grouped Data (Chamberlain, 1994)
When the regressors can be grouped in discrete cells and the number of
observations per cell is not too small (typically it should be larger than
30), then a simple two–stage minimum–distance approach is possible
which can be easily extended to account for censoring.
1. Compute the empirical θ–quantile in each cell j defined by the set
of regressors taking the value xj.
2. Estimate the coefficients of the linear quantile regression by com-
puting a weighted least squares regression of the empirical θ–
quantiles on the cell characteristics xj.
When applying this two–stage approach to censored data, just use
those cells in the second stage for which the empirical θ–quantile is
not censored.
19

Formal Description of Chamberlain’s (1994) Minimum-DistanceEstimator
Observations (xi, yi) sample i = 1, ..., N
Grouped by values of x: J cells x = xj with j = 1, ..., J
P (x = xj) = αj
Cell size: Nj =∑Ni=1 I(xi = xj) and
Nj
N→ αj
First Stage: πj = qθ(Yi|xj) empirical θ- quantile of Yi in jthcell
π′0 = (π1, ..., πJ) ; π
′ = (π1, ..., πJ)
√N(π − π0) → N(0,Ω)
V ar(πj)a=
θ(1− θ)
Njf (π0j)2=
1
NΩjj =
1
N
σ2j
αj
Ωij = 0 for i = j whereσ2j
Nj= Asymptotic variance of sample quantile
Second Stage: Run Minimum Distance (GLS estimator) based on cell
data for linear relationship
π0j = qθ(Yi|xj) = xj′β0
by minβ
(π −Gβ)′Ψ(π −Gβ) where G =
x1...
xJ
and Ψ → Ψ
20

Weighted Least Squares ( Ψ diagonal matrix)
i) weights are cell sizes
Ψ = diag(N1, ..., NJ)
ii) Optimal weights asymptotically Ψ = Ω−1 inverse of estimated
variances of cell quantiles on diagonal
Asymptotic distribution (analogous to GMM):
√N(β − β) ∼ N(0,Λ)
with Λ = (G′ΨG)−1G′ΨΩΨG(G′ΨG)−1
with optimal choice Ψ = Ω−1 ⇒ Λ = (G′ΨG)−1
Assumes correct specification of qθ(Yi|x) = x′β
Estimation of Ω−1 = (diag(σ21
α1, ...,
σ2J
αJ))−1
αj =Nj
Nand σ2
j =θ(1− θ)
fj
2
with fj(πj) density estimate in cell j at θ-quantile πj
21

Misspecification:
δ = (δ1, ..., δy)′ = π0 −Gβ ⇒ specification error
√N(β − β) ∼ N(0,Λ1 + Λ2)
Λ1 is Λ from above, Ψ = diagN1N , ..., NJ
N
Λ2 = (G′ΨG)−1)G′ΨM ΨG(G′ΨG)−1
M = diag
δ21α1
, ...,δ2JαJ
δj = πj − x′jβ
Chamberlain recommends not to attempt to estimate and use an op-
timal choice of Ψ when model is misspecified.
Asymptotic Minimum - Distance - Test statistic
N(π −Gβ)′Ω−1(π −Gβ)a∼χ2J−K
for β using the optimal choice of Ψ = Ω−1 (analogous to Sargan GMM
test)
⇒ Goodness-of-Fit test
22
3. Censored Quantile Regression
Censored regression model
Yi = min(x′iβ + εi, Yi)
with observation specific censoring from above at Yi .
Censored quantile regression (Powell, 1984, 1986):
βθ = argminβ
N∑i=1
ρθ(Yi −min(x′iβ, Yi))
Motivation for estimator: When the empirical θ–quantile in a uni-
variate sample Y1, . . . , YN lies below the censoring point Yi, then
censoring has no impact on the estimation of this quantile and con-
sistent estimation is possible. This idea is extended to the regression
context and yields an estimator which is very attractive theoretically.
This estimator is consistent under much more general assumptions
compared to the standard Maximum–Likelihood Tobit–estimator.
Asymptotic distribution of βθ (i.i.d. error terms):
√N(βθ − βθ) ∼ N
0, λ ·N−1 ∑
iI(x′iβθ < Yi)xi x
′i
−1
where λ = θ(1−θ)fθ(0)
2 and fθ(0) the density of εθi at point 0. The asymp-
totic distribution depends only upon the non censored data points
(I(x′iβθ < Yi)). These points must allow for a unique identification
of the estimate.
The actual computation of the estimator is a big problem!
23

Computation unfortunately complicated
i) Easy case: For grouped data use only cells for which cell quantile
is not censored → Chamberlain (1994)
ii) Iterative Linear programming algorithm (Buchinsky, 1994)
Idea: iterate and base quantile regression only on observations where
fitted values are not censored.
1) Start with some estimate β0 and j = 0
2) Compute x′iβj and use observations i : x′iβj < Y i to form sub-
sample Sj
3) Based on Sj calculate standard linear quantile regression coef-
ficients βj+1 and change sample to Sj+1 the set of observation
i : x′iβj+1 < Y i
4) If Sj = Sj+1 or j + 1 = maxiteration then stop.
5) Set j = j + 1 and go to 3)
Problems:
a) ILPA not guaranteed to converge
b) Upon convergence, ILPA is not guaranteed to obtain a local min-
imum of non-convex distance function
24

c) True CQR may interpolate censored points
-
6
Yi
xi
Yi
ILPA can be modified to keep observations x′iβj ≤ Yi, i.e. allow cen-
sored points to be interpolated
→ Problems a) and b) still remain
25

BRCENS: Linear programming algorithm with takes account of kinks
at zero residuals and at points interpolating censoring points
- BRCENS developed by myself, see Fitzenberger (1997)
- BRCENS guarantees local minimum of nonconvex distance func-
tion
- BRCENS performs better than ILPA but also has major problems
when there is a lot of censoring
- ILPA implemented as command CLAD in STATA
- BRCENS implemented as command LAD (censor...) in TSP and
also in R
→ Recently alternative algorithms and modifications of estimation
problem
26

Bootstrapping method of Bilias et al. (2000)
Note that asymptotic variance depends only on observations i for which
x′iβ < Y i
are uncensored.
Idea of Bilias et al. method:
i) Resample only for subset of observations i : x′iβθ < Y i with
size N a resample of size N (pairwise bootstrap)
ii) Calculate standard linear quantile regression for this resample ig-
noring censoring
iii) Use empirical distribution across resamples as estimate of variance-
covariance-matrix
27

4. Decomposition Analysis with Quantile Regression
References: Machado/Mata (2005), Melly (2006),
Fortin/Firpo/Lemieux (2011)
Problem: Differences in wage distributions between Males and Females
can be attributed to different characteristics or different coefficients
Want to compare qθ(Yi|female) and qθ(Yi|male) based on quantile
regression estimates
qθ(Yi|female, xi) = x′iβ
femaleθ
qθ(Yi|male, xi) = x′iβ
maleθ
Problem: Conditional quantiles and unconditional quantiles can not
be linked directly !
e.g. qθ(Yi|female) = x′femaleβ
femaleθ
in contrast to means where Yfemale
= xfemale′βfemalemean
28

Machado/Mata suggest to simulate the unconditional distribution based
on quantile regression fits.
1. Generate a random sample of size m from Uniform (0,1)
θ1, ..., θm
2. Estimate m different quantile regression coefficients:
βθj , j = 1, ...,m
3. Generate a random sample of sizem with replacement from xifemaledenoted by xjmj=1
4. Yj = x′jβθjmj=1 is a random sample from the unconditional dis-
tribution. Determine possibly counterfactual quantiles from this
sample.
– Procedure builds on probability integral transformation from ele-
mentary statistics: If continuous random variable Y has distribution
function F (y) and U is uniformly distributed on the interval [0, 1],
then random variable Y = F−1(U) is distributed following the dis-
tribution function F (y). This is because P (Y < y = F−1(u)) =
P (U < F (y) = u) = F (y).
– Procedure addresses problem of quantile crossings in an elegant way.
– For computational ease: 1. can be replaced by
1.’ Draw θj from uniform discrete distribution of equispaced per-
centiles i.e. 0.01, 0.02, ..., 0.99 with probability 1/99 each.
approximating the continuous distribution of Yi given xj.
29

Use this simulation method to undertake decompositions of the fol-
lowing type:
qθ(Yi|female)− qθ(Yi|male)
= qθ(Yi|female)− qθ(Yi|female characteristics, male coefficients)︸ ︷︷ ︸coefficient effect
+ qθ(Yi|female characteristics, male coefficient) − qθ(Yi|male)︸ ︷︷ ︸characteristics effect
- The second/third term is counterfactual and has to be simulated.
- The first and the last term can be taken from the observed sam-
ples or they can be simulated as well
→ Check for misspecification of qθ
- The decomposition can be performed in reverse order, i.e. it is
not unique.
→ analogous to Blinder/Oaxaca
30

The Machado/Mata estimator’s efficiency increases with the number
of random draws m. Melly (2006) suggests an analytical estimator
which avoids the computational burden of simulation and which is
equivalent to MM for m → ∞.
Melly uses the fact that the distribution function is vertically additive,
i.e.
F (y) = Prob(Y ≤ y) = 1N
∑Prob(Yi ≤ y|xi) = 1
N
∑F (y|xi)
Note that F (y|xi) =1∫0I(x′iβ ≤ y)dθ
=J∑
j=1(θj − θj−1)I(x
′iβθj ≤ y)
because βθ changes only at a finite number of percentiles θ1, ..., θj i.e. βθ =
constant for θ ∈ (θj−1, θj)
(θ0 = 0, θJ = 1)
→ have to calculate the entire quantile regression process across θ
31

Computational simplification:
Calculate βθ at equispaced discrete percentiles, i.e. 0.01, 0.02, ...
0.99, and pretend that x′iβθ can take one of the corresponding 99 fit-
ted values with equal probability.
To obtain the unconditional quantiles the distribution function F(y)
calculated by Melly’s method has to be inverted:
qθ(Yi) = infy : 1N
∑F (y|xi) ≥ θ
Melly develops also an asymptotic distribution theory for his estimator.
→ Application also for estimation of quantile treatment effects (QTE).
32

Unconditional Quantile Regression andDecomposition Analysis
References:
Firpo, S., Fortin, N.M., and T. Lemieux (2009) [henceforth FFL09],
Firpo, S., Fortin, N.M., and T. Lemieux (2011)
Fortin, N.M., Lemieux, T. and S. Firpo (2010). Decomposition Meth-
ods in Economics. NBER Working Paper 16045, Chapter prepared for
the Handbook of Labor Economics, Volume 4. [henceforth FLF10]
Idea: Unconditional Quantile Regression (UQR) focus on the impact of
the distribution of covariates on the unconditional (marginal) distribu-
tion of the outcome variable, e.g. on the unconditional quantile qθ(Y ).
The most basic UQR estimates the impact of a uniform rightward shift
of the distribution of one covariate holding all other covariates con-
stant, i.e. of X → X + t.
Problem: The impact of a covariate on the conditional distribution of
the outcome variable – as estimated by a conditional quantile regress-
sion qθ(Y |X) – does not necessarily translate into the impact on the
unconditional distribution of Y – i.e. on qθ(Y ).
33

Partial Effects (FFL09), univariate X :
Unconditional Quantile Partial Effect (UQPE):
α(θ) = limt↓0
qθ(Y (X + t))− qθ(Y (X))
t
Conditional Quantile Partial Effect (CQPE):
CQPR(θ, x) = limt↓0
qθ(Y |X = x + t)− qθ(Y |X = x)
t
=∂qθ(Y |X = x)
∂x
FFL09 develop UQR based on the statistical concept of the influence
function.
Definition: The influence function of a quantile is defined as
IF (y, qθ) = limt↓0
qθ((1− t)F + t∆y)− qθ(F )
t
where F represents the sample probability distribution of the data
and ∆y is the distribution for a point mass at the value y. Thus,
(1 − t)F + t∆y is a mixture distribution with weight (1 − t) for the
actual distribution F and weight t for the value y. The influence
function measures the marginal influence of an observation at value y
on the sample quantile.
For instance, this is important to study the influence of outliers. It
turns out that the influence only depends on whether y lies below or
above qθ(Y ) but not the actual value of y, i.e. quantiles are not outlier
sensitive.
34

What is the influence function?
First, determine quantile of mixture distribution qθ((1− t)F + t∆y) as
a function of qθ(F ), t, and y for t small and F continuous distribution:
qθ((1− t)F + t∆y) = q′θ
We have
(1− t)F (q′θ) + t∆y(q′θ) = θ
where ∆y(q′θ) = I(y ≤ q′θ) (contribution to probability of Y ≤ q′θ).
By the implicit function theorem
∂q′θ∂t
= −−F (q′θ) + I(y ≤ q′θ)
(1− t)fY (q′θ)
For t ↓ 0, one obtains
IF (y, qθ) =θ − I(y ≤ qθ)
fY (qθ)
because q′θ → qθ and F (q′θ) → θ.
Note
E[IF (Y, qθ)] =∫IF (y, qθ) · fY (y)dy
=∫ θ − I(y ≤ qθ)
fY (qθ)· fY (y)dy
= (1/fY (qθ))∫(θ − I(y ≤ qθ)) · fY (y)dy = 0
because by definition of the θ-quantile E[I(y ≤ qθ)] = θ.
Now, define the recentered influence function (RIF):
RIF (y, qθ) = qθ + IF (y, qθ)
We have E[RIF (Y, qθ)] = qθ.
Note the change between y (value of outcome variable) and Y (ran-
dom variable).
35

Rewrite
RIF (y, qθ) = qθ +θ − I(y ≤ qθ)
fY (qθ)
=I(y > qθ)
fY (qθ)+ qθ −
1− θ
fY (qθ)= c1,θI(y > qθ) + c2,θ
where c1,θ = 1/fY (qθ) and c2,θ = qθ − c1,θ(1− θ).
We have E[RIF (Y, qθ)] = c1,θP (Y > qθ) + c2,θ = qθbecause E[I(Y > qθ)] = P (Y > qθ) = 1− θ.
By the Law of Iterated Expectations (LIE), i.e. because
E[RIF (Y, qθ)] = EXE[RIF (Y, qθ)|X ] ,one can specify the RIF-regression by conditioning on the covariates
(X = x):
E[RIF (Y, qθ)|X = x] = mθ(x) = c1,θP (Y > qθ|X = x) + c2,θ
Since only P (Y > qθ|X = x) depends upon X = x, a RIF-regression
amounts to regressing the binary outcome (dummy) variable I(y >
qθ) on X . Marginal effects for P (Y > qθ|X = x) translate into
marginal effects for qθ (inverse function) through the division by the
unconditional density fY (qθ).
UQPE (Average Marginal Effect): Continuous regressor
UQPE(θ) = α(θ) =∫ dE[RIF (Y, qθ)|X = x]
dx· dFX(x)
= c1,θ∫ dP (Y > qθ|X = x)
dx· dFX(x)
UQPE (Average Marginal Effect): Dummy regressor
UQPE(θ) = αD(θ) = c1,θ[P (Y > qθ|X = 1)− P (Y > qθ|X = 0)]
36

Specification and Estimation of RIF-regression
1. Need to estimate the unconditional density function of Y at em-
pirical θ-quantile qθ. Kernel density estimator:
fY (qθ) =1
N · byN∑i=1
KY
Yi − qθby
KY (.) is a kernel function and bY bandwidth.
2. RIF-OLS Regression
mθ,RIF−OLS(x) = x′γ
Corresponds to a renormalized linear probability model (LPM) re-
gressing
RIF (Yi, qθ) = I(Yi > qθ)/fY (qθ) + c2,θ
on x. The coefficient estimates γθ (except for the constant) are
equal to the coefficients in a LPM divided by the rescaling factor
fY (qθ).
UQPERIF−OLS(θ) = γ
Unconditonal quantile regression estimates typically report this
estimated UQPE.
37

3. RIF-Logit Regression
Specify P (Y > qθ|X = x) as a logit regression
mθ,RIF−Logit(x) = c1,θΛ(x′γ) + c2,θ
where P (Y > qθ|X = x) = Λ(x′γ) = exp(x′γ)/(1 + exp(x′γ)).
Run Logit regression of I(Yi > qθ) on X to obtain γ.
We have
dmθ,RIF−logit(x)
dx= c1,θ · γ · Λ(x′γ) · (1− Λ(x′γ))
Then,
UQPERIF−Logit(θ) = c1,θ · γ · 1
N
N∑i=1
Λ(x′iγ) · (1− Λ(x′iγ))
Analogous as the estimation of average marginal effects for logit
(average probability derivatives).
4. Nonparametric-RIF Regression (RIF-NP)
Specify P (Y > qθ|X = x) nonparametrically, e.g. by a polyno-
mial approximation as argument of the logit function. Then, x′γ
involves a flexible polynomial specification of the regressors. The
calculation of the marginal effects (UQPE) proceeds as above ac-
counting for the fact that a regressor variable appears more than
once in the polynomial approximation.
38

5. Quantile Regression for Duration Analysis
References:
Koenker (2005, Chapter 8.1), Fitzenberger and Wilke (2006)
Quantile Regression and Proportional Hazard Rate Model
Our focus is on linear quantile regression for duration data involving the
estimation of the following accelerated failure time model at different
quantiles θ ∈ (0, 1) for the completed duration Ti of spell i
h(Ti) = x′iβθ + ϵθi (1)
where the θ-quantile of ϵθi conditional on xi, qθ(ϵθi |xi), is zero and
h(.) is a strictly monotone transformation preserving the ordering of
the quantiles. The most popular choice is the log–transformation
h(.) = log(.) (a simple, more flexible alternative involves a Box–Cox–
transformation).
In fact, quantile regression model the conditional quantile of the re-
sponse variable
qθ(h(Ti)|xi) = x′iβθ
or, alternatively, due to the equivariance property of quantiles
qθ(Ti|xi) = h−1(x′iβθ) .
The linear specification of the quantiles allows for differences in the im-
pact of covariates xi across the conditional distribution of the response
variable. However, the coefficient is the same for a given quantile θ
irrespective of the actual value of qθ(h(Ti)|xi).
A possible problem of quantile regression is the possibility that the
coefficient estimates can be quite noisy (even more so for censored
quantile regression) and often non-monotonic across quantiles. To
39

mitigate this problem, it is possible to obtain smoothed estimates
through a minimum–distance approach. Minimize
(β − f [δ])′Ψ−1(β − f [δ]) (2)
with respect to δ, the coefficients of a smooth parametric specification
of the coefficients as a funtion of θ. β is the stacked vector of quantile
regression coefficient estimates βθ at different quantiles and Ψ is the
estimated covariance matrix of β.
The most popular parametric Cox proportional hazard model (PHM),
Kiefer (1988), is based on the concept of the hazard rate conditional
upon the covariate vector xi given by
λi(t) =fi(t)
P (Ti ≥ t)= exp(x′iβ)λ0(t) , (3)
where fi(t) is the density of Ti at duration t and λ(t) is the so called
baseline hazard rate. The hazard rate is the continuous time version
of an instantaneous transition rate, i.e. it represents approximately the
conditional probability that the spell i ends during the next period of
time after t conditional upon survival up to period t.
There is a one–to–one correspondence between the hazard rate and the
survival function, Si(t) = P (Ti ≥ t), of the duration random variable,
Si(t) = exp (− ∫ t0 λi(s)ds). A prominent example of the parametric
proportional hazard model is the Weibull model where λ0(t) = ptp−1
with a shape parameter p > 0 and the normalizing constant is included
in β. The case p = 1 is the special case of an exponential model with
a constant hazard rate differentiating the increasing (p > 1) and the
decreasing (0 < p < 1) case.
40

Within the Weibull family, the proportional hazard specification can
be reformulated as the accelerated failure time model
log(Ti) = x′iβ + ϵi (4)
where β = −p−1β and the error term ϵi follows an extreme value
distribution, Kiefer (1988, sections IV and V).
The main thrust of the above result generalizes to any PHM (3).
Define the integrated baseline hazard Λ0(t) =∫ t0 λ0(t)dt, then the fol-
lowing well known generalization of the accelerated failure time model
holds
log(Λ0(Ti)) = x′iβ + ϵi (5)
with ϵi again following an extreme value distribution and β = −β, see
Koenker and Bilias (2001) for a discussion contrasting this result to
quantile regression. Thus, the proportional hazard rate model (3) im-
plies a linear regression model for the a priori unknown transformation
h(Ti) = log(Λ0(Ti)). This regression model involves an error term
with an a priori known distribution of the error term and a constant
coefficient vector across quantiles.
From a quantile regression perspective, it is clear that these properties
of the PHM are quite restrictive. It is possible to investigate whether
these restrictions hold by testing for the constancy of the estimated
coefficients across quantiles. However, if a researcher does not apply
the correct transformation in (5), e.g. the log transformation in (4) is
used though the baseline hazard is not Weibull, then the implications
are weaker. Koenker and Geling (2001, p. 462) show that the quan-
tile regression coefficients must have the same sign if the the data is
generated by a PHM.
A strong, and quite apparent violation of the proportional hazard
assumption occurs, if for two different covariate vectors xi and xj,
41

the survival functions Si(t) and Sj(t), or equivalently the predicted
conditional quantiles, do cross. Crossing occurs, if for two quantiles
θ1 < θ2 and two values of the covariate vector xi and xj, the ranking
of the conditional quantiles changes, e.g. if qθ1(Ti|xi) < qθ1(Tj|xj)and qθ2(Ti|xi) > qθ2(Tj|xj). Our empirical application below involves
cases with such a finding. This is a valid rejection of the PHM, pro-
vided our estimated quantile regression provides a sufficient goodness–
of–fit for the conditional quantiles.
Summing up the comparison so far, while there are some problems
when using the PHM with both unobserved heterogeneity and time–
varying covariates, the PHM can take account of these issues in a
somewhat better way than quantile regression. Presently, there is also
a clear advantage of the PHM regarding the estimation of compet-
ing risk models. However, the estimation of a PHM comes at the
cost of the proportional hazard assumption which itself might not be
justifiable in the context of the application of interest. Furthermore,
quantile regression can account of right censoring by estimating cen-
sored quantile regression.
42

Estimating the Hazard Rate based on Quantile Regression
Applications of duration analysis often focus on the impact of covari-
ates on the hazard rate. Quantile regression estimate the conditional
distribution of Ti conditional on covariates and it is possible to infer
the estimated conditional hazard rates from the quantile regression
estimates.
A direct approach is to construct a density estimate from the fitted
conditional quantiles qθ(Ti|xi) = h−1(x′iβθ). A simple estimate for
the hazard rate as a linear approximation of the hazard rates between
the different θ–quantiles would be
λi(t) =(θ2 − θ1)(
h−1(x′iβθ2)− h−1(x′iβθ1))(1− 0.5(θ1 + θ2))
, (6)
where λi(t) approximates the hazard rates between the estimated θ1–
quantile and θ2–quantile.
1. The estimated conditional quantiles are piecewise constant due to
the linear programming nature of quantile regression.
2. It is not guaranteed that the estimated conditional quantiles are
ordered correctly, i.e. it can occur that qθ1(Ti|xi) > qθ2(Ti|xi)even though θ1 < θ2.
In order to avoid these problems, Machado and Portugal (2002) and
Guimaraes et al. (2004) suggest a resampling procedure (henceforth
denoted as GMP) to obtain the hazard rates implied by the esti-
mated quantile regression. Based on the same motivation as the
Machado/Mata (2005) approach introduced for decomposition analy-
sis, the main idea of the GMP is to simulate data based on the esti-
mated quantile regressions for the conditional distribution of Ti given
the covariate and to obtain estimate the density and the distribution
function directly from the simulated data.
43

GMP works as follows (possibly only simulating non–extreme quan-
tiles):
1. Generate M independent random draws θm,m = 1, ...,M from a
uniform distribution on (θl, θu), i.e. extreme quantiles with θ < θlor θ > θu are not considered here. θl and θu are chosen in light
of the type and the degree of censoring in the data. Additional
concerns relate to the fact that quantile regression estimates at
extreme quantiles are typically statistically less reliable, and that
duration data might exhibit a mass point at zero or other extreme
values. The benchmark case with the entire distribution is given
by θl = 0 and θu = 1.
2. For each θm, estimate the quantile regression model obtaining M
vectors βθm (and the transformation h(.) if part of the estimation
approach).
3. For a given value of the covariates x0, the sample of size M with
the simulated durations is obtained as,
T ∗m ≡ qθm(Ti|x0) = h−1(x′0β
θm) with m = 1, ...,M .
4. Based on the sample T ∗m,m = 1, ...,M, estimate the condi-
tional density f ∗(t|x0) and the conditional distribution function
F ∗(t|x0).
5. We suggest to estimate the hazard rate conditional on x0 in the
interval (θl, θu) by1
λ0(t) =(θu − θl)f
∗(t|x0)1− θl − (θu − θl)F ∗(t|x0)
.
Simulating the full distribution (θl = 0 and θu = 1), one obtains
the usual expression: λ0(t) = f ∗(t|x0)/[1− F ∗(t|x0)].1Our estimate differs from the version suggested in Guimaraes et al. (2004). f∗(t|x0) estimates the conditional
density in the quantile range (θl, θu), i.e. f (T = t|qθl(T |x0) < T < qθu(T |x0), x0), and the probability of theconditioning event is θu− θl = P (qθl(T |x0) < T < qθu(T |x0)|x0). By analogous reasoning, the expression in thedenominator corresponds to the unconditional survival function, see Zhang (2004) for further details.
44

This procedure (step 3) is based on the probability integral transfor-
mation theorem from elementary statistics implying T ∗m = F−1(θm)
is distributed according to the conditional distribution of Ti given x0if F (.) is the conditional distribution function and θm is uniformly
distributed on (0, 1).
The GMP procedure uses a kernel estimator for the conditional density
f ∗(t|x0) =1
M h
M∑m=1
K
t− T ∗i
h
where h is the bandwidth and K(.) the kernel function. Based on this
density estimate, the distribution function estimator is
F ∗(t|x0) =1
M
M∑m=1
Kt− T ∗
i
h
with K(u) =∫ t
aK(v) dv .
Machado and Portugal (2002) and Guimaraes, J., Machado, J.A.F.,
and Portugal, P. (2004) suggest to start the integration at zero (a =
0), probably because durations are strictly positive. However, the
kernel density estimator also puts probability mass into the region of
negative durations, which can be sizeable with a large bandwidth. Us-
ing the above procedure directly, it seems more advisable to integrate
starting from minus infinity a = −∞.
A better and simple alternative would be to use a kernel density estima-
tor based on log durations. This is possible when observed durations
are always positive, i.e. there is no mass point at zero. Then, the
estimates for density and distribution function for the duration itself
can easily be derived from the density estimates for log duration by
applying an appropriate transformation.
45

Unemployment Duration Among German Youth
Reference: Fitzenberger and Wilke (2006, long version)
The purpose is to apply censored quantile regression (CQR) to un-
employment duration among German Youth in order to illustrate the
applicability of the method. Youth unemployment is a critical issue
in the literature. The CQR results suggest that a simple proportional
hazard rate model with time–invariant covariates is not justified for
the data.
Set of covariates used for estimation based on large micro data from
IAB for German young workers:
• gender of the unemployed.
• marital status of the unemployed.
• married females. This variable absorbs possible effects of out of
the labor force periods or parental leave periods of females. A child
indicator is not used because information about the presence of
children is not available for all years.
• married females in the 1990s. This variable accounts for a possible
change in the labor force participation rate of the females in the
1990s.
• we use 5 business sector categories: agriculture, trade/services/traffic,
construction, public sector, others (mainly production). The vari-
ables are grouped according to the similarity of the results in pre-
liminary estimations.
• wage quintile 4,5. This variables indicates whether the unem-
ployed had pre–unemployment earnings in the highest 40% of the
population earnings distribution.
46

• quarterly GDP growth rate. This variable is the quarterly change
in gross GDP measured in prices of 1995. It is affected by seasonal
variation and by the business cycle in general.
• recall dummy indicating a recall to the former employer at the end
of the previous unemployment period.
• four categories for regional information: Rhineland-Palatinate/Hesse,
Baden-Wuerttemberg, Bavaria and nothern states/Saarland (ref-
erence group). These categories are also constructed according to
similarity in preliminary estimation results.
• monthly unemployment rate at the state level unemployment of-
fice districts which mainly overlap with the areas of the federal
states.
• length of tenure before unemployment: less than one year, 1-3
years (reference category), more than 3 years.
• three calender year indicators: 1981 (reference year), 1985, 1990,
1995.
• indicator for no completed apprenticeship in 1995.
• winter time indicator, which is one if the unemployment spell starts
between October and March.
Only about 8% of the unemployment spells are right censored, which
is quite a moderate degree of censoring in the context of duration
analysis.
47

Estimation Results
We estimate a log-linear version of model (1), i.e.
log(Ti) = x′iβθ + ϵθi ,
at each decile, θ = 0.1, 0.2, . . . , 0.9. The CQR model is estimated
using the BRCENS algorithm implemented in TSP. Inference on the
CQR coefficients is based on a standard bootstrap using 50 resam-
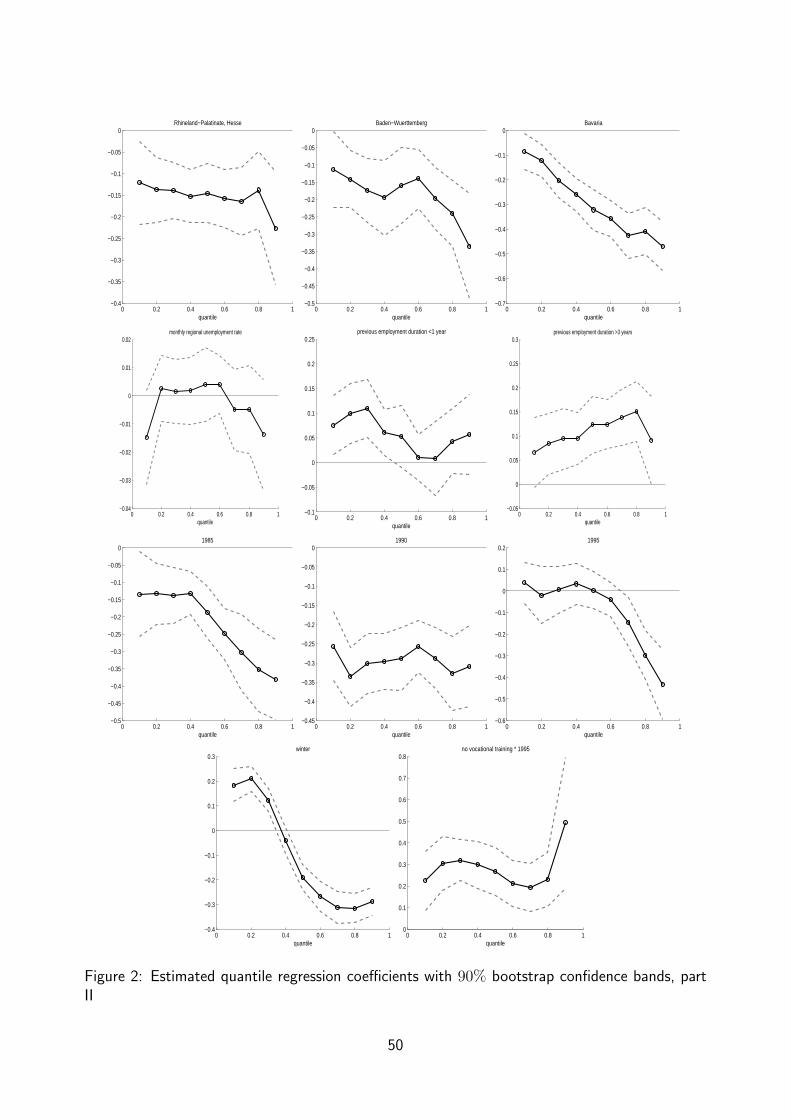
ples. The estimated coefficients are reported in figures 1 and 2. It is
evident that many of them vary significantly over the quantiles. The
magnitude or even the sign of the effect of a covariate then differs be-
tween short-term (lower quantiles) and long-term unemployed (upper
quantiles) indicating the need for a flexible estimation method. For
example, the coefficient for the covariate ”married” is not significant
for short unemployment duration but its magnitude increases continu-
ously and it is highly negative at the upper quantiles. The winter time
variable elongates short duration and shortens long duration. However,
the calender time effect has to be considered jointly with the quarterly
GDP growth rate, the calender year dummies, and the monthly unem-
ployment rate. For this reason, it is hard to interpret this result. As
outlined in the previous section, the Cox-proportional hazard model
does not allow for a change of sign of the partial derivative of the con-
ditional quantile function, as observed very clearly for the coefficient
of the winter dummy.
48

0 0.2 0.4 0.6 0.8 10
1
2
3
4
5
6
7
8
9intercept
quantile0 0.2 0.4 0.6 0.8 1
−0.7
−0.6
−0.5
−0.4
−0.3
−0.2
−0.1
0female
quantile0 0.2 0.4 0.6 0.8 1
−0.5
−0.4
−0.3
−0.2
−0.1
0
0.1
0.2married
quantile
0 0.2 0.4 0.6 0.8 10
0.2
0.4
0.6
0.8
1
1.2
1.4
1.6
1.8
2female*married
quantile0 0.2 0.4 0.6 0.8 1
−1
−0.8
−0.6
−0.4
−0.2
0
0.2
0.4female*married (1990,1995)
quantile0 0.2 0.4 0.6 0.8 1
−0.5
−0.4
−0.3
−0.2
−0.1
0
0.1
0.2agriculture
quantile
0 0.2 0.4 0.6 0.8 1−0.3
−0.25
−0.2
−0.15
−0.1
−0.05
0
0.05trade, services, traffic
quantile0 0.2 0.4 0.6 0.8 1
−0.7
−0.6
−0.5
−0.4
−0.3
−0.2
−0.1
0construction
quantile0 0.2 0.4 0.6 0.8 1
−0.5
−0.4
−0.3
−0.2
−0.1
0
0.1
0.2
0.3
0.4public sector
quantile
0 0.2 0.4 0.6 0.8 1−0.4
−0.35
−0.3
−0.25
−0.2
−0.15
−0.1
−0.05
0
0.05wage quintile 4,5
quantile0 0.2 0.4 0.6 0.8 1
−1
0
1
2
3
4
5
6GDP growth
quantile0 0.2 0.4 0.6 0.8 1
−0.9
−0.8
−0.7
−0.6
−0.5
−0.4
−0.3
−0.2
−0.1
0recall
quantile
Figure 1: Estimated quantile regression coefficients with 90% bootstrap confidence bands, part I
49
0 0.2 0.4 0.6 0.8 1−0.4
−0.35
−0.3
−0.25
−0.2
−0.15
−0.1
−0.05
0Rhineland−Palatinate, Hesse
quantile0 0.2 0.4 0.6 0.8 1
−0.5
−0.45
−0.4
−0.35
−0.3
−0.25
−0.2
−0.15
−0.1
−0.05
0Baden−Wuerttemberg
quantile0 0.2 0.4 0.6 0.8 1
−0.7
−0.6
−0.5
−0.4
−0.3
−0.2
−0.1
0Bavaria
quantile
0 0.2 0.4 0.6 0.8 1−0.04
−0.03
−0.02
−0.01
0
0.01
0.02monthly regional unemployment rate
quantile0 0.2 0.4 0.6 0.8 1
−0.1
−0.05
0
0.05
0.1
0.15
0.2
0.25previous employment duration <1 year
quantile
0 0.2 0.4 0.6 0.8 1−0.05
0
0.05
0.1
0.15
0.2
0.25
0.3previous employment duration >3 years
quantile
0 0.2 0.4 0.6 0.8 1−0.5
−0.45
−0.4
−0.35
−0.3
−0.25
−0.2
−0.15
−0.1
−0.05
01985
quantile0 0.2 0.4 0.6 0.8 1
−0.45
−0.4
−0.35
−0.3
−0.25
−0.2
−0.15
−0.1
−0.05
01990
quantile0 0.2 0.4 0.6 0.8 1
−0.6
−0.5
−0.4
−0.3
−0.2
−0.1
0
0.1
0.21995
quantile
0 0.2 0.4 0.6 0.8 1−0.4
−0.3
−0.2
−0.1
0
0.1
0.2
0.3winter
quantile0 0.2 0.4 0.6 0.8 1
0
0.1
0.2
0.3
0.4
0.5
0.6
0.7
0.8no vocational training * 1995
quantile
Figure 2: Estimated quantile regression coefficients with 90% bootstrap confidence bands, partII
50

0 100 200 300 400 500 600 700 8001
1.5
2
2.5
3
3.5
4
4.5
5
5.5x 10
−3
days unemployed
unmarriedmarried
0 100 200 300 400 500 600 700 8001
1.5
2
2.5
3
3.5
4
4.5
5
5.5x 10
−3
days unemployed
summerwinter
Figure 3: Estimated conditional hazard rates evaluated at sample means of the other regressors.
We also estimate hazard functions using the GMP resampling proce-
dure. Figure 3 presents different hazard rate estimates based on this
methodology. For the reasons discussed above, we base our hazard
rate estimations on nonparametric density estimates for the log du-
ration. The number of resamples is 500. Since almost 10% of our
observations are right censored, we draw θm from the uniform distri-
bution on (θl, θu) = (0, 0.9). Both plots in figure 3 show that the
estimated hazard rates are non–proportional over the duration time.
The proportional hazard assumption is apparently violated in this ap-
plication.
51

6. Quantile Regression for Panel Data
References:
Koenker (2005, Chapter 8.7), Abrevaya/Dahl (2008)
Panel data (i=1,...,N; t=1,...,T)
yit = x′itβ + αi + uit
where αi individual specific effect.
Random Effects estimation (GLS):
βGLS = (X ′Ω−1X)−1X ′Ω−1Y
where T ×T -matrix, Ω = diag(Ω1,Ω2, ...,ΩN), Ωi = σ2αιT ι
′T +σ2
uIT ,
IT is T × T identity matrix, and ιT = (1, ..., 1)′.
βGLS solves
min(α,β)∑i,t(1/σ2
u)(yit − xitβ − αi)2 + (1/σ2
α)∑iα2i
where α = (α1, ..., αN).
Fixed Effects estimation (FE): Within Regression
yit − yi = (xit − xi)′βFE + uit − ui
where yi, xi, and ui individual specific means.
52

Quantile Regression with Penalized Fixed Effects
(α(θ), β(θ)) = argminα,β∑i,tρθ(yit − x′itβ − αi) + λ
∑i|αi|
where αi(θ) is an individual-specific shifter of the conditional θ-quantile
of yit given xit and αi.
l1- penalty: λ∑i |αi| implies shrinkage towards zero, linear program-
ming techniques can be applied
Uniform shifter αi across k quantiles (θ1, ..., θk) (location-shift fixed
effects):
(α, β(θ)) = argminα,β
q∑k=1
∑i,tρθk(yit − x′itβ(θk)− αi) + λ
∑i|αi|
Choice of λ for median regression: If σu and σα were known, λ could
be chosen as σu/σα in analogy to random effects GLS estimation.
Estimator does not overcome the incidental parameter problem!
Alternatives:
i) Two-step estimator using OLS FE-estimates of αi:
1. Estimate FE-OLS estimator βFE and calculate estimated individ-
ual specific effect αi = yi − x′iβFE.
2. Run pooled quantile regression of yit−αi on xit to obtain quantile
regression estimate for βθ
ii) Chamberlain-Mundlak type quantile regression estimator (Abre-
vaya/Dahl 2008):
yit = x′itβ(θ) + x′iγ + uit
where x′iγ is control function for individual specific effect. This esti-
mator could be combined with penalized fixed effects estimator.
53